the character of residential cooktop fires
TRANSCRIPT

NIST Technical Note 2133
The Character of Residential Cooktop Fires
Yue Hu Jian Chen
Zhigang Wang KY Lee
Matthew Bundy Marco Fernandez Anthony Hamins
This publication is available free of charge from: https://doi.org/10.6028/NIST.TN.2133

NIST Technical Note 2133
The Character of Residential Cooktop Fires
Yue Hu Zhigang Wang
KY Lee Matthew Bundy
Marco Fernandez Anthony Hamins
Fire Research Division Engineering Laboratory
National Institute of Standards and Technology Gaithersburg, MD 20899
Jian Chen Center for Offshore Engineering and Safety Technology
China University of Petroleum (East China) Qingdao 266580, China
This publication is available free of charge from: https://doi.org/10.6028/NIST.TN.2133
January 2021
U.S. Department of Commerce Wilbur L. Ross, Jr., Secretary
National Institute of Standards and Technology Walter Copan, NIST Director and Undersecretary of Commerce for Standards and Technology
Certain commercial entities, equipment, or materials may be identified in this document in order to describe an experimental procedure or concept adequately.
Such identification is not intended to imply recommendation or endorsement by the National Institute of Standards and Technology, nor is it intended to imply that the entities, materials, or equipment are necessarily the best available for the purpose.
National Institute of Standards and Technology Technical Note 2133 Natl. Inst. Stand. Technol. Tech. Note 2133, 43 pages (January 2021)
CODEN: NTNOEF
This publication is available free of charge from: https://doi.org/10.6028/NIST.TN.2133

i
This publication is available free of charge from: https://doi.org/10.6028/N
IST.TN.2133
Table of Contents Abstract ........................................................................................................................................................................ ii
1. Introduction ........................................................................................................................................................... 1
2. Energy Balance ...................................................................................................................................................... 2
3. Experimental Methods ........................................................................................................................................... 3
3.1 Experimental Set-up ............................................................................................................................................ 3
3.2 Experimental Conditions and Procedure ............................................................................................................. 6
3.3 Parameter Analysis .............................................................................................................................................. 7
4. Results and Discussion ........................................................................................................................................ 10
4.1 Combustion Characteristics of Cooking Oil Fires ............................................................................................. 10
4.1.1 Comparison with Traditional Pool Fires ..................................................................................................... 10
4.1.2 The Effect of Initial Fuel Mass ................................................................................................................... 14
4.1.3 The Effect of Pan Diameter ........................................................................................................................ 19
4.2 Pre-combustion Extinction Coefficient and Aerosol Production ....................................................................... 26
5. Summary and Conclusions .................................................................................................................................. 29
6. References ............................................................................................................................................................... 31
7. Appendix ................................................................................................................................................................ 33
7.1 Uncertainty Analysis ......................................................................................................................................... 33
7.1.1 Uncertainty of the Heat Release Rate ......................................................................................................... 33
7.1.2 Uncertainty of the Total Radiative Emission (Q̇r) due to Heat Flux Uncertainty ...................................... 35
7.1.3 Uncertainty of the Radiative Fraction and Combustion Efficiency ............................................................ 35
7.1.4 Uncertainty of the Light-Extinction Coefficient ......................................................................................... 36
7.1.5 Uncertainty of Gas and Aerosol Emissions ................................................................................................ 37

ii
This publication is available free of charge from: https://doi.org/10.6028/N
IST.TN.2133
ABSTRACT
A series of experiments was conducted to investigate the global pre-combustion and combustion properties of corn oil heated in pans from 9.7 cm to 26 cm diameter by a residential electric-coil element cooktop. To better appreciate the hazard of auto-ignited corn oil cooktop fires, torch-ignited gasoline, heptane and corn oil experiments were also conducted in the same configuration except without the heating element energized. This second configuration represents common pool fires with energy feedback to the fuel coming only from the fire above the burning pool. Heating the oil on a typical electric cooktop leads to gradual release of an aerosol cloud above the pan followed by auto-ignition. The evolution of the light-extinction coefficient before auto-ignition is measured and shown to be related to the pan diameter and initial fuel mass. Continued heating of the oil on the cooktop as may happen during unattended cooking, leads to enhanced vaporization of the oil and rapidly growing fires with relatively large peak heat release rates.
The heated, burning, corn oil can boil-over, a phenomenon in which the oil bulk density decreases until it flows over the pan’s sides. For a given pan and heating rate, the occurrence of boil-over depends on many parameters including the initial fuel mass. More initial fuel mass leads to a higher fire hazard. Boil-over was observed after auto-ignition of the 150 g corn oil fire in the 9.7 cm pan and led to (1) a peak heat release rate of almost 50 kW and (2) peak flame heights as large as 0.85 m. Fires of this size pose a significant hazard and can ignite nearby flammable materials including cellulosic cabinetry, which is often located above the cooktop. Such a configuration provides a mechanism for fire growth. The fire heat release rate of auto-ignited corn oil fires is higher than traditional, torch-ignited, pool fires burning hydrocarbons such as gasoline. For example, 50 g of corn oil undergoing auto-ignition and continued heating in a 9.7 cm pan sitting on an electric, coil element, cooktop had a larger peak heat release rate by factors of 3.1, 2.1 and 5.4, respectively, as compared to 50 g of gasoline, heptane, and corn oil ignited by a torch from above in the same pan. This is a surprising result, which helps gauge the severity of the hazard associated with cooking oil fires during unattended cooking.
As expected, the fire hazard is most severe for the larger pans. Larger pan diameters give rise to larger heat release rates, flame heights, production of CO, CO2, and soot, and radiative emission to the surroundings of auto-ignited corn oil fires – even larger than gasoline fires regardless of the pan diameter. For the 26 cm heated, corn oil fires with an initial fuel depth of 7 mm, the peak flame height and heat release rate were almost 1.4 m and 110 kW, which are 1.6 and 2.8 times larger than the gasoline fires, respectively. The CO and soot yields, and the CO/CO2 ratio decrease with pan diameter in accord with the slight increasing combustion efficiency for the gasoline and the heated corn oil fires. The average value of the radiative fraction for the corn oil and gasoline fires was 0.44 ± 22% and 0.37 ± 17 %, respectively. In addition, the average specific extinction area (SEA) values of burning corn oil and gasoline are 0.63 m2/g ± 22 % and 0.65 m2/g ± 45 %, respectively. The CO yield after ignition is directly proportional to the SEA of the burning fuels with a slope of 0.034 g/m2.
Keywords: cooktop fires; corn oil; gasoline; kitchen fires; pool fires.

1
This publication is available free of charge from: https://doi.org/10.6028/N
IST.TN.2133
1. INTRODUCTION
Cooking fires can be hazardous. During the period from 2013 to 2017, cooking equipment was involved in 49 % of all reported home fires, 22% of home fire fatalities, and 45% of reported home fire injuries in the USA with U.S. Fire Departments responding to an average of 470 home cooking fires per day during this period or about 173,000 annually [1]. And there were 23 % more annual cooking equipment fires in the 2013 -2017 period than in 1980-1984 [1]. This is an alarming statistic, considering that the total number of reported fires and civilian fatalities has dropped by a factor of 2 since 1980 [2]. Cooking fires remain one of the outstanding, residential, fire safety problems.
Ranges, or cooktops, are associated with most of the cooking fires losses [1]. Electric cooktops are associated with a higher risk of cooking fires compared to gas cooktops. Although 60% of households use electric cooktops, 79% of cooktops involved in reported cooking fires were powered by electricity [1]. Unattended equipment was the leading cause of cooking fire ignitions, accounting for 31 % of all cooking fires and 44 % of cooking related civilian fatalities [1].
A recent report on cooktop fires demonstrated that there are several challenging aspects of these fires [3]. First, they are difficult to suppress without deploying a significant amount of agent. Second, without sufficient cooling, fires heated to auto-ignition that are suppressed can readily re-light. Third, they are particularly hazardous in terms of fire size and growth [3]. This last point is consistent with NFPA analysis of National Fire Incident Reporting System (NFIRS) data that shows that for about 30 % of fires for which an automatic extinguishing system (AES) was present, the fires were large enough to cause its activation [4]. Zone fire model calculations suggest that for a typical residential sprinkler system to activate in a 2.7 m x 3.7 m (9 ft x 12 ft) kitchen, a fire must be greater than about 300 kW [5]. A fire of this size can occur once a cooktop fire ignites nearby flammable materials such as cellulosic cabinetry, which may be located above a cooktop. Such a configuration provides a mechanism for rapid fire growth.
The reliability and performance of alarms and detection systems are related challenges of the cooking fire problem. In most U.S. homes, smoke alarms are installed to warn of the onset of a fire [6]. Reliable, early detection of pre-fire conditions may be a superior strategy. Some studies have investigated the performance characteristics of multiple sensors compared to single sensors for detection of pre-ignition conditions in a kitchen[7-9]. A number of studies considered setting alarm thresholds in terms of CO concentrations [7, 10] and others investigated light obscuration over a path length [8, 11] to evaluate alarm effectiveness for pre-ignition conditions. To support the development of effective alarms for cooking oil fires and to reduce cooking nuisance alarms, it may be of interest to quantify the light obscuration of the aerosol cloud of vaporizing oil formed over heated cooking oil moments before auto-ignition.
A cooking oil fire in a pan can be thought of as a “pool” fire, a fundamental type of combustion phenomena whose fire hazard is directly related to its mass burning rate and indirectly related to the fuel type and pool diameter [12-14]. The detailed characteristics of cooking oil fires can help categorize their hazard for fire safety engineering design. There are, however, very limited studies on the characteristics of cooking oil fires. Koseki et al. [15] measured burning characteristics of several vegetable oils. He reports that the burning of vegetable oils is similar to that of lubricating oils and hydrocarbon fuels. Chow reports on open kitchen fire experiments under an oxygen consumption calorimeter [16]. The measured heat flux and heat release rate were used to evaluate the performance of fire suppression systems. Hamins

2
This publication is available free of charge from: https://doi.org/10.6028/N
IST.TN.2133
et al. [17] conducted cooking fire experiments using free-standing stoves in a full-scale residential kitchen. Burning characteristics, such as pan temperature, heat flux and heat release rate were measured. It concluded that the auto-ignition could take place after continuous heating and the fire could rapidly spread and grow within a furnished kitchen compartment. More recently, Spearpoint et al. modelled the thermal radiation from kitchen fires using analytic calculation methods - a horizontal point source model was verified to provide a robust approach for calculation of thermal radiation [18].
In this study, the pre-combustion and combustion characteristics of cooking fires in different diameter pans heated on a cooktop in a well-ventilated quiescent environment are considered. The fires were characterized by conducting measurements of the mass loss, heat release rate, pan bottom temperature, heat flux to the surroundings, CO and soot yields, CO/CO2 and flame height. The measurements using cooking oil heated by a cooktop are contrasted to results from experiments in which the various fuels (cooking oil, n-heptane, and gasoline) burn as simple pool fires without additional heating from the bottom of the pan. In addition, the effect of initial corn oil mass and pan diameter on the development of a cooktop fire are studied. Heating of the corn oil during the cooking process leads to the generation of a plume of aerosolized oil vapor before autoignition occurs. During this period, light extinction measurements were conducted with the effects of initial corn oil mass and pan diameter considered. The paper is broken into several parts. In Section 2, the energetics of a pool fire are considered. In Section 3, the experimental set-up is described, and the conditions and procedure are discussed. The results are presented and discussed in Section 4. The results are summarized in Section 5. References are listed in Section 6. In Section 7, details of the uncertainty analysis are presented.
2. ENERGY BALANCE
The heat and mass transfer in a pool fire are coupled, and the mass burning rate (�̇�𝑚) of a pool fire depends on the total heat feedback to the pool surface (�̇�𝑄𝑠𝑠). As a fire becomes larger, �̇�𝑚 and �̇�𝑄𝑠𝑠 increase; and as �̇�𝑄𝑠𝑠 increases, the mass evaporation rate increases and the fire becomes larger, forming a positive feedback loop. In steady state, the total heat feedback �̇�𝑄𝑠𝑠 can be approximated as the amount of energy required to heat and vaporize the fuel, assuming negligible heat losses:
�̇�𝑄𝑠𝑠 = �̇�𝑚 �𝐻𝐻𝑣𝑣 + 𝐶𝐶𝑝𝑝 [𝑇𝑇𝑠𝑠 − 𝑇𝑇𝑜𝑜]� = �̇�𝑚 𝐻𝐻𝑔𝑔 (1)
where 𝐻𝐻𝑣𝑣 is the latent heat of vaporization of the liquid fuel at its boiling point, Cp is the average liquid heat capacity between 𝑇𝑇𝑠𝑠, the temperature of the fuel surface, and 𝑇𝑇𝑜𝑜, the initial fuel temperature, and 𝐻𝐻𝑔𝑔 is the effective latent heat of gasification. The total or idealized heat release rate of a fire (�̇�𝑄) is defined as:
�̇�𝑄 = �̇�𝑚 𝐻𝐻𝑐𝑐 (2)
where �̇�𝑚 is the mass burning rate of the fuel and 𝐻𝐻𝑐𝑐 is the fuel’s net heat of combustion. The heat release rate characterizes the rate at which a fire releases its chemical energy. Its peak value occurs at the time when the fire is burning most intensely. The peak heat release rate is the most important variable characterizing the flammability of a material and the related fire hazard [19]. The peak heat release rate controls fire spread and growth and can be thought of as an indicator of fire severity.

3
This publication is available free of charge from: https://doi.org/10.6028/N
IST.TN.2133
Assuming no heat losses in a steadily burning pool, the heat feedback fraction (𝜒𝜒𝑠𝑠) is the fraction of a fire’s energy transported to the fuel surface (needed to vaporize the fuel), which is equal to the ratio of �̇�𝑄𝑠𝑠 to �̇�𝑄, or the ratio of Eq. 1 to Eq. 2:
𝜒𝜒𝑠𝑠 = �̇�𝑄𝑠𝑠/�̇�𝑄 = 𝐻𝐻𝑔𝑔/𝐻𝐻𝑐𝑐 = 1/B (3)
The parameter 𝜒𝜒𝑠𝑠 is sometimes referred to as the reciprocal of the diffusive transfer B number [12]. The B number has been shown to be proportional to the mass burning flux for large-scale hydrocarbon pool fires burning many fuel types [20].
The heat transfer between the cooktop heating element and the pan is complex. Although the power of the electrical heating element is controlled by the cooktop settings, heat transfer to the pan depends on several factors including the details of the geometric configuration of the pan-heating element system. For a cooktop fire, the energy source term accounting for the heat transferred from the cooktop to the fuel pan must be considered. For a pan directly placed on an electric coil heater, heat transfer from the heating element to the pan (�̇�𝑄𝑏𝑏) is dominated by conduction, so Eq. 1 becomes:
�̇�𝑚𝐻𝐻𝑔𝑔 = �̇�𝑄𝑏𝑏 + �̇�𝑄𝑠𝑠 (4)
Two phases should be considered: before and after auto-ignition. Before ignition, �̇�𝑄𝑠𝑠 = 0. After ignition, the relative size of �̇�𝑄𝑏𝑏 to �̇�𝑄𝑠𝑠 dictates the behavior of the system. For �̇�𝑄𝑏𝑏 relatively small compared to �̇�𝑄𝑠𝑠, a normal pool fire is generated. For �̇�𝑄𝑏𝑏 relatively large, �̇�𝑚 is controlled by the magnitude of the imposed �̇�𝑄𝑏𝑏. For �̇�𝑄𝑏𝑏 on the same order of magnitude as �̇�𝑄𝑠𝑠, �̇�𝑚 will increase. �̇�𝑄𝑠𝑠 will also be affected as increased “blowing” of fuel mass at the burner rim diminishes convective heat feedback from the fire to the pool, while a larger �̇�𝑚 and associated heat release rate leads to larger radiative heat feedback to the fuel surface [21, 22].
3. EXPERIMENTAL METHODS
3.1 Experimental Set-up
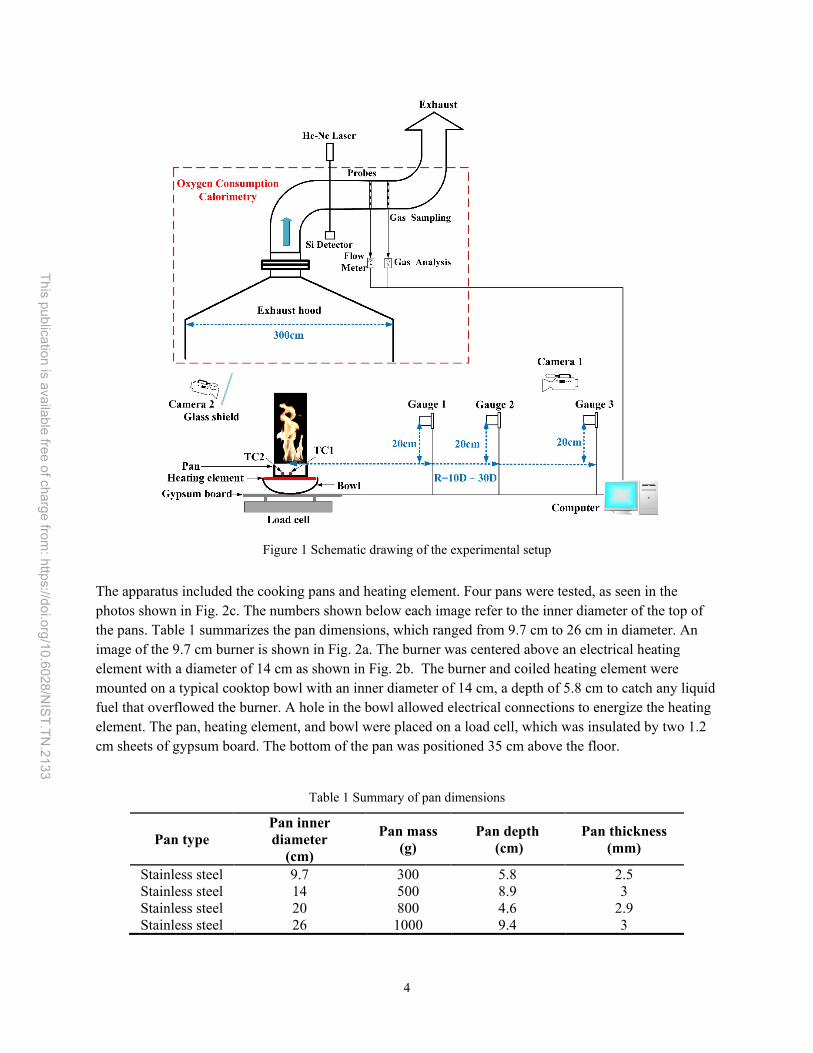
The cooktop experiments were conducted in a quiescent environment. The pan was placed under the center of the square exhaust hood (3 m x 3 m, 0.5 MW) [23], with the exhaust flow maintained at about 1 kg/s. The exhaust hood was surrounded by a double layer wire mesh screen to reduce the interference of ambient currents on the flow field. A schematic of the experimental setup is shown in Fig. 1, which was composed of the cooking apparatus and the instrumentation used to characterize the fires.
4
This publication is available free of charge from: https://doi.org/10.6028/N
IST.TN.2133
Figure 1 Schematic drawing of the experimental setup
The apparatus included the cooking pans and heating element. Four pans were tested, as seen in the photos shown in Fig. 2c. The numbers shown below each image refer to the inner diameter of the top of the pans. Table 1 summarizes the pan dimensions, which ranged from 9.7 cm to 26 cm in diameter. An image of the 9.7 cm burner is shown in Fig. 2a. The burner was centered above an electrical heating element with a diameter of 14 cm as shown in Fig. 2b. The burner and coiled heating element were mounted on a typical cooktop bowl with an inner diameter of 14 cm, a depth of 5.8 cm to catch any liquid fuel that overflowed the burner. A hole in the bowl allowed electrical connections to energize the heating element. The pan, heating element, and bowl were placed on a load cell, which was insulated by two 1.2 cm sheets of gypsum board. The bottom of the pan was positioned 35 cm above the floor.
Table 1 Summary of pan dimensions
Pan type Pan inner diameter
(cm)
Pan mass (g)
Pan depth (cm)
Pan thickness (mm)
Stainless steel 9.7 300 5.8 2.5 Stainless steel 14 500 8.9 3 Stainless steel 20 800 4.6 2.9 Stainless steel 26 1000 9.4 3

5
This publication is available free of charge from: https://doi.org/10.6028/N
IST.TN.2133
Figure 2 (a) Image of the 9.7 cm inner diameter pan placed on the electric coil heating element and catch-bowl; (b)
the electrical coil heating element; (c) photos of pans with different diameters (see Table 1).
The measurement apparatus included (1) a precision load cell to monitor the changing fuel mass in the pan, (2) the oxygen consumption calorimetry system extracting gas samples from the exhaust duct, (3) a light-extinction meter, (4) three total heat flux gauges, and (5) two thermocouples monitoring the temperature of the bottom of the inside of the pan. A data acquisition system recorded the instrument signals at a rate of 1 Hz.
Two cameras were used in the experiment. A single lens reflex digital camera (1080 × 1920 resolution, 60 frames per second) was used to record the fire’s character, which was positioned about 1.6 m from the burner and 0.7 m above the floor. A second digital camera (1080 ×1920 resolution, 30 frames per second) was located above the burner to record the fuel surface and any boiling phenomena. The entire experiment was recorded including the period before ignition that involved liquid heating, the moment of ignition, fire growth, and fuel burn-out.
The 14 cm diameter, three-turn, electric coil heating element was powered by 240 V single phase electrical service. The power applied to energize the electric coil heating element at its highest setting was 1.19 kW ± 0.03 kW as measured by an electric power meter.
The fuel mass loss rate due to evaporation and burning was measured using a load cell that was positioned under the bowl-heating element assembly. Based on repeated calibration measurements using standard weights, the standard uncertainty in the load cell measurement was 0.1 g.

6
This publication is available free of charge from: https://doi.org/10.6028/N
IST.TN.2133
Two thin (24 gauge), bare-bead, Type K thermocouples were used to monitor the pan bottom temperature. The thermocouples were peened to the center and 2.5 cm off-center on the pan’s inside bottom. The standard uncertainty of the temperature measurement was 2 °C, as given by the manufacturer [24].
The heat release rate was determined using oxygen consumption calorimetry, which involved the measurement of many quantities [23]. The response time of the system is such that it can accurately resolve dynamic heat release rate events of about 15 s or more. The combined uncertainty (95 % confidence level) in the heat release rate measurement system was estimated as 8 % for 1 kW to 60 kW fires. This value was based on calibrations and repeat measurements using well-characterized natural gas [23]. Oxygen consumption calorimetric analysis requires the fuel specific heat of combustion per unit oxygen, which was measured either by a testing lab or taken from the literature as discussed below.
The light-extinction coefficient was measured using a He-Ne laser with a laser stabilizer, a silicon photodiode detector, and associated optics [25]. Measurements of the light-extinction coefficient are based on Bouguer's Law, which relates the ratio of the transmitted and incident light intensities to the pathlength through the smoke. The combined expanded uncertainty (95% confidence level ) of the light-extinction coefficient is expected to be 3.2% [25].
The calibrated water-cooled Gardon type heat flux gauges were used to measure the local time varying heat flux emitted by the fire. The gauge had a wide view angle (150°) and was coated with a high emissivity paint with a flat spectral response. The gauges had a time response of approximately 2 s [26]. The gauges were directed towards the fire and positioned 20 cm above the pan’s rim and about 10 to 30 times the pan diameter (D) in the horizontal direction (from the pan center), respectively. The heat flux gauges were calibrated by the manufacturer with its uncertainty estimated as 7 % based on an international round robin considering heat flux gauge uncertainty [27].
3.2 Experimental Conditions and Procedure
Table 2 summarizes the experimental conditions and lists the liquid fuel type, initial fuel mass, initial fuel depth, state of the heating element, and method of ignition. In the experiments, corn oil, gasoline, and n-heptane were tested. The uncertainties of the initial mass and initial fuel depth are less than 5% for all the experimental conditions. Thermophysical properties of the liquids are shown in Table 3, including the elemental composition of the fuel, its liquid density (ρ), boiling point (Tb), heat of combustion (Hc), and the mass-based stoichiometric ratio of oxygen to fuel (ro). Elemental composition of the gasoline (octane rating of 87) and corn oil, and the heat of combustion of the corn oil were determined by a testing laboratory [28]. It is interesting to note that the heat of combustion (and room temperature liquid density) of corn oil is about 15 % less than that of gasoline and heptane. The chemical formula of corn oil has a non-trivial amount of O atoms, whereas gasoline and heptane are essentially hydrocarbons. Gasoline and corn oil may have some very small amount of nitrogen atoms, but the value was below the limits of detection in the analysis [28]. For liquid pool fires burning pure fuels such as n-heptane, the surface temperature is observed to be near the boiling point. For burning multi-component liquids such as vegetable oil or gasoline, there is no single temperature that characterizes boiling. The experimental conditions were selected to explore the effects of initial fuel mass and pan diameter on the character of the fires. The pan diameter is reported as the inner pan diameter measured at the top of the rim.
For corn oil, ignition was accomplished with a torch (from the top) with the heating element off and by auto-ignition with the heating element on. The experimental procedure involved the following steps. The pan was centered on the burner. The data acquisition system was initiated and background recorded.

7
This publication is available free of charge from: https://doi.org/10.6028/N
IST.TN.2133
Then, oil was introduced into the pan and initial mass noted. In the experiment, the corn oil, gasoline and heptane were heated from above, the cooktop’s coil heating element was off, and the pool fire was ignited by a small propane torch. The fire terminated when the fuel was consumed. The measurements were repeated at least twice. For gasoline, repeat tests were conducted with three different batches of commercial gasoline.
Table 2 Summary of experimental conditions (uncertainty with 95% confidence level)
Number Liquid Pan diameter (cm)
Initial fuel mass (g)
Initial fuel depth (cm) Heating element Ignition
1 Corn oil 9.7 49.9±1.2% 0.75 ±1.3% OFF Torch 2 n-heptane 9.7 50.2±3.1% 0.75±2.7% OFF Torch 3 Gasoline 9.7 49.9±2% 0.75±2.7% OFF Torch 4 Corn oil 9.7 20.2±3.0% 0.30±3.3% ON Auto 5 Corn oil 9.7 50.3±0.8% 0.76±1.3% ON Auto 6 Corn oil 9.7 101.5±4.6% 1.53±4.6% ON Auto 7 Corn oil 9.7 150.5±0.7% 2.26±0.9% ON Auto 8 Corn oil 14 100.1±0.4% 0.72±0.4% ON Auto 9 Gasoline 14 99.9±0.3% 0.72±0.4% OFF Torch
10 Corn oil 20 50.0±0.2% 0.34 ± 0.5% ON Auto 11 Corn oil 20 199.7±0.2% 1.22 ± 0.6% ON Auto 12 Gasoline 20 49.1±0.3% 0.33 ± 0.8% OFF Torch 13 Gasoline 20 199.8±1.0% 1.22 ± 2.8% OFF Torch 14 Corn oil 26 50.4±2.6% 0.11±2.7% ON Auto 15 Corn oil 26 339.4±1.0% 0.71±1.4% ON Auto 16 Gasoline 26 50.5±0.5% 0.11±1.4% OFF Torch 17 Gasoline 26 338.2±1.0% 0.71±1.4% OFF Torch
Table 3 Thermophysical fuel parameters
Fuel Empirical Chemical Formula
𝝆𝝆 (g/cm3)
MW (g/mol)
Tb (oC)
Hc (kJ/g) ro Hc/ro
(kJ/g O2) Corn oil*[28-30] CH1.76O0.12 0.89 * * 37.4* 2.85* 13.1 n-heptane*[31] C7H16 0.68 100 98.4 44.6 3.53 12.6 Gasoline*[28, 31] CH2.05 0.68 * * 44.1 3.44* 12.8
* Corn oil and gasoline are multicomponent fuel mixtures;
3.3 Parameter Analysis
Based on the measurements, the peak heat release rate, peak heat flux, peak flame height, radiative fraction, combustion efficiency, CO/CO2, and CO and soot yields were calculated. And the combined expanded uncertainties of these parameters are estimated in the Appendix.
The heat release rate is a simple representation of a fire hazard since the heat release rate controls fire growth and spread. Its peak value represents the most dangerous conditions, including the tallest flames and largest radiative emission to the surroundings during the evolution of a fire.

8
This publication is available free of charge from: https://doi.org/10.6028/N
IST.TN.2133
The portion of the flame’s energy that is radiated to both the surroundings and the fuel surface is denoted as �̇�𝑄𝑟𝑟. The value of �̇�𝑄𝑟𝑟 can be determined from the local heat flux (�̇�𝑞”) measured at a sufficient distance from the fire such that the radiation can be regarded as a point source:
�̇�𝑄𝑟𝑟 = 4π 𝑅𝑅2 �̇�𝑞” (5)
Modak [32] suggests that a distance of 5 times the diameter of the fire is adequate to use a single point location estimate to determine the total radiative flux emitted by a fire (�̇�𝑄𝑟𝑟), assuming isotropy. Here, �̇�𝑄𝑟𝑟 is confirmed using 3 gauges located at different distances from the fire.
The video recorded by camera 1 (see Fig. 1) was analyzed using MATLAB to calculate the transient flame height. For the turbulent flames considered here, the instantaneous flame height significantly changes with time as shown in Fig. 5. The peak flame height was defined as the maximum value of the mean flame height during a running average over 1s (about 5 pool fire puffing cycles), while the error bars represents the standard variance over the 1 s period.
The time-averaged radiative fraction, 𝜒𝜒𝑟𝑟, is defined as:
𝜒𝜒𝑟𝑟 =∫ �̇�𝑄𝑟𝑟𝑡𝑡𝑒𝑒𝑡𝑡0
𝑑𝑑𝑑𝑑
Δ𝑚𝑚 𝐻𝐻𝑐𝑐 (6)
where 𝑡𝑡0 is the time of flaming ignition, 𝑡𝑡𝑒𝑒 is the fuel burn-out time, Δ𝑚𝑚 is total fuel mass consumed during flaming, and Hc is defined in Eq. 2. The fuel mass loss curve was smoothed using a 5 s moving point average. The time-averaged, combustion efficiency is influenced by the fuel type and fire size. It’s defined as the ratio of the actual energy released to the idealized energy release:
𝜒𝜒𝑎𝑎 =∫ �̇�𝑄𝑎𝑎 𝑑𝑑𝑑𝑑𝑡𝑡𝑒𝑒𝑡𝑡0Δ𝑚𝑚 𝐻𝐻𝑐𝑐
(7)
where �̇�𝑄𝑎𝑎 is the measured time-varying actual heat release rate, using oxygen consumption calorimetry. The CO yield, 𝑌𝑌𝐶𝐶𝐶𝐶, is equal to the ratio of the total CO produced to the total fuel mass consumed, as shown in Equation (8). The total CO produced, Δ𝐶𝐶𝐶𝐶 , was determined from the product of the measured CO concentration and the volume flow rate of the exhaust as presented in Equations (9) and (10):
𝑌𝑌𝐶𝐶𝐶𝐶 = ∆𝐶𝐶𝐶𝐶∆𝑚𝑚
=∫ �̇�𝑚𝐶𝐶𝐶𝐶 𝑑𝑑𝑑𝑑𝑡𝑡𝑒𝑒𝑡𝑡0Δ𝑚𝑚
(8) with �̇�𝑚𝐶𝐶𝐶𝐶 = 𝑋𝑋𝐶𝐶𝐶𝐶 ∙ �̇�𝑉𝑒𝑒 ∙
𝑀𝑀𝑀𝑀𝐶𝐶𝐶𝐶𝑉𝑉𝑚𝑚𝑜𝑜𝑉𝑉𝐶𝐶𝐶𝐶
(9) 𝑉𝑉𝑚𝑚𝑉𝑉𝑉𝑉𝐶𝐶𝐶𝐶 = 𝑅𝑅𝑇𝑇𝐷𝐷
𝑃𝑃𝐷𝐷 (10)
where 𝑌𝑌𝐶𝐶𝐶𝐶 is the mass-based CO yield (kg/kg) of the fire, 𝑋𝑋𝐶𝐶𝐶𝐶 is the volume fraction of CO in the exhaust, �̇�𝑉𝑒𝑒 is the volumetric flow rate of the exhaust (m3/s), �̇�𝑚𝐶𝐶𝐶𝐶 is the mass generation of CO by the fire (g/s), and 𝑉𝑉𝑚𝑚𝑉𝑉𝑉𝑉𝐶𝐶𝐶𝐶 is the volume displaced by one mole of CO at the temperature (𝑇𝑇𝐷𝐷) and pressure (𝑃𝑃𝐷𝐷) in the duct where gases, such as CO, are extracted as part of the measurement (nominally 310 K and 1 atm). Similarly, the CO2 production, Δ𝐶𝐶𝐶𝐶2, can be calculated based on Eqs. 8, 9, and 10 by integrating the time-varying CO2 concentration in the exhaust, 𝑋𝑋𝐶𝐶𝐶𝐶2, thus the mass-based CO2 yield, 𝑌𝑌𝐶𝐶𝐶𝐶2 , is:

9
This publication is available free of charge from: https://doi.org/10.6028/N
IST.TN.2133
𝑌𝑌𝐶𝐶𝐶𝐶2 = ∆𝐶𝐶𝐶𝐶2∆𝑚𝑚
=∫ �̇�𝑚𝐶𝐶𝐶𝐶2 𝑑𝑑𝑑𝑑𝑡𝑡𝑒𝑒𝑡𝑡0
Δ𝑚𝑚 (11)
The ratio of the production of CO to CO2, 𝜂𝜂𝐶𝐶𝐶𝐶 𝐶𝐶𝐶𝐶2⁄ , is equal to the ratio of Eq. 8 to Eq. 11: 𝜂𝜂𝐶𝐶𝐶𝐶 𝐶𝐶𝐶𝐶2⁄ = ∆𝐶𝐶𝐶𝐶
∆𝐶𝐶𝐶𝐶2 (12)
The soot yield, Ys, is used to quantify particulate emission from the fires. The smoke yield was calculated from the ratio of the smoke produced, ∆𝑆𝑆, to the fuel mass consumed ∆𝑚𝑚. The value of the smoke produced is determined by the laser light extinction measurements in the duct at a wavelength of 633 nm [25, 33], so Ys is defined as:
𝑌𝑌𝑠𝑠 = ∆𝑆𝑆Δ𝑚𝑚
=∫ 𝐾𝐾 �̇�𝑉𝑒𝑒
𝜎𝜎𝑠𝑠𝐶𝐶𝑠𝑠 𝑑𝑑𝑑𝑑𝑡𝑡𝑒𝑒
𝑡𝑡0Δ𝑚𝑚
(13) with 𝜎𝜎𝑠𝑠 = 𝐾𝐾 𝑀𝑀𝑠𝑠⁄ (14) 𝐾𝐾 = 1
𝐿𝐿𝑉𝑉𝑙𝑙 �𝐼𝐼0
𝐼𝐼� (15)
where 𝑌𝑌𝑠𝑠 is the soot yield from the fire (kg/kg), 𝐾𝐾 is the light extinction coefficient (1/m), �̇�𝑉𝑒𝑒 is the volumetric exhaust flow rate (m3/s) in the duct at the soot measurement location, 𝜎𝜎𝑠𝑠 is the mass specific extinction coefficient equal to the ratio of the extinction coefficient to the density of soot in the exhaust duct, 𝑀𝑀𝑠𝑠 (kg/m3), taken as 8700 ±13% m2/kg for smoke produced in over-ventilated fires [34], 𝐶𝐶𝑠𝑠 is a smoke profile factor, which is taken to be 0.97 [25], 𝐿𝐿 is the diameter of the duct (m), 𝐼𝐼0 is the baseline intensity of the laser light source, which is computed as a 100 s average before the stove is on, and 𝐼𝐼 is the transmitted light intensity across the exhaust duct. For this study, 𝐿𝐿 is equal to 0.485 m.
It may also be useful to consider the time-dependent specific extinction area (SEA), which is equal to the light extinction coefficient, 𝐾𝐾, normalized by the ratio of the fuel mass loss rate, �̇�𝑚𝑓𝑓, to the exhaust volumetric flow rate, �̇�𝑉𝑒𝑒 [25]:
𝑆𝑆𝑆𝑆𝑆𝑆 = 𝐾𝐾�̇�𝑚𝑓𝑓/�̇�𝑉𝑒𝑒
(16)
In this study, the time-averaged value of SEA is considered, which is defined as:
𝑆𝑆𝑆𝑆𝑆𝑆 =∫ 𝐾𝐾 �̇�𝑉𝑒𝑒 𝑑𝑑𝑑𝑑𝑡𝑡𝑒𝑒𝑡𝑡0
∆𝑚𝑚 (17)
The SEA values of corn oil during preheating and burning are independently considered. The SEA (m2/g) of the burning oil is related to 𝜎𝜎𝑠𝑠 and 𝑌𝑌𝑠𝑠 through Eqs. 13 and 17 such that:
𝑌𝑌𝑠𝑠 = 𝐶𝐶𝑠𝑠𝜎𝜎𝑠𝑠∙ 𝑆𝑆𝑆𝑆𝑆𝑆 = 0.11 ( 𝑔𝑔
𝑚𝑚2) ∙ 𝑆𝑆𝑆𝑆𝑆𝑆 (18)
where the constant in Eq. 18 is 0.11g/m2±13% , which is consistent with Tewarson [35], who reports that
𝑌𝑌𝑠𝑠 = 0.0994 ( 𝑔𝑔𝑚𝑚2) ∙ 𝑆𝑆𝑆𝑆𝑆𝑆 (19)

10
This publication is available free of charge from: https://doi.org/10.6028/N
IST.TN.2133
based on the constant air density, smoke density and red wavelength of light. Eq. 18 can be used to determine the soot yield based on the smoke extinction area.
4. RESULTS AND DISCUSSION
4.1 Combustion Characteristics of Cooking Oil Fires
In this section, burning characteristics of the fire, such as ignition time, heat release rate, flame height, and the emissions of radiative energy and combustion products are discussed in detail, considering different initial fuel mass and pan diameter. The burning characteristics of traditional hydrocarbon fuels including gasoline and heptane are also considered to provide a basis for understanding the relative severity of cooking oil fires.
4.1.1 Comparison with Traditional Pool Fires
The heat release rate can be thought of as a simple representation of fire hazard. The heat release rate controls fire spread and growth and is related to a fire’s radiative heat transfer to the surroundings and the emission of toxic gases and particles. The peak heat release rate represents the most hazardous moment during the evolution of a fire. Fig. 3 shows typical results for the evolution of the heat release rate for different fuels fires with 50 g initial mass in the 9.7 cm diameter pan, where ignition occurs at time equal to zero. The corn oil fire that experienced auto-ignition had the largest peak heat release rate, which was equal to about 13.4 kW. This is much higher than the fires burning more volatile hydrocarbon fuels in a “traditional” pool fire configuration (without additional heating on the bottom of the pan). The “traditional” pool fires were ignited with a torch impinging onto the top of the fuel pool. The heat release rate of the heptane pool fire can be divided into four phases: a pre-burning stage, a quasi-burning stage, a boiling burning stage and a decay stage [36]. The heat release rate for the torch-ignited gasoline and corn oil pool fires were relatively constant in time, and boiling was not observed. Although the shapes of the HRR curves were very different for the auto- and torch-ignited corn oil experiments, as expected, the total energy generated by the fires (the integrated heat release rate curves) were quite similar (within 7 % of each other) since the same amount of oil was consumed.

11
This publication is available free of charge from: https://doi.org/10.6028/N
IST.TN.2133
0 200 400 600 800 1000 12000
2
4
6
8
10
12
14
16
Hea
t rel
ease
rate
(kW
)
Time (s)
Gasoline n-heptane Corn oil (torch ignition) Corn oil (auto-ignition)
Peak value=13.4 kW
Figure 3 Measured heat release rate during experiments with different fuels fires with 50 g initial mass in the 9.7 cm
diameter pan. The combined uncertainty of the instantaneous measurements was 8 %.
For the transient fires considered here, the flame height changes with time. Figure 4 shows the auto-ignited and torch-ignited 50 g corn oil pool fires in the 9.7 cm diameter pan. The peak flame height was defined as the maximum value of the mean flame height and its variance during a running average over 1s (about 5 pool fire puffing cycles). The instantaneous flame height obtained its largest value, 77.2 cm ± 0.5 cm, 73 s after ignition. At the same time, the 1 s time-averaged peak flame height was 58.3 cm ± 7 cm. The flame height profile is similar to the heat release rate profile, because the flame height scales with the heat release rate to the 2/5 power [37].
0 50 100 150 2000
20
40
60
80
100
Flam
e he
ight
(cm
)
Time (s)
Instantaneous flame height mean flame height over 1s
peak flame height=58.3 cm
Figure 4 The instantaneous and mean (1s running time average) flame height for the corn oil fire with 50 g initial
mass in the 9.7 cm diameter pan as a function of time after auto-ignition

12
This publication is available free of charge from: https://doi.org/10.6028/N
IST.TN.2133
A comparison of the development of the 9.7 cm diameter and 50 g initial mass corn oil and gasoline pan fires is highlighted in Fig. 5 in terms of the flame height and their appearance as a function of time normalized by the total duration of the experiment, from the time of ignition until fuel-burnout. At auto-ignition, a flame was established on the top surface of the fuel pool, which rapidly grew until it reached its maximum value, after which it decreased until all the fuel was consumed and the fire extinguished.
For the auto-ignited corn oil pool fire, the heat release rate and flame height profiles were shaped like a triangle, where the growth rate and peak value for the heat release rate were much larger than the traditional torch-ignited pool fires. This phenomenon could be explained based on the energy balance associated with a pool fire, as introduced in Section 2. The fuel temperature must be greater than about 392 °C to achieve auto-ignition for corn oil [17]. Heating the pan decreases the heat needed to evaporate the corn oil, facilitating relatively rapid burning and leading to increased fire size. The larger fire provides even larger radiative heat transfer to the pool surface, forming a positive feedback loop.
Figure 5 Typical flame images for pool fires with 50 g initial mass in the 9.7 cm diameter pan at various times after
ignition normalized by the total burn duration
Figure 6 compares the measured radiative power (see Eq. 5) for three gauges at different distances from the fire during auto-ignition of 50 g of corn oil in the 9.7 cm diameter pan. The results are very similar for the three gauges, with the maximum difference at any time less than 5%, which is within experimental uncertainty, confirming that the distances are sufficiently large (in this case, about 10 to 30 times the pool diameter) to ensure the use of the single point measurement method to determine 𝜒𝜒𝑟𝑟 using Eq. 6.

13
This publication is available free of charge from: https://doi.org/10.6028/N
IST.TN.2133
0 20 40 60 80 100 120 140 160 180 200 2200
2
4
6
8
10
12
Qr (
kW)
Time (s)
HF1, R1=131 cm HF2, R2=198 cm HF3, R3=296 cm
Figure 6 The measured radiative power (�̇�𝑄𝑟𝑟 defined in Eq. 5) for three gauges at different distances from the fireafter auto-ignition of 50 g of corn oil in the 9.7 cm diameter pan.
Table 4 summarizes the results of repeated experiments with an initial mass of 50 g of corn oil, heptane and gasoline (such as those seen in Fig. 3), including the peak radiative power emitted to the surroundings (�̇�𝑄𝑟𝑟), the peak heat release rate (�̇�𝑄𝑎𝑎), and the peak flame height, as well as the time-averaged values of the radiative fraction (𝜒𝜒𝑟𝑟), and the combustion efficiency (𝜒𝜒𝑎𝑎) and their combined uncertainties. The results show that the peak values of �̇�𝑄𝑟𝑟, �̇�𝑄𝑎𝑎, and flame height were largest for the heated, auto-ignited, corn oil fires, which were a factor of 4.9, 3.1, and 1.6 times larger, respectively, than the peak values for the torch-ignited gasoline pool fires. The gasoline and heptane experiments provide a reference or basis by which to compare the hazard of the corn oil fires. The results indicate the relative severity of the hazards associated with corn oil cooking fires. Experiments in larger pans show similar results as discussed below. Previous results reported in the literature for 𝜒𝜒𝑟𝑟 and 𝜒𝜒𝑎𝑎 for heptane and gasoline are not unlike the results reported here [31].
Table 4 Summary of the mean and combined (95 % confidence interval) uncertainty of measurements in 9.7 cm diameter pool fires burning 50 g of corn oil, gasoline and heptane.
Fuel Peak �̇�𝑸𝒓𝒓
(kW)
Peak �̇�𝑸𝒂𝒂
(kW)
Peak flame height (cm) 𝝌𝝌𝒓𝒓 𝝌𝝌𝒂𝒂 𝝌𝝌𝒓𝒓 [31] 𝝌𝝌𝒂𝒂 [31]
Corn oil (auto-ignition) 10.2±21 % 14.7±26% 58.0±53% 0.45±13% 0.79±10% - -
Corn oil (torch) 1.5±26% 2.7±14% 25.5±34% 0.31±26% 0.80±11% - -
Heptane 2.7±24% 7.1±10% 43.3±21% 0.30±11% 0.84±10% 0.30 0.92
Gasoline 2.1±24% 4.8±24% 37.0±47% 0.35±15% 0.76±15% 0.31 0.91

14
This publication is available free of charge from: https://doi.org/10.6028/N
IST.TN.2133
Figure 7 shows the CO and soot produced during the burning period of the 50 g corn oil, heptane and gasoline pool fires in the 9.7 cm diameter pan. The CO and soot produced show similar trends for the different fuels. For torch-ignited fires, gasoline released the largest amount of CO and soot, whereas heptane released the least for the same initial mass (50 g). In the case of auto-ignition, the CO and soot production of corn oil was larger by a factor of 1.2 and 1.7, respectively than in the torch-ignited fires. The CO and soot yields shown in Fig. 7 are derived from the CO and soot produced divided by the fuel mass consumed during burning. The CO and soot yields for the auto-ignited, corn oil fires were (1) obviously higher than the torch-ignited corn oil fires, and, (2) within the experimental uncertainty associated with the torched-ignited, gasoline pool fires.
Corn oil Corn oil Gasoline Heptane0
1
2
3
4
5
Fuel type
CO
, soo
t pro
duct
ion
(g)
Torch ignition
Auto-ignition CO production Soot production
CO
, soot yield (g/g)
0.00
0.05
0.10
0.15
0.20
CO yield Soot yield
Figure 7 The CO and soot production, and the CO and soot yield during the burning of 50 g of corn oil, gasoline,
and heptane in the 9.7 cm diameter pan.
4.1.2 The Effect of Initial Fuel Mass
Figure 8a shows the average temperature of the pan bottom as a function of time for three experiments involving the auto-ignition of 20 g, 50 g, 100 g and 150 g of corn oil in the 9.7 cm diameter pan, where time zero represents the initiation of heating using the cooktop coil heating element. For the auto-ignition experiments, the temperature of the pan rapidly increased initially, subsequently, a large white aerosol cloud formed above the heated oil as seen in the left photo inset in Fig. 8a. The slope of the temperature profile gradually decreased with time until the average pan temperature was measured as about 390 °C, at which point auto-ignition was observed. This is consistent with the literature associated with measuring the auto-ignition temperature of corn oil, 392 °C [17]. The oil layer can be approximately treated as a thermally thin material [38] since the temperatures becomes uniform. Oil boil-over was observed during the 100 g and 150 g auto-ignited corn oil fires, but not the 20 g and 50 g fires. As seen in Fig. 8a, boil-over was observed when the pan temperature reached about 440 °C. At that time, the pan temperature rapidly increased until a maximum pan temperature occurred, which was larger than that measured during experiments in which boil-over was not observed. The maximum pan temperature reached about 600 °C for the 150 g auto-ignited corn oil fire. Fig. 8b shows the change of fuel mass with time for auto-ignition

15
This publication is available free of charge from: https://doi.org/10.6028/N
IST.TN.2133
of 20 g, 50 g, 100 g and 150 g of corn oil in the 9.7 cm diameter pan. With heating, the oil slowly evaporated and the mass loss rate (see slopes listed in Fig. 8b) was relatively small before auto-ignition; it significantly increased, however, after auto-ignition by about a factor of 35 to 400, with the largest increases occurring for the larger, initial fuel mass. Boil-over occurred within 100 s of ignition for the 100 g and 150 g fires. The corn oil fires that experience boil-over (with initial fuel masses of 100 g and 150 g) exhibited significantly larger mass loss rates by a factor of 2.8 and 3.6 as compared to the 50 g corn oil fire.
0 200 400 600 800 1000 1200 1400 16000
100
200
300
400
500
600 boil-over boil-over
Ignition
Ave
rage
pan
tem
pera
ture
(℃)
Time (s)
Auto ignition (20 g) Auto ignition (50 g) Auto ignition (100 g) Auto ignition (150 g)
IgnitionIgnition
before ignition after ignition
(a)
0 400 800 1200 1600 2000 24000
20
40
60
80
100
120
140
160 20 g 50 g 100 g 150 g Linear fit
Time (s)
Fuel
mas
s (g
)
Ignition
Ignition
Initial fuel mass Slope before ignition
(g) (g/s)20 0.007750 0.0086
100 0.0034150 0.0062
Ignition
Ignition
Initial fuel mass Slope after ignition (g) (g/s)20 0.2750 0.5
100 1.36150 1.82
(b)
Figure 8 (a) The average pan temperature as a function of time for auto-ignition of corn oil with different initial mass in the 9.7 cm diameter pan; (b) The fuel mass as a function of time for auto-ignition of corn oil with different initial mass in the 9.7 cm diameter pan. Time zero represents the time of initial heating.
Figure 9 highlights the boil-over phenomena, showing the instantaneous fire appearance during the burning of 100 g and 150 g of corn oil. Boil-over increased the effective diameter of the base of the fire by a factor of about 1.4 and 1.8 for the 100 g and 150 g auto-ignited corn oil fires, respectively. As the initial fuel mass increased, more fuel was in the pan when bulk liquid boiling occurred. As the heating of the burning corn oil continued, boiling became intense and the bulk density of the oil decreased due to the many bubbles of the rapidly vaporizing oil. The liquid level increased in the pan until it overflowed the pan rim. Then, burning liquid fuel was observed on the sides of the pan and in the bowl below the heating element, similar to previous observations [3]. The mass remaining in the pan at the time of boil-over was about 75 g ± 15% and 123 g ± 6% for the 100 g and 150 g auto-ignited corn oil fires, respectively. This corresponds to bulk densities of 0.10 g/cm3 ±15% and 0.17 g/cm3 ± 6%, respectively. Boil-over was not observed during the torch-ignited corn oil, heptane or gasoline fires, and not for the heated 20 g and 50 g corn oil fires. Boil-over exacerbates the hazard of a cooktop fire. Once the burning liquid flows beyond the confines of the pan, possible suppression of the fire and its control by covering the burning liquid is precluded. Heat transfer from the burning liquid under and near the pan can enhance heat transfer to the pan and increase the magnitude of the boil-over effect.

16
This publication is available free of charge from: https://doi.org/10.6028/N
IST.TN.2133
Figure 9 Instantaneous flame appearance showing the boil-over phenomenon during burning of auto-ignited corn oil fires with initial mass of 100 g and 150 g in the 9.7 cm diameter pan. The time after autoignition is noted above each image.
Figure 10 shows the time to auto-ignition and the time to peak heat release rate as a function of initial corn oil mass in the 9.7 cm diameter pan. These two parameters both increased nearly linearly with initial fuel mass. The time to auto-ignition is closely related to the thermal dissipation inside the oil layer. As shown in Fig. 8a, the bottom surface of the pan gradually increased during heat-up of the corn oil. The rate of temperature rise decreased with increasing initial fuel mass. For the same pan diameter, larger initial fuel mass meant a thicker initial fuel depth. The decline of the rate of temperature rise was related to the higher heat capacity of the relatively larger amounts of fuel in the pan. This led to longer times to heat up and obtain the oil auto-ignition temperature.
0 50 100 1500
200
400
600
800
1000
1200
1400
tpeak=528+4.5*mfuel, R2=0.99
Tim
e (s
)
Initial fuel mass (g)
tauto-ignition=460+3.9*mfuel, R2=0.98
Figure 10 The time to peak heat release rate and auto-ignition as a function of initial corn oil mass in the 9.7 cm diameter pan

17
This publication is available free of charge from: https://doi.org/10.6028/N
IST.TN.2133
Figure 11 shows the measured heat release rate as a function of time for corn oil with different initial mass in the 9.7 cm diameter pan, where time zero represents the instant of auto-ignition. The shape of the heat release rate time series is shaped not unlike a triangle for all the experiments. The peak heat release rate increases with initial fuel mass.
0 50 100 150 200 250 3000
10
20
30
40
50
60
Hea
t rel
ease
rate
(kW
)
Time (s)
mfuel=20g mfuel=50g mfuel=100g mfuel=150g
Figure 11 Transient heat release rate after auto-ignition for different initial corn oil mass in the 9.7 cm diameter pan
The measurement results for the heated corn oil experiments are summarized in Table 5, including the peak �̇�𝑄𝑟𝑟, �̇�𝑄𝑎𝑎 , flame height, and the overall radiative fraction and combustion efficiency. The results show the peak emitted heat flux, heat release rate, and flame height increased with initial fuel mass, which indicated that kitchen fires with more fuel mass are more hazardous. The peak instantaneous flame height was about 1.0 m for the 150 g corn oil pool fire in the 9.7 cm diameter pan as seen in Fig. 12, large enough to contact nearby flammable items, such as kitchen cabinets.
Table 5 Summary of corn oil fire results for different initial fuel mass in the 9.7 cm diameter pan
Initial fuel mass (g)
Peak �̇�𝑸𝒓𝒓 (kW)
Peak �̇�𝑸𝒂𝒂 (kW)
Peak flame height (cm) 𝝌𝝌𝒓𝒓 𝝌𝝌𝒂𝒂
20 50
100 150
Average
5.3 ± 27% 10.2 ± 21% 24.9 ± 14% 29.7 ± 16%
-
7.9 ± 15% 14.7±26% 33.2 ± 7%
48.2± 30% -
42.2 ± 62% 58.0 ± 53% 78.4 ± 33% 85.3 ±30%
-
0.48 ± 28% 0.45 ± 14% 0.42 ± 14% 0.40 ± 16% 0.44± 19 %
0.74 ± 31% 0.79 ± 10% 0.79 ± 10% 0.80 ± 19%

18
This publication is available free of charge from: https://doi.org/10.6028/N
IST.TN.2133
Figure 12 Flame appearance at the time of the largest instantaneous flame height during auto-ignition of corn oil with initial masses of 50 g and 150 g in the 9.7 cm diameter pan. Boil-over is evident during the largest instantaneous fire during the 150 g corn oil fire.
Figure 13a presents (1) the CO and smoke yields and (2) the CO and smoke produced during the auto-ignited, corn oil fires with different initial mass in the 9.7 cm diameter pan. Although the overall CO and smoke produced during the burning of corn oil fires increased linearly, both the CO and smoke yields decreased exponentially with increasing initial mass. The reduction of the soot yield is more significant than CO yield. Fig. 13b shows both the CO and CO2 production, and the ratio of CO to CO2 in auto-ignited fires with different initial mass in the 9.7 cm diameter pan. The CO2 production during the burning of corn oil fires also increases with increasing initial mass but, the ratio of CO to CO2 decreases correspondingly.

19
This publication is available free of charge from: https://doi.org/10.6028/N
IST.TN.2133
20 50 100 1500
5
10
15
20
25
(a)
Initial fuel mass (g)
CO production CO2 production
CO/CO
2 (g/g)CO
2 pro
duct
ion
(g×1
0)CO
pro
duct
ion
(g)
0.012
0.014
0.016
0.018
0.020
0.022
0.024
CO/CO2
0 50 100 1500.00
0.02
0.04
0.06
0.08
0.10
0.12 CO yield Soot yield CO production Soot production
Initial fuel mass (g)
CO a
nd so
ot y
ield
(g/g
)
0
2
4
6
8
10
CO and soot production (kg)
(b)
Figure 13 Emission from auto-ignited corn oil fires with different initial corn oil mass in the 9.7 cm diameter pan (a)
the CO and CO2 production and the CO/CO2 ratio; (b) the CO and smoke yield, and the CO and soot produced
4.1.3 The Effect of Pan Diameter
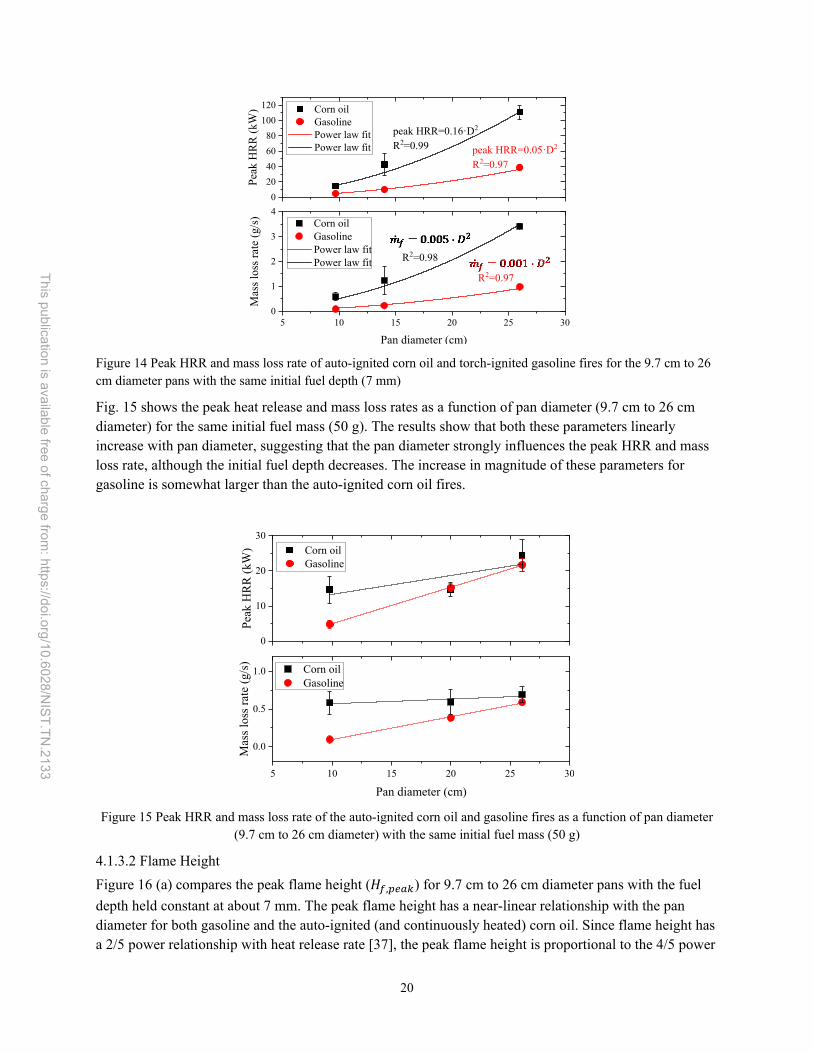
4.1.3.1 Heat Release Rate Figure 14 shows the results of mass loss rate and peak heat release rate (peak HRR) for the 9.7 cm to 26 cm diameter pans with the same initial fuel depth. In fact, the initial fuel mass was larger for the larger pans in order to maintain the same initial fuel depth (about 7 mm). The average mass loss rate is determined from the slope of the transient mass loss (see for example Fig. 8b). As expected, these parameters show corresponding increases with pan diameter [13].The increases for the auto-ignited corn oil fires are larger than the torch-ignited gasoline fires. By noting that the peak HRR and mass loss rate (�̇�𝑚𝑓𝑓) scale with the pan diameter (𝐷𝐷) (Eq. 20), the power law fit of auto-ignited corn oil and gasoline fires are respectively shown in Fig. 14.
𝑝𝑝𝑝𝑝𝑝𝑝𝑝𝑝 𝐻𝐻𝑅𝑅𝑅𝑅 ∝ �̇�𝑚𝑓𝑓 ∝ 𝐷𝐷2 (20)
20
This publication is available free of charge from: https://doi.org/10.6028/N
IST.TN.2133
020406080
100120
5 10 15 20 25 300
1
2
3
4
peak HRR=0.05·D2
R2=0.97
Corn oil Gasoline Power law fit Power law fit
Peak
HRR
(kW
)
peak HRR=0.16·D2
R2=0.99
R2=0.97
R2=0.98M
ass l
oss r
ate
(g/s
)
Pan diameter (cm)
Corn oil Gasoline Power law fit Power law fit
Figure 14 Peak HRR and mass loss rate of auto-ignited corn oil and torch-ignited gasoline fires for the 9.7 cm to 26 cm diameter pans with the same initial fuel depth (7 mm)
Fig. 15 shows the peak heat release and mass loss rates as a function of pan diameter (9.7 cm to 26 cm diameter) for the same initial fuel mass (50 g). The results show that both these parameters linearly increase with pan diameter, suggesting that the pan diameter strongly influences the peak HRR and mass loss rate, although the initial fuel depth decreases. The increase in magnitude of these parameters for gasoline is somewhat larger than the auto-ignited corn oil fires.
0
10
20
30 Corn oil Gasoline
Peak
HRR
(kW
)
5 10 15 20 25 30
0.0
0.5
1.0
Mas
s los
s rat
e (g
/s)
Pan diameter (cm)
Corn oil Gasoline
Figure 15 Peak HRR and mass loss rate of the auto-ignited corn oil and gasoline fires as a function of pan diameter (9.7 cm to 26 cm diameter) with the same initial fuel mass (50 g)
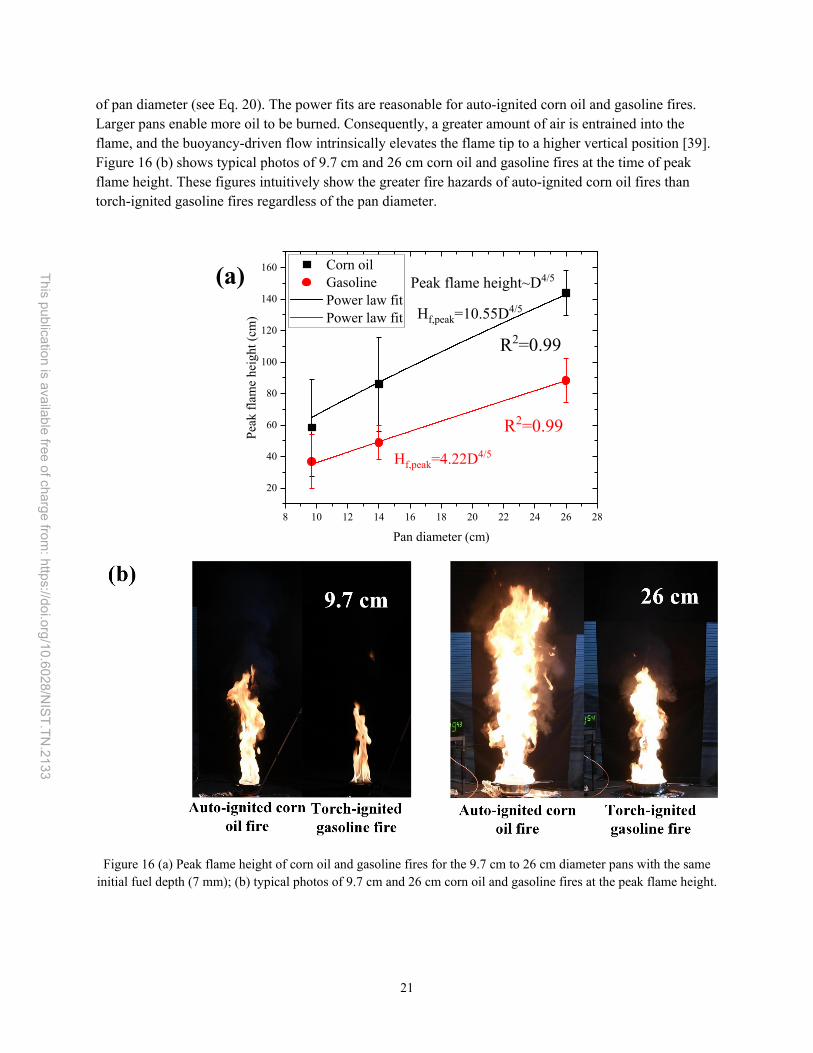
4.1.3.2 Flame Height Figure 16 (a) compares the peak flame height (𝐻𝐻𝑓𝑓,𝑝𝑝𝑒𝑒𝑎𝑎𝑝𝑝) for 9.7 cm to 26 cm diameter pans with the fuel depth held constant at about 7 mm. The peak flame height has a near-linear relationship with the pan diameter for both gasoline and the auto-ignited (and continuously heated) corn oil. Since flame height has a 2/5 power relationship with heat release rate [37], the peak flame height is proportional to the 4/5 power
21
This publication is available free of charge from: https://doi.org/10.6028/N
IST.TN.2133
of pan diameter (see Eq. 20). The power fits are reasonable for auto-ignited corn oil and gasoline fires. Larger pans enable more oil to be burned. Consequently, a greater amount of air is entrained into the flame, and the buoyancy-driven flow intrinsically elevates the flame tip to a higher vertical position [39]. Figure 16 (b) shows typical photos of 9.7 cm and 26 cm corn oil and gasoline fires at the time of peak flame height. These figures intuitively show the greater fire hazards of auto-ignited corn oil fires than torch-ignited gasoline fires regardless of the pan diameter.
8 10 12 14 16 18 20 22 24 26 28
20
40
60
80
100
120
140
160
Hf,peak=10.55D4/5
Hf,peak=4.22D4/5
R2=0.99
R2=0.99
Corn oil Gasoline Power law fit Power law fit
Peak
flam
e he
ight
(cm
)
Pan diameter (cm)
Peak flame height~D4/5(a)
Figure 16 (a) Peak flame height of corn oil and gasoline fires for the 9.7 cm to 26 cm diameter pans with the same initial fuel depth (7 mm); (b) typical photos of 9.7 cm and 26 cm corn oil and gasoline fires at the peak flame height.

22
This publication is available free of charge from: https://doi.org/10.6028/N
IST.TN.2133
Previous studies have demonstrated that the height of a diffusion flame has a 2/5 power dependence on the heat release rate, which can be expressed as [37]:
𝑉𝑉𝑓𝑓𝐷𝐷∝ �̇�𝑄∗2/5 ∝ �̇�𝑄2/5
𝐷𝐷 (21)
where 𝑉𝑉𝑓𝑓, �̇�𝑄∗ , �̇�𝑄 and 𝐷𝐷 are the flame height, non-dimensional heat release rate, heat release rate, and pan diameter, respectively. Figure 17 plots 𝑉𝑉𝑓𝑓 𝐷𝐷⁄ as a function of �̇�𝑄2/5 𝐷𝐷⁄ .
𝑉𝑉𝑓𝑓𝐷𝐷
= 0.224 ∙ �̇�𝑄25
𝐷𝐷− 1.02 (22)
which correlates well linearly with the results shown in Fig. 17.
10 20 30 40 50 600
2
4
6
8
10
12
14 Corn oil (auto-ignition) Gasoline (torch ignition) Corn oil (torch ignition) Heptane (torch ignition) Fitting
R2=0.99
Figure 17 The dimensionless peak flame height as a function of �̇�𝑄2/5 𝐷𝐷⁄ for all fuels and conditions considered in this study.
4.1.3.3 Radiative Fraction and Combustion efficiency Table 6 summarizes the measurement results for the auto-ignited corn oil fires and the gasoline fires for 9.7 cm to 26 cm diameter pans. The results show that peak �̇�𝑄𝑟𝑟 and peak �̇�𝑄𝑎𝑎 increase with increasing pan diameter and initial fuel mass. In general, the radiative fraction and combustion efficiency are larger for the auto-ignited corn oil fire as compared to the gasoline fire. For the range of pan diameters considered here, the results also show that the radiative fractions of corn oil and gasoline fires are approximately independent of pan diameter and initial fuel mass. The combustion efficiency, however, shows a slightly increasing trend for increasing pan diameters with the same initial fuel depth and the same initial fuel mass, respectively, for both fuels. This suggests that the oil vapor combustion was a little more efficient for the bigger corn oil fires. Combining the radiative fraction data in Table 5 yields an average radiative fraction of auto-ignited corn oil fires of 0.44 ± 21 %, well within the range of values of 0.34 to 0.59 presented by Koseki for several vegetable oils [15].

23
This publication is available free of charge from: https://doi.org/10.6028/N
IST.TN.2133
These types of measurements, which characterize cooking fires, may be useful in fire investigations. For example, the data may help establish the relationship between the amount of oil and known sizes of pans that give rise to auto-ignition and subsequent heat release rates, flame heights, and radiative fluxes to the surroundings. In this regard, the data may be useful for verifying plausible fire time lines.
Table 6 Summary of auto-ignited corn oil and torch-ignited gasoline fire results for the 9.7 cm to 26 cm diameter pans. The expanded uncertainty is also shown (with an expansion factor of 2, representing a 95% confidence level).
Oil type Pan
diameter (cm)
Initial fuel mass
(g)
Fuel depth (mm)
Peak �̇�𝑸𝒓𝒓 (kW)
Peak �̇�𝑸𝒂𝒂
(kW) 𝝌𝝌𝒓𝒓 𝝌𝝌𝒂𝒂
Corn oil
9.7 50 7 10.2 ± 21 % 14.7 ± 26 % 0.45 ± 14 % 0.79 ± 10 %
14 100 7 22.5 ± 37 % 42.5 ± 34 % 0.45 ± 24 % 0.85 ± 14 %
20 200 12 26.5 ± 13 % 49.0 ± 8 % 0.43 ± 13 % 0.85 ± 8 %
26 338 7 61.1 ± 10 % 110.8 ± 8 % 0.44 ± 7 % 0.88 ± 9 %
20 50 3 11.4 ± 75 % 14.8 ± 14 % 0.47 ± 27 % 0.93 ± 22 %
26 50 1 13.4 ± 21 % 24.4 ± 19 % 0.39 ± 30 % 0.96 ± 69 % Mean 0.44 ± 21 %
Gasoline
9.7 50 7 2.1 ± 24 % 4.8 ± 24 % 0.35 ± 15 % 0.76 ± 15 %
14 100 7 5.7 ± 19 % 10.0 ± 8 % 0.40 ± 19 % 0.78 ± 9 %
20 200 12 9.3 ± 16 % 17.8 ± 8 % 0.38 ± 11 % 0.81 ± 8 %
26 338 7 21.1 ± 8 % 38.9 ± 10 % 0.39 ± 14 % 0.82 ± 8 %
20 50 3 7.3 ± 10 % 15.2 ± 8 % 0.34 ± 29 % 0.82 ± 8 %
26 50 1 11.3 ± 8 % 21.7 ± 8 % 0.34 ± 7 % 0.84 ± 10 %
Mean 0.37 ± 17 %
4.1.3.4 Combustion Products Figure 18a shows the emissions for auto-ignited corn oil fires and torch-ignited gasoline fires as a function of pan diameter (9.7 cm to 26 cm diameter) with a constant initial fuel depth (7mm) and a constant initial fuel mass (50 g). Figure 18a shows that while the CO and CO2 production increases with pool diameter for the same initial fuel depth, the CO/CO2 decreases correspondingly. Figure 18b shows the CO and soot yields for corn oil and gasoline fires burning in different pan diameters with the same

24
This publication is available free of charge from: https://doi.org/10.6028/N
IST.TN.2133
initial fuel depth. The CO and soot yield for auto-ignited corn oil fires and torch-ignited gasoline fires decrease slightly with increasing pan diameter. The CO/CO2 and smoke yields can be thought of as measures of combustion efficiency [40]. The results show, as expected, that an increase in combustion efficiency is accompanied by decreases in the soot yield and CO/CO2 for the range of fire sizes considered here.
9.7 14 26
0
10
20
30
40
50
60
70
80
{{{ CO production (corn oil) CO2 production (corn oil) CO production (gasoline) CO2 production (gasoline)
CO/CO2 (corn oil) CO/CO2 (gasoline)
Pan diameter (cm)
CO2 p
rodu
ctio
n (g
×10)
CO p
rodu
ctio
n (g
)
0.000
0.008
0.016
0.024
0.032
CO/CO
2 (g/g)
8 10 12 14 16 18 20 22 24 26 280.00
0.02
0.04
0.06
0.08
0.10
(a) CO yield (Corn oil) CO yield (Gasoline)
CO
yie
ld (g
/g)
Pan diameter (cm)
0.00
0.02
0.04
0.06
0.08
0.10
Soot yield (Corn oil) Soot yield (Gasoline)
Soot yield (g/g)
Figure 18 Emissions from the auto-ignited corn oil and gasoline fires as a function of pan diameter (9.7 cm to 26 cm
diameter) for the same initial fuel depth (7 mm) (a) CO and CO2 production, and CO/CO2 and (b) CO and soot yields
Figure 19 presents the emissions as a function of pan diameter (9.7 cm to 26 cm diameter) for the auto-ignited corn oil and gasoline fires with the same initial fuel mass (50 g). All parameters have slightly decreasing tendencies with increasing pan diameter. These results also suggest a correlation among CO/CO2, soot yield and combustion efficiency.
9.7 20 26
0
2
4
6
8
10
12
14
16
18
20
{{{
CO/CO2 (corn oil) CO/CO2 (gasoline)
CO production (corn oil) CO2 production(corn oil) CO production (gasoline) CO2 production (gasoline)
Pan diameter (cm)
CO2 p
rodu
ctio
n (g
×10)
CO p
rodu
ctio
n (g
)
0.010
0.012
0.014
0.016
0.018
0.020
0.022
0.024
CO/CO
2 (g/g)
8 10 12 14 16 18 20 22 24 26 28
0.000
0.008
0.016
0.024
0.032
0.040
0.048
0.056
CO yield (Corn oil) CO yield (Gasoline)
CO
yie
ld (g
/g)
Pan diameter (cm)
(b)
0.00
0.02
0.04
0.06
0.08
0.10
Soot yield (Corn oil) Soot yield (Gasoline)
Soot yield (g/g)
Figure 19 Emissions from auto-ignited corn oil and gasoline fires for the 9.7 cm to 26 cm diameter pans with the
same initial fuel mass (50 g) (a) CO and soot production, and CO/CO2 (b) CO and soot yields
For well-ventilated conditions, CO and soot emissions are strongly related [41, 42]. This relationship highlights the nature of toxic emissions from a fire. The correlation between the CO and soot yields is

25
This publication is available free of charge from: https://doi.org/10.6028/N
IST.TN.2133
presented in Fig. 20a. The best fit slope in Fig. 20a for all the fuels in this study is 0.31 ± 0.03. This result is within the uncertainty bands in Ref [42] in which the ratio of the CO yield to soot yield is equal to 0.37 ± 0.09 in the over-fire region of liquid-fuel diffusion flames. The SEA is related to the smoking propensity of a fuel [43] as expressed by Eq. 18, and takes on values ranging from 0.03 m2/g for a wood ‘crib’ to 1.0 m2/g for crude oil fires [25]. Combining Eq. 18 with the best fit to the data for burning corn oil in Fig. 20a (𝑌𝑌𝐶𝐶𝐶𝐶 = 0.31 ∙ 𝑌𝑌𝑠𝑠) yields:
𝑌𝑌𝐶𝐶𝐶𝐶 = 0.034 ( g𝑚𝑚2) ∙ 𝑆𝑆𝑆𝑆𝑆𝑆 (23)
So, the CO yield should be directly proportional to SEA with a slope of 0.034 g/m2. A plot, incorporating the entire data set from this study, of the CO yield versus the SEA of burning corn oil, gasoline, and heptane is presented in Fig. 20b. The CO yield is well correlated with the SEA. The SEA for the various fuels and experimental conditions considered in this study fall in the range from 0.1 m2/g to 0.9 m2/g, which is consistent with Ref. [25]. Table 7 lists the SEA values of burning corn oil. The average SEA values of burning corn oil and burning gasoline are 0.63 m2/g ± 22 % and 0.65 m2/g ± 45%, respectively, which are nearly identical, and larger than the SEA of the heptane fire.
0.00 0.02 0.04 0.06 0.08 0.10 0.10.00
0.01
0.02
0.03
0.04
0.05
(a) Corn oil (auto-ignition) Gasoline (torch ignition) n-heptane (torch ignition) Corn oil (torch ignition) Linear fit
CO y
ield
(g/g
)
Soot yield (g/g)
YCO= (0.31±0.03)·Ys
R2=0.83
0.0 0.2 0.4 0.6 0.8 1.0 1.20.00
0.02
0.04
0.06 Corn oil (auto-ignition) Gasoline (torch ignition) n-heptane (torch ignition) Corn oil (torch ignition) Linear fit
CO
yie
ld (g
/g)
SEA (m2/g)
YCO=0.034 g/m2·SEAR2=0.95
(b)
Figure 20 Correlation between (a) CO and soot yield, and (b) CO yield and SEA during burning for all experiments
considered in this study.
Table 7 Summary of the SEA of burning corn oil (uncertainty with 95% confidence level)
Pan diameter (cm) Heating element Initial fuel mass
(g)
SEA of burning corn oil
(m2/kg) 9.7 ON 20.2 ± 3.0 % 705 ± 25 % 9.7 ON 50.3 ± 0.8 % 822 ± 23 % 9.7 ON 101.5 ± 4.6 % 539 ± 6 % 9.7 ON 150.5 ± 0.7 % 553 ± 9 % 14 ON 100.1 ± 0.4 % 656 ± 15 % 20 ON 50.0 ± 0.2 % 663 ± 12 % 20 ON 199.7 ± 1.7 % 646 ±6 % 26 ON 50.4 ± 2.6 % 524 ± 47 %

26
This publication is available free of charge from: https://doi.org/10.6028/N
IST.TN.2133
26 ON 339.4 ± 1.0 % 621 ± 6 % 9.7 OFF 49.9±1.2 % 433 ± 28 %
Average 630 ± 22 %
4.2 Aerosol Production and Extinction Coefficient
Upon heating, corn oil releases an aerosol cloud (see Fig. 8a). A key optical property of the aerosol is its light-extinction coefficient (𝐾𝐾 in Eq. 15). This property may be important for early detection of pre-ignition cooktop conditions by smoke alarms or other types of detectors. It may be interesting to compare the value of this property for the period before auto-ignition for the various fuels tested in this study. Figure 21 shows typical measurement results of the CO volume fraction, light-extinction coefficient, and mass loss as a function of pan bottom temperature during the pre-combustion (or pre-ignition) period for heated corn oil in a 9.7 cm diameter pan with an initial corn oil mass of 100 g.
Thermogravimetric analysis and differential scanning calorimetry measurements indicate that the pyrolysis and thermal decomposition of corn oil is complex, involving many compounds with varying physical properties [29, 30, 44]. The evolution of mass loss, the light-extinction coefficient, and the CO volume fraction during the pre-ignition period is shown in Figure 21. Previous research by the U.S Consumer Product Safety Commission (CPSC) [45] and Milke [46] indicate that pan temperature is a useful criteria to predict if a cooking scenario will transition to fire. Thus, the various stages can be related to the measured pan bottom temperature during the experiment shown in Fig. 21. In the first stage (I), vaporization is trivial and the mass declines slowly as oil evaporates. Light-extinction and CO concentrations are too small to measure in our experiment when the pan bottom temperature is less than about 330 °C in the 9.7 cm diameter burner. This stage is consistent with normal cooking [46] for which the pan temperature is typically below 329 °C, and below CPSC’s suggested criteria of a maximum permitted pan temperature of 340 °C to avoid auto-ignition [45]. In the second stage (II), there is a transition stage when the pan bottom temperature gradually increases from about 330 °C to 378 °C, and the slopes of the light-extinction coefficient and CO concentration gradually increase due to increased vaporization of the corn oil with a relatively large amount of volatiles released [46]. In the third stage (III), the pan bottom temperature continues to increase sharply until it obtains 392 °C [17]. The measured auto-ignition temperature is consistent with previous measurements on corn oil reported as 393 °C [47]. The temperature (378 °C) of initiation of stage III is in accord with Milke, who refers to the initiation of “pre-fire” stage at a temperature of 374 °C [46]. A whitish-appearing aerosol cloud is clearly seen above the corn oil until auto-ignition occurs. Upon ignition, a darker-appearing cloud of smoke suddenly appears above the fire.

27
This publication is available free of charge from: https://doi.org/10.6028/N
IST.TN.2133
0 100 200 300 400 500
0.00
0.05
0.10
0.15
CO
concentration in exhaust (ppm)
Mass (g)
Pan bottom temperature (℃)
Ligh
t-ext
inct
ion
coef
ficie
nt (m
-1)
Light-extinction coefficient Mass CO concentration
85
90
95
100
105
110
0
4
8
12
16
20
378 ℃
330 ℃
III
III ignition
392 ℃
Figure 21 Measurements of the CO volume fraction in the exhaust stream, the light extinction coefficient (𝐾𝐾), and the fuel mass as a function of time before auto-ignition of 100 g of corn oil in the 9.7 cm diameter pan.
Figure 22 presents the effect of the initial fuel mass and pan diameter on the light-extinction coefficient, K, (see Eq. 15) before auto-ignition of the corn oil. The light-extinction coefficient curves shown in Fig. 22 were smoothed using a 5 s moving average. Table 8 tabulates the values of the maximum light-extinction coefficient before auto-ignition with uncertainties reported at a 95% confidence level. The evolution of K versus time for all experimental conditions increases exponentially with time. The trends in the evolution of the light-extinction coefficient for heated corn oil are consistent with Milke’s findings [46]. Three distinct vaporization stages are evident for all cases, as discussed in Fig. 21. It should be noted that the duration of stage III is very rapid, generally ranging from 30 s to 60 s in this study. The time periods appear to be sufficient for a burner to be de-energized [48]. A larger initial fuel mass significantly prolongs the heating time before auto-ignition. And the duration of stages I and II are accordingly longer with a higher maximum light-extinction coefficient, as shown in Fig. 22a. For larger pan diameters with the same initial fuel depth, as shown in the Fig. 22b, the duration of stage I is almost the same, while stage II is longer for larger pan diameters. The maximum light-extinction coefficient also increases for the corn oil vaporization before auto-ignition in the 26 cm diameter pan, which as almost two times larger than the fires in the 9.7 cm diameter pan with the same initial fuel depth. The effect of the pan diameter with the same initial fuel mass can also be seen in Fig. 22c. The maximum value of the light-extinction coefficient appears to increase. In this study, the minimum light-extinction coefficient refers to its value at the initiation of stage III – and can be thought of as representing a typical value during unattended cooking, as shown in Table 8. Similar trends are seen in the minimum light-extinction coefficient for stage III. These results indicate that the evolution of light-extinction coefficient before ignition is affected by pan diameter and initial fuel mass.

28
This publication is available free of charge from: https://doi.org/10.6028/N
IST.TN.2133
0 200 400 600 800 1000 1200
0.00
0.02
0.04
0.06
0.08
0.10
0.12
IIIIII
III
IIII
II
I
II
IIII
Ligh
t-ext
inct
ion
coef
ficie
nt (m
-1)
Time (s)
20 g 50 g 100 g 150 g
(a)II
0 200 400 600 800 1000 1200
0.00
0.04
0.08
0.12
III
III
IIIII
II
II(b)
Ligh
t-ext
inct
ion
coef
ficie
nt (m
-1)
Time (s)
9.7 cm, 50 g 14 cm, 100 g 26 cm, 338 g
I
0 100 200 300 400 500 600
0.00
0.04
0.08
0.12
0.16
III
III
IIII
I
I II
II(c)Li
ght-e
xtin
ctio
n co
effic
ient
(m-1
)
Time (s)
9.7 cm, 50 g 20 cm, 50 g 26 cm, 50 g II
Figure 22 The variation of the light-extinction coefficient of heated corn oil before ignition as a function of time from initial high heating: (a) for different initial fuel masses in the 9.7 cm diameter pan; (b) the effect of pan diameter holding the fuel depth constant; and (c) the effect of pan diameter holding the fuel mass constant.
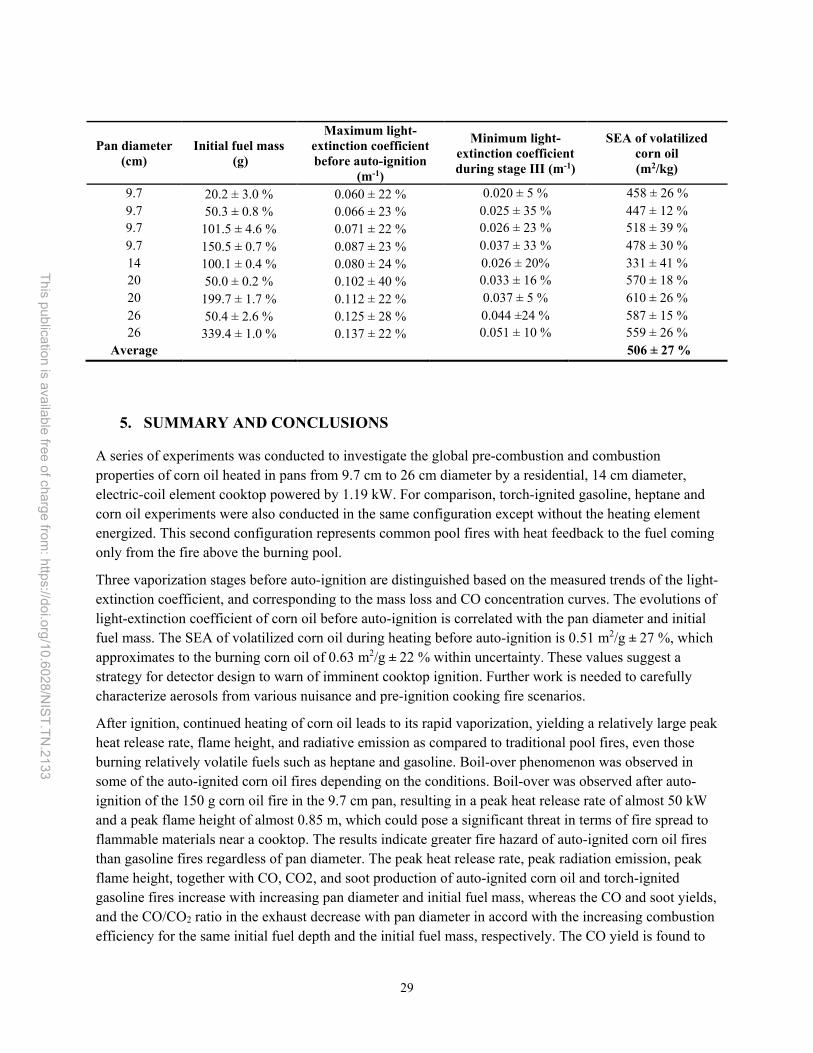
Table 8 presents the time-averaged SEA of the volatilized corn oil based on Eq. 17. The average SEA of the volatilized corn oil aerosol before auto-ignition is 0.51 m2/g with a root mean square (combined expanded) uncertainty of 27 %. This quantity is a useful parameter to characterize the relative opacity of the volatilized corn oil during heating and before auto-ignition. This value is within the uncertainty of the value of SEA determined during the burning of corn oil (see Table 8), which on average was equal to 0.63 m2/g ±22 %.
Table 8 Summary of the maximum light extinction coefficient and SEA of volatilized corn oil before auto-ignition (uncertainty with 95 % confidence level)
29
This publication is available free of charge from: https://doi.org/10.6028/N
IST.TN.2133
Pan diameter (cm)
Initial fuel mass (g)
Maximum light-extinction coefficient before auto-ignition
(m-1)
Minimum light-extinction coefficient during stage III (m-1)
SEA of volatilized corn oil (m2/kg)
9.7 20.2 ± 3.0 % 0.060 ± 22 % 0.020 ± 5 % 458 ± 26 % 9.7 50.3 ± 0.8 % 0.066 ± 23 % 0.025 ± 35 % 447 ± 12 % 9.7 101.5 ± 4.6 % 0.071 ± 22 % 0.026 ± 23 % 518 ± 39 % 9.7 150.5 ± 0.7 % 0.087 ± 23 % 0.037 ± 33 % 478 ± 30 % 14 100.1 ± 0.4 % 0.080 ± 24 % 0.026 ± 20% 331 ± 41 % 20 50.0 ± 0.2 % 0.102 ± 40 % 0.033 ± 16 % 570 ± 18 % 20 199.7 ± 1.7 % 0.112 ± 22 % 0.037 ± 5 % 610 ± 26 % 26 50.4 ± 2.6 % 0.125 ± 28 % 0.044 ±24 % 587 ± 15 % 26 339.4 ± 1.0 % 0.137 ± 22 % 0.051 ± 10 % 559 ± 26 %
Average 506 ± 27 %
5. SUMMARY AND CONCLUSIONS
A series of experiments was conducted to investigate the global pre-combustion and combustion properties of corn oil heated in pans from 9.7 cm to 26 cm diameter by a residential, 14 cm diameter, electric-coil element cooktop powered by 1.19 kW. For comparison, torch-ignited gasoline, heptane and corn oil experiments were also conducted in the same configuration except without the heating element energized. This second configuration represents common pool fires with heat feedback to the fuel coming only from the fire above the burning pool.
Three vaporization stages before auto-ignition are distinguished based on the measured trends of the light-extinction coefficient, and corresponding to the mass loss and CO concentration curves. The evolutions of light-extinction coefficient of corn oil before auto-ignition is correlated with the pan diameter and initial fuel mass. The SEA of volatilized corn oil during heating before auto-ignition is 0.51 m2/g ± 27 %, which approximates to the burning corn oil of 0.63 m2/g ± 22 % within uncertainty. These values suggest a strategy for detector design to warn of imminent cooktop ignition. Further work is needed to carefully characterize aerosols from various nuisance and pre-ignition cooking fire scenarios.
After ignition, continued heating of corn oil leads to its rapid vaporization, yielding a relatively large peak heat release rate, flame height, and radiative emission as compared to traditional pool fires, even those burning relatively volatile fuels such as heptane and gasoline. Boil-over phenomenon was observed in some of the auto-ignited corn oil fires depending on the conditions. Boil-over was observed after auto-ignition of the 150 g corn oil fire in the 9.7 cm pan, resulting in a peak heat release rate of almost 50 kW and a peak flame height of almost 0.85 m, which could pose a significant threat in terms of fire spread to flammable materials near a cooktop. The results indicate greater fire hazard of auto-ignited corn oil fires than gasoline fires regardless of pan diameter. The peak heat release rate, peak radiation emission, peak flame height, together with CO, CO2, and soot production of auto-ignited corn oil and torch-ignited gasoline fires increase with increasing pan diameter and initial fuel mass, whereas the CO and soot yields, and the CO/CO2 ratio in the exhaust decrease with pan diameter in accord with the increasing combustion efficiency for the same initial fuel depth and the initial fuel mass, respectively. The CO yield is found to

30
This publication is available free of charge from: https://doi.org/10.6028/N
IST.TN.2133
be proportional to the 0.034 times of the SEA of burning fuels. The CO and soot yields have a linear relationship with a ratio of 3.1 ± 0.3. These global correlations may be useful for providing guidance for detection before the onset of fire.
Unattended cooking can lead to rapidly growing cooktop fires and hazardous conditions. In this regard, the results of this study may be useful for educational purposes, demonstrating the potential severity of cooktop fires to a public that understands the fire hazard associated with hydrocarbons such as gasoline, but not necessarily the hazards associated with cooktop fires. Public education campaigns on the hazards of unattended cooking should consider highlighting the character of cooktop fires including the fact that a corn oil cooktop fire can be significantly larger than even a burning gasoline pool fire regardless of pan diameter.
Although standards exist to prevent ignition on electric coil element cooktops in the USA [53], no analogous standard exists for gas, ceramic, and induction type cooktops. Without such provisions in place, cooktop fire losses can be expected to continue unabated. In lieu of a cooktop standards, it may be useful for building codes to consider requiring that combustibles such as wood cabinets be placed at a safe distance away from cooktops and ranges as has been common practice in several countries.

31
This publication is available free of charge from: https://doi.org/10.6028/N
IST.TN.2133
6. REFERENCES
[1] Ahrens M., Home cooking fires. National Fire Protection Association, Quincy, MA, 2019. [2] Evarts B., Fire Loss in the United States During 2018. National Fire Protection Association, Quincy, MA, October 2019. [3] Hamins A., Kim S.C., Bundy M., Investigation of Residential Cooktop Ignition Prevention Technologies. NIST Technical Note 1986, National Institute of Standards and Technology, Gaithersburg, MD, May 2018. [4] Ahrens M., Home structure fires. In. Home structure fires. Quincy, MA, National Fire Protection Association, 2013. [5] Peacock R.D., Jones W., Reneke P., Forney G., CFAST–Consolidated Model of Fire Growth and Smoke Transport (Version 6) User’s Guide. National Institute of Standards and Technology, Gaithersburg, MD, 2005. [6] Lushaka B., Zalok E., Development of a sensing device to reduce the risk from kitchen fires, Fire Technology, 50, 791-803 (2014). [7] Gottuk D.T., Peatross M.J., Roby R.J., Beyler C.L., Advanced fire detection using multi-signature alarm algorithms, Fire Safety Journal, 37, 381-94 (2002). [8] Cleary T., Performance of dual photoelectric/ionization smoke alarms in full-scale fire tests, Fire Technology, 50, 753-73 (2014). [9] Mensch A., Hamins A., Markell K., Development of a Detection Algorithm for Kitchen Cooktop Ignition Prevention. Suppression, Detection and Signaling Research and Applications Conference (SUPDET) 2018, Cary, NC Sept. 2018. [10] Jain A., Nyati P., Nuwal N., Ansari A., Ghoroi C., Ghandi P., Pre-detection of kitchen fires due to auto-ignition of cooking oil and LPG leakage in Indian kitchens, Fire Saf. Sci., 11, 1285-97 (2014). [11] Bukowski R., Peacock R., Averill J., Cleary T., Bryner N., Walton W., Reneke P., Kuligowski E., Performance of home smoke alarms, analysis of the response of several available technologies in residential fire settings. NIST Technical Note 1455, National Institute of Standards and Technology, Gaithersburg, MD, 2003. [12] Spalding D.B., Some fundamentals of combustion, Butterworth, London, England, 1955. [13] Hottel H.C., Certain laws governing the diffusive burning of liquids-A review, Fire Res. Abs. Rev., 1, 41-44 (1959). [14] Blinov V., Khudiakov G., US Army Translation NTIS No, AD296762, (1961). [15] Koseki H., Natsume Y., Iwata Y., Evaluation of the burning characteristics of vegetable oils in comparison with fuel and lubricating oils, Journal of Fire Sciences, 19, 31-44 (2001). [16] Chow W., Ni X., Experimental evaluation on performance of open kitchen fire suppression systems, Fire Saf. Sci., 11, 1298-311 (2014). [17] Hamins A., Kim S.C., Madrzykowski D., Characterization of stovetop cooking oil fires, Journal of Fire Sciences, 36, 224-39 (2018). [18] Spearpoint M., Hopkin C., Hopkin D., Modelling the thermal radiation from kitchen hob fires, Journal of Fire Sciences, 38, 377-94 (2020). [19] Babrauskas V., Peacock R.D., Heat release rate: the single most important variable in fire hazard, Fire Safety Journal, 18, 255-72 (1992). [20] Zabetakis M.G., Burgess D.S., Research on hazards associated with production and handling of liquid hydrogen., Bureau of Mines, Washington, DC, 1961. [21] Orloff L., De Ris J., Froude modeling of pool fires, Symposium (International) on Combustion, 1982, p, 885-95. [22] Hamins A., Energetics of Small and Moderate-Scale Gaseous Pool Fires, NIST Technical Note TN 1926, National Institute of Standards and Technology, Gaithersburg, MD, 2016. [23] Bryant R., Bundy M., The NIST 20 MW Calorimetry Measurement System for Large-Fire Research. NIST Technical Note TN 2077, National Institute of Standards and Technology, Gaithersburg,MD, Dec. 2019. [24] Omega. The Temperature Handbook, Fifth Edition, Omega Engineering Inc, Stamford, CT, 2004. [25] Mulholland G.W., Johnsson E.L., Fernandez M.G., Shear D.A., Design and testing of a new smoke concentration meter, Fire and Materials, 24, 231-43 (2000). [26] Tewarson A., Combustion efficiency and its radiative component, Fire Safety Journal, 39, 131-41 (2004). [27] Pitts W.M., Lawson J.R., Shields J.R., NIST/BFRL Calibration System for Heat-Flux Gages. Report of Test FR 4014, National Institute of Standards and Technology, Gaithersburg, MD, 6 August 2001. [28] Galbraith Laboratories, Laboratory Reports 117954 and Report 118353, KNoxville, TN, Sept. 30, 2019.
32
This publication is available free of charge from: https://doi.org/10.6028/N
IST.TN.2133
[29] Gravalos I., Gialamas T., Koutsofitis Z., Kateris D., Tsiropoulos Z., Xyradakis P., Georgiades A., Energetic study on animal fats and vegetable oils using combustion bomb calorimeter, J. Agric. Mac. Sci., 4, 69-74 (2008). [30] Dweck J., Sampaio C., Analysis of the thermal decomposition of commercial vegetable oils in air by simultaneous TG/DTA, Journal of Thermal Analysis and Calorimetry, 75, 385-91 (2004). [31] Hurley M., Gottuk D., Hall Jr J., Harada K., Kuligowski E., Puchovsky M., Watts Jr J., WIECZOREK C., SFPE handbook of fire protection engineering, Fifth, National Fire Protection Association Quincy, MA, 2015. [32] Modak A.T., Thermal radiation from pool fires, Combustion and Flame, 29, 177-92 (1977). [33] Brohez S., Marlair G., Delvosalle C., The effect of oxygen concentration on CO and soot yields in fires, Fire and Materials, 32, 141-58 (2008). [34] Mulholland G.W., Croarkin C., Specific extinction coefficient of flame generated smoke, Fire and Materials, 24, 227-30 (2000). [35] Tewarson A., Generation of heat and chemical compounds in fires. SFPE handbook of fire protection engineering. Quincy, MA, National Fire Protection Association 2002, pp, 82-161. [36] Chen J., Zhang X., Zhao Y., Bi Y., Li C., Lu S., Oxygen concentration effects on the burning behavior of small scale pool fires, Fuel, 247, 378-85 (2019). [37] Heskestad G., Luminous heights of turbulent diffusion flames, Fire Safety Journal, 5, 103-08 (1983). [38] Babrauskas V., Ignition Handbook: Principles and Application to Fire Safety Engineering, Fire Investigation, Risk Management and Forensic Science. , Fire Science Publishers, Issaquah, WA, 2003. [39] Drysdale D., An introduction to fire dynamics, Second Edition, John Wiley & Sons, Hoboken, NJ, 2011. [40] Koseki H., Mulholland G., The effect of diameter on the burning of crude oil pool fires, Fire Technology, 27, 54-65 (1991). [41] Köylü Ü.Ö., Sivathanu Y., Faeth G., Carbon monoxide and soot emissions from buoyant turbulent diffusion flames, Fire Saf. Sci., 3, 625-34 (1991). [42] Köylü Ü.Ö., Faeth G.M., Carbon monoxide and soot emissions from liquid-fueled buoyant turbulent diffusion flames, Combustion and Flame, 87, 61-76 (1991). [43] McCaffrey B.J., Harkleroad M., Combustion efficiency, radiation, co and soot yield from a variety of gaseous, liquid, and solid fueled buoyant diffusion flames, Symposium (International) on Combustion, 1989, p, 1251-61. [44] Santos J., Dos Santos I., De Souza A., Prasad S., Dos Santos A., Thermal stability and kinetic study on thermal decomposition of commercial edible oils by thermogravimetry, Journal of Food Science, 67, 1393-98 (2002). [45] Consumer Product Safety Commission (CPSC), Study of technology for detecting pre-ignition conditions of cookng related fire associated with electric and gas ranges: phase III. Consumer Product Safety Commission, Washington, DC, February 1998. [46] Milke J., Zevotek R., Analysis of the response of smoke detectors to smoldering fires and nuisance sources, Fire Technology, 52, 1235-53 (2016). [47] Quintiere J.G., Fundamentals of fire phenomena, John Wiley & Sons, Chichester, England, 2006. [48] Johnsson E., Zarzecki M., Using Smoke Obscuration to Warn of Pre-Ignition Conditions of Unattended Cooking Fires, 16th International Conference on Automatic Fire Detection (AUBE’17) & Suppression, Detection and Signaling Research and Applications Conference (SUPDET 2017), 2017. [49] Taylor B.N., Kuyatt C.E., Guidelines for evaluating and expressing the uncertainty of NIST measurement results, NIST TN-1297, National Institute of Standards and Technology, Gaithersburg, MD, 1994. [50] Taylor J., Introduction to error analysis, the study of uncertainties in physical measurements, Second Edition, University Science Books, Sausalito, CA, 1997. [51] Sung K., Chen J., Bundy M., Fernandez M., Hamins A., The Thermal Character of a 1 m Methanol Pool Fire, NIST Technical Note TN 2083, National Institute of Standards and Technology, Gaithersburg, MD, 2020. [52] Bevington P.R., Robinson D.K., Blair J.M., Mallinckrodt A.J., McKay S., Data reduction and error analysis for the physical sciences, Computers in Physics, 7, 415-16 (1993). [53] UL 858, Standard for Safety for Household Electric Ranges, 2014 Edition and 2017 Revision, Underwriters Laboratories, Northbrook, IL.

33
This publication is available free of charge from: https://doi.org/10.6028/N
IST.TN.2133
7. APPENDIX
7.1 Uncertainty Analysis
In this section, we discuss the measurement uncertainty for the heat release rate, flame height, heat flux, radiative fraction, combustion efficiency, CO and soot yields, and the light-extinction coefficient. The uncertainty generally can be divided into two categories. Type A represents random effects associated with repeat measurements, whereas Type B represents uncertainty evaluated by other means [49]. Estimates of the uncertainty analysis were evaluated by combining Type A and Type B uncertainties unless otherwise stated.
The standard errors of measured parameters, 𝑥𝑥𝑖𝑖 (𝑖𝑖 = 1,2 … . ,𝑁𝑁), are calculated as:
𝑥𝑥𝑖𝑖 = �̅�𝑥𝑖𝑖 ± 𝑢𝑢(𝑥𝑥𝑖𝑖) (A.1)
Here, 𝑢𝑢(𝑥𝑥𝑖𝑖) is the standard absolute uncertainty of the burning parameters measured in this study. �̅�𝑥𝑖𝑖 is the average value of each measured parameter.
The measured parameters usually have a functional relationship with the resultant quantity, 𝑦𝑦 , such that:
𝑦𝑦 = 𝑓𝑓{𝑥𝑥1, 𝑥𝑥2, 𝑥𝑥3, . . , 𝑥𝑥𝑁𝑁} (A.2)
By applying a first order approximation of error propagation theory[49], an estimate of the value 𝑦𝑦� can be expressed as :
𝑦𝑦 = 𝑦𝑦� ± 𝑢𝑢𝑐𝑐(𝑦𝑦) (A.3)
where the combined standard uncertainty (𝑢𝑢𝑐𝑐(𝑦𝑦)) and the combined expanded relative uncertainty (𝑢𝑢𝑐𝑐(𝑦𝑦) 𝑦𝑦�⁄ ) are obtained from Refs. [50, 51]:
𝑢𝑢𝑐𝑐(𝑦𝑦) = ±�∑ �𝜕𝜕𝑓𝑓𝜕𝜕𝑥𝑥𝑖𝑖
𝑢𝑢(𝑥𝑥𝑖𝑖)�2
𝑁𝑁𝑖𝑖=1 (A.4)
𝑈𝑈𝑐𝑐(𝑦𝑦) = 𝑝𝑝 𝑢𝑢𝑐𝑐(𝑦𝑦)𝑦𝑦�
= ±�∑ �𝑠𝑠𝑖𝑖𝑢𝑢(𝑥𝑥𝑖𝑖)�̅�𝑥𝚤𝚤��2
𝑁𝑁𝑖𝑖=1 = ±�∑ �𝑠𝑠𝑖𝑖𝑈𝑈(𝑥𝑥𝑖𝑖)�
2𝑁𝑁𝑖𝑖=1 (A.5)
with 𝑠𝑠𝑖𝑖 = 𝜕𝜕𝑓𝑓𝜕𝜕𝑥𝑥𝑖𝑖
𝑥𝑥𝑖𝑖𝑦𝑦
, which is the non-dimensional sensitivity coefficient. The absolute uncertainty of each
term (𝑢𝑢(𝑥𝑥𝑖𝑖)) in Eq. A.4 was estimated and combined to determine the expanded absolute uncertainty, 𝑢𝑢𝑐𝑐(𝑦𝑦), which was calculated using the weighted-sum method [51, 52]. The coverage factor k was taken as 2 in this study, representing a confidence level of about 95%. Unless otherwise stated, the uncertainties in this study are reported as the combined expanded uncertainty.
7.1.1 Uncertainty of the Heat Release Rate
The heat release rate (HRR) system was carefully calibrated above 100 kW as described in Ref. [17]. Since the HRR in this study was significantly less than 100 kW, calibrations were performed for smaller values (1 kW to 44 kW), using precision mass flow controllers burning 99.9 % pure methane in a 10 cm diameter (outer diameter), water-cooled, brass burner positioned at about the same location as the experimental burner – directly below the center of the exhaust duct and 30 cm above the floor. The duct flow during the calibration was set at about 1 kg/s, matching the value used during the experiments.
The calibration employed two mass flow meters (Alicat and Sierra) with different flow ranges. The instruments had a small overlap region as seen in Fig. A.1. Table A.1 shows the results of the measured

34
This publication is available free of charge from: https://doi.org/10.6028/N
IST.TN.2133
(calorimetry) and calculated (mass flow multiplied by the heat of combustion) heat release rates and the associated combined expanded uncertainty, representing a 95% confidence level. The average uncertainties of the measured HRR during a period of measurement time are approximately 6%, respectively. Figure A.1 shows the calibration results. The slope of the linear fit has a value of about 1.12 with an uncertainty of 2%. This result is used in this study to adjust the calibration found in Ref. [23] for the measured heat release rate.
Table A.1 Measured and calculated heat release rate measurement uncertainty (95% confidence level)
HRR (kW) (calorimetry)
Expanded HRR Uncertainty (%) (calorimetry)
HRR (kW) * (mass flow)
0.93 16 0.95 0.95 16 0.95 3.93 6 3.78 6.63 5 6.17 7.85 4 7.58
13.38 4 12.33 14.18 5 13.51 20.34 4 18.50 27.46 3 24.66 34.51 3 30.83 38.22 3 34.81 48.02 4 43.16
Average: 6 * Expanded HRR (Mass) Uncertainty = 2 %
0 10 20 30 40 50
0
10
20
30
40
50
60
Results of Sierra mass flow meter Results of Alicat mass flow meter Linear fitting
Mea
sure
d H
RR
(kW
)
Calculated HRR (kW)
Calorimetry
Mass flow × heat of combustion
Slope: 1.12
Fig. A.1 Calibration of calorimetry system for low values of the HRR
The calorimetric HRR measurement was divided by a factor of 1.12 to correct for the measurement bias documented in Fig. A1. The uncertainty for the calibration depends on the uncertainties of measurement variance (𝑈𝑈��̇�𝑄𝑎𝑎,𝑣𝑣𝑎𝑎𝑟𝑟�), repeat experiments (𝑈𝑈��̇�𝑄𝑎𝑎,𝑟𝑟𝑒𝑒𝑝𝑝𝑒𝑒𝑎𝑎𝑑𝑑�), slope of the linear fit (2%) (𝑈𝑈��̇�𝑄𝑎𝑎,𝑠𝑠𝑉𝑉𝑜𝑜𝑝𝑝𝑒𝑒�) (see

35
This publication is available free of charge from: https://doi.org/10.6028/N
IST.TN.2133
Fig. A.1) and inherent precision of the mass flow meter (𝑈𝑈��̇�𝑚𝑓𝑓𝑉𝑉𝑜𝑜𝑓𝑓𝑚𝑚𝑒𝑒𝑑𝑑𝑒𝑒𝑟𝑟�) (2%, according to manufacturers’ literature), as shown in Eq. A.6. And the combined relative uncertainty of heat release rate is a combination of the corrected measurement uncertainty 𝑈𝑈��̇�𝑄𝑎𝑎,𝑐𝑐𝑜𝑜𝑟𝑟� and the calibration uncertainty 𝑈𝑈��̇�𝑄𝑎𝑎,𝑐𝑐𝑎𝑎𝑉𝑉�, as estimated in Eq. A.7:
𝑈𝑈��̇�𝑄𝑎𝑎,𝑐𝑐𝑎𝑎𝑉𝑉� = �𝑈𝑈��̇�𝑄𝑎𝑎,𝑣𝑣𝑎𝑎𝑟𝑟�2 + 𝑈𝑈��̇�𝑄𝑎𝑎,𝑟𝑟𝑒𝑒𝑝𝑝𝑒𝑒𝑎𝑎𝑑𝑑�
2+𝑈𝑈��̇�𝑄𝑎𝑎,𝑠𝑠𝑉𝑉𝑜𝑜𝑝𝑝𝑒𝑒�2 + 𝑈𝑈��̇�𝑚𝑓𝑓𝑉𝑉𝑉𝑉𝑓𝑓𝑚𝑚𝑝𝑝𝑡𝑡𝑝𝑝𝑓𝑓�
2 (A.6)
𝑈𝑈𝑐𝑐��̇�𝑄𝑎𝑎� = �𝑈𝑈��̇�𝑄𝑎𝑎,𝑐𝑐𝑜𝑜𝑟𝑟�2 + 𝑈𝑈��̇�𝑄𝑎𝑎,𝑐𝑐𝑎𝑎𝑉𝑉�
2 (A.7)
The additional expanded uncertainty due to this calibration was estimated as a 8% contribution to the total combined expanded HRR uncertainty.
7.1.2 Uncertainty of the Total Radiative Emission (�̇�𝑸𝒓𝒓) due to Heat Flux Uncertainty
The uncertainty of the calibration of the heat flux gauges is 7% according to the manufacturer [27]. Based on Eq. 1, the combined expanded uncertainty of the heat flux was estimated based on measurement 𝑈𝑈��̇�𝑄𝑟𝑟,𝑚𝑚𝑒𝑒𝑎𝑎� and calibration uncertainties 𝑈𝑈��̇�𝑄𝑟𝑟,𝑐𝑐𝑎𝑎𝑉𝑉�:
𝑈𝑈𝑐𝑐��̇�𝑄𝑟𝑟� = �𝑈𝑈��̇�𝑄𝑟𝑟,𝑚𝑚𝑒𝑒𝑎𝑎�2 + 𝑈𝑈��̇�𝑄𝑟𝑟,𝑐𝑐𝑎𝑎𝑉𝑉�
2 = �𝑈𝑈(�̇�𝑞′′)2 + 𝑈𝑈(�̇�𝑞′′𝑐𝑐𝑎𝑎𝑉𝑉)2 (A.8)
Typically, the combined expanded relative uncertainty of the heat flux was on the order of 10 % to 30%. The results are reported in Tables 5 to 7 above.
7.1.3 Uncertainty of the Radiative Fraction and Combustion Efficiency
The method used here to measure the time-averaged radiative fraction is given by Eq. 6. The propagation of relative uncertainty for the radiative fraction is a combination of the uncertainty of the integrated value of the heat release rate (∫ �̇�𝑄𝑟𝑟
𝑑𝑑𝑒𝑒𝑑𝑑0
𝑑𝑑𝑡𝑡) and the uncertainty of the mass of oil consumed (Δ𝑚𝑚), which can be
expressed as:
𝑈𝑈𝑐𝑐(𝜒𝜒𝑟𝑟) = �𝑈𝑈𝑐𝑐 �∫ �̇�𝑄𝑓𝑓𝑡𝑡𝑝𝑝𝑡𝑡0
𝑑𝑑𝑡𝑡�2
+ 𝑈𝑈(Δ𝑚𝑚)2 (A.9)
with
𝑈𝑈𝑐𝑐 �∫ �̇�𝑄𝑓𝑓𝑡𝑡𝑝𝑝𝑡𝑡0
𝑑𝑑𝑡𝑡�2
= �𝑈𝑈�∫ �̇�𝑄𝑓𝑓𝑡𝑡𝑝𝑝𝑡𝑡0
𝑑𝑑𝑡𝑡�2
𝑟𝑟𝑒𝑒𝑝𝑝𝑒𝑒𝑎𝑎𝑑𝑑+ 𝑈𝑈(�̇�𝑞′′𝑐𝑐𝑎𝑎𝑉𝑉)2 (A.10)
Similarly, the propagation of relative uncertainty for the combustion efficiency can also be estimated as:
𝑈𝑈𝑐𝑐(𝜒𝜒𝑎𝑎) = �𝑈𝑈𝑐𝑐 �∫ �̇�𝑄𝑝𝑝𝑡𝑡𝑝𝑝𝑡𝑡0
𝑑𝑑𝑡𝑡�2
+ 𝑈𝑈(Δ𝑚𝑚)2 (A.11)
𝑈𝑈𝑐𝑐 �∫ �̇�𝑄𝑝𝑝𝑡𝑡𝑝𝑝𝑡𝑡0
𝑑𝑑𝑡𝑡�2
= �𝑈𝑈�∫ �̇�𝑄𝑝𝑝𝑡𝑡𝑝𝑝𝑡𝑡0
𝑑𝑑𝑡𝑡�2
𝑟𝑟𝑒𝑒𝑝𝑝𝑒𝑒𝑎𝑎𝑑𝑑+ 𝑈𝑈��̇�𝑄𝑎𝑎,𝑐𝑐𝑎𝑎𝑉𝑉�
2 (A.12)

36
This publication is available free of charge from: https://doi.org/10.6028/N
IST.TN.2133
Typically, the combined expanded relative uncertainty of the radiative fraction and the combustion efficiency was on the order of 15 % and 20 %, respectively. The results are reported in Tables 5 to 7 above.
7.1.4 Uncertainty of the Light-Extinction Coefficient
Eq. 15 shows that the light-extinction coefficient is affected by the uncertainty of the optical length through (L) the smoke and the measurement of the ratio of the transmitted to the incident intensity (𝐼𝐼0 𝐼𝐼⁄ ). The calibrated combined uncertainties of light-extinction coefficient (𝐾𝐾𝑐𝑐𝑎𝑎𝑉𝑉) is 3.2 % [25]. The optical length through the smoke is assumed to be a constant, and equal to the diameter of the duct (0.483 m) with a relative uncertainty of 0.8% [23]. The relative expanded uncertainty of the light-extinction coefficient can be obtained by taking the optical length and the logarithm of the ratio of the intensities𝐼𝐼0 𝐼𝐼⁄ :
𝑈𝑈𝑐𝑐(𝐾𝐾)2 = 𝑈𝑈(𝐿𝐿)2 + 𝑈𝑈𝑐𝑐 �𝑉𝑉𝑙𝑙 �𝐼𝐼0𝐼𝐼��
2= 𝑈𝑈(𝐿𝐿)2 + � 1
𝑉𝑉𝑙𝑙𝐼𝐼�0𝐼𝐼�𝑈𝑈𝑐𝑐 �
𝐼𝐼0𝐼𝐼��
2
+ 𝑈𝑈(𝐾𝐾𝑐𝑐𝑎𝑎𝑉𝑉) (A.13)
The relative uncertainties of the measured incident and transmitted light intensities contribute to the
uncertainty of the ratio �𝑈𝑈𝑐𝑐 �𝐼𝐼0𝐼𝐼��:
𝑈𝑈𝑐𝑐 �𝐼𝐼0𝐼𝐼�2
= 𝑈𝑈𝑐𝑐(𝐼𝐼0)2 + 𝑈𝑈𝑐𝑐(𝐼𝐼)2 = �𝑢𝑢(𝐼𝐼0)2
𝐼𝐼0̅+ 𝑢𝑢(𝐼𝐼)2
𝐼𝐼̅� (A.14)
Propagating the error, the relative combined uncertainties of incident intensity 𝑈𝑈𝑐𝑐(𝐼𝐼0) can be determined considering the variance of repeat measurements, noise, and the uncertainty of the calibration:
𝑈𝑈𝑐𝑐(𝐼𝐼0)2 = 𝑢𝑢(𝐼𝐼0)2
𝐼𝐼0̅= 𝑢𝑢�𝐼𝐼0,𝑟𝑟𝑒𝑒𝑟𝑟𝑒𝑒𝑎𝑎𝑡𝑡�
2
𝐼𝐼0̅2 + ∑ 𝑢𝑢𝑖𝑖�𝐼𝐼0,𝑛𝑛𝑛𝑛𝑖𝑖𝑠𝑠𝑒𝑒�
2
𝐼𝐼0̅,𝑛𝑛𝑛𝑛𝑖𝑖𝑠𝑠𝑒𝑒(𝑖𝑖)2𝑙𝑙𝑖𝑖=1 𝑙𝑙� (A.15)
where 𝑢𝑢�𝐼𝐼0,𝑟𝑟𝑒𝑒𝑟𝑟𝑒𝑒𝑎𝑎𝑡𝑡�2
𝐼𝐼0̅2 is relative the uncertainty of the repeated incident intensity measurements, and the
second term ∑ 𝑢𝑢𝑖𝑖�𝐼𝐼0,𝑛𝑛𝑛𝑛𝑖𝑖𝑠𝑠𝑒𝑒�2
𝐼𝐼0̅,𝑛𝑛𝑛𝑛𝑖𝑖𝑠𝑠𝑒𝑒(𝑖𝑖)2𝑙𝑙𝑖𝑖=1 𝑙𝑙� in Eq. A.15 refers to the average relative uncertainty of the noise of the
incident intensity for the 𝑙𝑙 repeat experiments.
Similar to the combined uncertainties of heat release rate and heat flux, the combined relative transmitted intensity 𝑈𝑈𝑐𝑐(𝐼𝐼) is depend on the uncertainties of measurement and calibration (2.5% [25]), and the uncertainty of measurement includes uncertainties of variance (𝑈𝑈(𝐼𝐼𝑣𝑣)) (5 s running average) and drift values:
𝑈𝑈𝑐𝑐(𝐼𝐼)2 = 𝐼𝐼�̅�𝑏2𝑢𝑢(𝐼𝐼𝑏𝑏)2+𝐼𝐼�̅�𝑚2 𝑢𝑢(𝐼𝐼𝑚𝑚)2
𝐼𝐼4̅+ ∑ 𝑈𝑈𝑖𝑖(𝐼𝐼𝑣𝑣)2𝑙𝑙
𝑖𝑖=1 𝑙𝑙⁄ + 𝑈𝑈(𝐼𝐼𝑐𝑐𝑎𝑎𝑉𝑉)2 (A.16)
Combing Eq. A.13, Eq. A.14, Eq. A.15 and Eq. A.16, the relative expanded uncertainty of light-extinction coefficient can be expressed as:
𝑈𝑈𝑐𝑐(𝐾𝐾) = 𝑢𝑢𝑐𝑐(𝐾𝐾)𝐾𝐾�
= �𝑈𝑈𝑐𝑐(𝐼𝐼0)2+𝑈𝑈𝑐𝑐(𝐼𝐼)2
�𝑉𝑉𝑙𝑙𝐼𝐼�0𝐼𝐼� �
2 + 𝑈𝑈(𝐿𝐿)2 + 𝑈𝑈(𝐾𝐾𝑐𝑐𝑎𝑎𝑉𝑉)2 (A.17)

37
This publication is available free of charge from: https://doi.org/10.6028/N
IST.TN.2133
Typically, the combined expanded relative uncertainty of the maximum light-extinction coefficient was on the order of about 25 %, while the minimum light-extinction coefficient for pre-fire stage was on the order of about 19 % as seen in Table 9.
7.1.5 Uncertainty of Gas and Aerosol Emissions
The CO yield uncertainty depends on the combined expanded uncertainties of the integrated values of the transient CO mass flow rate and the total mass consumed:
𝑈𝑈(𝑌𝑌𝐶𝐶𝐶𝐶) = �𝑈𝑈 �∫ �̇�𝑚𝐶𝐶𝐶𝐶𝑑𝑑𝑡𝑡𝑑𝑑𝑒𝑒𝑑𝑑0
�2
+ 𝑈𝑈(∆𝑚𝑚)2 (A.18)
As indicated in the Eq. 9 and Eq. 10, the mass flow rate of CO was determined by the CO concentration and the volumetric flow rate of the exhaust gas. The combined expanded uncertainty of volumetric flow rate is 5.9 % according to the literature [25]. The relative uncertainty of the CO concentration was estimated to be 3% from the information in the manufacturer. Consequently, the combined expanded uncertainty of CO production (∫ �̇�𝑚𝐶𝐶𝐶𝐶𝑑𝑑𝑡𝑡
𝑑𝑑𝑒𝑒𝑑𝑑0
) can be expressed as:
𝑈𝑈 �∫ �̇�𝑚𝐶𝐶𝐶𝐶𝑑𝑑𝑡𝑡𝑡𝑡𝑝𝑝𝑡𝑡0
� = �𝑈𝑈 �∫ �̇�𝑚𝐶𝐶𝐶𝐶𝑑𝑑𝑡𝑡𝑡𝑡𝑝𝑝𝑡𝑡0
�𝑟𝑟𝑒𝑒𝑝𝑝𝑒𝑒𝑎𝑎𝑑𝑑
2+ 𝑈𝑈��̇�𝑉𝑒𝑒�
2 + 𝑈𝑈(𝑋𝑋𝐶𝐶𝐶𝐶)2 (A.19)
The uncertainty components that affect the smoke yield are the light-extinction coefficient, the specific extinction coefficient, the volumetric flow rate of the exhaust duct and the mass consumed of the fuel. The resulting combined expanded relative uncertainty is given by:
𝑈𝑈(𝑌𝑌𝑠𝑠𝑜𝑜𝑜𝑜𝑑𝑑) = �𝑈𝑈 �∫ 𝐾𝐾�̇�𝑉𝑝𝑝𝜎𝜎𝑠𝑠𝑑𝑑𝑡𝑡𝑑𝑑𝑒𝑒
𝑑𝑑0�2
+ 𝑈𝑈(∆𝑚𝑚)2 (A.20)
The specific extinction coefficient is taken as 8700 m2kg-1 with a relative uncertainty of 5.4% for over-ventilated combustion [25]. And the relative uncertainty of the light-extinction coefficient is reported as 1.6% [25].
Similar to the uncertainty of the CO production, the combined uncertainty of soot production (∫ 𝐾𝐾�̇�𝑉𝑝𝑝𝜎𝜎𝑠𝑠𝑑𝑑𝑡𝑡𝑑𝑑𝑒𝑒
𝑑𝑑0)
can be estimated as:
𝑈𝑈 �∫ 𝐾𝐾�̇�𝑉𝑝𝑝𝜎𝜎𝑠𝑠𝑑𝑑𝑡𝑡𝑑𝑑𝑒𝑒
𝑑𝑑0� = �𝑈𝑈 �∫ 𝐾𝐾�̇�𝑉𝑝𝑝
𝜎𝜎𝑠𝑠𝑑𝑑𝑡𝑡𝑑𝑑𝑒𝑒
𝑑𝑑0�𝑟𝑟𝑒𝑒𝑝𝑝𝑒𝑒𝑎𝑎𝑑𝑑
2+ 𝑈𝑈(�̇�𝑉𝑝𝑝)2 + 𝑈𝑈(𝐾𝐾)2 + 𝑈𝑈(𝜎𝜎𝑠𝑠)
2 (A.21)
The uncertainty of CO/CO2 can be calculated based on the combined uncertainties of CO and CO2
production, where uncertainty of CO2 production has the same expression as CO production, shown in Eq. A19:
𝑈𝑈�𝜂𝜂𝐶𝐶𝐶𝐶 𝐶𝐶𝐶𝐶2⁄ � = �𝑈𝑈�∫ �̇�𝑚𝐶𝐶𝐶𝐶𝑑𝑑𝑡𝑡𝑡𝑡𝑝𝑝𝑡𝑡0
�𝑓𝑓𝑝𝑝𝑝𝑝𝑝𝑝𝑝𝑝𝑡𝑡
2+𝑈𝑈�∫ �̇�𝑚𝐶𝐶𝐶𝐶2𝑑𝑑𝑡𝑡
𝑡𝑡𝑝𝑝𝑡𝑡0
�𝑓𝑓𝑝𝑝𝑝𝑝𝑝𝑝𝑝𝑝𝑡𝑡
2 (A.22)
Based on Eq. 17, the uncertainties of SEA can be estimated as:
𝑈𝑈(𝑆𝑆𝑆𝑆𝑆𝑆) = �𝑈𝑈�∫ 𝐾𝐾�̇�𝑉𝑒𝑒𝑑𝑑𝑒𝑒𝑑𝑑0
�2
+ 𝑈𝑈(∆𝑚𝑚)2 (A.23)

38
This publication is available free of charge from: https://doi.org/10.6028/N
IST.TN.2133
Typically, the combined expanded relative uncertainty of the CO/CO2 was on the order of 10 % as seen in Fig. 12.