the cleveland clinic experience -...
TRANSCRIPT

The Cleveland Clinic Experience Patient Experience Summit
La Crosse, Wisconsin
James Merlino, MDChief Experience Officer

Mr. Jones

Our Culture


• Care for the sick
• Investigate their problems
• Educate those who serve

To act as a unit….

Feb 28, 1921

Cleveland Clinic
• Integrated Health System- Main campus – 1200 beds- 10 regional hospitals- 18 Family Health Centers- Florida, Canada, Las Vegas, Abu
Dhabi, and Egypt• Revenue – $6 Billion• 42,000 Employees

4

85 Year Model
• Group Practice - Doctor ownership - Physician Leadership
• Non-profit – No incentives / No Bonus• Employed physicians
- One year contracts• Innovation / Volume • Clinical Excellence

2005
• New Leadership• What was the key to our
success, would not be the key to our future…..

“Patients First….”

“Providing the highest quality patient experience is a primary goal of the Cleveland Clinic Organization.”
-Delos “Toby” Cosgrove, MD, CEO

Why is this important
• Right thing to do• The way we would want to be treated
- Patient centered care- Family centered care
• Patient’s want it – their “Quality”• Who we are as an enterprise • Government

Harvard

Our Risk
# 4 USNWR…..…..10th percentile CMS
Patients came for expertise – didn’t like us

Experience ?

My patient….• Avg risk Rectal Cancer – 5 day LOS
- 8 Staff Physicians- 18 Departments- 60 nurses (RNs)- Residents / Fellows- RPN / PA / Housekeepers / Meal / PSRs / Nutritionists /
Phlebotomists / Physical Therapists / Radiology techs / Front desk / Service Navigators / Financial Counselors
• What about the family ?

The “360”
Manage the 360 Continuum
DuringBefore After

Patient Experience Journey
Pre-entrancePerception
Pre-patientEntrance
PatientExperience
PostExperience
Culture of Service
ProcessPeople
Patients

“Strategic” Plan
• Improve Patient Experience • Leverage culture change • Advance service and service recovery • Develop consistent PE presence• Advance holistic healing opportunities• Engage patients• Become the industry leader• Advance research

Goal:
Improve Enterprise Patient Experience Metrics
(Process)

Improve Patient Experience
• Focus: HCAHPS (PE brand)• Communication and Education• Full transparency• Key stake holder partners
- Staff / Com. Docs / Nurses / Others • Service Excellence training • HCAHPS Domain focused teams

• Reputation • Doctor Communication• Environment• Nurse Communication• Responsiveness • Pain Management• Medication Communication• Discharge
Improve Patient ExperienceDomain Focused Teams

• Clinical project manager• Consolidated efforts• Best practice driven• Metrics
- Process metric- Outcome metric
Improve Patient ExperienceDomain Focused Teams

EnvironmentQuiet at Night

Elements of the Protocol
• HUSH Champions• Patient expectations flier• HUSH Posters• Announcement at 9:00pm• Doors closed as appropriate • Hallway lights dimmed• Staff are counseled about noise • Floor auditing

Quiet at NightWeston
82.0%
90th

ResponsivenessNurse Communication
• Emphasis on Hourly Rounding• Front line staff education & input• Metrics
- Process - Outcome
• Manager accountability- Audits

48
35
134
0
20
40
60
80
% Response
Always Usually Sometimes Never
Did a Nurse Visit Every 2 Hrs

‘Always’ Rounded
Nurse Always Visited Q2 Hrs
020406080
100
RateHosp
RecHosp
NurseComm
Respnse Pain Med DC

‘Usually’ Rounded
Nurse Usually Visited Q2 Hrs
020406080
100
RateHosp
RecHosp
NurseComm
Respnse Pain Med DC

‘Sometimes’ Rounded
Nurse Sometimes Visited Q2 Hrs
02040
6080
100
RateHosp
RecHosp
NurseComm
Respnse Pain Med DC

‘Never’ Rounded
Nurse Never Visited Q2 Hrs
020406080
100
RateHosp
RecHosp
NurseComm
Respnse Pain Med DC
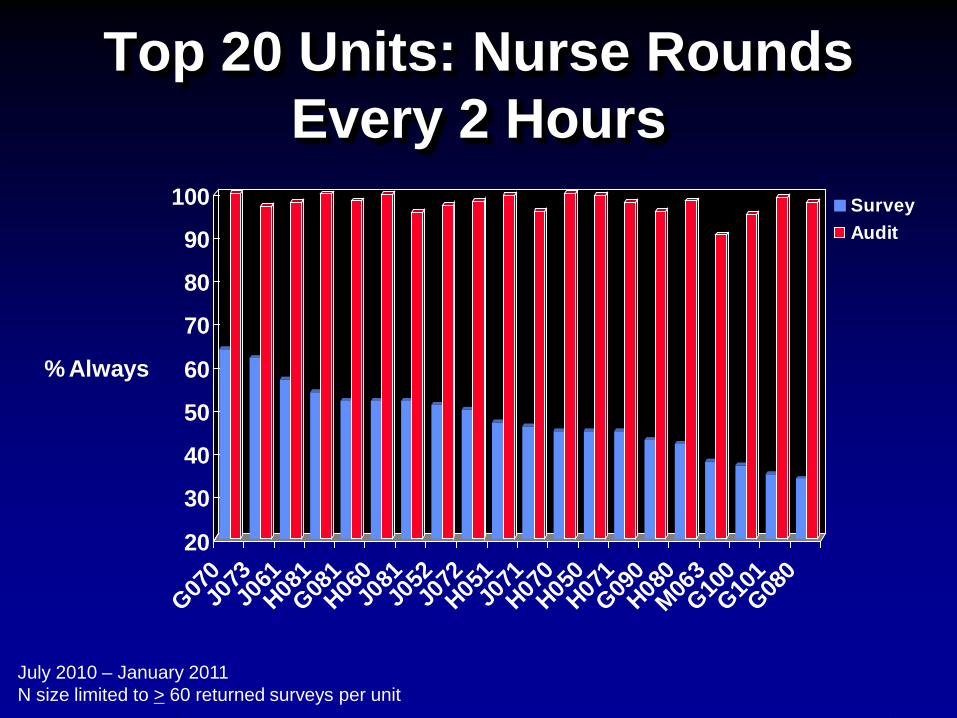
20
30
40
50
60
70
80
90
100
% Always
G070J0
73J0
61H08
1G08
1H06
0J0
81J0
52J0
72H05
1J0
71H07
0H05
0H07
1G09
0H08
0M06
3G10
0G10
1G08
0
SurveyAudit
Top 20 Units: Nurse Rounds Every 2 Hours
July 2010 – January 2011N size limited to > 60 returned surveys per unit

Nursing Plan
• Orientation and on-boarding• Nursing HCAHPS education brochure• Service excellence training• Standardize unit reporting• Regular manager meetings• Process auditing and feedback • Unit mystery shopping

Doctor Communication
• Physician leadership• Score transparency• Complaint transparency• Verbatim analytics• Task force
- How do we “teach” improvement ?• Communication Champions
- Peer physician coaches• Communication “guide”• House staff

ID NAME NDOC COMM Respect Listen Explain RATING
RECOMMEND
1 23 76.47 90.91 73.91 65.22 73.91 82.61
2 84 77.29 89.29 73.49 69.05 77.11 84.34
3 45 87.41 91.11 91.11 80.00 77.27 86.67
4 1 100.00 100.00 100.00 100.00 100.00 100.00
5 104 84.94 90.38 78.85 85.58 73.08 84.47
6 18 84.62 94.12 82.35 77.78 76.47 88.89
7 91 81.55 89.01 77.53 78.02 77.78 80.22
8 26 76.62 80.77 73.08 76.00 69.23 80.77
9 47 78.01 87.23 74.47 72.34 73.91 82.61
10 87 78.16 86.21 74.71 73.56 75.86 83.72
11 105 80.32 85.71 78.10 77.14 75.24 89.52
12 39 84.62 94.87 79.49 79.49 79.49 82.05
13 99 72.54 82.47 69.70 65.66 67.68 84.54
14 59 76.00 82.76 77.59 67.80 75.86 84.75
15 78 81.90 89.74 79.22 76.62 79.49 89.74
16 3 100.00 100.00 100.00 100.00 100.00 100.00

DDI PhysiciansDoctor communication vs. Hospital rating
9080706050403020
90
80
70
60
50
40
Rating
DO
C C
OM
M
Natl Avg = 64%
Natl A
vg = 80%
56
55
54
53
52
51
50
49
48
47
46
45
44
43
42
41
40
39
38
37
36
35
34
33
32
31
30
29
28
27
26
25
24
23
22
21
20
19
18
17
1615
14
13
12
1110
9
8
76
5
4
3
2
1
g y
'n' of DDI Physicians with > 5 '09 surveys returned = 56
Good doctorBad hospital rating
Low CommunicationLow RatingLow Reputation
Poor Doctor CommunicationHigh Hospital Rating

Verbatim AnalysisOthers
4%
Listening10%
/ InternsResidents
5%
Explain19%
Coordination25%Dr Access
25%
Compassion / Respect
12%

Coordination
“The Clinic is too big! Dr. skill is excellent, but they don’t communicate between themselves. Each Dr. tells me a different thing. There is no one Dr. in charge to review orders from all of the other Dr.’s. You must develop a method of ‘Dr. in charge.’”
Respect: Usually Listen: Usually Explain: Usually
“This team runs like a well oiled machine. Communication between staff members is key and was demonstrated positively every day. I couldn’t have been more satisfied w/ my stay or care. CC is my recommendation to anyone in need of the best medical care. Thank you.”
Respect: Always Listen: Always Explain: Always
Coordination25%

Goal:
Leverage Culture Change(People)

Enterprise Goals
Employee Experience (Culture)
Safety Quality
• Patient Safety Indicators• Readmission Rates
• Hospital Acquired Infections• Engagement Scores
• Core Measures• HCAHPS
PatientExperience

Can a Culture be Changed ?

Current State

Culture
Patients
Employees NursesDoctorsCaregivers

• Safety• Quality• Patient experience• Value
Patients First….

“Our” Initiative
• We are culture centric• Designed by us!• Focus groups across the
organization• Consultants• How to sustain ?

Path to Culture Change
• Communication is critical• Message must be razor focused• Managers / leaders are foundation• Talent Management Lifecycle • No one excluded• Zero Tolerance

“Cleveland ClinicExperience”

Staff
Managers
Everyone else
HOOK
AllCaregivers
Mission, vision, valuesPatient ExperienceExpected Behaviors
Service Recovery
Cleveland Clinic Experience
T H E E X P E R I E N C E
“Owners”You are RespectedMust Lead by example - Model Role of the LeaderReinforce Serving LeaderTeach EngagementAccountabilityResponsible to Sustain the ChangeRecognizing you !Why we are all “Caregivers”
Learning Map

Staff
Employees
Managers
Process Flows
Leading the Way
Coaching forOutstandingPerformance
Exploring theCleveland
Clinic(Learning Map)

Leverage the CultureCleveland Clinic Experience
• Mission, Vision, and Values• Desired service behaviors• Service recovery (HEART)• Serving Leader • Link us to our values

Why a Learning Map
• Visual representation of ideas• Tool to drive content• How We Learn (Interactive)
- 10 % of what they read- 50 % of what they see- 90 % Hands-on / Interact / Discuss


In Regards to the Experience…
…Where are you right now?
Before After

By the numbers….
• 41,000 Completed• Las Vegas, Weston, Toronto• CCAD / SKMC• 174,000 Employee hours• 28,000 manager hours• 92% average satisfaction metric

Sustainability
ClevelandClinic
Experience
Patient Partnerships
Processes
Manager Competency
New Employee Orientation
Constant Reinforcement
Hospital wide Leadership Rounding
Engagement / Accountability

Goal:
Engage Patients(People)

Hospitals

Patient’s role ?

Listening to the Patient’s needs
• Complementary services for patients- Massage- Reiki- Healing touch- Spiritual care- Aromatherapy

Managing Patient Concerns
• Top 5 issues resolved at the bedside:
- Communication- Lost Belongings - Staff Responsiveness- Cleanliness- Pain Control

Listening to patients to improve
• Voice of the Patient Advisory Council
SuggestGuideDiscuss

“Reasonable” Expectations
• Private rooms• A “Quiet” Environment• “We” push information
- What is the patient responsibility ?• Understanding “their” care• Personal responsibility• How long should they stay ?

Patient as “Partner”
“One that is united with another in an activity of common interest”

What it means to partner
• As important as me• Engagement (pay attention)
- Safety- Medications- Other
• Ask questions• Communicate / research• Assign an “advocate”• More than just customer

Can Expectations be a tool ?

Caregiver Role• Given: Quality of care
• Discuss what to expect• Define their “role” as a patient• How to communicate• What “Quiet” means• The limitations of pain management• How caregivers respond• What “partnership” means

Clinic Pilot
• Communication• Medication mgt• Pain Management• Quiet• Cleanliness• Responsiveness
?

HCAHPS Doctor Communication
30
40
50
60
70
80
90
100
%
(% Always)
Viewed Emmi ProgramDid Not View Emmi Program90th Percentile

HCAHPS Medication Communication
30
40
50
60
70
80
90
100
%
(% Always)
Viewed Emmi ProgramDid Not View Emmi Program90th Percentile

HCAHPS Quiet @ Night
30
40
50
60
70
80
90
100
%
(% Always)
Viewed Emmi ProgramDid Not View Emmi Program90th Percentile

HCAHPS Room Cleanliness
30
40
50
60
70
80
90
100
%
(% Always)
Viewed Emmi ProgramDid Not View Emmi Program90th Percentile

HCAHPS Staff Response
30
40
50
60
70
80
90
100
%
(% Always)
Viewed Emmi ProgramDid Not View Emmi Program90th Percentile

Are we Improving ?

Rate Hospital
82
50
60
70
80
90
100
Q2 07Q1 08
Q3 07Q2 08
Q4 07Q3 08
Q1 08Q4 08
Q2 08Q1 09
Q3 08Q2 09
Q4 08Q3 09
Q1 09Q4 09
Q2 09Q1 10
Q3 09Q2 10
2011YTD
CMS Reported Scores
% 9 or 10
MayoMass GenJohns HopkinsUCLACCNatn'l Avg

Hospital Recommendation
85
50
60
70
80
90
100
Q2 07Q1 08
Q3 07Q2 08
Q4 07Q3 08
Q1 08Q4 08
Q2 08Q1 09
Q3 08Q2 09
Q4 08Q3 09
Q1 09Q4 09
Q2 09Q1 10
Q3 09Q2 10
2011YTD
CMS Reported Scores
% Yes Definitely
MayoMass GenJohns HopkinsUCLACCNatn'l Avg

Nurse Communication
81
50
60
70
80
90
100
Q2 07Q1 08
Q3 07Q2 08
Q4 07Q3 08
Q1 08Q4 08
Q2 08Q1 09
Q3 08Q2 09
Q4 08Q3 09
Q1 09Q4 09
Q2 09Q1 10
Q3 09Q2 10
2011YTD
CMS Reported Scores
% AlwaysMayo (2)Mass Gen (5)Johns Hopkins (1)UCLA (3)CC (4)Natn'l Avg

Doctor Communication
83
50
60
70
80
90
100
Q2 07Q1 08
Q3 07Q2 08
Q4 07Q3 08
Q1 08Q4 08
Q2 08Q1 09
Q3 08Q2 09
Q4 08Q3 09
Q1 09Q4 09
Q2 09Q1 10
Q3 09Q2 10
2011YTD
CMS Reported Scores
% AlwaysMayo (2)Mass Gen (5)Johns Hopkins (1)UCLA (3)CC (4)Natn'l Avg

Meds Communication
65
50
60
70
80
90
100
Q2 07Q1 08
Q3 07Q2 08
Q4 07Q3 08
Q1 08Q4 08
Q2 08Q1 09
Q3 08Q2 09
Q4 08Q3 09
Q1 09Q4 09
Q2 09Q1 10
Q3 09Q2 10
2011YTD
CMS Reported Scores
% AlwaysMayo (2)Mass Gen (5)Johns Hopkins (1)UCLA (3)CC (4)Natn'l Avg

Pain Management
73
50
60
70
80
90
100
Q2 07Q1 08
Q3 07Q2 08
Q4 07Q3 08
Q1 08Q4 08
Q2 08Q1 09
Q3 08Q2 09
Q4 08Q3 09
Q1 09Q4 09
Q2 09Q1 10
Q3 09Q2 10
2011YTD
CMS Reported Scores
% Always
Mayo (2)Mass Gen (5)Johns Hopkins (1)UCLA (3)CC (4)Natn'l Avg

Cleanliness
72
50
60
70
80
90
100
Q2 07Q1 08
Q3 07Q2 08
Q4 07Q3 08
Q1 08Q4 08
Q2 08Q1 09
Q3 08Q2 09
Q4 08Q3 09
Q1 09Q4 09
Q2 09Q1 10
Q3 09Q2 10
2011YTD
CMS Reported Scores
% Always
Mayo (2)Mass Gen (5)Johns Hopkins (1)UCLA (3)CC (4)Natn'l Avg

Discharge Instructions and Care
88
50
60
70
80
90
100
Q2 07Q1 08
Q3 07Q2 08
Q4 07Q3 08
Q1 08Q4 08
Q2 08Q1 09
Q3 08Q2 09
Q4 08Q3 09
Q1 09Q4 09
Q2 09Q1 10
Q3 09Q2 10
2011YTD
CMS Reported Scores
% YesMayo (2)Mass Gen (5)Johns Hopkins (1)UCLA (3)CC (4)Natn'l Avg

Patient and Employee Experience
0
10
20
30
40
50
60
70
2008 2009 2010 2011
Percentile
01,0002,0003,0004,0005,0006,0007,0008,0009,00010,000
Complaints
Gallup Engagement HCAHPS RatingHCAHPS Recommend Complaints
CCHS

Goal:
Research

Case Mix
0.00
0.50
1.00
1.50
2.00
2.50
CC (4) UCSF (7) Mayo (2) Johns Hopkins (1)
Hospital
Val
ue Series1
Series2
Sickest Patients in the USMedicare Severity of Illness
UCLAPenn
DukeBrigham
NY
Mass
Barnes

50 % of Patients 3 or 4 Severity
3.174.21
6.83
16.4
02468
1012141618
1 2 3 4
Leng
th o
f Sta
y
Severity of Illness Classification

Staff Responsiveness by SOI
57%
52%49%
42%
35%
40%
45%
50%
55%
60%
65%
1 2 3 4
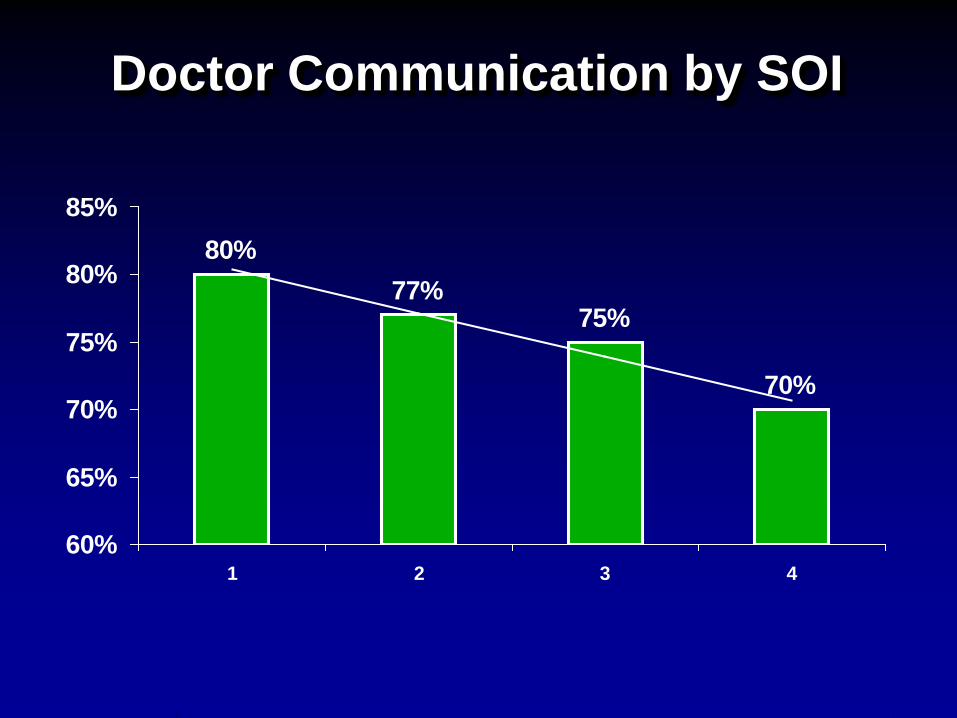
Doctor Communication by SOI
80%77%
75%
70%
60%
65%
70%
75%
80%
85%
1 2 3 4

‘Always’ Rounded
Nurse Always Visited Q2 Hrs
020406080
100
RateHosp
RecHosp
NurseComm
Respnse Pain Med DC

Nurse ‘Always’ Rounded by Severity
40
50
60
70
80
90
100
% Always or Yes
RN Comm
DR Comm
Pain m
gmt
Staff R
esponse
Quiet @
Night
Med C
omm
SOI 1 SOI 2SOI 3SOI 4
HCAHPS Domain MeasuresScores @ 90th Natn'l Percentile

40
60
80
100
% 'Always'
MDCommunication
RN Comm Staff Response Pain Mgmt
Main CampusIsolation Patients
Isolation and HCAHPSIsolation and HCAHPSIsolation and HCAHPS

Depression and HCAHPS
0
20
40
60
80
100
% Top Box
NoDepression
MildDepression
SevereDepression
Rating
Recommend
Dr Communication
Nrs Communication

40
60
80
100
% Always
0-200 201-499 500-799 800-1200 1201+
MaxAvg Nat'l 90th Percentile
Doctor Communicationby Bed Size

Summary
• Experience is Right – “True North”• Transparency is an important “lever”• Reimbursement link is perverse• Metrics that hospitals control• Limit of “Patient-Centeredness”• All hospitals are not the same
- Robust adjustment is necessary


Mr. Jones
