the combined effect of modulator imbalances and amplifier...
TRANSCRIPT

TMO Progress Report 42-137 May 15, 1999
The Combined Effect of Modulator Imbalances andAmplifier Nonlinearity on the Performanceof Offset Quadrature-Phase-Shift-Keyed
(OQPSK) SystemsH. Tsou1
Imbalances from imperfect phase modulators can cause distorted signal constel-lations and interfering tone signals at the carrier frequency in phase-modulatedcommunication systems. The rendered imperfection in the modulated signal in-evitably degrades the receiver’s carrier-tracking performance and, for quadrature-phase-shift-keyed (QPSK) systems in particular, causes cross-talk between the in-phase and quadrature-phase channels. Previous studies have analyzed the impactfrom the amplitude and phase imbalances on an offset QPSK (OQPSK) communi-cation system with the assumption of a linear channel. This article extends suchefforts by including a fully saturated radio-frequency (RF) amplifier in the analyt-ical model. Both carrier-suppression level and bit-error performance are addressedin this article, showing that the amplifier nonlinearity greatly alleviates the impactfrom modulator imbalances. With current Consultative Committee for Space DataSystems (CCSDS) recommendations of a 2-deg-maximum permissible phase imbal-ance and a 0.2-dB-maximum permissible amplitude imbalance, a 34-dB or morecarrier suppression and a system degradation of 0.27 dB or less at an uncoded bit-error probability of 10−4 are achievable when the OQPSK system is operated in areasonable loop signal-to-noise ratio (SNR) region. These results are 9-dB better interms of carrier suppression and 0.6-dB better in terms of system degradation thanthose with linear amplifiers at the aforementioned bit-error probability.
I. Introduction
Imbalances from imperfect phase modulators can cause distorted signal constellations and spuriouscarrier signals in phase-modulated communication systems. The rendered imperfection in the modulatedsignal inevitably degrades the receiver’s carrier-tracking performance and, for quadrature-phase-shift-keyed (QPSK) systems in particular, causes cross-talk between the in-phase (I) and quadrature-phase(Q) channels. Moreover, the presence of a spurious carrier signal raises the concern of a spectral lineexceeding the power-flux density limit on the Earth’s surface for space applications.
A previous article [1] analyzed the impact from the amplitude and phase imbalances on the offsetQPSK (OQPSK) system with the assumption of a linear channel and an imperfect balanced modulatormodel. The balanced modulator [2], which comprises two amplitude-modulation (AM) modules, is widely
1 Communications Systems and Research Section.
1

used in phase-modulated communication systems. However, in practice, the balance between these AMmodules is difficult to maintain perfectly, resulting in amplitude and phase imbalances in the modulatedsignal when such an imperfect modulator is used to modulate data directly onto the radio-frequency (RF)carrier.
This article extends the previous effort to nonlinear channels by including a fully saturated RF amplifierin the analytical model. It is assumed that, when no modulator imbalance exists, each OQPSK symbol iscomprised of two independent information bits of equal bit rate and energy. The modulator imbalances,including both the interchannel and the intrachannel amplitude and phase imbalances, are specified byusing the same balanced modulator model as the one used before. The resulting imperfectly modulatedOQPSK signal first is passed through a highly saturated RF amplifier modeled by a bandpass hard limiterand then coherently demodulated by using the carrier reference derived from a modified IQ(Q2−I2)-typeQPSK carrier-tracking loop.
Section II describes the system model, including the imperfect OQPSK modulator and the bandpasshard limiter. The combined effects of modulator imbalances and amplifier nonlinearity on the carrier-suppression level and the irreducible carrier-tracking error are discussed in Sections III and IV. Thebit-error-rate (BER) performance for various combinations of amplitude and phase imbalances within themaximum permissible imbalance figures currently recommended by the Consultative Committee for SpaceData Systems (CCSDS) [3] are evaluated in Section V, followed by a conclusion in Section VI summarizingthe worst-case carrier-suppression level and BER performance expected with the recommended maximumpermissible modulator imbalances. Finally, alternative models of OQPSK modulator imbalances and theirrelationships with the balanced modulator model are included in the Appendix.
II. System Model
The block diagram of an OQPSK transmitter implemented with two balanced modulators, each con-sisting of two AM modules, followed by a nonlinear RF amplifier modeled by a bandpass hard limiter isshown in Fig.1. For each balanced modulator, the equally probable, nonreturn-to-zero, binary data arefed into its two AM modules, one of them receiving the data stream with inverted polarity. For perfectlybalanced AM modules, the AM signals subtract to form a binary-phase-shift-keyed (BPSK) signal withthe unmodulated carrier completely suppressed. However, with the presence of modulator imbalances,the modulated OQPSK signal becomes
So(t) =√P [(α1 cosωct+ δ1 sinωct) +m1(t)(β1 cosωct− γ1 sinωct)]
+√P
[(α2 sinωct− γ2 cosωct) +m2
(t− Ts
2
)(β2 sinωct+ γ2 cosωct)
](1)
or, equivalently,
So(t) =√P
[α1 + β1m1(t)− γ2
(1−m2
[t− Ts
2
])]cosωct
+√P
[α2 + β2m2
(t− Ts
2
)+ δ1 − γ1m1(t)
]sinωct (2)
where P is twice the power found in the I-channel;2 Ts is the symbol duration; m1(t) and m2(t) arebinary data for the I-channel and the Q-channel, respectively; and the coefficients are defined as follows:
2 It also is designated as the nominal total power for both channels. The actual combined power is P ([1 + Γ2]/2) ≤ P , withthe assumption that the Q-to-I power ratio is Γ ≤ 1.
2

AMMODULATOR
NRZ DATASOURCE #2
Q-CHANNEL BALANCED MODULATOR
HALF-SYMBOLDELAY
AMMODULATOR
90 deg
INVERTER
HARDLIMITER
BANDPASSFILTER
NONLINEAR AMPLIFIER
AMMODULATORINVERTER
AMMODULATOR
NRZ DATASOURCE #1
I-CHANNEL BALANCED MODULATOR
-
-
LOCALOSCILLATOR
Fig. 1. The OQPSK transmitter model.
α1 =(1− Γ1 cos ∆θ1) cos ∆θ + Γ1 sin ∆θ1 sin ∆θ
2
α2 = Γ(
1− Γ2 cos ∆θ2
2
)
β1 =(1 + Γ1 cos ∆θ1) cos ∆θ − Γ1 sin ∆θ1 sin ∆θ
2
β2 = Γ(
1 + Γ2 cos ∆θ2
2
)
γ1 =(1 + Γ1 cos ∆θ1) sin ∆θ + Γ1 sin ∆θ1 cos ∆θ
2
γ2 = Γ(
Γ2 sin ∆θ2
2
)
δ1 =−(1− Γ1 cos ∆θ1) sin ∆θ + Γ1 sin ∆θ1 cos ∆θ
2
(3)
where
3

Γ = the interchannel amplitude imbalance or, equivalently, the square root of the Q-to-I powerratio between channels
Γ1,Γ2 = the amplitude imbalances within each of the I-channel and Q-channel balanced modula-tors, respectively
∆θ = the interchannel phase error defined as the phase deviation from the ideal 90-deg sepa-ration between the I-channel and the Q-channel
∆θ1,∆θ2 = the phase imbalances within each of the I-channel and Q-channel balanced modulators,respectively
Both the spurious carrier components and the cross-talk between channels are clearly shown in Eq. (2).Figure 2(a) shows the phasor representation of the resulting spurious carrier signal and the I-channel andQ-channel BSPK signals. The actual OQPSK symbols on the phasor diagram are the vector sum of thesethree components and are shown in Fig. 2(b).
The nonlinear RF amplifier operated at saturation can be modeled as a bandpass hard limiter [4],which is assumed to be ideal with the hard limiter clipping its input signal at levels of ±
√2P1(π/4) and
the bandpass filter removing all the harmonics but the one at the carrier frequency. By using Eq. (A-1)in the Appendix, it is easily shown that the resulting bandpass hard-limited OQPSK signal is a constant-envelope signal in the form of
So(t) =√
2P1 cos [ωct+ θd(t)] (4)
where P1 = P (β21 + γ2
1) is twice the power actually allocated for the I-channel data modulation and
θd(t) = tan−1
(γ1
β1
)− tan−1
Gm2
[t− Ts
2
]cos ∆θ +A cosψ
m1(t) +Gm2
[t− Ts
2
]sin ∆θ +A sinψ
(5)
is the OQPSK symbol phase profile3 with
G =
√β2
2 + γ22
β21 + γ2
1
A =
√(α1 − γ2)2 + (α2 + δ1)2
β21 + γ2
1
∆θ = tan−1
(γ2
β2
)− tan−1
(γ1
β1
)
ψ = tan−1
(α1 − γ2
α2 + δ1
)− tan−1
(γ1
β1
)
(6)
3 Equation (5) gives the principal value of the symbol phase at a given time. Adding π to some of these principal values isrequired to place each symbol correctly into its appropriate quadrant.
4

(b)
1
GG1GG2
Dq2Dq
Dq1
(a)
IN-PHASE SIGNAL
QUADRATURE-PHASE SIGNAL
INTERFERING TONES
QUADRIPHASE SYMBOLS
HARD-LIMITED SYMBOLS
Fig. 2. The phasor diagrams of (a) the individual BPSK signals and the spurious carrier tone signal, (b) thequadriphase symbols for linear channels, and (c) the hard-limited quadriphase symbols for nonlinearchannels. (Note that Fig. 2(a) does not have the same scale as the others.)
(c)
The four possible values of θd(t), denoted by θ1,1, θ1,−1, θ−1,−1, and θ−1,1, are determined by the databits as shown in Table 1. Figure 2(c) shows the relationship between the OQPSK symbols on the phasordiagram with and without the hard limiter. The inner and outer circles have radii
√P and
√2P1,
respectively. Note that P1 ≈ P for small modulator imbalances.
The Appendix shows an alternative modulator imbalance model with the commonly specified dc-biasterms in the I- and Q-channels. However, this alternative model is not as flexible as the currently usedbalanced modulator model. Translations between the two models are included in the appendix.
5

Table 1. The possible values of qd (t ).
m1(t) m2
(t− Ts
2
)θd(t) Remarks
1 1 θ1,1 = tan−1
(γ1
β1
)− tan−1
(G cos ∆θ +A cosψ
1 +G sin ∆θ +A sinψ
)θ1,1 ≈ −
π
4
−1 −1 θ−1,−1 = tan−1
(γ1
β1
)− tan−1
(G cos ∆θ −A cosψ
1 +G sin ∆θ −A sinψ
)+ π θ−1,−1 ≈
3π
4
1 −1 θ1,−1 = tan−1
(γ1
β1
)− tan−1
( −G cos ∆θ +A cosψ
1−G sin ∆θ +A sinψ
)θ1,−1 ≈
π
4
−1 1 θ−1,1 = tan−1
(γ1
β1
)− tan−1
( −G cos ∆θ −A cosψ
1−G sin ∆θ −A sinψ
)+ π θ−1,1 ≈
5π
4
III. Carrier-Suppression Level
The spurious carrier signal resulting from the modulator imbalances is a signal component that remainsconstant when data bits change. On the phasor diagram [e.g., see Fig. 2(b)], the spurious carrier signalis the average of all four OQPSK symbol vectors. The square of this vector’s length gives the spuriouscarrier power, which can be put into the form of (2P1)η with
η =(
cos θ1,1 + cos θ1,−1 + cos θ−1,1 + cos θ−1,−1
4
)2
+(
sin θ1,1 + sin θ1,−1 + sin θ−1,1 + sin θ−1,−1
4
)2
(7)
being referred to as the carrier suppression level.
Table 2 lists the carrier-suppression levels calculated for various combinations of worst-case OQPSKmodulator imbalances, which are recommended by the CCSDS as 2 deg for phase imbalance and 0.2 dBfor amplitude imbalance. The resulting carrier-suppression level actually varies in a range approximatelyfrom −34 to −51 dB for these listed cases. This range is about 9-dB lower (or better) than that found ina linear channel.
Table 2. Carrier-suppression levels under various combinations of modulatorimbalances (the I/Q power ratio is 0 dB for level-A and 0.4 dB for level-B).
Carrier Carrier∆θ, Γ1, ∆θ1, Γ2, ∆θ2,
suppression suppressiondeg dB deg dB deg
level-A, dB level-B, dB
0 0 0 0 0 −∞ −331.1330
0 −0.2 2 −0.2 2 −36.8006 −36.4290
0 −0.2 2 0 2 −44.0931 −43.4516
0 0 2 −0.2 2 −36.0347 −35.8117
0 0 2 0 2 −41.1835 −41.1560
0 −0.2 2 −0.2 −2 −34.0511 −34.0458
0 −0.2 2 0 −2 −36.0875 −36.3197
0 0 2 −0.2 −2 −36.0875 −35.8524
6

Table 2 (contd)
Carrier Carrier∆θ, Γ1, ∆θ1, Γ2, ∆θ2,
suppression suppressiondeg dB deg dB deg
level-A, dB level-B, dB
0 0 2 0 −2 −41.1835 −41.1546
0 −0.2 −2 −0.2 2 −49.9216 −49.9413
0 −0.2 −2 0 2 −44.4632 −43.8175
0 0 −2 −0.2 2 −44.4632 −45.1554
0 0 −2 0 2 −41.1835 −41.1572
0 −0.2 −2 −0.2 −2 −36.8006 −37.1979
0 −0.2 −2 0 −2 −36.0347 −36.2547
0 0 −2 −0.2 −2 −44.0931 −44.7807
0 0 −2 0 −2 −41.1835 −41.1560
2 −0.2 2 −0.2 2 −36.9909 −36.6216
2 −0.2 2 0 2 −44.4632 −43.8175
2 0 2 −0.2 2 −35.9744 −35.7630
2 0 2 0 2 −41.1835 −41.1572
2 −0.2 2 −0.2 −2 −34.2197 −34.2135
2 −0.2 2 0 −2 −36.1327 −36.3778
2 0 2 −0.2 −2 −36.1327 −35.8849
2 0 2 0 −2 −41.1835 −41.1531
2 −0.2 −2 −0.2 2 −51.1122 −51.1171
2 −0.2 −2 0 2 −44.0931 −43.4516
2 0 −2 −0.2 2 −44.0931 −44.7807
2 0 −2 0 2 −41.1835 −41.1560
2 −0.2 −2 −0.2 −2 −36.9909 −37.3846
2 −0.2 −2 0 −2 −35.9744 −36.1830
2 0 −2 −0.2 −2 −44.4632 −45.1554
2 0 −2 0 −2 −41.1835 −41.1572
−2 −0.2 2 −0.2 2 −36.6055 −36.2313
−2 −0.2 2 0 2 −43.7332 −43.0946
−2 0 2 −0.2 2 −36.0875 −35.8524
−2 0 2 0 2 −41.1835 −41.1546
−2 −0.2 2 −0.2 −2 −33.8801 −33.8757
−2 −0.2 2 0 −2 −36.0347 −36.2547
−2 0 2 −0.2 −2 −36.0347 −35.8117
−2 0 2 0 −2 −41.1835 −41.1560
−2 −0.2 −2 −0.2 2 −48.8385 −48.8668
−2 −0.2 −2 0 2 −44.8441 −44.1932
−2 0 −2 −0.2 2 −44.8441 −45.5423
−2 0 −2 0 2 −41.1835 −41.1583
−2 −0.2 −2 −0.2 −2 −36.6055 −37.0065
−2 −0.2 −2 0 −2 −36.0875 −36.3197
−2 0 −2 −0.2 −2 −43.7332 −44.4178
−2 0 −2 0 −2 −41.1835 −41.1546
7

IV. Irreducible Carrier-Tracking Error
To track the suppressed carrier of an OQPSK signal by the generalized IQ(Q2− I2)-type Costas loopshown in Fig. 3, the received signal, given in Eq. (4), first is mixed with the I-arm and Q-arm referencesignals, i.e.,
√2 cos(ωct− φ) and −
√2 sin(ωct− φ), with φ being the error in the estimated carrier phase.
Each of the resulting signals then is passed through an integrate-and-dump (I&D) filter, which is assumedto be driven by a perfectly synchronized symbol-timing clock, rendering the I&D filter outputs
V1 =√P1
2
[cos(θ
(1)d + φ
)+ cos
(θ
(2)d + φ
)]+
1Ts
∫ Ts
0
n(t)√
2 cos(ωct− φ)dt
V2 =√P1
2
[cos(θ
(2)d + φ
)+ cos
(θ
(3)d + φ
)]− 1Ts
∫ 3Ts/2
Ts/2
n(t)√
2 sin(ωct− φ)dt
(8)
where θ(j)d is the symbol phase in the interval (j − 1)Ts/2 ≤ t ≤ jTs/2 and n(t) is a zero-mean white
Gaussian noise with a two-sided power spectral density of No/2 W/Hz. Note that the timings for the I&Dfilters on the I- and Q-channels are offset by Ts/2. Table 3 lists all sixteen possible paths for OQPSKsymbol phase transitions in three consecutive (Ts/2) intervals. These paths are equally probable forindependent and balanced binary data sources.
The loop-error signal, denoted as Zo, of the generalized Costas loop is formulated as
Zo = −V1V2(V 21 − V 2
2 ) (9)
VCOLOOP
FILTER
DEMODULATEDBITS
( )2V2
HALF-SYMBOLDELAY
90 deg
-
INTEGRATEAND DUMP
INTEGRATEAND DUMP
V1( )2
HARDLIMITER
HARDLIMITER
Fig. 3. The generalized Costas loop for OQPSK carrier tracking.
8

Table 3. All possible paths for OQPSKsymbol phase transitions in three con-secutive ( Ts / 2) intervals.
θ(1)d
−→ θ(2)d
−→ θ(3)d
θ1,1 −→
θ1,1 −→
{θ1,1θ−1,1
θ1,−1 −→{θ1,−1
θ−1,−1
θ−1,−1 −→
θ−1,−1 −→
{θ−1,−1
θ1,−1
θ−1,1 −→{θ−1,1
θ1,1
θ1,−1 −→
θ1,−1 −→
{θ1,−1
θ−1,−1
θ1,1 −→{θ1,1θ−1,1
θ−1,1 −→
θ−1,1 −→
{θ−1,1
θ1,1
θ−1,−1 −→{θ−1,−1
θ1,−1
Carrying out the average of Zo over the noise and the phase transitions θ(j)d , j = 1, 2, 3 and equating
to zero the averaged error signal, one can solve for the irreducible phase error, denoted as φo, of thiscarrier-tracking loop. This irreducible phase error is the negative of the steady-state lock point whenthe carrier-tracking loop has infinite loop SNR. It turns out that the closed-form solution of such ageneralized Costas loop is very involved, including all six arguments (i.e., Γ, Γ1, Γ2, ∆θ, ∆θ1, and ∆θ2)and, in general, can be solved only numerically.
V. Bit-Error Performance
The error performance is determined by the average BER associated with the demodulated bit streams.It is analyzed by first finding the conditional bit-error probability, Pb(φ), for a given carrier-trackingerror, φ, and then averaging it over the probability density function of the phase error, denoted as p(φ),as characterized by the carrier-tracking loop.
For uncoded OQPSK signals, making hard decisions on V1 and V2 in Eq. (8) produces the detectedI-channel and Q-channel data bits, respectively. It can be shown that the conditional bit-error probabil-ities associated with these decisions are
Pb,1(φ) =12
erfc
(12
√P1TsNo
∣∣∣cos(θ
(1)d + φ
)+ cos
(θ
(2)d + φ
)∣∣∣)
=12
erfc
√2E′bNo
cos
(θ
(1)d − θ
(2)d
2
)∣∣∣∣∣cos
(θ
(1)d + θ
(2)d
2+ φ
)∣∣∣∣∣ (10a)
9

and
Pb,2(φ) =12
erfc
(12
√P1TsNo
∣∣∣sin(θ(2)d + φ
)+ sin
(θ
(3)d + φ
)∣∣∣)
=12
erfc
√2E′bNo
cos
(θ
(2)d − θ
(3)d
2
)∣∣∣∣∣sin(θ
(2)d + θ
(3)d
2+ φ
)∣∣∣∣∣ (10b)
where the overline denotes the statistical average over the phase transitions θ(j)d , j = 1, 2, 3, and
E′
b = (P1/2)Ts is the actual bit energy found in the I-channel data modulation, which differs fromthe nominal bit energy for each channel, defined as Eb = (P/2)Ts, by a factor of (β2
1 + γ21) = P1/P .
Note that the bit-error probabilities of these two channels are, in general, not identical in the presence ofmodulator imbalances. The average bit-error probability for OQPSK signals is the arithmetic average ofthe bit-error probabilities of the I-channel and the Q-channel, given that they both have the same powerand bit rate.
By substituting the irreducible phase error, φo, found for the generalized Costas loop into Eqs. (10a)and (10b), the average bit-error probability and the individual bit-error probabilities for both channelscan be evaluated as a function of Eb/No for the loop operated at infinite loop SNR, i.e., the case of“perfect” carrier synchronization in which the only phase error remaining is φo. For realistic scenarioswith the loop operated at a finite loop SNR, a Tikhonov distribution centered at φo is assumed for thecarrier-tracking error such that the probability density function of φ becomes
p(φ) =2 exp (ρ4φ cos [4 (φ− φo)])
πIo(ρ4φ)(11)
where Io(·) is the modified Bessel function of order zero and
ρ4φ =1σ2
4φ
=1
16σ2φ
4=116× (Loop SNR) (12)
By further assuming that the 90-deg phase ambiguity can be perfectly resolved, the average bit-errorprobability can be evaluated as
Pb,1 =∫ φo+π/4
φo−π/4Pb,1(φ)p(φ)dφ (13a)
and
Pb,2 =∫ φo+π/4
φo−π/4Pb,2(φ)p(φ)dφ (13b)
where Pb,1 and Pb,2 are associated with the I-channel and the Q-channel, respectively, and p(φ) is givenin Eq. (11).
10

To illustrate the worst-case scenario, the following performance comparisons are all based upon the as-sumption that the actual power in the Q-channel is 0.4-dB less than that in the I-channel or, equivalently,the amplitude imbalance Γ = −0.2 dB. Tables 4 and 5 list the average and individual bit-error probabil-ities, under the assumption of perfect carrier synchronization, for the possible combinations within therange constrained by the maximum amplitude imbalance of 0.2 dB and the maximum phase imbalanceof 2 deg, when the nominal bit SNRs, Eb/No, are 4 dB and 10 dB, respectively. The correspondingirreducible carrier-tracking errors also are included in these tables. Comparing these with the resultsobtained for a linear channel, it is interesting to note that the relative bit-error performance between theI-channel and the Q-channel is more balanced for all cases listed here, e.g., the largest ratios are about1.22 and 2.13 here versus 1.48 and 4.80 in a linear channel when the bit SNRs are 4 dB and 10 dB, respec-tively. This observation is supported by the illustration in Fig. 2(c), of which a more balanced symbolconstellation is found in the nonlinear channel than in the linear one. Another interesting observationfrom these tables is that the average bit-error probabilities are more consistent for all cases listed here,e.g., they are distributed within 15 and 75 percent from the listed reference case when the bit SNRs are4 dB and 10 dB, respectively. They also are much closer to that of a perfectly balanced OQPSK system4
than those found in a linear channel.
The best and the worst combinations5 for these bit-error probabilities as functions of Eb/No are plottedin Fig. 4 for the case of perfect carrier synchronization (i.e., with infinite carrier-tracking loop SNR) andin Fig. 5 for the case of imperfect carrier synchronization when the loop SNR is fixed at 22 dB.
Table 4. OQPSK bit-error performance under various combinations of modulator imbalances(Eb /No = 4 dB, I/Q power ratio = 0.4 dB, and perfect carrier synchronization).
∆θ, Γ1, ∆θ1, Γ2, ∆θ2, Pb −Avg at Pb − I at Pb −Q at φ0,Remarks
deg dB deg dB deg Eb/N0 = 4 dB Eb/N0 = 4 dB Eb/N0 = 4 dB deg
0 0 0 0 0 1.2568× 10⁻² 1.1731× 10⁻² 1.3406× 10⁻² 0.0000 Reference
0 −0.2 2 −0.2 2 1.4373× 10⁻² 1.3436× 10⁻² 1.5311× 10⁻² −0.9789
0 −0.2 2 0 2 1.4271× 10⁻² 1.3805× 10⁻² 1.4736× 10⁻² −0.9886
0 0 2 −0.2 2 1.2731× 10⁻² 1.1451× 10⁻² 1.4010× 10⁻² −0.9820 (3)
0 0 2 0 2 1.2599× 10⁻² 1.1759× 10⁻² 1.3439× 10⁻² −0.9978 (1)
0 −0.2 2 −0.2 −2 1.4419× 10⁻² 1.3491× 10⁻² 1.5346× 10⁻² −0.0563 (2)
0 −0.2 2 0 −2 1.4322× 10⁻² 1.3869× 10⁻² 1.4774× 10⁻² −0.0133
0 0 2 −0.2 −2 1.2730× 10⁻² 1.1450× 10⁻² 1.4010× 10⁻² −0.0871 (3)
0 0 2 0 −2 1.2599× 10⁻² 1.1758× 10⁻² 1.3440× 10⁻² −0.0482 (1)
0 −0.2 −2 −0.2 2 1.4315× 10⁻² 1.3398× 10⁻² 1.5231× 10⁻² 0.0447
0 −0.2 −2 0 2 1.4270× 10⁻² 1.3804× 10⁻² 1.4735× 10⁻² 0.0120
0 0 −2 −0.2 2 1.2671× 10⁻² 1.1415× 10⁻² 1.3927× 10⁻² 0.0801 (3)
0 0 −2 0 2 1.2599× 10⁻² 1.1758× 10⁻² 1.3440× 10⁻² 0.0439 (1)
(1)Cases with the best average bit-error performance.
(2)Cases with the worst average bit-error performance.
(3)Cases with highly unbalanced individual bit-error performances.
4 The bit-error probabilities for the perfectly balanced OQPSK system are 1.2501× 10⁻² and 3.8721× 10⁻⁶ at an Eb/Noof 4 dB and 10 dB, respectively.
5 The combinations corresponding to these extreme cases are different for linear and nonlinear channels.
11

Table 4 (contd)
∆θ, Γ1, ∆θ1, Γ2, ∆θ2, Pb −Avg at Pb − I at Pb −Q at φ0,Remarks
deg dB deg dB deg Eb/N0 = 4 dB Eb/N0 = 4 dB Eb/N0 = 4 dB deg
0 −0.2 −2 −0.2 −2 1.4363× 10⁻² 1.3458× 10⁻² 1.5268× 10⁻² 0.9757
0 −0.2 −2 0 −2 1.4323× 10⁻² 1.3870× 10⁻² 1.4775× 10⁻² 0.9907
0 0 −2 −0.2 −2 1.2671× 10⁻² 1.1416× 10⁻² 1.3926× 10⁻² 0.9885 (3)
0 0 −2 0 −2 1.2599× 10⁻² 1.1759× 10⁻² 1.3439× 10⁻² 1.0022 (1)
2 −0.2 2 −0.2 2 1.4371× 10⁻² 1.3433× 10⁻² 1.5308× 10⁻² −2.0254
2 −0.2 2 0 2 1.4270× 10⁻² 1.3804× 10⁻² 1.4735× 10⁻² −2.0120
2 0 2 −0.2 2 1.2731× 10⁻² 1.1452× 10⁻² 1.4011× 10⁻² −2.0511 (3)
2 0 2 0 2 1.2599× 10⁻² 1.1758× 10⁻² 1.3440× 10⁻² −2.0439 (1)
2 −0.2 2 −0.2 −2 1.4415× 10⁻² 1.3486× 10⁻² 1.5344× 10⁻² −1.1021 (2)
2 −0.2 2 0 −2 1.4321× 10⁻² 1.3868× 10⁻² 1.4774× 10⁻² −1.0358
2 0 2 −0.2 −2 1.2730× 10⁻² 1.1447× 10⁻² 1.4013× 10⁻² −1.1564 (3)
2 0 2 0 −2 1.2599× 10⁻² 1.1757× 10⁻² 1.3442× 10⁻² −1.0944 (1)
2 −0.2 −2 −0.2 2 1.4314× 10⁻² 1.3398× 10⁻² 1.5229× 10⁻² −1.0013
2 −0.2 −2 0 2 1.4271× 10⁻² 1.3805× 10⁻² 1.4736× 10⁻² −1.0114
2 0 −2 −0.2 2 1.2671× 10⁻² 1.1416× 10⁻² 1.3926× 10⁻² −0.9885 (3)
2 0 −2 0 2 1.2599× 10⁻² 1.1759× 10⁻² 1.3439× 10⁻² −1.0022 (1)
2 −0.2 −2 −0.2 −2 1.4361× 10⁻² 1.3455× 10⁻² 1.5267× 10⁻² −0.0694
2 −0.2 −2 0 −2 1.4324× 10⁻² 1.3871× 10⁻² 1.4777× 10⁻² −0.0318
2 0 −2 −0.2 −2 1.2671× 10⁻² 1.1415× 10⁻² 1.3927× 10⁻² −0.0801 (3)
2 0 −2 0 −2 1.2599× 10⁻² 1.1758× 10⁻² 1.3440× 10⁻² −0.0439 (1)
−2 −0.2 2 −0.2 2 1.4376× 10⁻² 1.3437× 10⁻² 1.5316× 10⁻² 0.0677
−2 −0.2 2 0 2 1.4272× 10⁻² 1.3806× 10⁻² 1.4738× 10⁻² 0.0348
−2 0 2 −0.2 2 1.2730× 10⁻² 1.1450× 10⁻² 1.4010× 10⁻² 0.0871 (3)
−2 0 2 0 2 1.2599× 10⁻² 1.1758× 10⁻² 1.3440× 10⁻² 0.0482 (1)
−2 −0.2 2 −0.2 −2 1.4423× 10⁻² 1.3496× 10⁻² 1.5350× 10⁻² 0.9894 (2)
−2 −0.2 2 0 −2 1.4323× 10⁻² 1.3870× 10⁻² 1.4775× 10⁻² 1.0093
−2 0 2 −0.2 −2 1.2731× 10⁻² 1.1451× 10⁻² 1.4010× 10⁻² 0.9820 (3)
−2 0 2 0 −2 1.2599× 10⁻² 1.1759× 10⁻² 1.3439× 10⁻² 0.9978 (1)
−2 −0.2 −2 −0.2 2 1.4316× 10⁻² 1.3398× 10⁻² 1.5233× 10⁻² 1.0907
−2 −0.2 −2 0 2 1.4269× 10⁻² 1.3803× 10⁻² 1.4735× 10⁻² 1.0354
−2 0 −2 −0.2 2 1.2671× 10⁻² 1.1412× 10⁻² 1.3929× 10⁻² 1.1488 (3)
−2 0 −2 0 2 1.2599× 10⁻² 1.1757× 10⁻² 1.3442× 10⁻² 1.0901 (1)
−2 −0.2 −2 −0.2 −2 1.4366× 10⁻² 1.3461× 10⁻² 1.5271× 10⁻² 2.0206
−2 −0.2 −2 0 −2 1.4322× 10⁻² 1.3869× 10⁻² 1.4774× 10⁻² 2.0133
−2 0 −2 −0.2 −2 1.2672× 10⁻² 1.1417× 10⁻² 1.3928× 10⁻² 2.0571 (3)
−2 0 −2 0 −2 1.2599× 10⁻² 1.1758× 10⁻² 1.3440× 10⁻² 2.0482 (1)
(1)Cases with the best average bit-error performance.
(2)Cases with the worst average bit-error performance.
(3)Cases with highly unbalanced individual bit-error performances.
12

Table 5. OQPSK bit-error performance under various combinations of modulator imbalances(Eb /No = 10 dB, I/Q power ratio = 0.4 dB, and perfect carrier synchronization).
∆θ, Γ1, ∆θ1, Γ2, ∆θ2, Pb −Avg at Pb − I at Pb −Q at φ0,Remarks
deg dB deg dB deg Eb/N0 = 10 dB Eb/N0 = 10 dB Eb/N0 = 10 dB deg
0 0 0 0 0 4.1125× 10⁻⁶ 3.1437× 10⁻⁶ 5.0812× 10⁻⁶ 0.0000 Reference
0 −0.2 2 −0.2 2 6.8729× 10⁻⁶ 5.2351× 10⁻⁶ 8.5108× 10⁻⁶ −0.9789
0 −0.2 2 0 2 6.3385× 10⁻⁶ 5.5931× 10⁻⁶ 7.0839× 10⁻⁶ −0.9886
0 0 2 −0.2 2 4.7336× 10⁻⁶ 3.0240× 10⁻⁶ 6.4432× 10⁻⁶ −0.9820 (3)
0 0 2 0 2 4.2022× 10⁻⁶ 3.1975× 10⁻⁶ 5.2069× 10⁻⁶ −0.9978 (1)
0 −0.2 2 −0.2 −2 7.1372× 10⁻⁶ 5.4125× 10⁻⁶ 8.8618× 10⁻⁶ −0.0563 (2)
0 −0.2 2 0 −2 6.5976× 10⁻⁶ 5.8218× 10⁻⁶ 7.3734× 10⁻⁶ −0.0133
0 0 2 −0.2 −2 4.7312× 10⁻⁶ 3.0221× 10⁻⁶ 6.4404× 10⁻⁶ −0.0871 (3)
0 0 2 0 −2 4.2026× 10⁻⁶ 3.1972× 10⁻⁶ 5.2080× 10⁻⁶ −0.0482 (1)
0 −0.2 −2 −0.2 2 6.5559× 10⁻⁶ 5.0723× 10⁻⁶ 8.0396× 10⁻⁶ 0.0447
0 −0.2 −2 0 2 6.3337× 10⁻⁶ 5.5894× 10⁻⁶ 7.0781× 10⁻⁶ 0.0120
0 0 −2 −0.2 2 4.4693× 10⁻⁶ 2.9298× 10⁻⁶ 6.0089× 10⁻⁶ 0.0801
0 0 −2 0 2 4.2025× 10⁻⁶ 3.1972× 10⁻⁶ 5.2079× 10⁻⁶ 0.0439 (1)
0 −0.2 −2 −0.2 −2 6.8185× 10⁻⁶ 5.2517× 10⁻⁶ 8.3853× 10⁻⁶ 0.9757
0 −0.2 −2 0 −2 6.6026× 10⁻⁶ 5.8257× 10⁻⁶ 7.3795× 10⁻⁶ 0.9907
0 0 −2 −0.2 −2 4.4718× 10⁻⁶ 2.9316× 10⁻⁶ 6.0119× 10⁻⁶ 0.9885
0 0 −2 0 −2 4.2022× 10⁻⁶ 3.1975× 10⁻⁶ 5.2069× 10⁻⁶ 1.0022 (1)
2 −0.2 2 −0.2 2 6.8587× 10⁻⁶ 5.2268× 10⁻⁶ 8.4906× 10⁻⁶ −2.0254
2 −0.2 2 0 2 6.3337× 10⁻⁶ 5.5894× 10⁻⁶ 7.0781× 10⁻⁶ −2.0120
2 0 2 −0.2 2 4.7381× 10⁻⁶ 3.0254× 10⁻⁶ 6.4509× 10⁻⁶ −2.0511 (3)
2 0 2 0 2 4.2025× 10⁻⁶ 3.1972× 10⁻⁶ 5.2079× 10⁻⁶ −2.0439 (1)
2 −0.2 2 −0.2 −2 7.1150× 10⁻⁶ 5.3968× 10⁻⁶ 8.8332× 10⁻⁶ −1.1021 (2)
2 −0.2 2 0 −2 6.5934× 10⁻⁶ 5.8176× 10⁻⁶ 7.3692× 10⁻⁶ −1.0358
2 0 2 −0.2 −2 4.7310× 10⁻⁶ 3.0195× 10⁻⁶ 6.4426× 10⁻⁶ −1.1564 (3)
2 0 2 0 −2 4.2035× 10⁻⁶ 3.1961× 10⁻⁶ 5.2109× 10⁻⁶ −1.0944 (1)
2 −0.2 −2 −0.2 2 6.5520× 10⁻⁶ 5.0707× 10⁻⁶ 8.0334× 10⁻⁶ −1.0013
2 −0.2 −2 0 2 6.3385× 10⁻⁶ 5.5931× 10⁻⁶ 7.0839× 10⁻⁶ −1.0114
2 0 −2 −0.2 2 4.4718× 10⁻⁶ 2.9316× 10⁻⁶ 6.0119× 10⁻⁶ −0.9885
2 0 −2 0 2 4.2022× 10⁻⁶ 3.1975× 10⁻⁶ 5.2069× 10⁻⁶ −1.0022 (1)
2 −0.2 −2 −0.2 −2 6.8071× 10⁻⁶ 5.2433× 10⁻⁶ 8.3710× 10⁻⁶ −0.0694
2 −0.2 −2 0 −2 6.6084× 10⁻⁶ 5.8294× 10⁻⁶ 7.3875× 10⁻⁶ −0.0318
2 0 −2 −0.2 −2 4.4693× 10⁻⁶ 2.9298× 10⁻⁶ 6.0089× 10⁻⁶ −0.0801
2 0 −2 0 −2 4.2025× 10⁻⁶ 3.1972× 10⁻⁶ 5.2079× 10⁻⁶ −0.0439 (1)
−2 −0.2 2 −0.2 2 6.8893× 10⁻⁶ 5.2429× 10⁻⁶ 8.5356× 10⁻⁶ 0.0677
−2 −0.2 2 0 2 6.3439× 10⁻⁶ 5.5964× 10⁻⁶ 7.0913× 10⁻⁶ 0.0348
−2 0 2 −0.2 2 4.7312× 10⁻⁶ 3.0221× 10⁻⁶ 6.4404× 10⁻⁶ 0.0871 (3)
−2 0 2 0 2 4.2026× 10⁻⁶ 3.1972× 10⁻⁶ 5.2080× 10⁻⁶ 0.0482 (1)
(1)Cases with the best average bit-error performance.
(2)Cases with the worst average bit-error performance.
(3)Cases with highly unbalanced individual bit-error performances.
13

Table 5 (contd)
∆θ, Γ1, ∆θ1, Γ2, ∆θ2, Pb −Avg at Pb − I at Pb −Q at φ0,Remarks
deg dB deg dB deg Eb/N0 = 10 dB Eb/N0 = 10 dB Eb/N0 = 10 dB deg
−2 −0.2 2 −0.2 −2 7.1617× 10⁻⁶ 5.4279× 10⁻⁶ 8.8956× 10⁻⁶ 0.9894 (2)
−2 −0.2 2 0 −2 6.6026× 10⁻⁶ 5.8257× 10⁻⁶ 7.3795× 10⁻⁶ 1.0093
−2 0 2 −0.2 −2 4.7336× 10⁻⁶ 3.0240× 10⁻⁶ 6.4432× 10⁻⁶ 0.9820 (3)
−2 0 2 0 −2 4.2022× 10⁻⁶ 3.1975× 10⁻⁶ 5.2069× 10⁻⁶ 0.9978 (1)
−2 −0.2 −2 −0.2 2 6.5613× 10⁻⁶ 5.0731× 10⁻⁶ 8.0495× 10⁻⁶ 1.0907
−2 −0.2 −2 0 2 6.3294× 10⁻⁶ 5.5851× 10⁻⁶ 7.0737× 10⁻⁶ 1.0354
−2 0 −2 −0.2 2 4.4685× 10⁻⁶ 2.9272× 10⁻⁶ 6.0098× 10⁻⁶ 1.1488
−2 0 −2 0 2 4.2034× 10⁻⁶ 3.1961× 10⁻⁶ 5.2107× 10⁻⁶ 1.0901 (1)
−2 −0.2 −2 −0.2 −2 6.8317× 10⁻⁶ 5.2596× 10⁻⁶ 8.4038× 10⁻⁶ 2.0206
−2 −0.2 −2 0 −2 6.5976× 10⁻⁶ 5.8218× 10⁻⁶ 7.3734× 10⁻⁶ 2.0133
−2 0 −2 −0.2 −2 4.4758× 10⁻⁶ 2.9328× 10⁻⁶ 6.0187× 10⁻⁶ 2.0571
−2 0 −2 0 −2 4.2026× 10⁻⁶ 3.1972× 10⁻⁶ 5.2080× 10⁻⁶ 2.0482 (1)
(1)Cases with the best average bit-error performance.
(2)Cases with the worst average bit-error performance.
(3)Cases with highly unbalanced individual bit-error performances.
From Fig. 4, a 0.18-dB I-channel and a 0.35-dB Q-channel worst-case Eb/No degradation at the bit-error probability of 10−4 are shown under the assumption of perfect carrier synchronization for the CCSDSrecommendation of maximum permissible phase imbalance of 2 deg and amplitude imbalance of 0.2 dB.The inferior performance in the Q-channel is expected because of its 0.4-dB power deficiency as a resultof the assumed interchannel amplitude imbalance. The overall degradation for the averaged performanceis 0.25 dB. The actual performance becomes slightly worse when the carrier-tracking loop is operated at a22-dB loop SNR. Figure 5 shows a 0.20-dB I-channel and a 0.37-dB Q-channel worst-case degradation atthe same bit-error probability, and the overall degradation for the averaged performance becomes 0.27 dBin the imperfect carrier synchronization case.
VI. Conclusion
In this article, the combined effect of modulator imbalances and amplifier nonlinearity on the un-coded OQPSK system subject to the additive white Gaussian noise (AWGN) is analyzed. Both carrier-suppression level and BER performance are evaluated. Numerical results and performance comparisonsare given for the CCSDS recommended maximum permissible phase imbalance of 2 deg and amplitudeimbalance of 0.2 dB. Based on the above analysis, several conclusions can be drawn concerning the impactof modulator imbalances on the OQPSK system performance:
(1) The impact of modulator imbalances is greatly reduced by the use of a fully saturated,nonlinear RF amplifier to generate a constant-envelope signal for transmission.
(2) The maximum permissible phase imbalance of 2 deg and amplitude imbalance of 0.2 dBwould be sufficient for a carrier suppression of 34 dB or more in the nonlinear OQPSKlink, which is 9-dB more than that found in the linear OQPSK link.
14
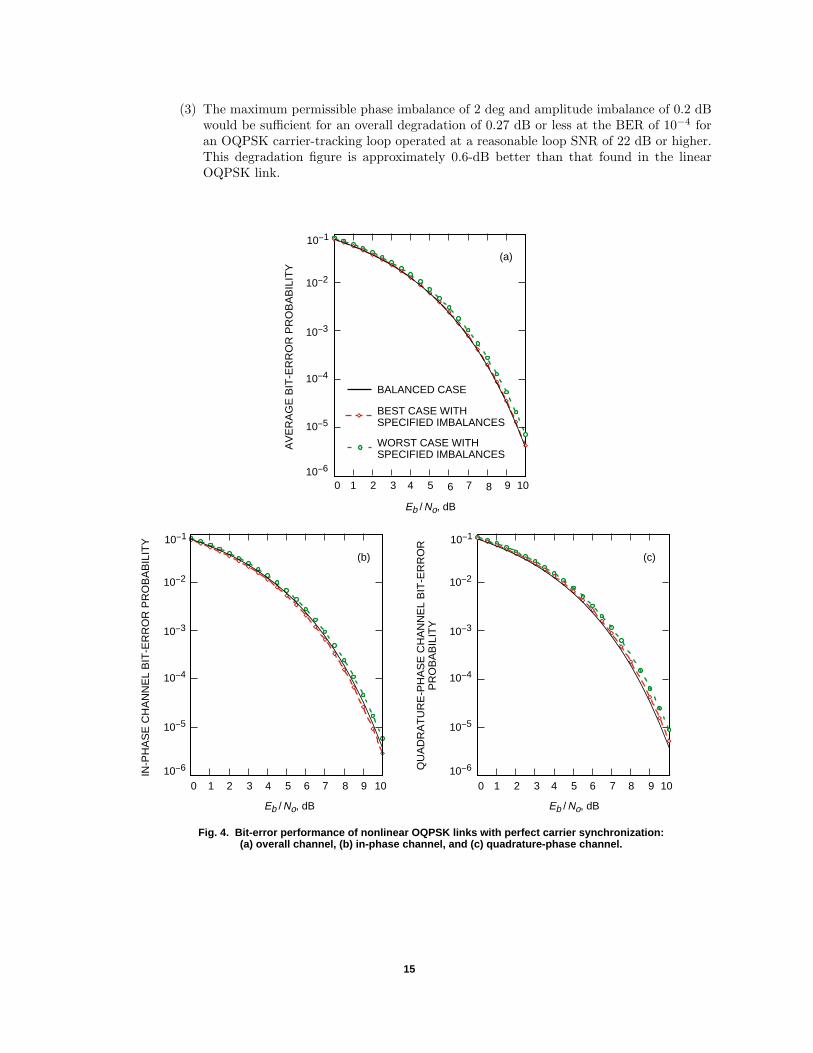
(3) The maximum permissible phase imbalance of 2 deg and amplitude imbalance of 0.2 dBwould be sufficient for an overall degradation of 0.27 dB or less at the BER of 10−4 foran OQPSK carrier-tracking loop operated at a reasonable loop SNR of 22 dB or higher.This degradation figure is approximately 0.6-dB better than that found in the linearOQPSK link.
10-1
10-2
10-3
10-4
10-5
10-6
0 1 2 3 4 5 6 7 8 9 10
QU
AD
RA
TU
RE
-PH
AS
E C
HA
NN
EL
BIT
-ER
RO
RP
RO
BA
BIL
ITY
Eb / No, dB
(c)
10-1
10-2
10-3
10-4
10-5
10-6
0 1 2 3 4 5 6 7 8 9 10
IN-P
HA
SE
CH
AN
NE
L B
IT-E
RR
OR
PR
OB
AB
ILIT
Y
Eb / No, dB
(b)
10-1
10-2
10-3
10-4
10-5
10-6
0 1 2 3 4 5 6 7 8 9 10
BALANCED CASE
BEST CASE WITHSPECIFIED IMBALANCES
WORST CASE WITHSPECIFIED IMBALANCES
AV
ER
AG
E B
IT-E
RR
OR
PR
OB
AB
ILIT
Y
Eb / No, dB
(a)
Fig. 4. Bit-error performance of nonlinear OQPSK links with perfect carrier synchronization:(a) overall channel, (b) in-phase channel, and (c) quadrature-phase channel.
15

10-1
10-2
10-3
10-4
10-5
10-6
0 1 2 3 4 5 6 7 8 9 10
QU
AD
RA
TU
RE
-PH
AS
E C
HA
NN
EL
BIT
-ER
RO
RP
RO
BA
BIL
ITY
Eb / No, dB
(c)
10-1
10-2
10-3
10-4
10-5
10-6
0 1 2 3 4 5 6 7 8 9 10
IN-P
HA
SE
CH
AN
NE
L B
IT-E
RR
OR
PR
OB
AB
ILIT
Y
Eb / No, dB
(b)
10-1
10-2
10-3
10-4
10-5
10-6
0 1 2 3 4 5 6 7 8 9 10
BALANCED CASE(IDEAL)
BEST CASE WITHSPECIFIED IMBALANCES
WORST CASE WITHSPECIFIED IMBALANCES
AV
ER
AG
E B
IT-E
RR
OR
PR
OB
AB
ILIT
Y
Eb / No, dB
(a)
Fig. 5. Bit-error performance of nonlinear OQPSK links with imperfect carrier synchronization(i.e., with a carrier-tracking loop SNR fixed at 22 dB): (a) overall channel, (b) in-phase channel,and (c) quadrature-phase channel.
Acknowledgments
The author would like to thank Dr. Marvin Simon and Dr. Tsun-Yee Yan fortheir valuable suggestions on this work.
16

References
[1] H. Tsou, “The Effect of Phase and Amplitude Imbalance on the Performanceof Offset Quadrature Phase-Shift-Keyed (OQPSK) Communication Systems,”The Telecommunications and Mission Operations Progress Report 42-135, July–September 1998, Jet Propulsion Laboratory, Pasadena, California, pp. 1–15,November 15, 1998.http://tmo.jpl.nasa.gov/tmo/progress report/42-135/135I.pdf
[2] B. A. Carlson, Communication Systems, 2nd. edition, New York: McGraw-Hill,1975.
[3] Consultative Committee for Space Data Systems, Recommendations for SpaceData System Standards: Radio Frequency and Modulation Systems, Part 1, EarthStations and Spacecraft, CCSDS 401.0-B, Blue Book, November 1994.
[4] W. B. Davenport, Jr., and W. L. Root, An Introduction to the Theory of RandomSignals and Noise, New York: McGraw-Hill, 1958.
Appendix
Alternative OQPSK Modulator Imbalances Models
In this appendix, alternate models of OQPSK modulator imbalances are presented to meet differenthardware measurement requirements. The translation of these alternative modulator imbalance modelsfrom and to the balanced modulator model used in this article can be established from the equationsprovided here.
The OQPSK signal from the imperfect balanced modulator, shown in Eq. (1), can be expressed in thefollowing alternate format as
So(t) =√P1m1(t) cos(ωct+ θo) +G
√P1m2
(t− Ts
2
)sin(ωct+ θo + ∆θ)
+√P1A sin(ωct+ θo + ψ) (A-1)
of which the new parameters are related to the parameters used in the balanced modulator model, asgiven in Eq. (3), by
17

P1 = P (β21 + γ2
1)
G =
√β2
2 + γ22
β21 + γ2
1
A =
√(α1 − γ2)2 + (α2 + δ1)2
β21 + γ2
1
θo = tan−1
(γ1
β1
)
∆θ = tan−1
(γ2
β2
)− tan−1
(γ1
β1
)
ψ = tan−1
(α1 − γ2
α2 + δ1
)− tan−1
(γ1
β1
)
(A-2)
where G is the interchannel amplitude imbalance, ∆θ is the interchannel phase imbalance, and A andψ are the amplitude and phase of the spurious carrier, respectively, for this generic model of modulatorimbalances.
For modulator imbalances solely attributed to dc-bias terms associated with the individual BPSKsignals, the imperfectly modulated OQPSK signal becomes
So(t) =√P1[m1(t) + a1] cosωct+G
√P1
[m2
(t− Ts
2
)+ a2
]sin(ωct+ ∆θ) (A-3)
where a1 and a2 are dc-bias terms in the I- and Q-channel signals, respectively. It easily is seen thatEq. (A-3) is related to Eq. (A-1) by
A =√a2
1 +G2a22 + 2Ga1a2 sin ∆θ (A-4)
ψ = tan−1
(a1 +Ga2 sin ∆θGa2 cos ∆θ
)(A-5)
Note that this model specifically puts the spurious carrier component in each channel to be in phase withthe modulated signal in the same channel. This implicit assumption does not appear in the balancedmodulator model.
18