the complexity economics revolution
TRANSCRIPT

J. Doyne Farmer Institute for New Economic Thinking at the Oxford Martin School, Math Institute, University of Oxford; Santa Fe Institute
The complexity economics revolution
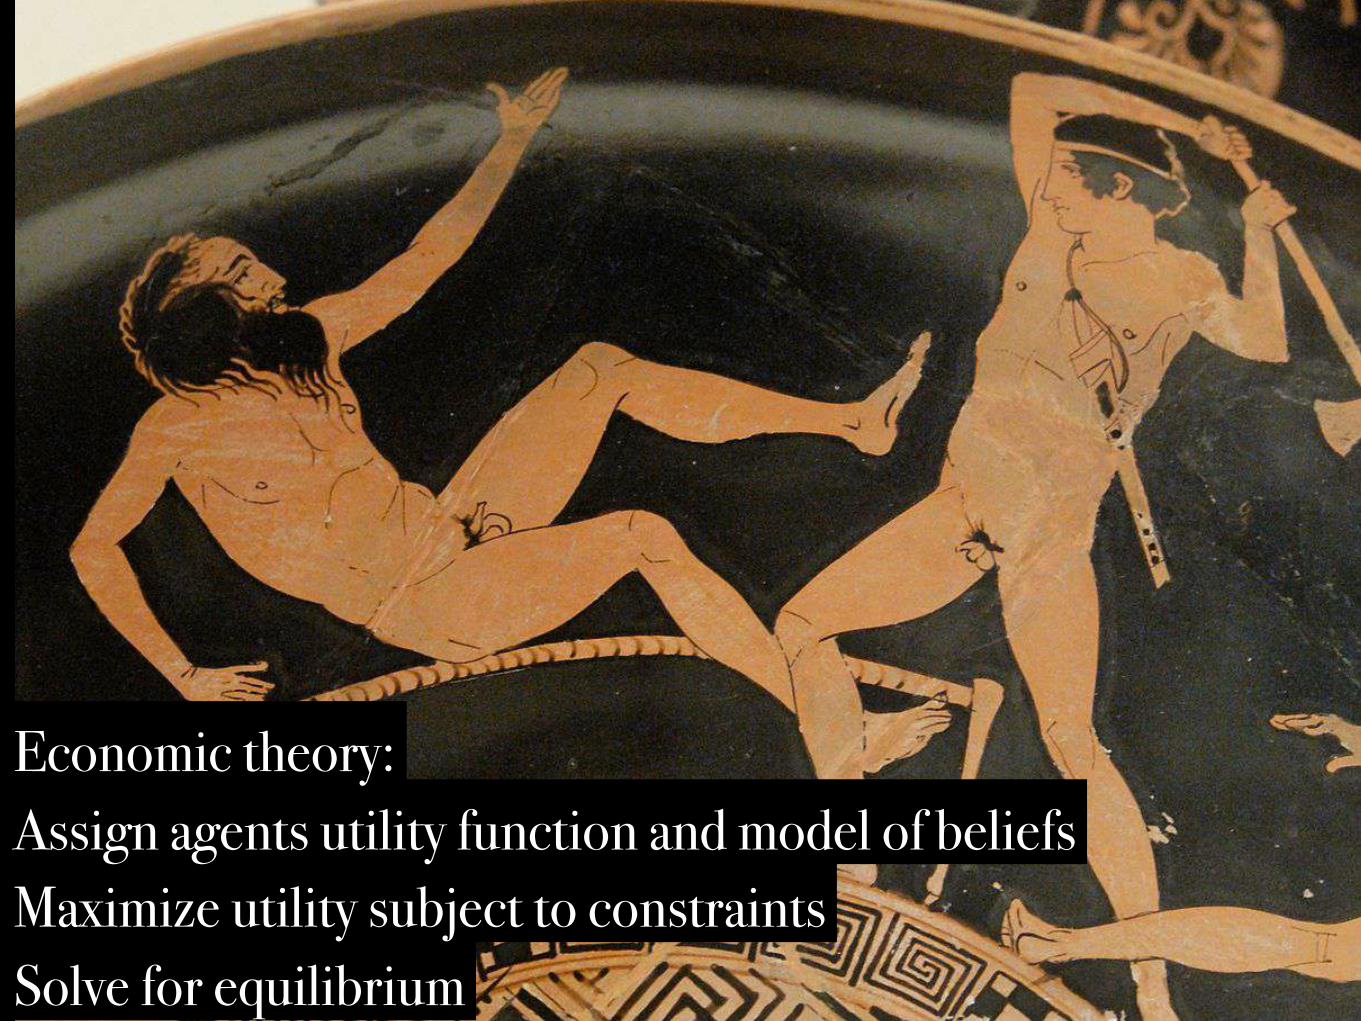
Economic theory: Assign agents utility function and model of beliefs Maximize utility subject to constraints Solve for equilibrium
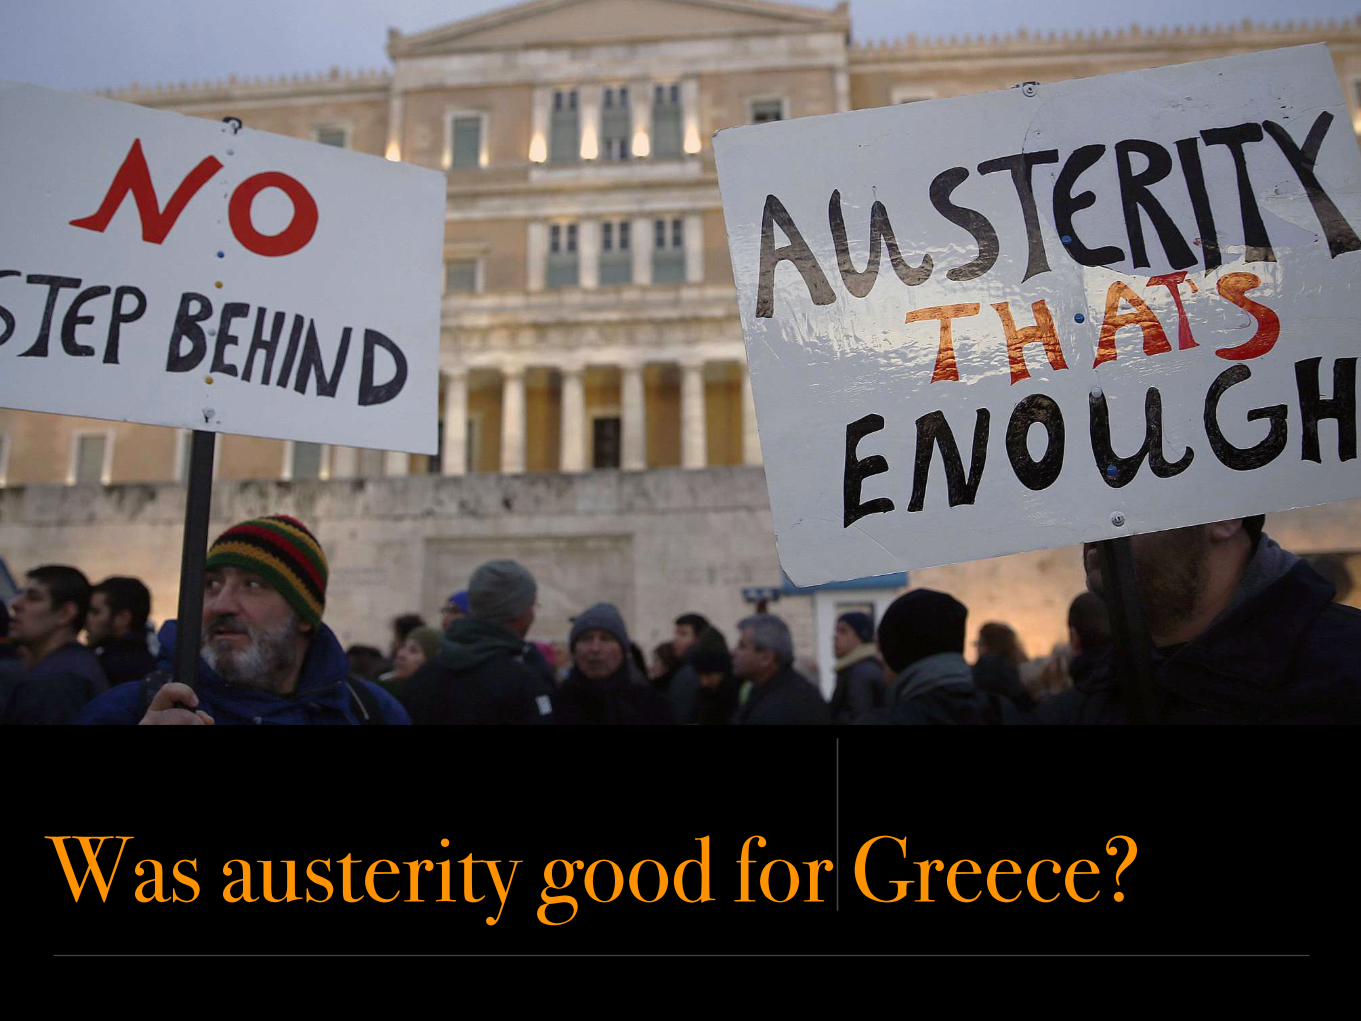
Was austerity good for Greece?
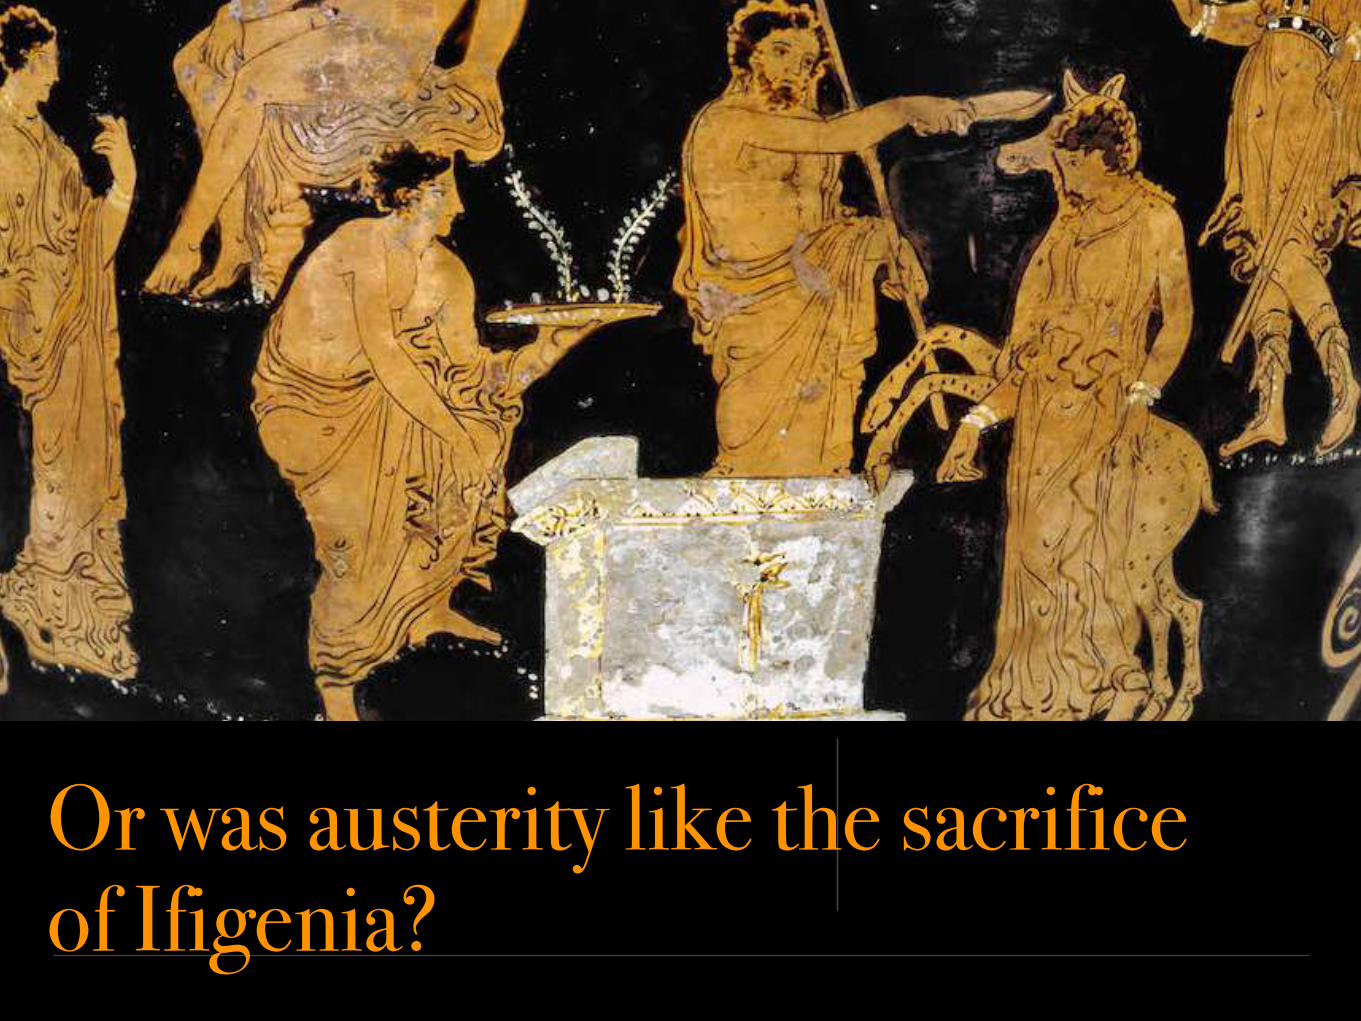
Or was austerity like the sacrifice of Ifigenia?

Science makes things that are random become predictable
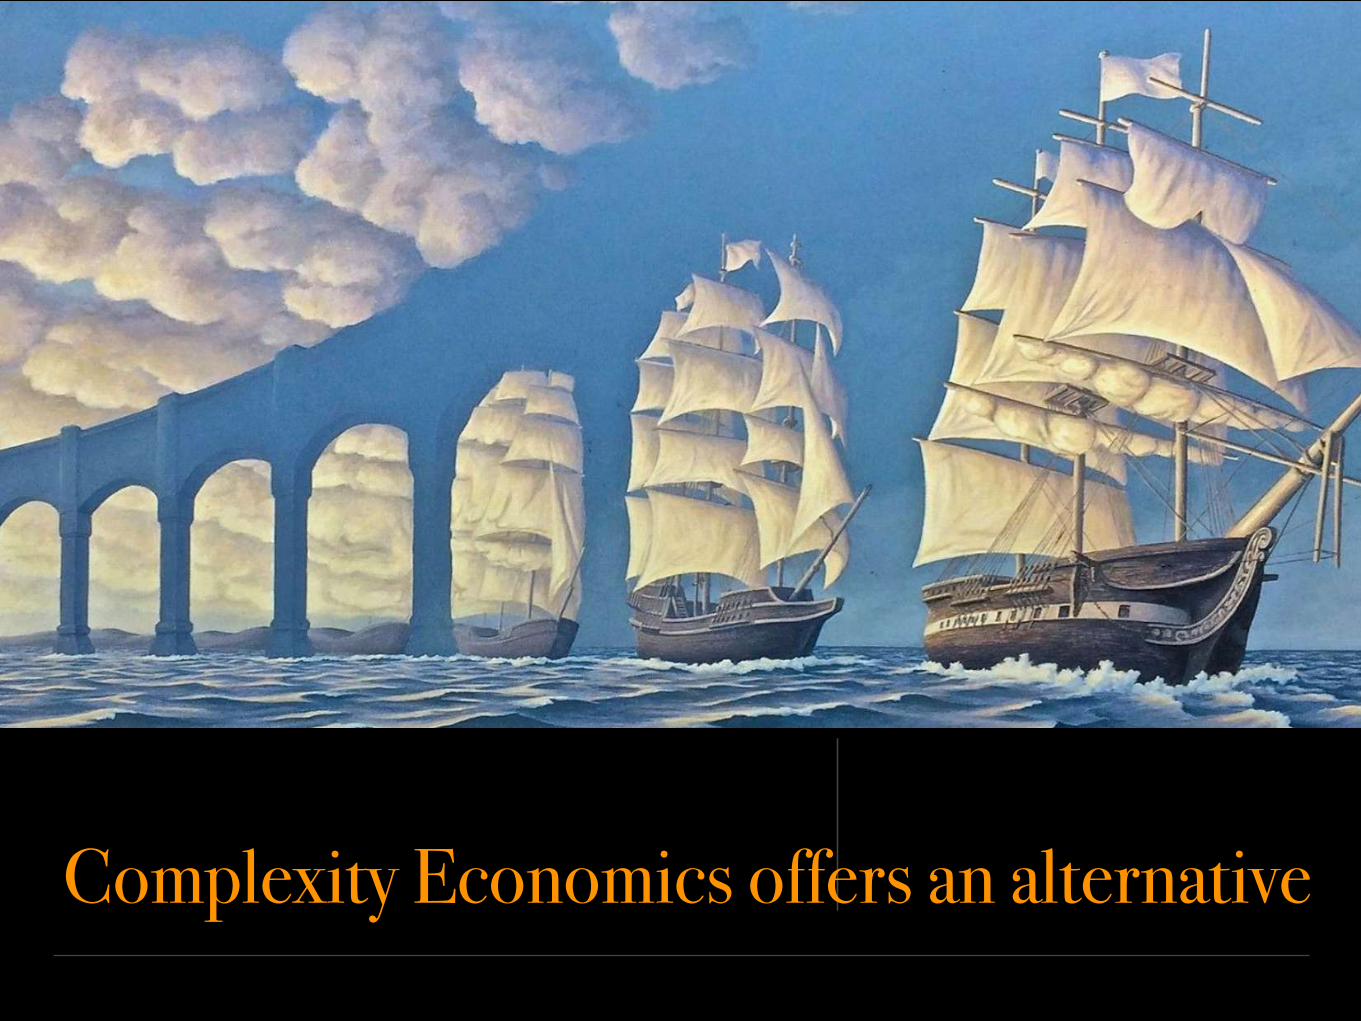
Complexity Economics offers an alternative
What is the economy?
What is the Economy?
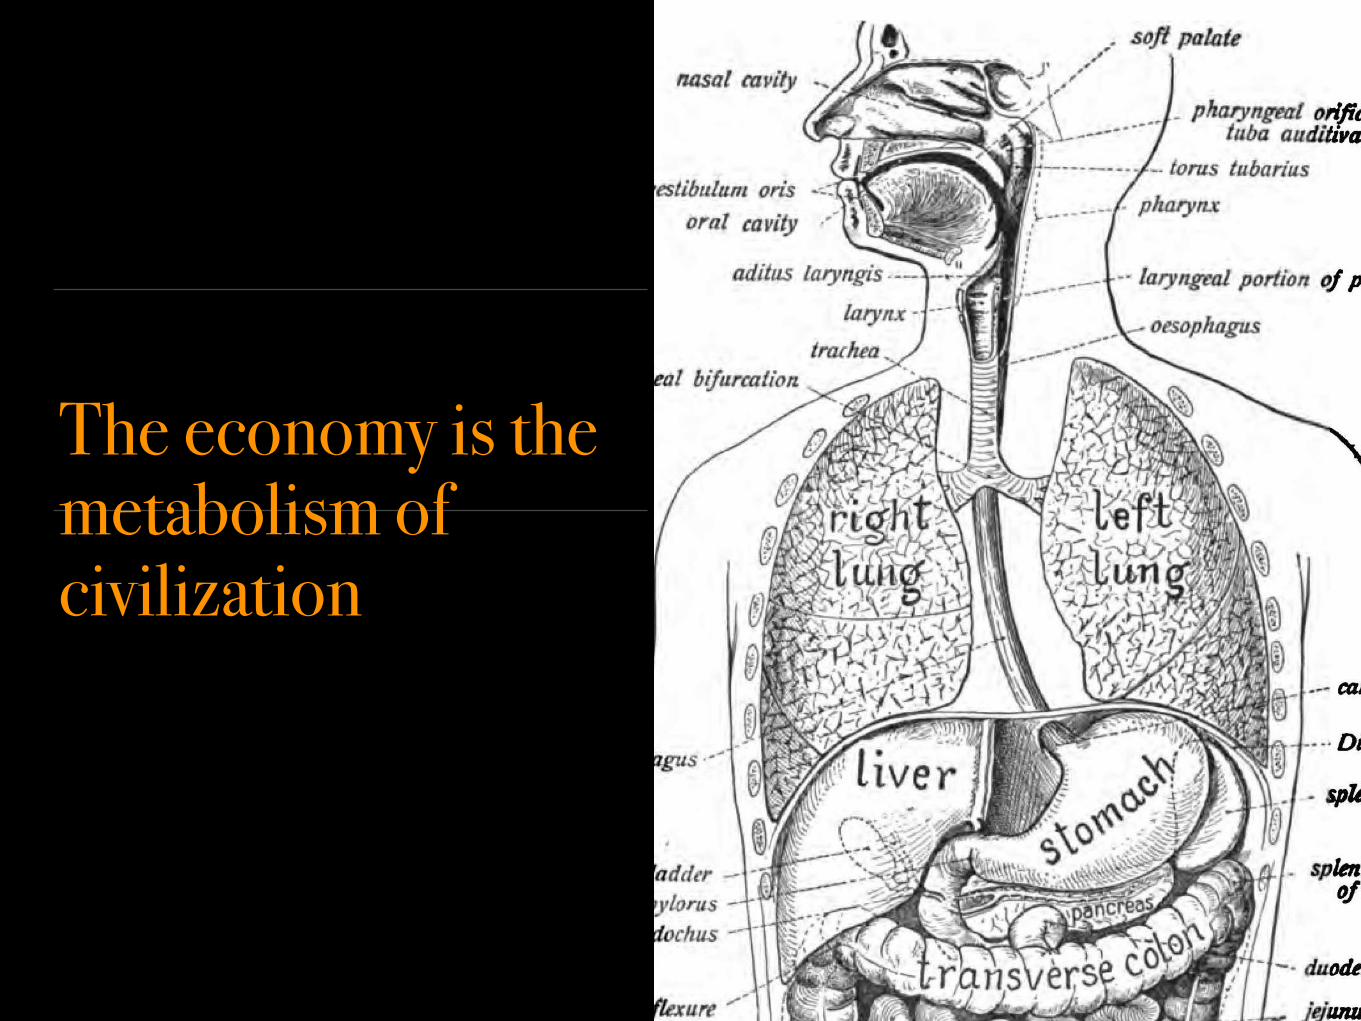
The economy is the metabolism of civilization

The financial system is like the enteric nervous system

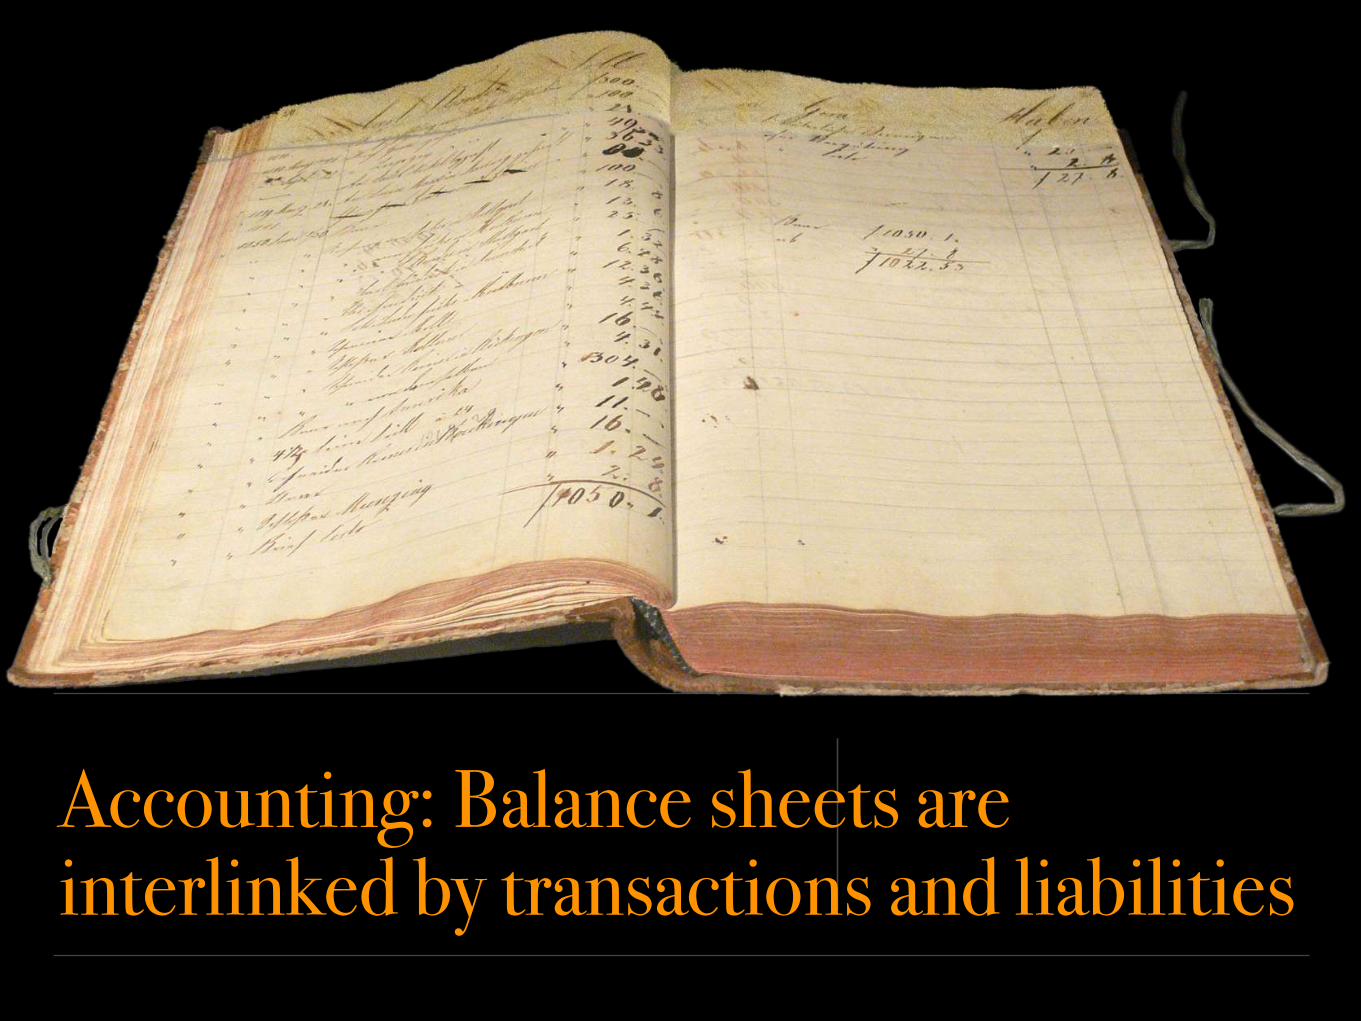
Economics=Accounting+Behaviour
1.Health warning: Complexity economics is a young science
Accounting: Balance sheets are interlinked by transactions and liabilities

1.Health warning: Complexity economics is a young science
The economy is vastly complicated
50 million firms 2 billion households
3.3 billion workers trillions of active contracts

1.Health warning: Complexity economics is a young science
Behavior is complicated too

1.Health warning: Complexity economics is a young science
Dominant model for behavior is rational expectations. Alternatives are now being explored

1.Health warning: Complexity economics is a young science
Complexity economics: Be flexible! Model behavior directly

1.Health warning: Complexity economics is a young science
People use heuristics + bounded rationality to solve problems
The economy can be simulated

1.Health warning: Complexity economics is a young science
“Standard” complexity economics model: Assign agents decision making rules or learning algorithms Simulate collective interactions Observe economic phenomena
1.Health warning: Complexity economics is a young science
Why does the economy change?
1.Health warning: Complexity economics is a young science
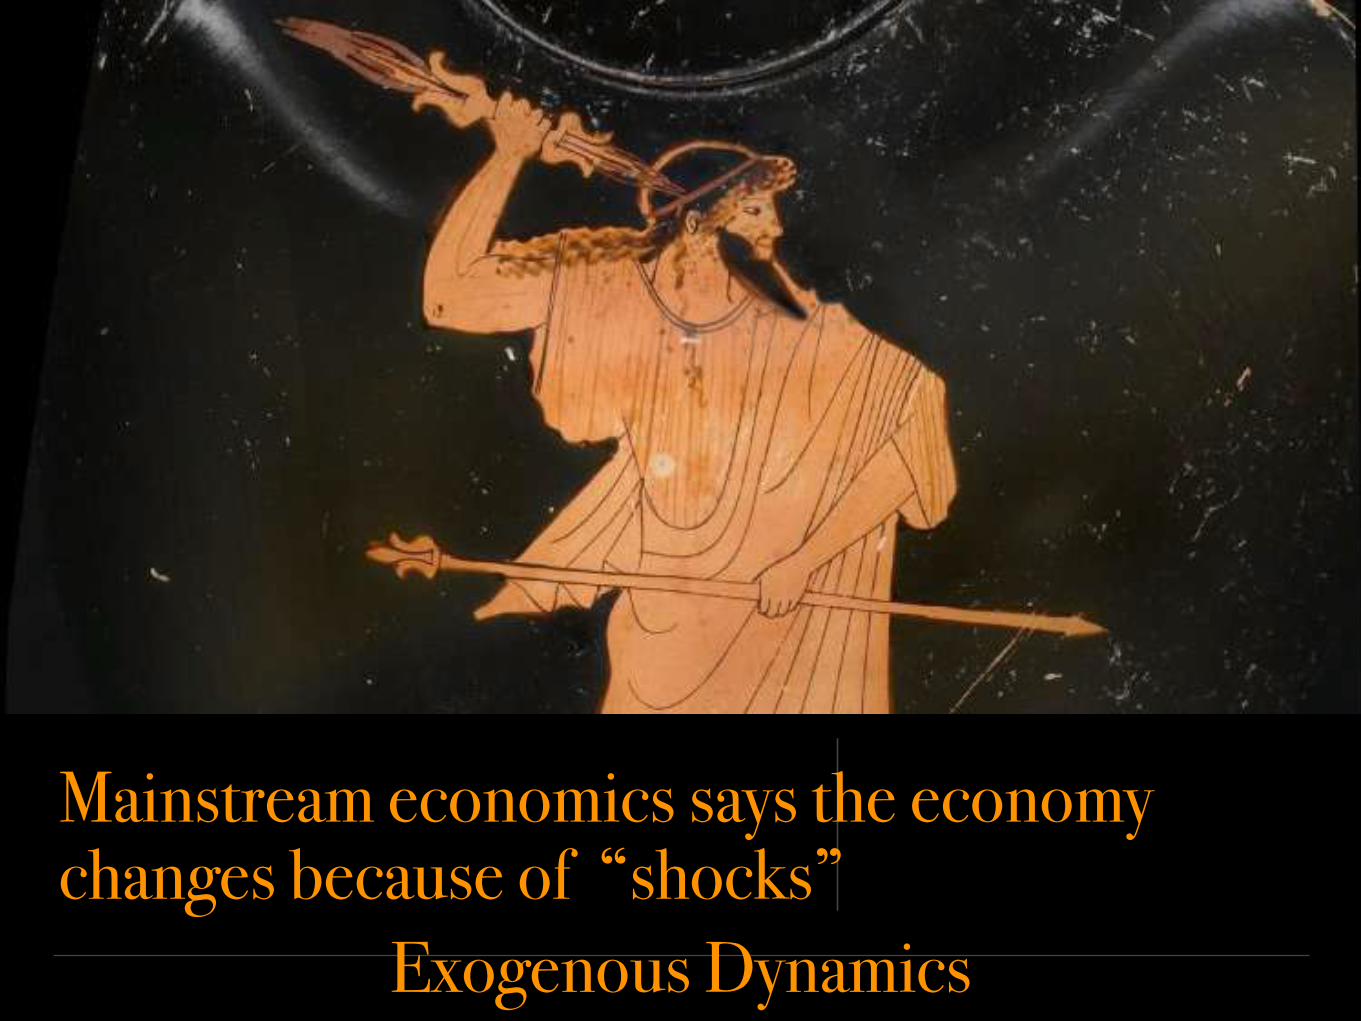
Mainstream economics says the economy changes because of “shocks”
Exogenous Dynamics
1.Health warning: Complexity economics is a young science
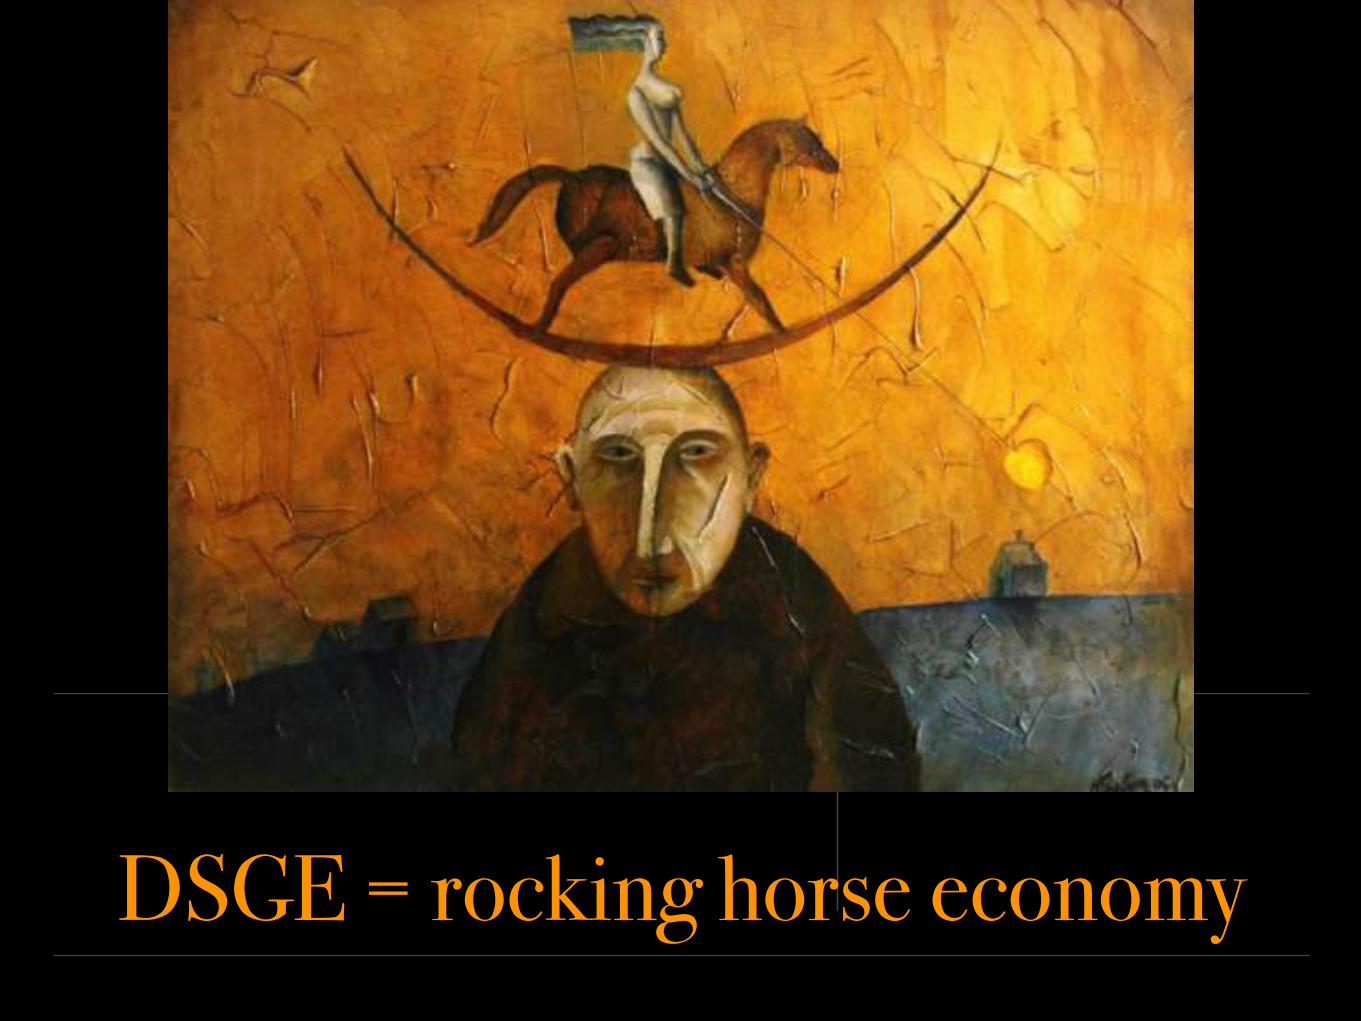
DSGE = rocking horse economy

But the weather changes all by itself Endogenous Dynamics
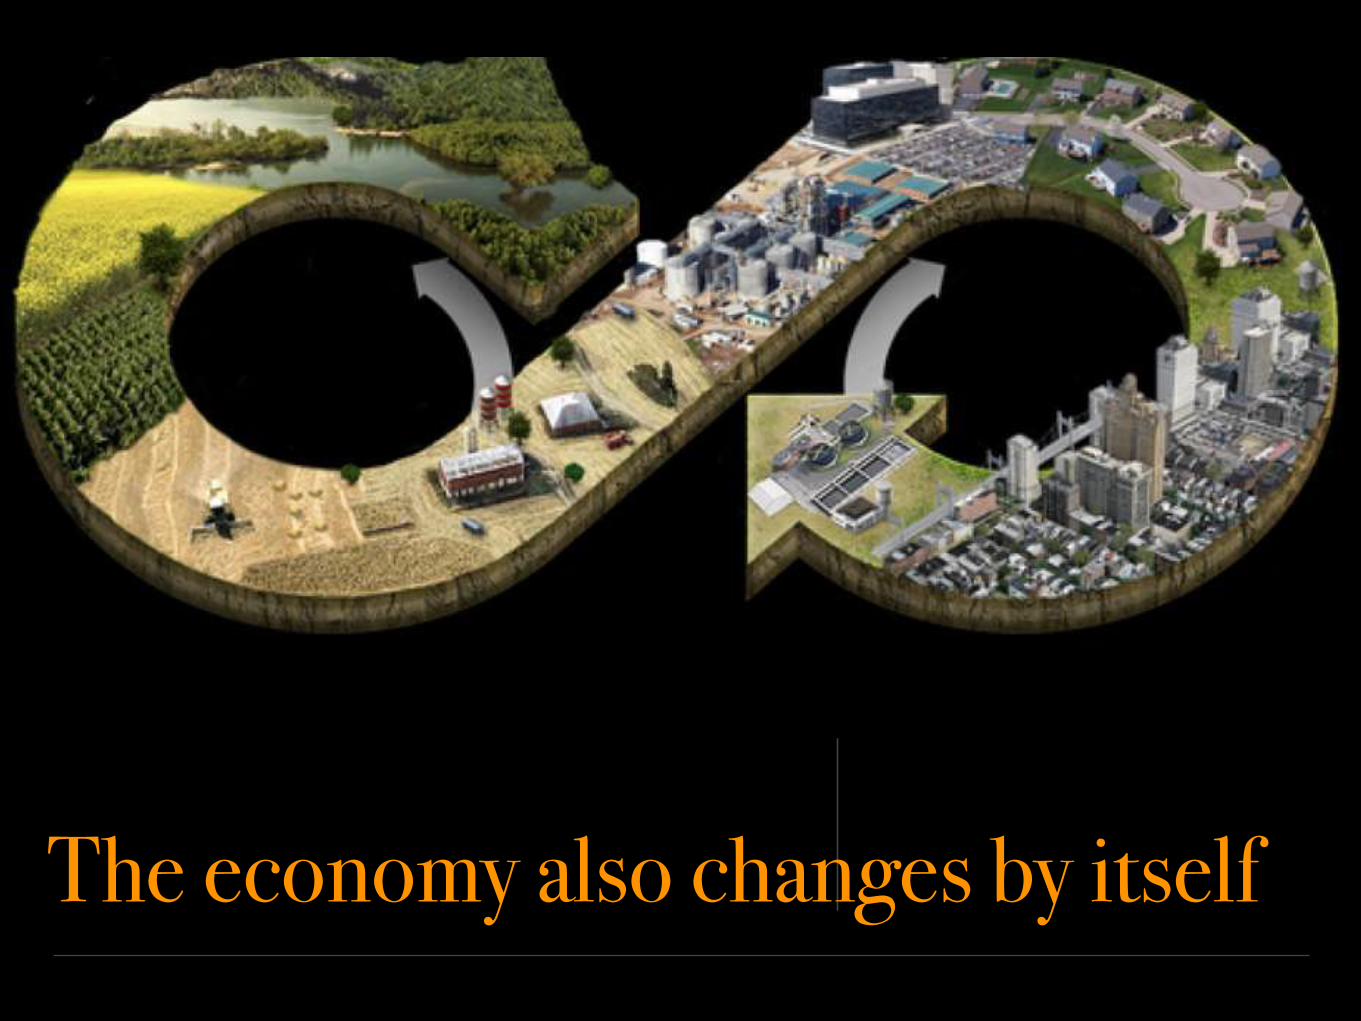
The economy also changes by itself

In economics the future strongly influences the present. Rational utility maximizers are unduly static.

Bounded rationality naturally creates endogenous dynamics
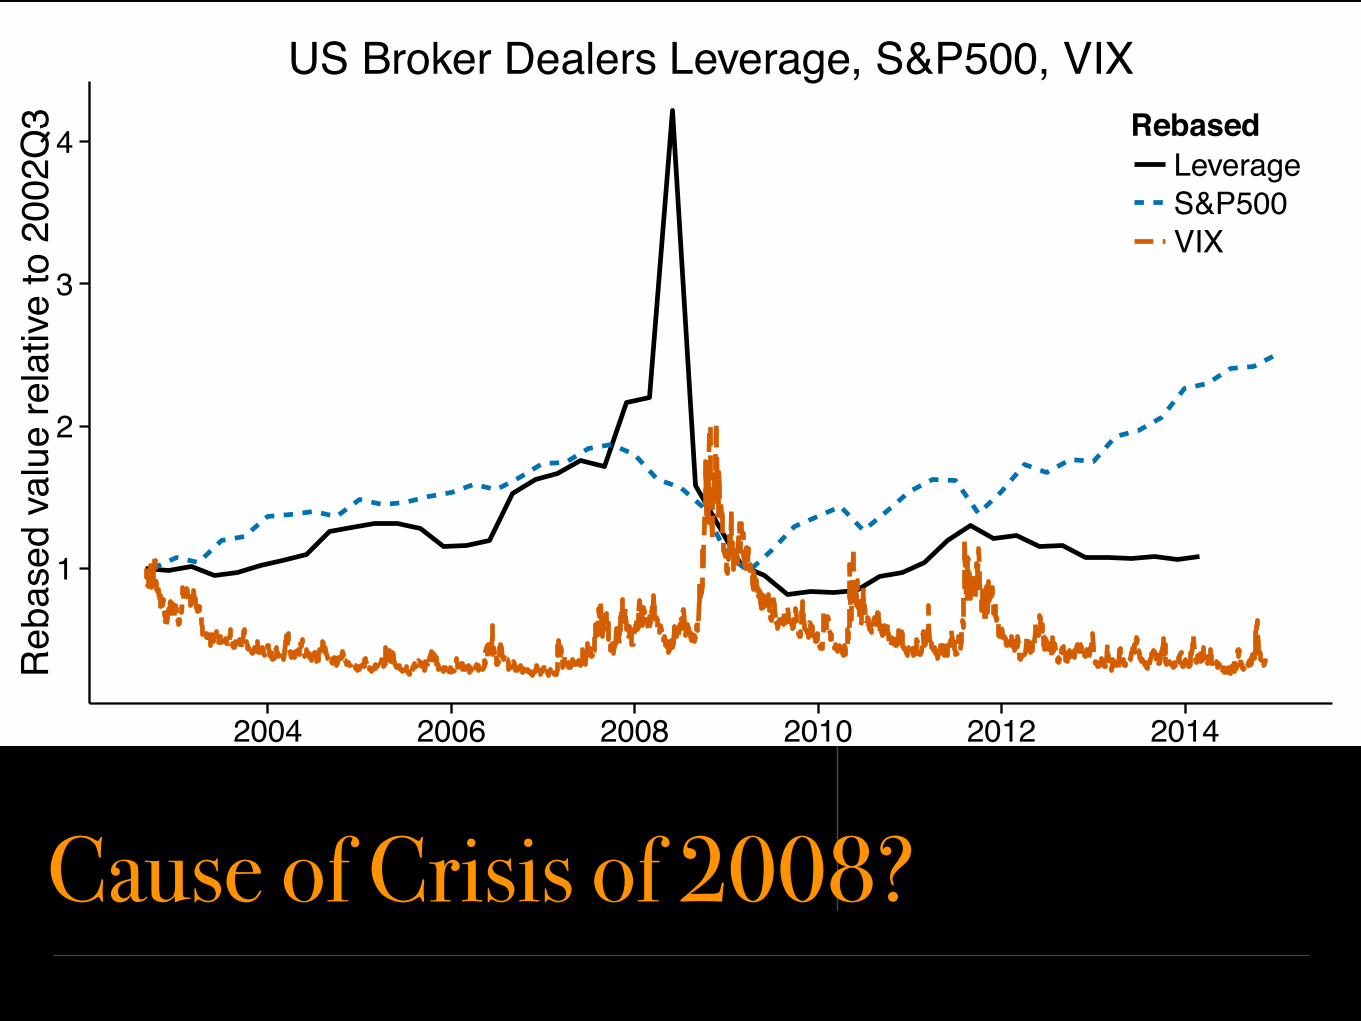
Cause of Crisis of 2008?
1
2
3
4
2004 2006 2008 2010 2012 2014Date
Reb
ased
val
ue re
lativ
e to
200
2Q3 Rebased
LeverageS&P500VIX
US Broker Dealers Leverage, S&P500, VIX
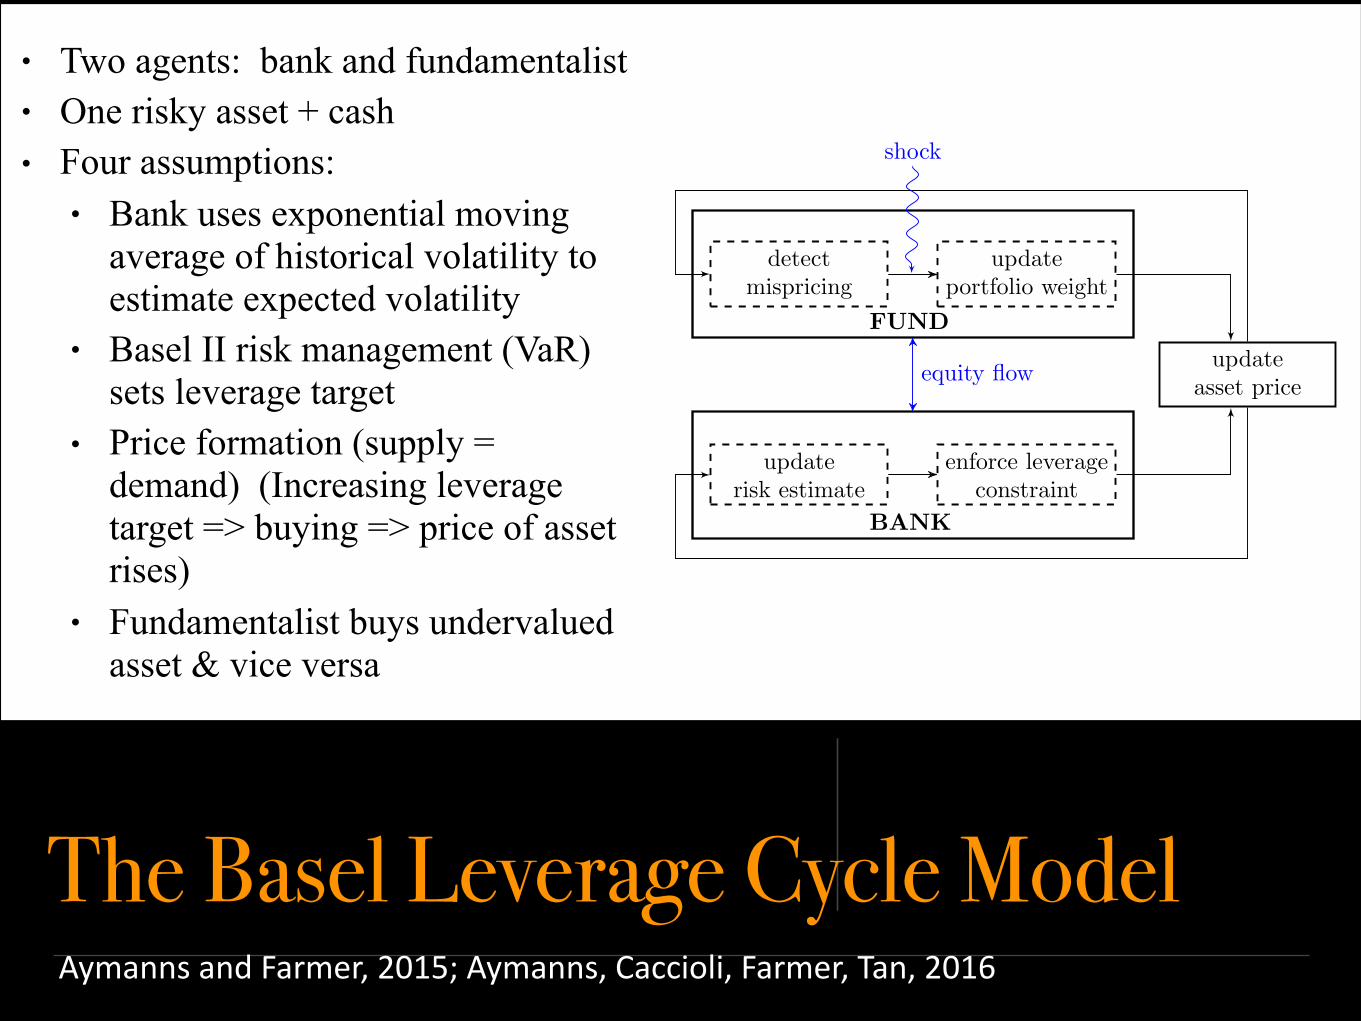
The Basel Leverage Cycle Model
detectmispricing
updateportfolio weight
updaterisk estimate
enforce leverageconstraint
updateasset price
equity flow
FUND
BANK
shock
• Two agents: bank and fundamentalist • One risky asset + cash • Four assumptions:
• Bank uses exponential moving average of historical volatility to estimate expected volatility
• Basel II risk management (VaR) sets leverage target
• Price formation (supply = demand) (Increasing leverage target => buying => price of asset rises)
• Fundamentalist buys undervalued asset & vice versa
AymannsandFarmer,2015;Aymanns,Caccioli,Farmer,Tan,2016

ModelReality
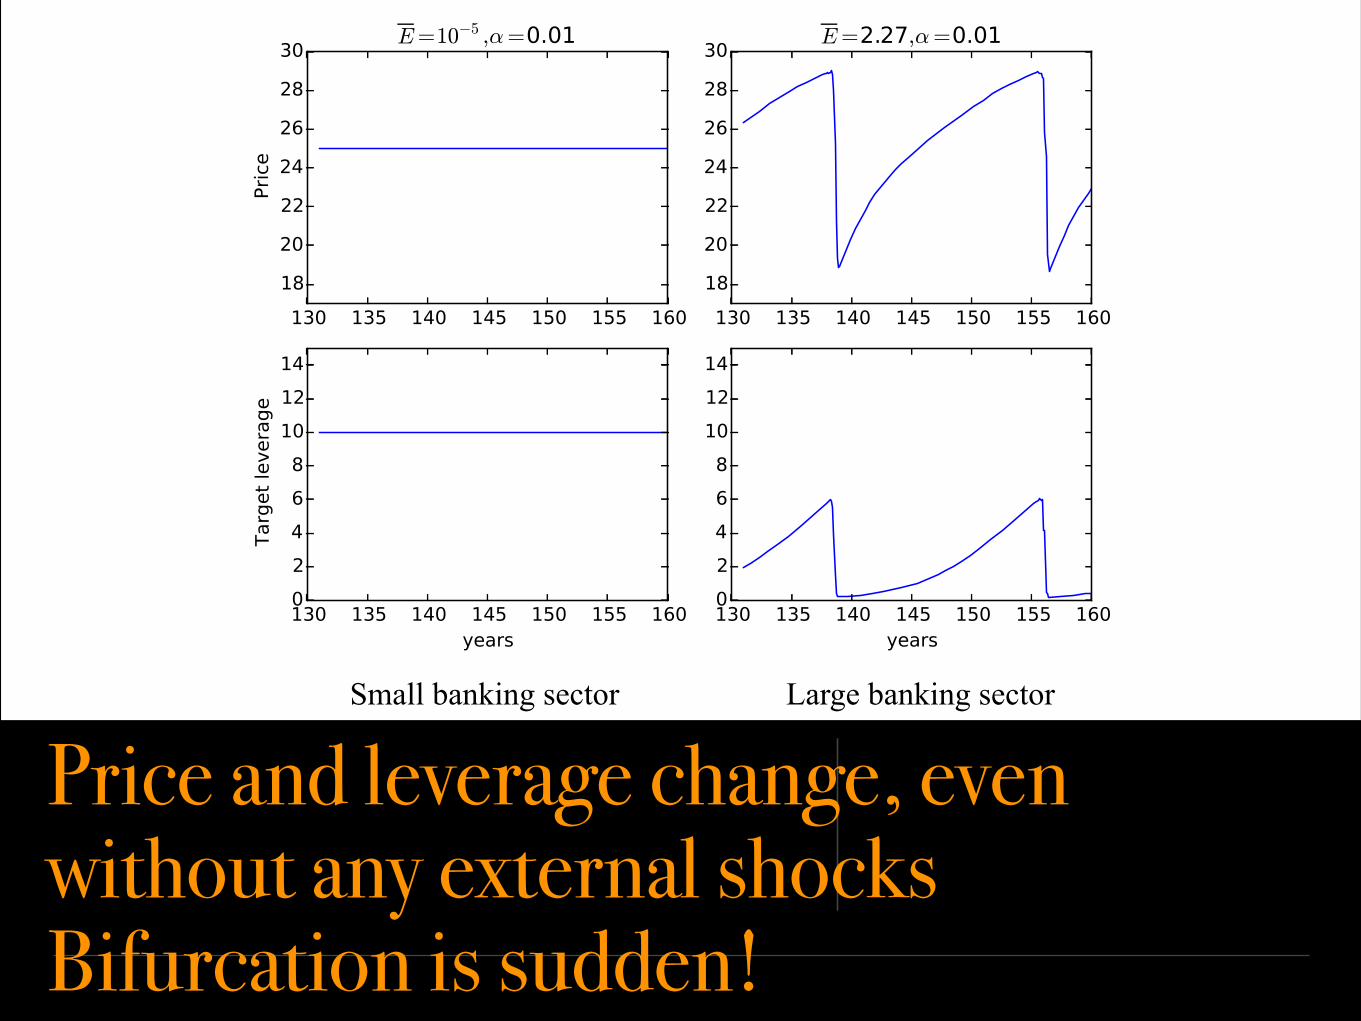
Price and leverage change, even without any external shocks Bifurcation is sudden!
Small banking sector Large banking sector

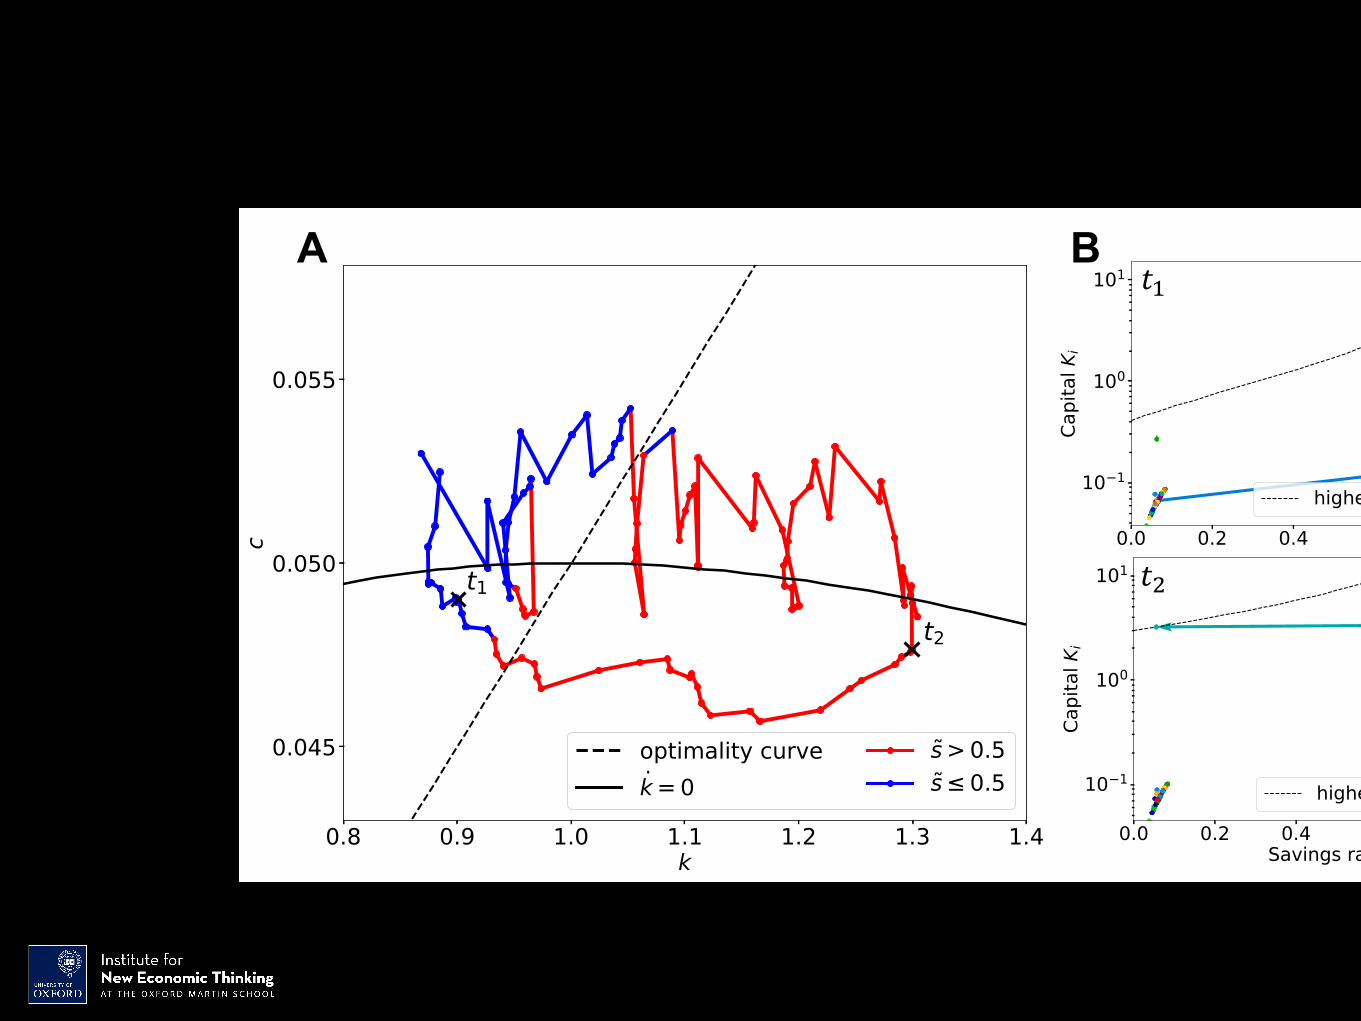
• Standard RCK model: Rational, representative household chooses savings rate to maximize discounted consumption
• Invests savings in representative firm- compromise between consumption and investment
• Our version: Heterogeneous households have social network. At intermittent intervals of average length tau, each copies savings rate of neighbor with highest consumption.
Standard macro model with bounded rationalityYuki Asano, Jakob Kolb, JDF, Jobst Heitzig

10 1 100 101 102 1030.0
0.2
0.4
0.6
0.8
1.0Sav
ings
rat
e s i
s *
sgold
s
10 2
10 1
100
prob
abili
ty

0 500 1000 1500 2000 2500 3000 35000.00
0.25
0.50
0.75
1.00Sa
ving
s ra
te si
Time evolution
s
0 500 1000 1500 2000 2500 3000 35000
5
10
15
Cap
ital
Ki
0 500 1000 1500 2000 2500 3000 35000.4
0.5
0.6
s
0.0 0.5 1.0
Histograms
si
10 1 101
Ki
10 12
Y
9
10
11
Out
put
Y
!"A B
!#
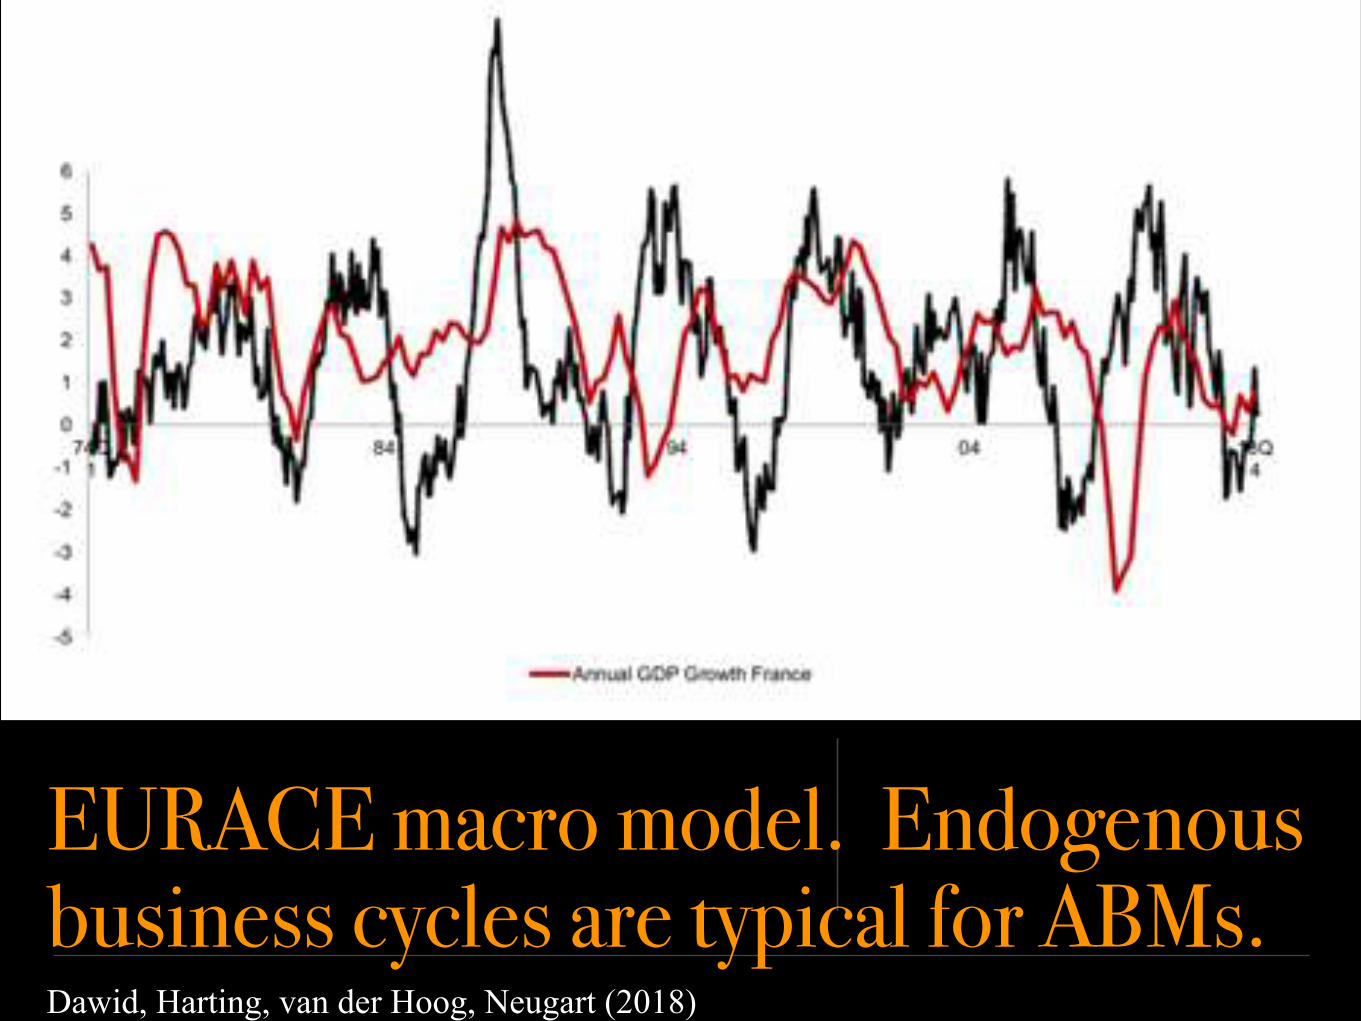
EURACE macro model. Endogenous business cycles are typical for ABMs.Dawid, Harting, van der Hoog, Neugart (2018)

Simulation of Washington DC Housing MarketAxtell, Carella, Farmer, Geanakoplos, Goldstein, Howitt and others.

And hot off the press…

The economy is an ecology of specialists
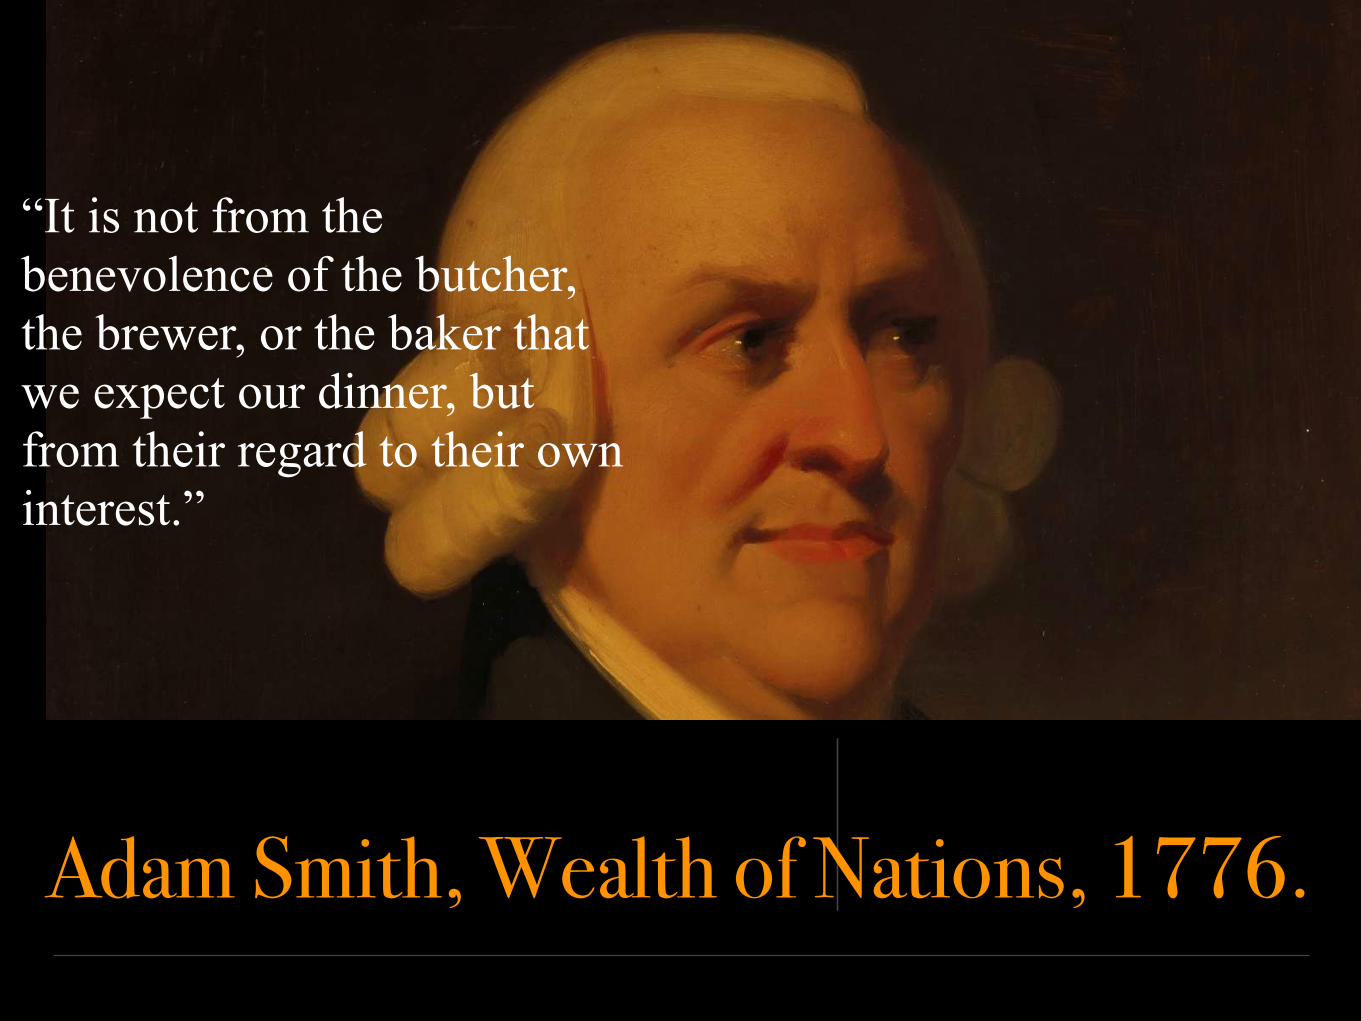
Adam Smith, Wealth of Nations, 1776.
“It is not from the benevolence of the butcher, the brewer, or the baker that we expect our dinner, but from their regard to their own interest.”
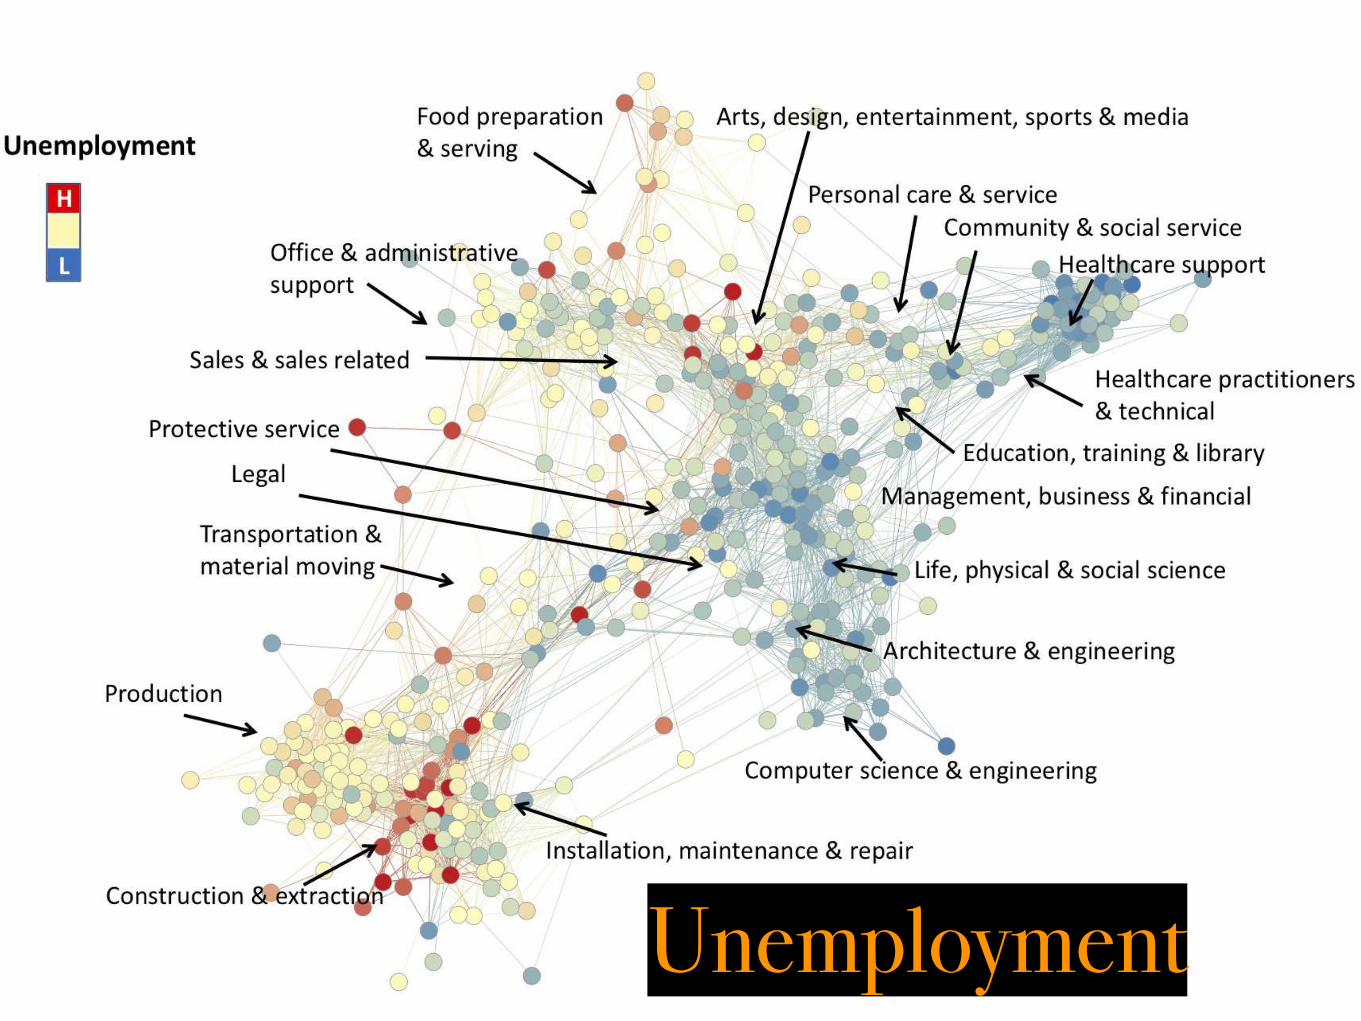
Unemployment
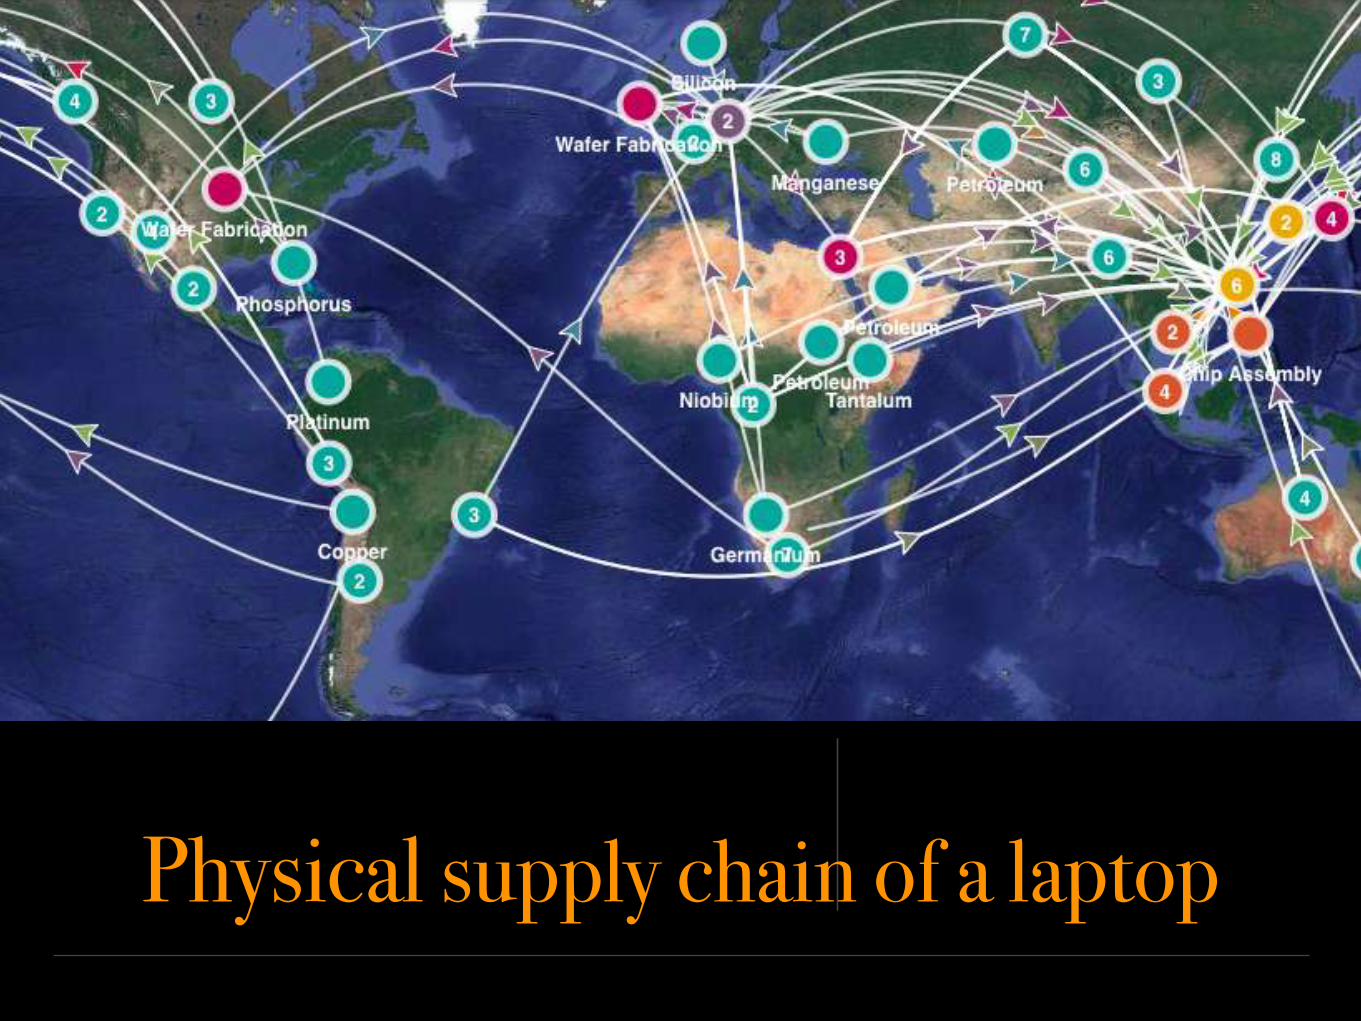
Physical supply chain of a laptop

Production Network of the USAMcNerney and Silverberg
WassilyLeontief
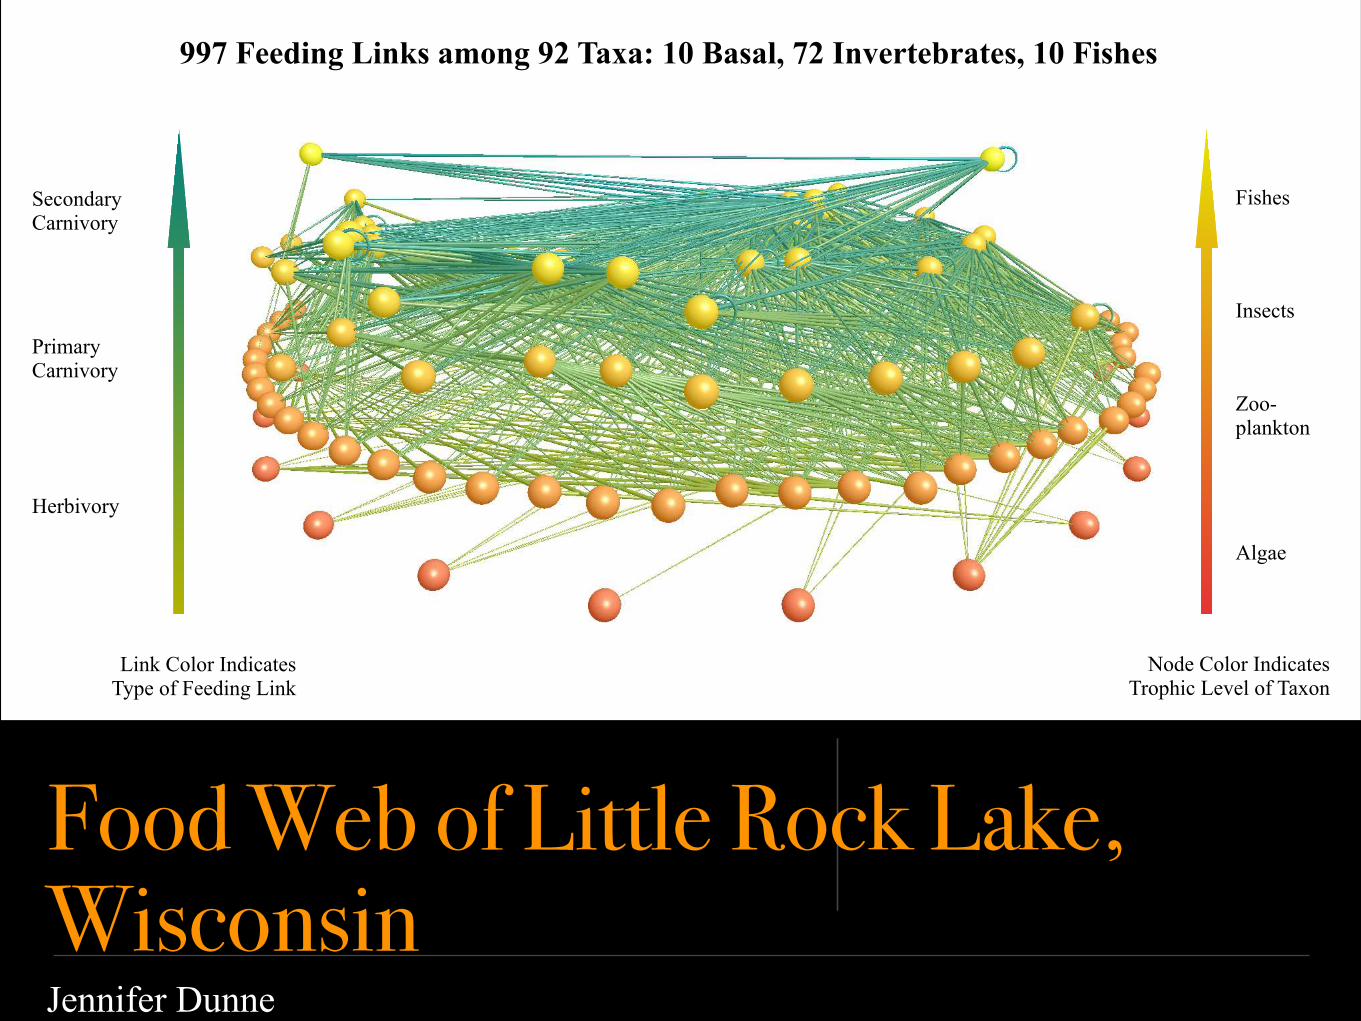
Food Web of Little Rock Lake, Wisconsin
Fishes
Insects
Zoo- plankton
Algae
Node Color Indicates Trophic Level of Taxon
Secondary Carnivory
Primary Carnivory
Herbivory
Link Color Indicates Type of Feeding Link
997 Feeding Links among 92 Taxa: 10 Basal, 72 Invertebrates, 10 Fishes
Jennifer Dunne
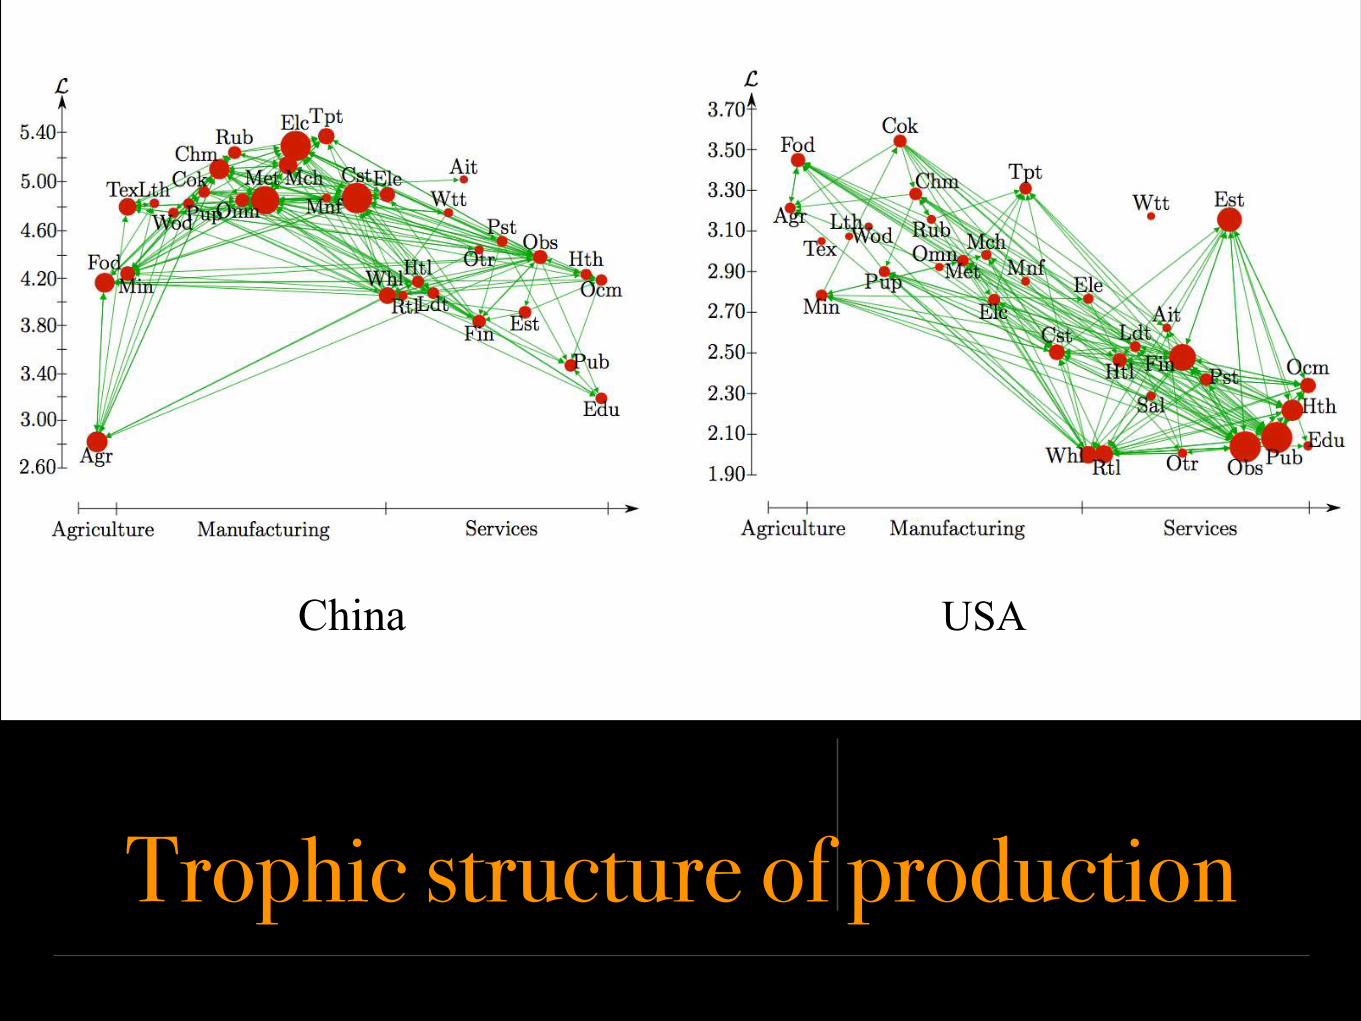
Trophic structure of production
China USA
L̄ = 1 L̄ > 1
44
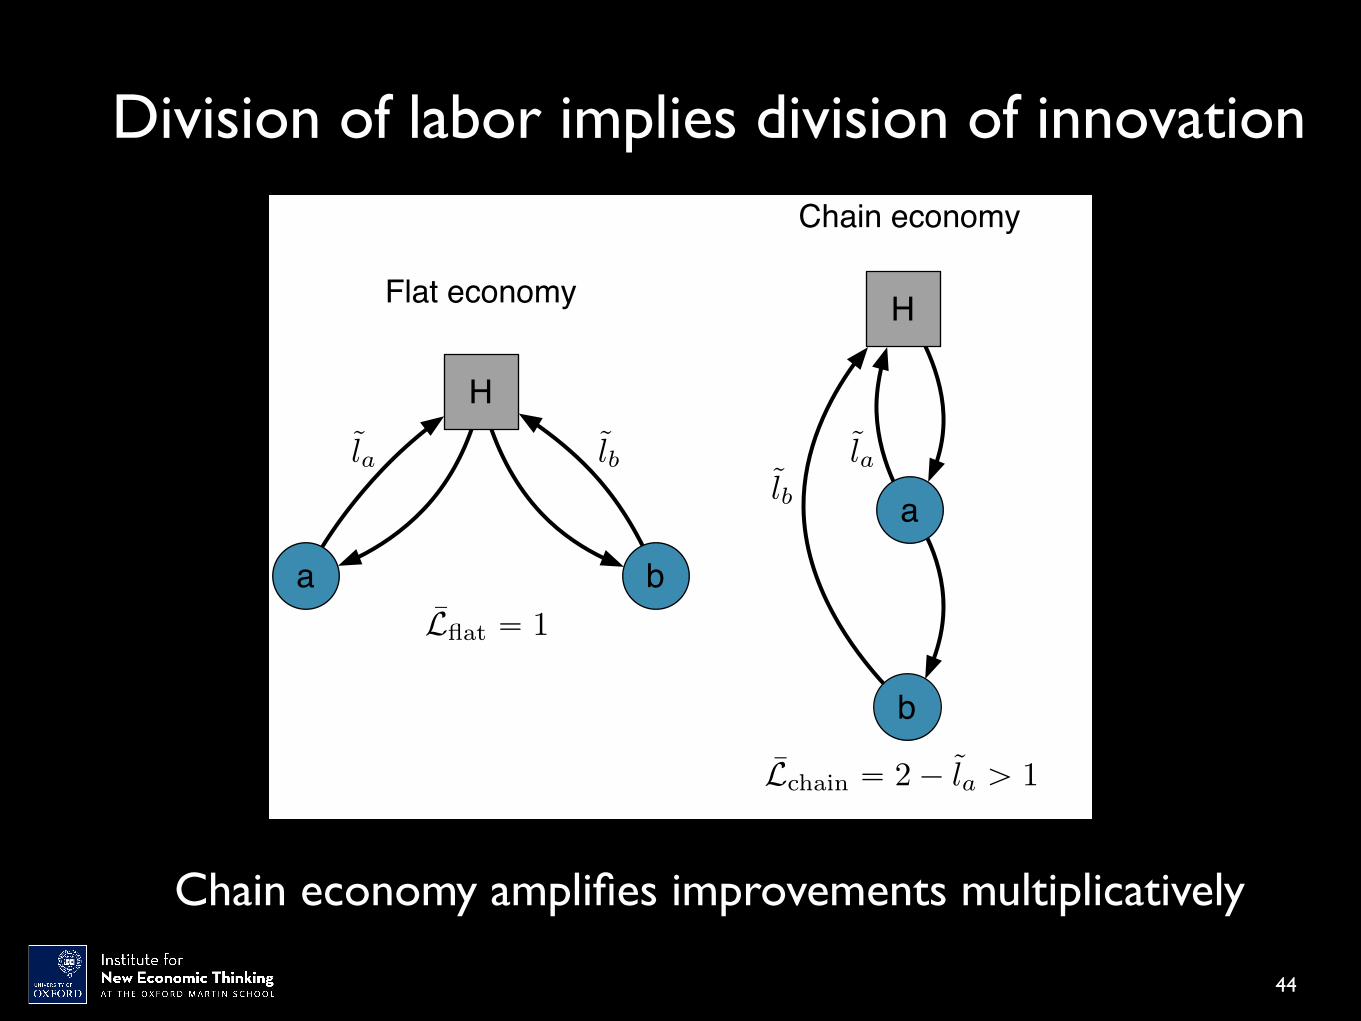
Chain economy amplifies improvements multiplicatively
Division of labor implies division of innovation
Flat economy
Chain economy
H
a b
H
b
a
L̄chain “ 2 ´ l̃a ą 1
L̄flat “ 1
l̃a l̃b l̃al̃b

Trophic level predicts economic growthMcNerney, Savoie, Caravelli, Carvalho and Farmer
Trophic level in 19951 1.5 2 2.5 3 3.5 4 4.5 5 5.5
Realprice
return
1995-2009
-0.15
-0.1
-0.05
0
0.05
0.1
0.15regressionbin average
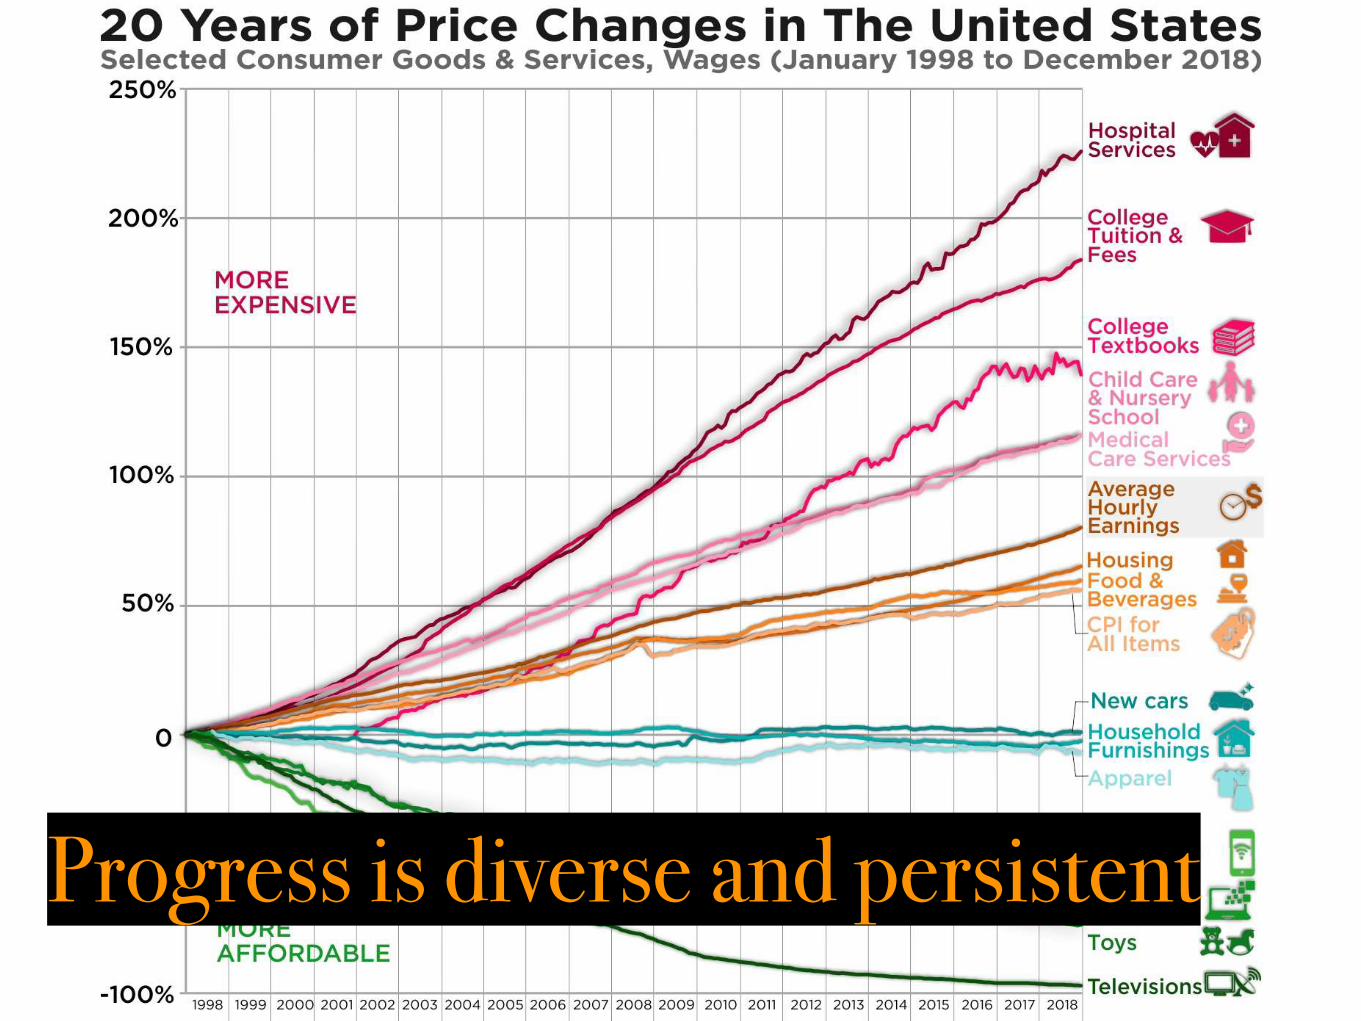
Progress is diverse and persistent
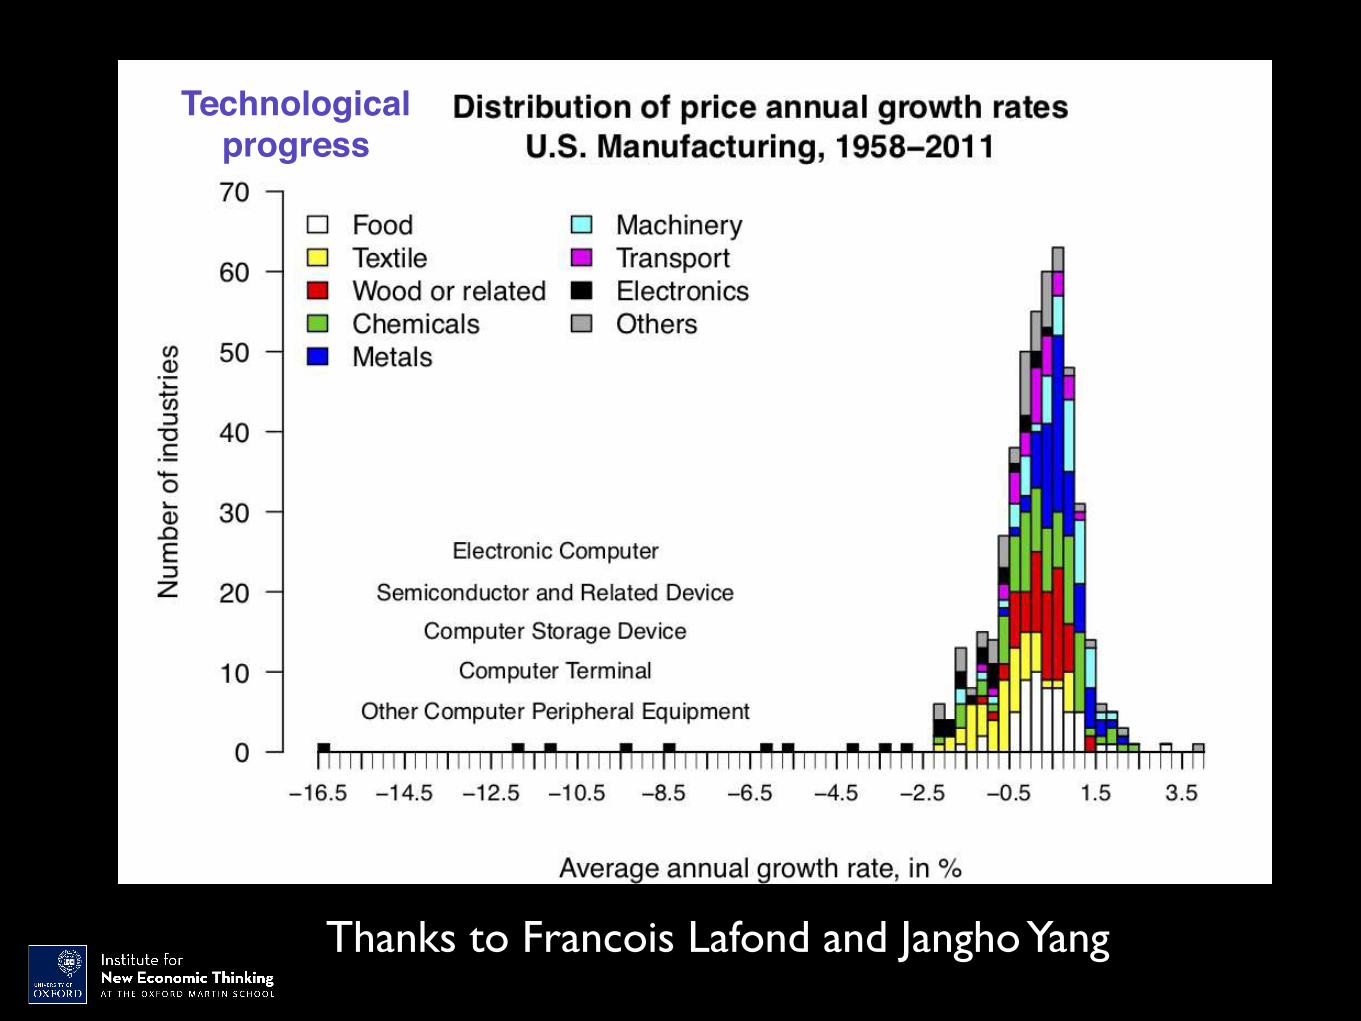
Thanks to Francois Lafond and Jangho Yang
Technologicalprogress

Can use this to forecast prices of technologiesFarmer and Lafond, 2016, Lafond et al. 2018
PV m
odul
e pr
ice
in 2
013
$/W
p
1980 1986 1992 1998 2004 2010 2016 2022 2028
0.02
0.05
0.12
0.33
0.9
2.46
6.69
± 1σ± 1.5σ± 2σ

What about Climate Change?

Bill Nordhaus says optimal warming is 3.5 degrees…

Prices and production of energy technologiesWay, Mealy and Farmer, 2020.
Cost Production

Direct-use primary energy resources
End-use sectors
Nuclear
Coal
Crude oil
Gas
Hydropower
Wind
Biopower
Solar PV
Transport
Industry
Buildings
Energy sector Energy carriers and conversions
Coal
Gas
Electricity
Batteries (daily)
Batteries (multi-day)
Electricity generation
Oil
Coal
Gas
Hydrogen
Batteries (daily)
Technology
Sector
Key:
Carrier
Energy (self-use)
Electrolysers
(for hydrogen)
(for sectors)
Components of the energy system

Scenarios for the green energy transition
Climate Catastrophe Fast Transition Slow Transition Slow Nuclear Transition

Predicted cost of the green energy transition under different scenariosWay, Mealy and Farmer, 2020.
Net present value Distribution of NPV

Fast renewable green energy transition is cheaper than business as usual!
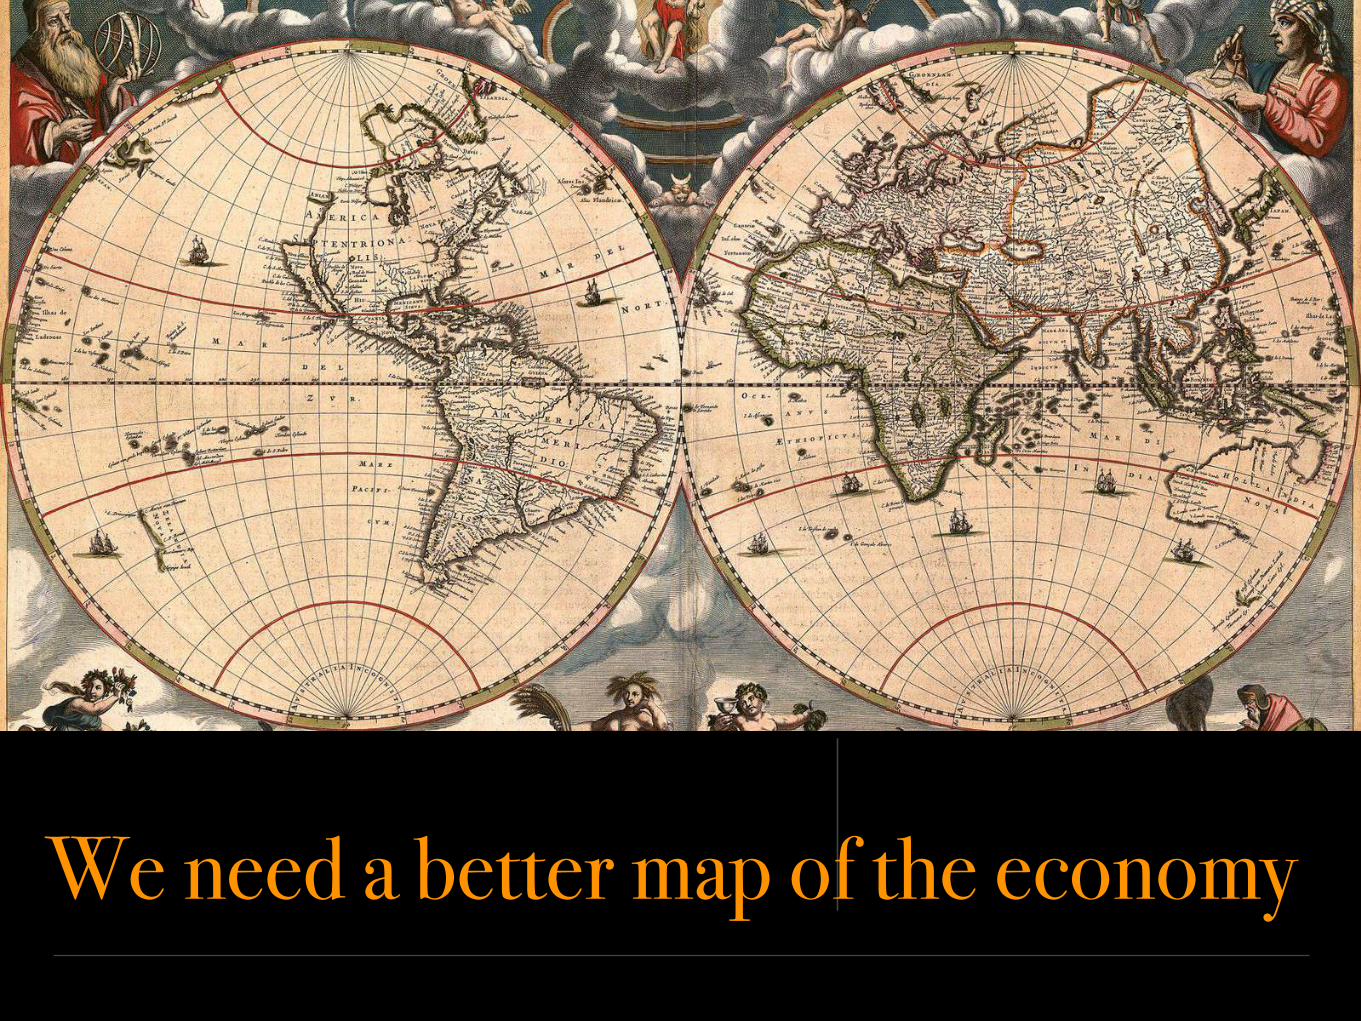
We need a better map of the economy
• Our understanding of the economy and our ability to predict on many levels will become dramatically better when we are able to map out and simulate the production network at fine scale and link to financial markets
• Ultimately we want to link to other social models, e.g. to predict how an epidemic will affect supply chains
Hypothesis

Complexity Economics is a young science

• Parameter estimation (Platt)• Initial condition estimation• Data (data, data, data, …)
Key problems to be solved for ABM to be predictive time
series models
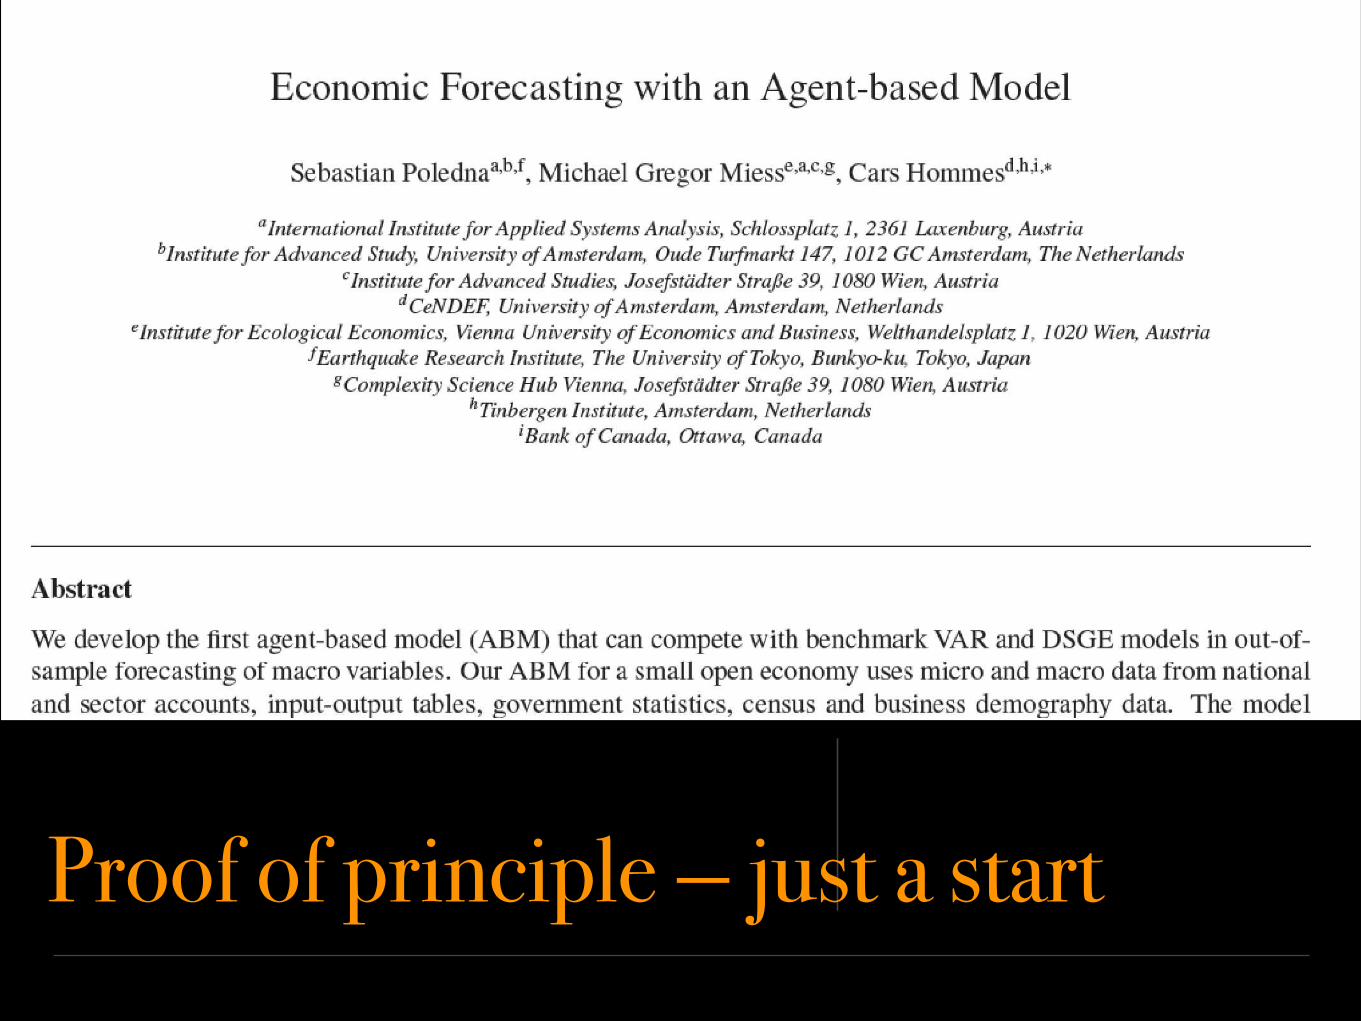
Proof of principle — just a start

Global microeconomicsLet macro emerge from micro
Takes advantage of heterogeneity Much more data at microscale Better statistical significance
Endogenous dynamics Can model emergence Predicts more things

We are facing serious problems: financial crises
inequality climate change
Complexity economics offers new solutions