the connected world greasing the wheels of the …...the connected world greasing the wheels of the...
TRANSCRIPT
The Connected World
Greasing the Wheels of the Internet EconomyA COUNTRY-BY-COUNTRY E-FRICTION ANALYSIS

The Boston Consulting Group (BCG) is a global management consulting firm and the world’s leading advisor on business strategy. We partner with clients from the private, public, and not-for-profit sectors in all regions to identify their highest-value opportunities, address their most critical challenges, and transform their enterprises. Our customized approach combines deep in sight into the dynamics of companies and markets with close collaboration at all levels of the client organization. This ensures that our clients achieve sustainable compet itive advantage, build more capable organizations, and secure lasting results. Founded in 1963, BCG is a private company with 81 offices in 45 countries. For more information, please visit bcg.com.
February 2014 | The Boston Consulting Group
GREASING THE WHEELS OF THE INTERNET ECONOMY
A COUNTRY-BY-COUNTRY E-FRICTION ANALYSIS
Paul ZWillenBerG
DOminiC FielD
DaviD Dean
The Connected World
commissioned by
2 | Greasing the Wheels of the Internet Economy
CONTENTS
3 Preface
4 The STaTe of e-fricTion around The World
8 a counTry-by-counTry e-fricTion analySiS
74 noTe To The reader

The Boston Consulting Group | 3
pREFACE
To better understand how various factors inhibit online interaction and exchange, and thereby constrain economic
activity, the internet corporation for assigned names and numbers (icann) commissioned The boston consulting Group to prepare an independent report, Greasing the Wheels of the Internet Economy. This supplement contains data for each of the economies included in the 2013 bcG e-friction index.

4 | Greasing the Wheels of the Internet Economy
THE STATE OF E-FRICTION AROuNd THE WORLd
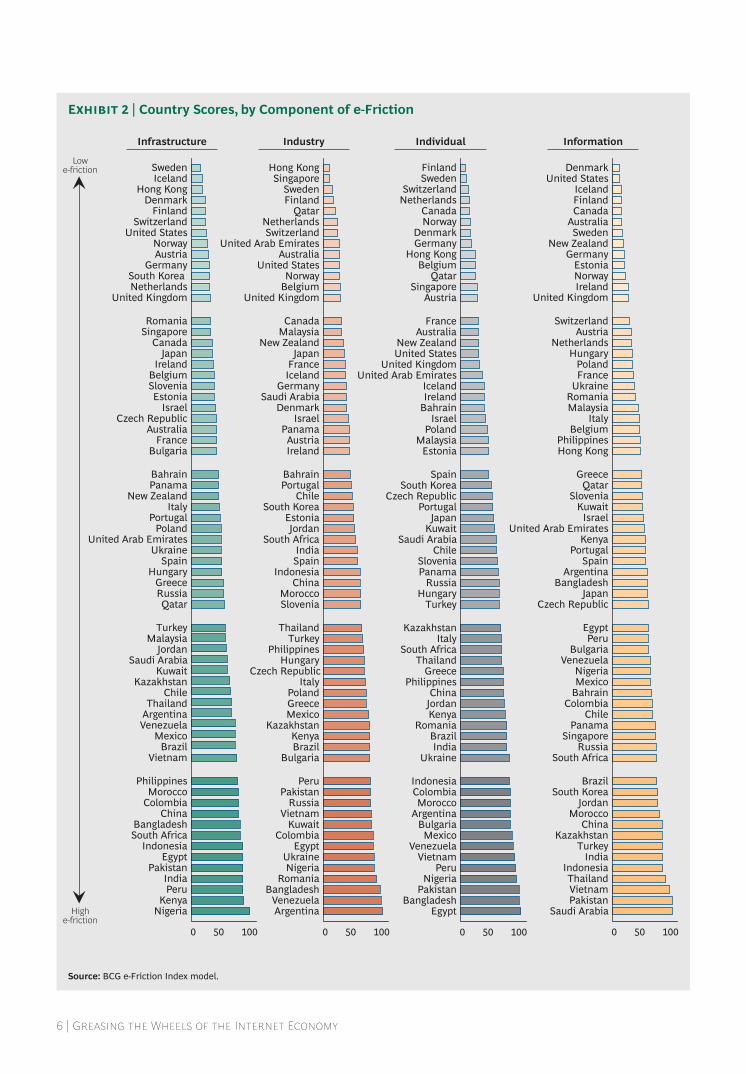
Many factors can inhibit consumers, businesses, and others from fully
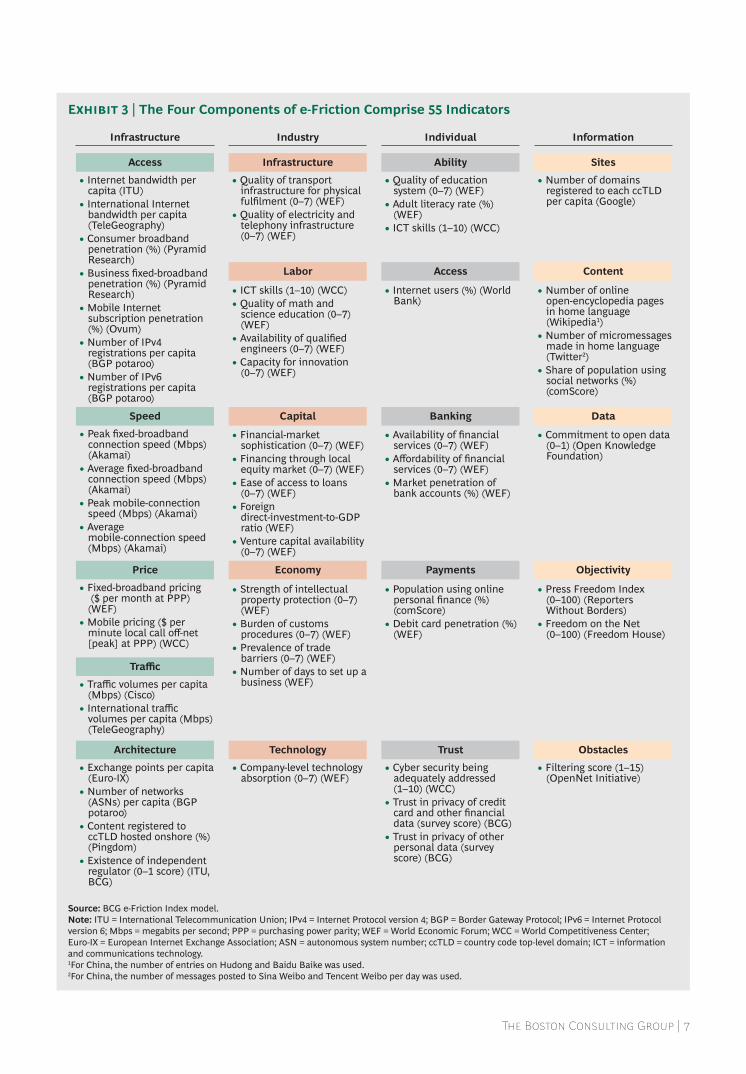
participating in the internet economy. The bcG e-friction index assesses the impact of 55 such factors on a country-by-country basis. We have grouped these indicators of friction into four components: infrastructure-related friction that limits basic internet access, industry sources that affect the ability of
companies to maintain an internet presence and engage in online transactions, individual sources that constrain consumer internet activity, and information-related friction that involves the general availability of, and access to, online content. (See exhibits 1, 2, and 3.)

The Boston Consulting Group | 5
1007550250
NigeriaPakistan
EgyptBangladesh
VietnamPeru
IndonesiaIndia
KenyaColombia
VenezuelaMorocco
China
BrazilMexico
South AfricaArgentinaThailand
PhilippinesKazakhstan
TurkeySaudi Arabia
RussiaJordan
ChileKuwait
UkraineGreece
BulgariaItaly
HungaryPanama
SpainCzech Republic
RomaniaPortugal
PolandMalaysiaBahrain
SloveniaSouth Korea
United Arab EmiratesQatarIsraelJapan
EstoniaFranceIreland
New ZealandBelgium
SingaporeAustralia
AustriaUnited Kingdom
Low e-friction
High e-friction
Infrastructure Industry Individual Information
GermanyCanada
NetherlandsNorwayIceland
United StatesHong Kong
SwitzerlandDenmark
FinlandSweden
Source: BCG e-Friction index model.
Exhibit 1 | The BCG e-Friction Index
6 | Greasing the Wheels of the Internet Economy
Infrastructure Industry Individual Information
100500
NigeriaKenya
PeruIndia
PakistanEgypt
IndonesiaSouth AfricaBangladesh
ChinaColombiaMorocco
Philippines
VietnamBrazil
MexicoVenezuelaArgentinaThailand
ChileKazakhstan
KuwaitSaudi Arabia
JordanMalaysia
Turkey
QatarRussiaGreece
HungarySpain
UkraineUnited Arab Emirates
PolandPortugal
ItalyNew Zealand
PanamaBahrain
BulgariaFrance
AustraliaCzech Republic
IsraelEstonia
SloveniaBelgium
IrelandJapan
CanadaSingaporeRomania
United KingdomNetherlandsSouth Korea
GermanyAustriaNorway
United StatesSwitzerland
FinlandDenmark
Hong KongIcelandSweden
100500
ArgentinaVenezuela
BangladeshRomania
NigeriaUkraine
EgyptColombia
KuwaitVietnam
South KoreaChile
PortugalBahrain
IrelandAustria
PanamaIsrael
DenmarkSaudi Arabia
GermanyIcelandFranceJapan
New ZealandMalaysia
Canada
United KingdomBelgiumNorway
United StatesAustralia
United Arab EmiratesSwitzerland
Netherlands
RussiaPakistan
Peru
BulgariaBrazilKenya
KazakhstanMexicoGreecePoland
ItalyCzech Republic
HungaryPhilippines
TurkeyThailand
SloveniaMorocco
ChinaIndonesia
SpainIndia
South AfricaJordan
Estonia
QatarFinlandSweden
SingaporeHong Kong
500 100
EgyptBangladesh
PakistanNigeria
PeruVietnam
VenezuelaMexico
BulgariaArgentina
MoroccoColombiaIndonesia
UkraineIndia
BrazilRomania
KenyaJordanChina
PhilippinesGreece
ThailandSouth Africa
ItalyKazakhstan
TurkeyHungary
RussiaPanamaSlovenia
ChileSaudi Arabia
KuwaitJapan
PortugalCzech Republic
South KoreaSpain
EstoniaMalaysia
PolandIsrael
BahrainIrelandIceland
United Arab EmiratesUnited Kingdom
United StatesNew Zealand
AustraliaFrance
AustriaSingapore
QatarBelgium
Hong KongGermanyDenmark
NorwayCanada
NetherlandsSwitzerland
SwedenFinland
United Kingdom
0 10050
ChileColombia
BahrainMexicoNigeria
VenezuelaBulgaria
PeruEgypt
Czech RepublicJapan
BangladeshArgentina
SpainPortugal
KenyaUnited Arab Emirates
IsraelKuwait
SloveniaQatar
Greece
Hong KongPhilippines
Belgium
Saudi ArabiaPakistanVietnamThailand
IndonesiaIndia
TurkeyKazakhstan
ChinaMorocco
JordanSouth Korea
Brazil
South AfricaRussia
SingaporePanama
ItalyMalaysiaRomaniaUkraineFrancePoland
HungaryNetherlands
AustriaSwitzerland
IrelandNorwayEstonia
GermanyNew Zealand
SwedenAustralia
CanadaFinlandIceland
United StatesDenmark
Lowe-friction
Highe-friction
Source: BCG e-Friction index model.
Exhibit 2 | Country Scores, by Component of e-Friction
The Boston Consulting Group | 7
• Internet bandwidth per capita (ITU)
• International Internet bandwidth per capita (TeleGeography)
• Consumer broadband penetration (%) (Pyramid Research)
• Business fixed-broadband penetration (%) (Pyramid Research)
• Mobile Internet subscription penetration (%) (Ovum)
• Number of IPv4 registrations per capita (BGP potaroo)
• Number of IPv6 registrations per capita (BGP potaroo)
• Quality of transport infrastructure for physical fulfilment (0–7) (WEF)
• Quality of electricity and telephony infrastructure (0–7) (WEF)
• Quality of education system (0–7) (WEF)
• Adult literacy rate (%) (WEF)
• ICT skills (1–10) (WCC)
• Number of domains registered to each ccTLD per capita (Google)
• Number of online open-encyclopedia pages in home language (Wikipedia1)
• Number of micromessages made in home language (Twitter2)
• Share of population using social networks (%) (comScore)
• Commitment to open data (0–1) (Open Knowledge Foundation)
• Press Freedom Index (0–100) (Reporters Without Borders)
• Freedom on the Net (0–100) (Freedom House)
• Filtering score (1–15) (OpenNet Initiative)
• Internet users (%) (World Bank)
• Availability of financial services (0–7) (WEF)
• Affordability of financial services (0–7) (WEF)
• Market penetration of bank accounts (%) (WEF)
• Population using online personal finance (%) (comScore)
• Debit card penetration (%) (WEF)
• Cyber security being adequately addressed (1–10) (WCC)
• Trust in privacy of credit card and other financial data (survey score) (BCG)
• Trust in privacy of other personal data (survey score) (BCG)
• ICT skills (1–10) (WCC)• Quality of math and
science education (0–7) (WEF)
• Availability of qualified engineers (0–7) (WEF)
• Capacity for innovation (0–7) (WEF)
• Financial-market sophistication (0–7) (WEF)
• Financing through local equity market (0–7) (WEF)
• Ease of access to loans (0–7) (WEF)
• Foreign direct-investment-to-GDP ratio (WEF)
• Venture capital availability (0–7) (WEF)
• Strength of intellectual property protection (0–7) (WEF)
• Burden of customs procedures (0–7) (WEF)
• Prevalence of trade barriers (0–7) (WEF)
• Number of days to set up a business (WEF)
• Company-level technology absorption (0–7) (WEF)
• Peak fixed-broadband connection speed (Mbps) (Akamai)
• Average fixed-broadband connection speed (Mbps) (Akamai)
• Peak mobile-connection speed (Mbps) (Akamai)
• Average mobile-connection speed (Mbps) (Akamai)
• Fixed-broadband pricing ($ per month at PPP) (WEF)
• Mobile pricing ($ per minute local call off-net [peak] at PPP) (WCC)
• Traffic volumes per capita (Mbps) (Cisco)
• International traffic volumes per capita (Mbps) (TeleGeography)
• Exchange points per capita (Euro-IX)
• Number of networks (ASNs) per capita (BGP potaroo)
• Content registered to ccTLD hosted onshore (%) (Pingdom)
• Existence of independent regulator (0–1 score) (ITU, BCG)
Infrastructure
Access
Speed
Price
Traffic
Architecture
Information
Sites
Content
Data
Objectivity
Obstacles
Industry
Infrastructure
Labor
Capital
Economy
Technology
Individual
Ability
Access
Banking
Payments
Trust
Source: BCG e-Friction index model.Note: iTu = international Telecommunication union; iPv4 = internet Protocol version 4; BGP = Border Gateway Protocol; iPv6 = internet Protocol version 6; mbps = megabits per second; PPP = purchasing power parity; WeF = World economic Forum; WCC = World Competitiveness Center; euro-iX = european internet exchange association; aSn = autonomous system number; ccTlD = country code top-level domain; iCT = information and communications technology.1For China, the number of entries on Hudong and Baidu Baike was used.2For China, the number of messages posted to Sina Weibo and Tencent Weibo per day was used.
Exhibit 3 | The Four Components of e-Friction Comprise 55 Indicators

8 | Greasing the Wheels of the Internet Economy
A COuNTRY-bY-COuNTRY E-FRICTION ANALYSIS
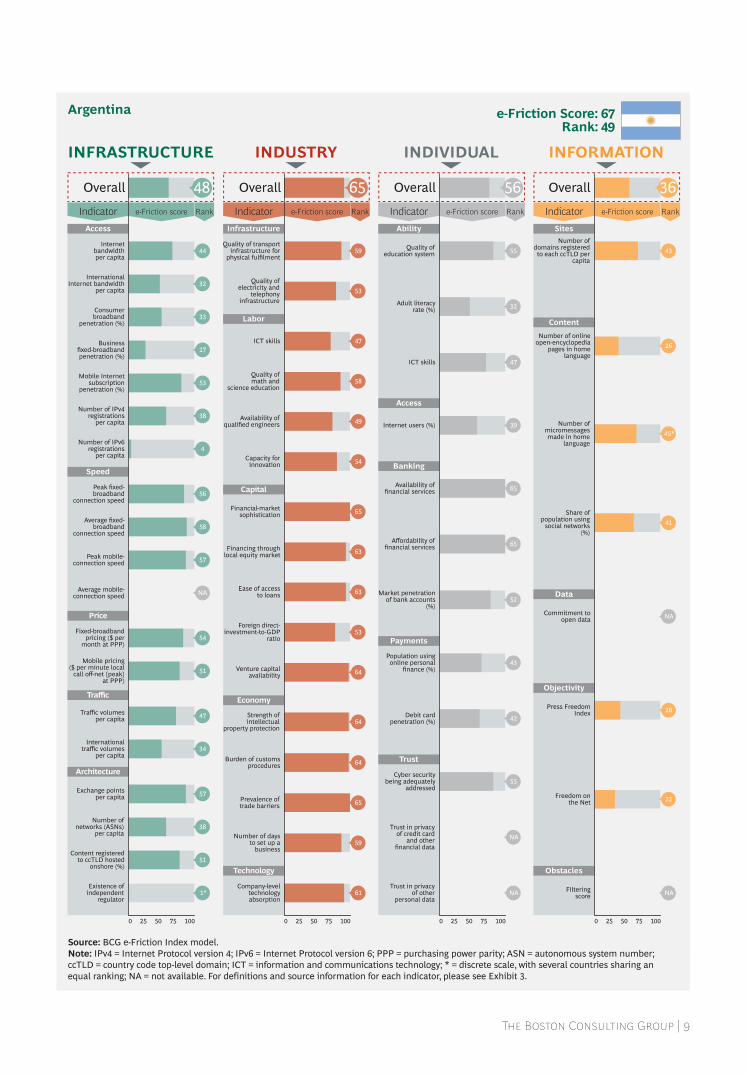
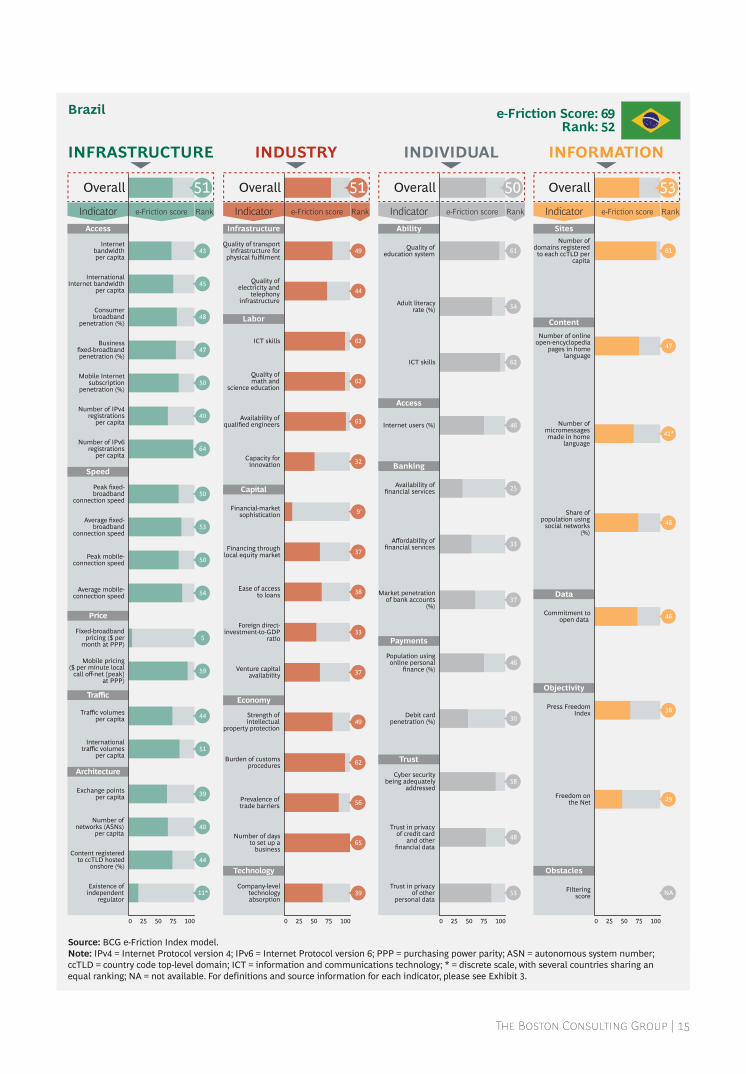
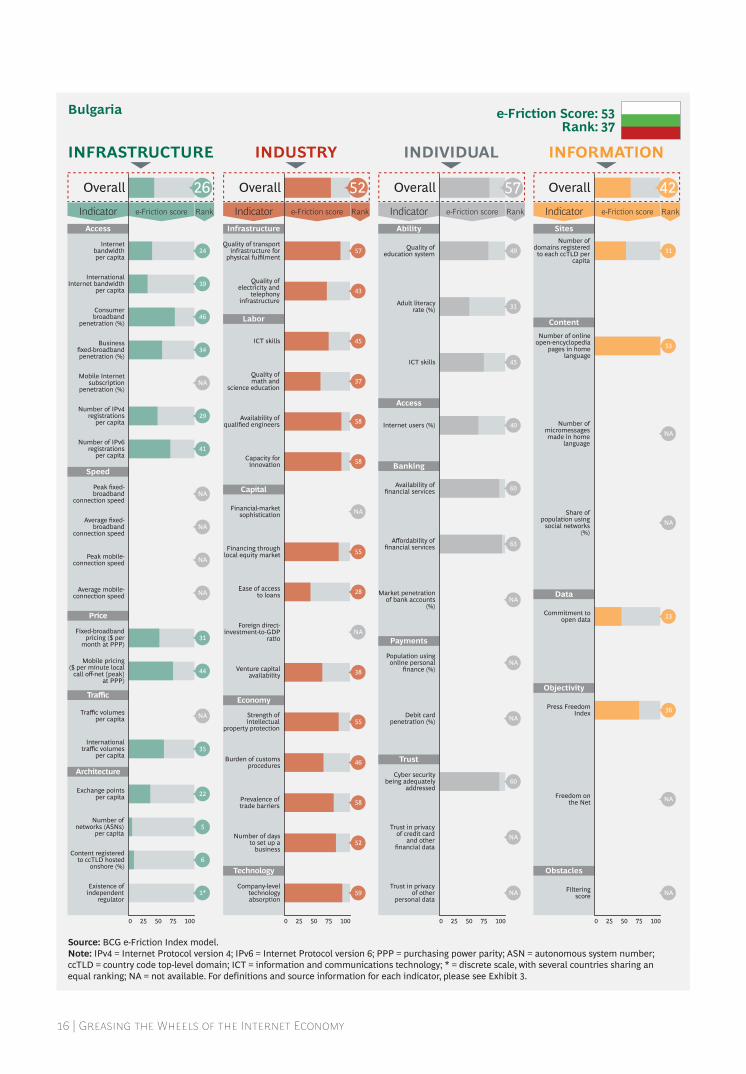
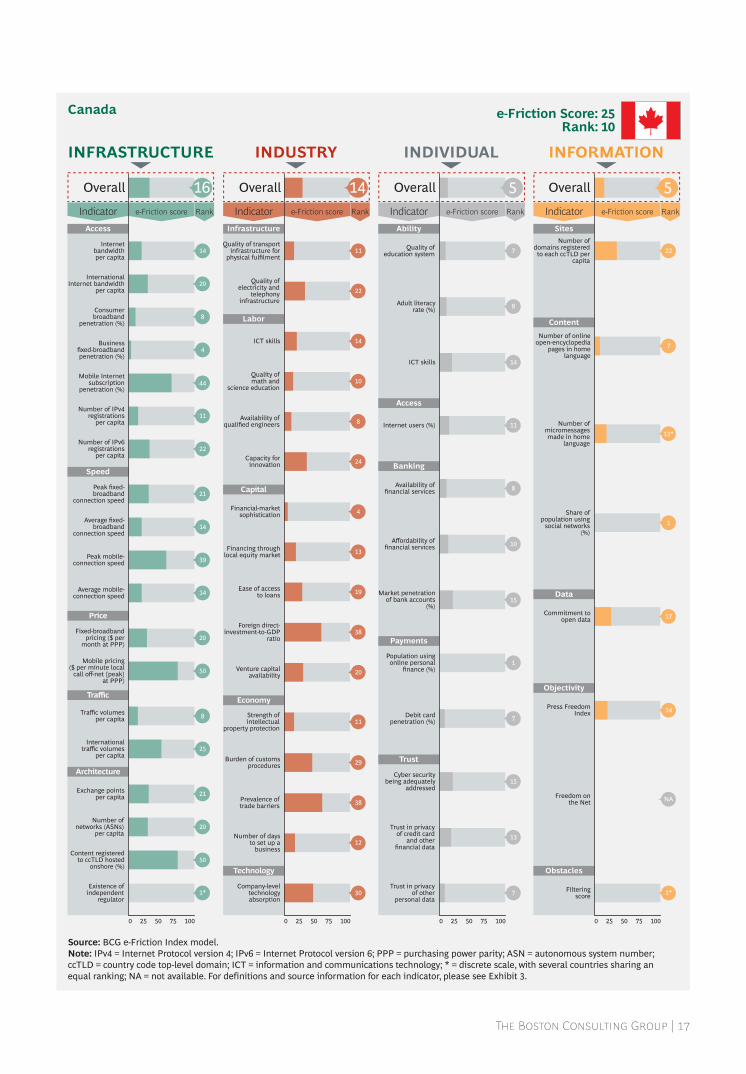
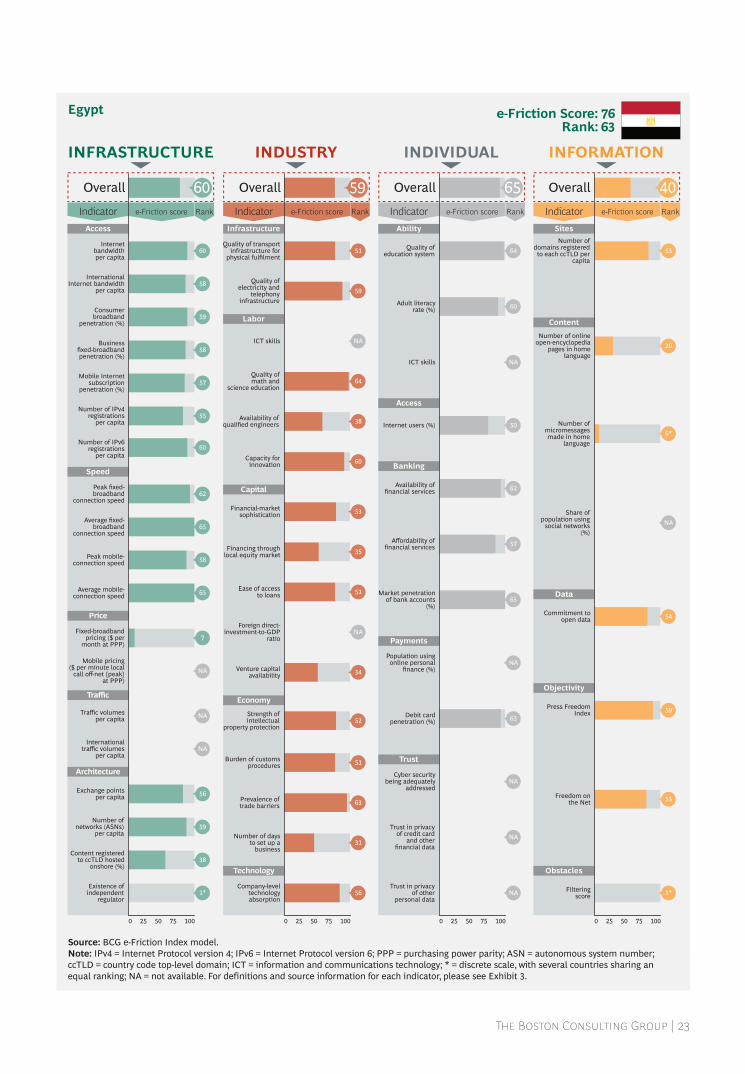
The bcG e-friction index rates coun-tries on a scale of 0 to 100. no economy
is entirely frictionless, of course, and sources of friction evolve over time, but a hypotheti-cal country that comes out on top on all 55 friction indicators in our index today would score 0—or no e-friction. a country that ranks last across the board would score 100. We scored actual countries against these baselines.
The 55 indicators are interrelated and work together to determine the overall friction af-fecting the digital economy of a particular
country. each country can gain an under-standing of how it compares with neighbors and competitors by assessing its rankings across the different types of friction. it can thus determine where its efforts to eliminate sources of friction are best aimed.
The exhibits on the following pages provide the details of each country’s e-friction score.
The Boston Consulting Group | 9
Speed
Architecture
Traffic
Price
0 50 7525 100
Infrastructure
Labor
Technology
Economy
Capital
0 50 7525 100
Ability
Access
Trust
Payments
Banking
0 50 7525 100
Sites
Content
Obstacles
Objectivity
Data
0 50 7525 100
Access
Internetbandwidthper capita
Quality of transportinfrastructure for
physical fulfilmentQuality of
education system
Number ofdomains registeredto each ccTLD per
capita
Number of onlineopen-encyclopedia
pages in homelanguage
Number ofmicromessagesmade in home
language
Share ofpopulation using
social networks(%)
Commitment toopen data
Press FreedomIndex
Freedom onthe Net
Filteringscore
Adult literacyrate (%)
ICT skills
Internet users (%)
Availability offinancial services
Affordability offinancial services
Market penetrationof bank accounts
(%)
Population usingonline personal
finance (%)
Debit cardpenetration (%)
Cyber securitybeing adequately
addressed
Trust in privacyof credit card
and otherfinancial data
Trust in privacyof other
personal data
Quality ofelectricity and
telephonyinfrastructure
ICT skills
Quality ofmath and
science education
Availability ofqualified engineers
Capacity forinnovation
Financial-marketsophistication
Financing throughlocal equity market
Ease of accessto loans
Foreign direct-investment-to-GDP
ratio
Venture capitalavailability
Strength ofintellectual
property protection
Burden of customsprocedures
Prevalence oftrade barriers
Number of daysto set up a
business
Company-leveltechnologyabsorption
InternationalInternet bandwidth
per capita
Consumerbroadband
penetration (%)
Businessfixed-broadbandpenetration (%)
Mobile Internetsubscription
penetration (%)
Number of IPv4registrations
per capita
Number of IPv6registrations
per capita
Peak fixed-broadband
connection speed
Average fixed-broadband
connection speed
Peak mobile-connection speed
Average mobile-connection speed
Fixed-broadbandpricing ($ per
month at PPP)
Mobile pricing($ per minute local
call off-net [peak]at PPP)
Traffic volumesper capita
Internationaltraffic volumes
per capita
Exchange pointsper capita
Number ofnetworks (ASNs)
per capita
Content registeredto ccTLD hosted
onshore (%)
Existence ofindependent
regulator
INFRASTRUCTURE
Indicator Ranke-Friction score e-Friction score
INDUSTRY
Indicator Rank e-Friction score Rank e-Friction score Rank
INDIVIDUAL
Indicator
INFORMATION
Indicator
Overall Overall Overall Overall
43
26
45*
41
NA
NA
28
22
44
32
33
17
53
38
4
56
58
57
NA
54
51
47
34
57
38
51
1*
59
53
47
58
49
54
65
63
63
64
64
64
65
59
61
53
55
32
47
39
65
65
52
43
42
55
NA
NA
e-Friction Score: 67Rank: 49
48 65 56 36
Argentina
Source: BCG e-Friction index model.Note: iPv4 = internet Protocol version 4; iPv6 = internet Protocol version 6; PPP = purchasing power parity; aSn = autonomous system number; ccTlD = country code top-level domain; iCT = information and communications technology; * = discrete scale, with several countries sharing an equal ranking; na = not available. For definitions and source information for each indicator, please see exhibit 3.
10 | Greasing the Wheels of the Internet Economy
Speed
Architecture
Traffic
Price
0 50 7525 100
Infrastructure
Labor
Technology
Economy
Capital
0 50 7525 100
Ability
Access
Trust
Payments
Banking
0 50 7525 100
Sites
Content
Obstacles
Objectivity
Data
0 50 7525 100
Access
Internetbandwidthper capita
Quality of transportinfrastructure for
physical fulfilmentQuality of
education system
Number ofdomains registeredto each ccTLD per
capita
Number of onlineopen-encyclopedia
pages in homelanguage
Number ofmicromessagesmade in home
language
Share ofpopulation using
social networks(%)
Commitment toopen data
Press FreedomIndex
Freedom onthe Net
Filteringscore
Adult literacyrate (%)
ICT skills
Internet users (%)
Availability offinancial services
Affordability offinancial services
Market penetrationof bank accounts
(%)
Population usingonline personal
finance (%)
Debit cardpenetration (%)
Cyber securitybeing adequately
addressed
Trust in privacyof credit card
and otherfinancial data
Trust in privacyof other
personal data
Quality ofelectricity and
telephonyinfrastructure
ICT skills
Quality ofmath and
science education
Availability ofqualified engineers
Capacity forinnovation
Financial-marketsophistication
Financing throughlocal equity market
Ease of accessto loans
Foreign direct-investment-to-GDP
ratio
Venture capitalavailability
Strength ofintellectual
property protection
Burden of customsprocedures
Prevalence oftrade barriers
Number of daysto set up a
business
Company-leveltechnologyabsorption
InternationalInternet bandwidth
per capita
Consumerbroadband
penetration (%)
Businessfixed-broadbandpenetration (%)
Mobile Internetsubscription
penetration (%)
Number of IPv4registrations
per capita
Number of IPv6registrations
per capita
Peak fixed-broadband
connection speed
Average fixed-broadband
connection speed
Peak mobile-connection speed
Average mobile-connection speed
Fixed-broadbandpricing ($ per
month at PPP)
Mobile pricing($ per minute local
call off-net [peak]at PPP)
Traffic volumesper capita
Internationaltraffic volumes
per capita
Exchange pointsper capita
Number ofnetworks (ASNs)
per capita
Content registeredto ccTLD hosted
onshore (%)
Existence ofindependent
regulator
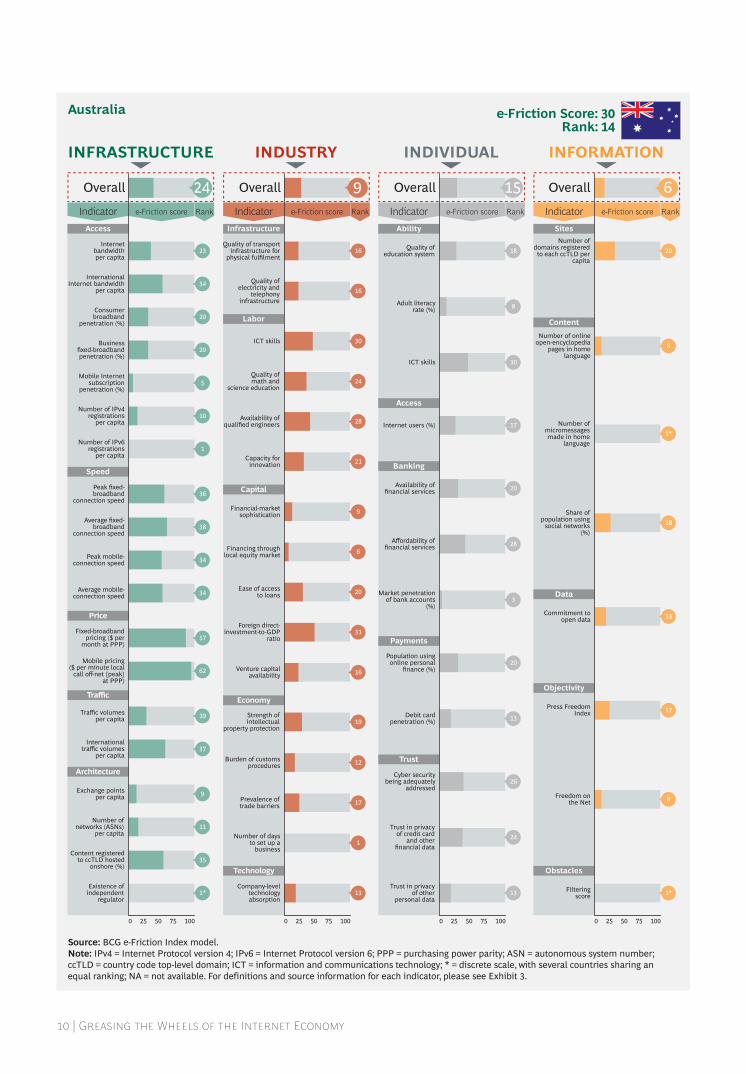
e-Friction Score: 30Rank: 14
INFRASTRUCTURE
Indicator Ranke-Friction score e-Friction score
INDUSTRY
Indicator Rank e-Friction score Rank e-Friction score Rank
INDIVIDUAL
Indicator
INFORMATION
Indicator
Overall Overall Overall Overall24 9 15 6
20
8
1*
18
13
17
8
1*
23
34
20
20
5
10
1
36
38
34
34
57
62
19
37
9
11
35
1*
16
16
30
24
28
21
9
6
20
16
19
12
17
1
13
31
18
8
30
17
20
28
3
20
13
26
24
13
Australia
Source: BCG e-Friction index model.Note: iPv4 = internet Protocol version 4; iPv6 = internet Protocol version 6; PPP = purchasing power parity; aSn = autonomous system number; ccTlD = country code top-level domain; iCT = information and communications technology; * = discrete scale, with several countries sharing an equal ranking; na = not available. For definitions and source information for each indicator, please see exhibit 3.
The Boston Consulting Group | 11
Speed
Architecture
Traffic
Price
0 50 7525 100
Infrastructure
Labor
Technology
Economy
Capital
0 50 7525 100
Ability
Access
Trust
Payments
Banking
0 50 7525 100
Sites
Content
Obstacles
Objectivity
Data
0 50 7525 100
Access
Internetbandwidthper capita
Quality of transportinfrastructure for
physical fulfilmentQuality of
education system
Number ofdomains registeredto each ccTLD per
capita
Number of onlineopen-encyclopedia
pages in homelanguage
Number ofmicromessagesmade in home
language
Share ofpopulation using
social networks(%)
Commitment toopen data
Press FreedomIndex
Freedom onthe Net
Filteringscore
Adult literacyrate (%)
ICT skills
Internet users (%)
Availability offinancial services
Affordability offinancial services
Market penetrationof bank accounts
(%)
Population usingonline personal
finance (%)
Debit cardpenetration (%)
Cyber securitybeing adequately
addressed
Trust in privacyof credit card
and otherfinancial data
Trust in privacyof other
personal data
Quality ofelectricity and
telephonyinfrastructure
ICT skills
Quality ofmath and
science education
Availability ofqualified engineers
Capacity forinnovation
Financial-marketsophistication
Financing throughlocal equity market
Ease of accessto loans
Foreign direct-investment-to-GDP
ratio
Venture capitalavailability
Strength ofintellectual
property protection
Burden of customsprocedures
Prevalence oftrade barriers
Number of daysto set up a
business
Company-leveltechnologyabsorption
InternationalInternet bandwidth
per capita
Consumerbroadband
penetration (%)
Businessfixed-broadbandpenetration (%)
Mobile Internetsubscription
penetration (%)
Number of IPv4registrations
per capita
Number of IPv6registrations
per capita
Peak fixed-broadband
connection speed
Average fixed-broadband
connection speed
Peak mobile-connection speed
Average mobile-connection speed
Fixed-broadbandpricing ($ per
month at PPP)
Mobile pricing($ per minute local
call off-net [peak]at PPP)
Traffic volumesper capita
Internationaltraffic volumes
per capita
Exchange pointsper capita
Number ofnetworks (ASNs)
per capita
Content registeredto ccTLD hosted
onshore (%)
Existence ofindependent
regulator
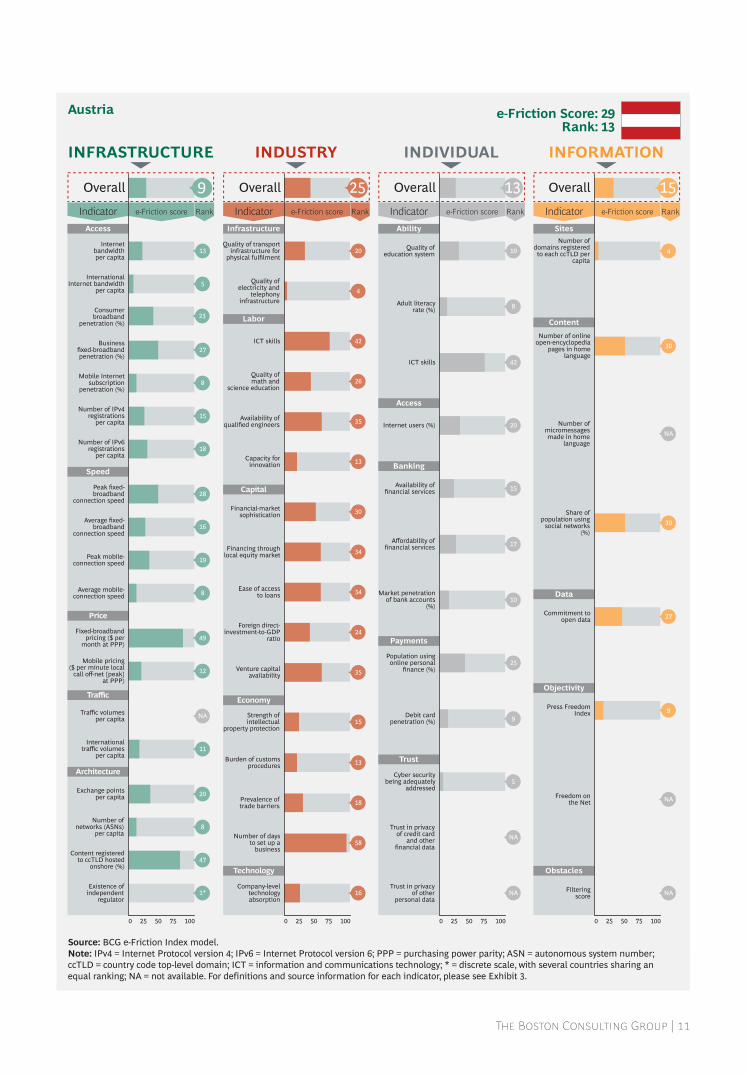
e-Friction Score: 29Rank: 13
INFRASTRUCTURE
Indicator Ranke-Friction score e-Friction score
INDUSTRY
Indicator Rank e-Friction score Rank e-Friction score Rank
INDIVIDUAL
Indicator
INFORMATION
Indicator
Overall Overall Overall Overall
30
4
NA
30
27
9
NA
NA
13
5
23
27
8
15
18
28
16
19
8
49
12
NA
11
20
8
47
1*
20
4
42
26
35
13
30
34
34
35
15
13
18
58
16
24
19
8
42
20
15
17
10
25
9
5
NA
NA
9 25 13 15
Austria
Source: BCG e-Friction index model.Note: iPv4 = internet Protocol version 4; iPv6 = internet Protocol version 6; PPP = purchasing power parity; aSn = autonomous system number; ccTlD = country code top-level domain; iCT = information and communications technology; * = discrete scale, with several countries sharing an equal ranking; na = not available. For definitions and source information for each indicator, please see exhibit 3.

12 | Greasing the Wheels of the Internet Economy
Speed
Architecture
Traffic
Price
0 50 7525 100
Infrastructure
Labor
Technology
Economy
Capital
0 50 7525 100
Ability
Access
Trust
Payments
Banking
0 50 7525 100
Sites
Content
Obstacles
Objectivity
Data
0 50 7525 100
Access
Internetbandwidthper capita
Quality of transportinfrastructure for
physical fulfilmentQuality of
education system
Number ofdomains registeredto each ccTLD per
capita
Number of onlineopen-encyclopedia
pages in homelanguage
Number ofmicromessagesmade in home
language
Share ofpopulation using
social networks(%)
Commitment toopen data
Press FreedomIndex
Freedom onthe Net
Filteringscore
Adult literacyrate (%)
ICT skills
Internet users (%)
Availability offinancial services
Affordability offinancial services
Market penetrationof bank accounts
(%)
Population usingonline personal
finance (%)
Debit cardpenetration (%)
Cyber securitybeing adequately
addressed
Trust in privacyof credit card
and otherfinancial data
Trust in privacyof other
personal data
Quality ofelectricity and
telephonyinfrastructure
ICT skills
Quality ofmath and
science education
Availability ofqualified engineers
Capacity forinnovation
Financial-marketsophistication
Financing throughlocal equity market
Ease of accessto loans
Foreign direct-investment-to-GDP
ratio
Venture capitalavailability
Strength ofintellectual
property protection
Burden of customsprocedures
Prevalence oftrade barriers
Number of daysto set up a
business
Company-leveltechnologyabsorption
InternationalInternet bandwidth
per capita
Consumerbroadband
penetration (%)
Businessfixed-broadbandpenetration (%)
Mobile Internetsubscription
penetration (%)
Number of IPv4registrations
per capita
Number of IPv6registrations
per capita
Peak fixed-broadband
connection speed
Average fixed-broadband
connection speed
Peak mobile-connection speed
Average mobile-connection speed
Fixed-broadbandpricing ($ per
month at PPP)
Mobile pricing($ per minute local
call off-net [peak]at PPP)
Traffic volumesper capita
Internationaltraffic volumes
per capita
Exchange pointsper capita
Number ofnetworks (ASNs)
per capita
Content registeredto ccTLD hosted
onshore (%)
Existence ofindependent
regulator
e-Friction Score: 44Rank: 27
INFRASTRUCTURE
Indicator Ranke-Friction score e-Friction score
INDUSTRY
Indicator Rank e-Friction score Rank e-Friction score Rank
INDIVIDUAL
Indicator
INFORMATION
Indicator
Overall Overall Overall Overall
40
NA
29
29
NA
43
45
49
18
26
6
NA
12
27
23
15
39
27 NA
NA
NA
21
NA
32
8
18
9
NA
52
30 15
10
6*
NA
62
63
61
60*
NA
NA
NA
NA
NA
NA
NA
NA
NA
7
26
29
1*
45
39
NA
33
27 27 22 46
Bahrain
Source: BCG e-Friction index model.Note: iPv4 = internet Protocol version 4; iPv6 = internet Protocol version 6; PPP = purchasing power parity; aSn = autonomous system number; ccTlD = country code top-level domain; iCT = information and communications technology; * = discrete scale, with several countries sharing an equal ranking; na = not available. For definitions and source information for each indicator, please see exhibit 3.

The Boston Consulting Group | 13
Speed
Architecture
Traffic
Price
0 50 7525 100
Infrastructure
Labor
Technology
Economy
Capital
0 50 7525 100
Ability
Access
Trust
Payments
Banking
0 50 7525 100
Sites
Content
Obstacles
Objectivity
Data
0 50 7525 100
Access
Internetbandwidthper capita
Quality of transportinfrastructure for
physical fulfilmentQuality of
education system
Number ofdomains registeredto each ccTLD per
capita
Number of onlineopen-encyclopedia
pages in homelanguage
Number ofmicromessagesmade in home
language
Share ofpopulation using
social networks(%)
Commitment toopen data
Press FreedomIndex
Freedom onthe Net
Filteringscore
Adult literacyrate (%)
ICT skills
Internet users (%)
Availability offinancial services
Affordability offinancial services
Market penetrationof bank accounts
(%)
Population usingonline personal
finance (%)
Debit cardpenetration (%)
Cyber securitybeing adequately
addressed
Trust in privacyof credit card
and otherfinancial data
Trust in privacyof other
personal data
Quality ofelectricity and
telephonyinfrastructure
ICT skills
Quality ofmath and
science education
Availability ofqualified engineers
Capacity forinnovation
Financial-marketsophistication
Financing throughlocal equity market
Ease of accessto loans
Foreign direct-investment-to-GDP
ratio
Venture capitalavailability
Strength ofintellectual
property protection
Burden of customsprocedures
Prevalence oftrade barriers
Number of daysto set up a
business
Company-leveltechnologyabsorption
InternationalInternet bandwidth
per capita
Consumerbroadband
penetration (%)
Businessfixed-broadbandpenetration (%)
Mobile Internetsubscription
penetration (%)
Number of IPv4registrations
per capita
Number of IPv6registrations
per capita
Peak fixed-broadband
connection speed
Average fixed-broadband
connection speed
Peak mobile-connection speed
Average mobile-connection speed
Fixed-broadbandpricing ($ per
month at PPP)
Mobile pricing($ per minute local
call off-net [peak]at PPP)
Traffic volumesper capita
Internationaltraffic volumes
per capita
Exchange pointsper capita
Number ofnetworks (ASNs)
per capita
Content registeredto ccTLD hosted
onshore (%)
Existence ofindependent
regulator
e-Friction Score: 75Rank: 62
INFRASTRUCTURE
Indicator Ranke-Friction score e-Friction score
INDUSTRY
Indicator Rank e-Friction score Rank e-Friction score Rank
INDIVIDUAL
Indicator
INFORMATION
Indicator
Overall Overall Overall Overall
59
23
13*
NA
50
52
44
1*
64
65
NA
NA
NA
64
NA
NA
NA
NA
NA
9
NA
NA
NA
64
57
55
11*
62
63
NA
56
55
62
63
32
54
61
62
57
37
53
57
65
53
63
NA
65
57
58
49
NA
65
NA
NA
NA
57 63 64 37
Bangladesh
Source: BCG e-Friction index model.Note: iPv4 = internet Protocol version 4; iPv6 = internet Protocol version 6; PPP = purchasing power parity; aSn = autonomous system number; ccTlD = country code top-level domain; iCT = information and communications technology; * = discrete scale, with several countries sharing an equal ranking; na = not available. For definitions and source information for each indicator, please see exhibit 3.

14 | Greasing the Wheels of the Internet Economy
Speed
Architecture
Traffic
Price
0 50 7525 100
Infrastructure
Labor
Technology
Economy
Capital
0 50 7525 100
Ability
Access
Trust
Payments
Banking
0 50 7525 100
Sites
Content
Obstacles
Objectivity
Data
0 50 7525 100
Access
Internetbandwidthper capita
Quality of transportinfrastructure for
physical fulfilmentQuality of
education system
Number ofdomains registeredto each ccTLD per
capita
Number of onlineopen-encyclopedia
pages in homelanguage
Number ofmicromessagesmade in home
language
Share ofpopulation using
social networks(%)
Commitment toopen data
Press FreedomIndex
Freedom onthe Net
Filteringscore
Adult literacyrate (%)
ICT skills
Internet users (%)
Availability offinancial services
Affordability offinancial services
Market penetrationof bank accounts
(%)
Population usingonline personal
finance (%)
Debit cardpenetration (%)
Cyber securitybeing adequately
addressed
Trust in privacyof credit card
and otherfinancial data
Trust in privacyof other
personal data
Quality ofelectricity and
telephonyinfrastructure
ICT skills
Quality ofmath and
science education
Availability ofqualified engineers
Capacity forinnovation
Financial-marketsophistication
Financing throughlocal equity market
Ease of accessto loans
Foreign direct-investment-to-GDP
ratio
Venture capitalavailability
Strength ofintellectual
property protection
Burden of customsprocedures
Prevalence oftrade barriers
Number of daysto set up a
business
Company-leveltechnologyabsorption
InternationalInternet bandwidth
per capita
Consumerbroadband
penetration (%)
Businessfixed-broadbandpenetration (%)
Mobile Internetsubscription
penetration (%)
Number of IPv4registrations
per capita
Number of IPv6registrations
per capita
Peak fixed-broadband
connection speed
Average fixed-broadband
connection speed
Peak mobile-connection speed
Average mobile-connection speed
Fixed-broadbandpricing ($ per
month at PPP)
Mobile pricing($ per minute local
call off-net [peak]at PPP)
Traffic volumesper capita
Internationaltraffic volumes
per capita
Exchange pointsper capita
Number ofnetworks (ASNs)
per capita
Content registeredto ccTLD hosted
onshore (%)
Existence ofindependent
regulator
e-Friction Score: 32Rank: 16
INFRASTRUCTURE
Indicator Ranke-Friction score e-Friction score
INDUSTRY
Indicator Rank e-Friction score Rank e-Friction score Rank
INDIVIDUAL
Indicator
INFORMATION
Indicator
Overall Overall Overall Overall
6
11
60*
16
58
15
NA
NA
10
11
15
15
38
22
40
10
10
31
32
17
42
NA
8
31
29
49
1*
17
12
26
3
24
10
19
36
21
22
20
16
9
8
23
NA
6
8
26
18
14
15
14
26
10
19
NA
NA
19 12 10 24
Belgium
Source: BCG e-Friction index model.Note: iPv4 = internet Protocol version 4; iPv6 = internet Protocol version 6; PPP = purchasing power parity; aSn = autonomous system number; ccTlD = country code top-level domain; iCT = information and communications technology; * = discrete scale, with several countries sharing an equal ranking; na = not available. For definitions and source information for each indicator, please see exhibit 3.
The Boston Consulting Group | 15
Speed
Architecture
Traffic
Price
0 50 7525 100
Infrastructure
Labor
Technology
Economy
Capital
0 50 7525 100
Ability
Access
Trust
Payments
Banking
0 50 7525 100
Sites
Content
Obstacles
Objectivity
Data
0 50 7525 100
Access
Internetbandwidthper capita
Quality of transportinfrastructure for
physical fulfilmentQuality of
education system
Number ofdomains registeredto each ccTLD per
capita
Number of onlineopen-encyclopedia
pages in homelanguage
Number ofmicromessagesmade in home
language
Share ofpopulation using
social networks(%)
Commitment toopen data
Press FreedomIndex
Freedom onthe Net
Filteringscore
Adult literacyrate (%)
ICT skills
Internet users (%)
Availability offinancial services
Affordability offinancial services
Market penetrationof bank accounts
(%)
Population usingonline personal
finance (%)
Debit cardpenetration (%)
Cyber securitybeing adequately
addressed
Trust in privacyof credit card
and otherfinancial data
Trust in privacyof other
personal data
Quality ofelectricity and
telephonyinfrastructure
ICT skills
Quality ofmath and
science education
Availability ofqualified engineers
Capacity forinnovation
Financial-marketsophistication
Financing throughlocal equity market
Ease of accessto loans
Foreign direct-investment-to-GDP
ratio
Venture capitalavailability
Strength ofintellectual
property protection
Burden of customsprocedures
Prevalence oftrade barriers
Number of daysto set up a
business
Company-leveltechnologyabsorption
InternationalInternet bandwidth
per capita
Consumerbroadband
penetration (%)
Businessfixed-broadbandpenetration (%)
Mobile Internetsubscription
penetration (%)
Number of IPv4registrations
per capita
Number of IPv6registrations
per capita
Peak fixed-broadband
connection speed
Average fixed-broadband
connection speed
Peak mobile-connection speed
Average mobile-connection speed
Fixed-broadbandpricing ($ per
month at PPP)
Mobile pricing($ per minute local
call off-net [peak]at PPP)
Traffic volumesper capita
Internationaltraffic volumes
per capita
Exchange pointsper capita
Number ofnetworks (ASNs)
per capita
Content registeredto ccTLD hosted
onshore (%)
Existence ofindependent
regulator
e-Friction Score: 69Rank: 52
INFRASTRUCTURE
Indicator Ranke-Friction score e-Friction score
INDUSTRY
Indicator Rank e-Friction score Rank e-Friction score Rank
INDIVIDUAL
Indicator
INFORMATION
Indicator
Overall Overall Overall Overall
61
47
41*
46
46
38
29
NA
43
45
48
47
50
40
64
50
53
50
54
5
59
44
51
39
40
44
11*
49
44
62
62
63
32
9=
37
38
37
49
62
56
65
39
33
61
54
62
46
25
33
37
46
30
58
48
53
51 51 50 53
Brazil
Source: BCG e-Friction index model.Note: iPv4 = internet Protocol version 4; iPv6 = internet Protocol version 6; PPP = purchasing power parity; aSn = autonomous system number; ccTlD = country code top-level domain; iCT = information and communications technology; * = discrete scale, with several countries sharing an equal ranking; na = not available. For definitions and source information for each indicator, please see exhibit 3.
16 | Greasing the Wheels of the Internet Economy
Speed
Architecture
Traffic
Price
0 50 7525 100
Infrastructure
Labor
Technology
Economy
Capital
0 50 7525 100
Ability
Access
Trust
Payments
Banking
0 50 7525 100
Sites
Content
Obstacles
Objectivity
Data
0 50 7525 100
Access
Internetbandwidthper capita
Quality of transportinfrastructure for
physical fulfilmentQuality of
education system
Number ofdomains registeredto each ccTLD per
capita
Number of onlineopen-encyclopedia
pages in homelanguage
Number ofmicromessagesmade in home
language
Share ofpopulation using
social networks(%)
Commitment toopen data
Press FreedomIndex
Freedom onthe Net
Filteringscore
Adult literacyrate (%)
ICT skills
Internet users (%)
Availability offinancial services
Affordability offinancial services
Market penetrationof bank accounts
(%)
Population usingonline personal
finance (%)
Debit cardpenetration (%)
Cyber securitybeing adequately
addressed
Trust in privacyof credit card
and otherfinancial data
Trust in privacyof other
personal data
Quality ofelectricity and
telephonyinfrastructure
ICT skills
Quality ofmath and
science education
Availability ofqualified engineers
Capacity forinnovation
Financial-marketsophistication
Financing throughlocal equity market
Ease of accessto loans
Foreign direct-investment-to-GDP
ratio
Venture capitalavailability
Strength ofintellectual
property protection
Burden of customsprocedures
Prevalence oftrade barriers
Number of daysto set up a
business
Company-leveltechnologyabsorption
InternationalInternet bandwidth
per capita
Consumerbroadband
penetration (%)
Businessfixed-broadbandpenetration (%)
Mobile Internetsubscription
penetration (%)
Number of IPv4registrations
per capita
Number of IPv6registrations
per capita
Peak fixed-broadband
connection speed
Average fixed-broadband
connection speed
Peak mobile-connection speed
Average mobile-connection speed
Fixed-broadbandpricing ($ per
month at PPP)
Mobile pricing($ per minute local
call off-net [peak]at PPP)
Traffic volumesper capita
Internationaltraffic volumes
per capita
Exchange pointsper capita
Number ofnetworks (ASNs)
per capita
Content registeredto ccTLD hosted
onshore (%)
Existence ofindependent
regulator
e-Friction Score: 53Rank: 37
INFRASTRUCTURE
Indicator Ranke-Friction score e-Friction score
INDUSTRY
Indicator Rank e-Friction score Rank e-Friction score Rank
INDIVIDUAL
Indicator
INFORMATION
Indicator
Overall Overall Overall Overall
31
53
NA
NA
23
36
NA
NA
24
19
46
34
NA
29
41
NA
NA
NA
NA
31
44
NA
35
22
5
6
1*
57
43
45
37
58
58
NA
55
28
38
55
46
58
52
59
NA
49
31
45
40
60
63
NA
NA
NA
60
NA
NA
26 52 57 42
Bulgaria
Source: BCG e-Friction index model.Note: iPv4 = internet Protocol version 4; iPv6 = internet Protocol version 6; PPP = purchasing power parity; aSn = autonomous system number; ccTlD = country code top-level domain; iCT = information and communications technology; * = discrete scale, with several countries sharing an equal ranking; na = not available. For definitions and source information for each indicator, please see exhibit 3.
The Boston Consulting Group | 17
Speed
Architecture
Traffic
Price
0 50 7525 100
Infrastructure
Labor
Technology
Economy
Capital
0 50 7525 100
Ability
Access
Trust
Payments
Banking
0 50 7525 100
Sites
Content
Obstacles
Objectivity
Data
0 50 7525 100
Access
Internetbandwidthper capita
Quality of transportinfrastructure for
physical fulfilmentQuality of
education system
Number ofdomains registeredto each ccTLD per
capita
Number of onlineopen-encyclopedia
pages in homelanguage
Number ofmicromessagesmade in home
language
Share ofpopulation using
social networks(%)
Commitment toopen data
Press FreedomIndex
Freedom onthe Net
Filteringscore
Adult literacyrate (%)
ICT skills
Internet users (%)
Availability offinancial services
Affordability offinancial services
Market penetrationof bank accounts
(%)
Population usingonline personal
finance (%)
Debit cardpenetration (%)
Cyber securitybeing adequately
addressed
Trust in privacyof credit card
and otherfinancial data
Trust in privacyof other
personal data
Quality ofelectricity and
telephonyinfrastructure
ICT skills
Quality ofmath and
science education
Availability ofqualified engineers
Capacity forinnovation
Financial-marketsophistication
Financing throughlocal equity market
Ease of accessto loans
Foreign direct-investment-to-GDP
ratio
Venture capitalavailability
Strength ofintellectual
property protection
Burden of customsprocedures
Prevalence oftrade barriers
Number of daysto set up a
business
Company-leveltechnologyabsorption
InternationalInternet bandwidth
per capita
Consumerbroadband
penetration (%)
Businessfixed-broadbandpenetration (%)
Mobile Internetsubscription
penetration (%)
Number of IPv4registrations
per capita
Number of IPv6registrations
per capita
Peak fixed-broadband
connection speed
Average fixed-broadband
connection speed
Peak mobile-connection speed
Average mobile-connection speed
Fixed-broadbandpricing ($ per
month at PPP)
Mobile pricing($ per minute local
call off-net [peak]at PPP)
Traffic volumesper capita
Internationaltraffic volumes
per capita
Exchange pointsper capita
Number ofnetworks (ASNs)
per capita
Content registeredto ccTLD hosted
onshore (%)
Existence ofindependent
regulator
e-Friction Score: 25Rank: 10
INFRASTRUCTURE
Indicator Ranke-Friction score e-Friction score
INDUSTRY
Indicator Rank e-Friction score Rank e-Friction score Rank
INDIVIDUAL
Indicator
INFORMATION
Indicator
Overall Overall Overall Overall
14 11 7 22
7
13*
1
17
14
NA
1*
8
14
11
8
10
15
1
7
15
13
7
22
14
10
8
24
4
13
19
38
20
11
29
38
12
30
20
8
4
44
11
22
21
14
39
14
20
50
8
25
21
20
50
1*
16 14 5 5
Canada
Source: BCG e-Friction index model.Note: iPv4 = internet Protocol version 4; iPv6 = internet Protocol version 6; PPP = purchasing power parity; aSn = autonomous system number; ccTlD = country code top-level domain; iCT = information and communications technology; * = discrete scale, with several countries sharing an equal ranking; na = not available. For definitions and source information for each indicator, please see exhibit 3.

18 | Greasing the Wheels of the Internet Economy
Speed
Architecture
Traffic
Price
0 50 7525 100
Infrastructure
Labor
Technology
Economy
Capital
0 50 7525 100
Ability
Access
Trust
Payments
Banking
0 50 7525 100
Sites
Content
Obstacles
Objectivity
Data
0 50 7525 100
Access
Internetbandwidthper capita
Quality of transportinfrastructure for
physical fulfilmentQuality of
education system
Number ofdomains registeredto each ccTLD per
capita
Number of onlineopen-encyclopedia
pages in homelanguage
Number ofmicromessagesmade in home
language
Share ofpopulation using
social networks(%)
Commitment toopen data
Press FreedomIndex
Freedom onthe Net
Filteringscore
Adult literacyrate (%)
ICT skills
Internet users (%)
Availability offinancial services
Affordability offinancial services
Market penetrationof bank accounts
(%)
Population usingonline personal
finance (%)
Debit cardpenetration (%)
Cyber securitybeing adequately
addressed
Trust in privacyof credit card
and otherfinancial data
Trust in privacyof other
personal data
Quality ofelectricity and
telephonyinfrastructure
ICT skills
Quality ofmath and
science education
Availability ofqualified engineers
Capacity forinnovation
Financial-marketsophistication
Financing throughlocal equity market
Ease of accessto loans
Foreign direct-investment-to-GDP
ratio
Venture capitalavailability
Strength ofintellectual
property protection
Burden of customsprocedures
Prevalence oftrade barriers
Number of daysto set up a
business
Company-leveltechnologyabsorption
InternationalInternet bandwidth
per capita
Consumerbroadband
penetration (%)
Businessfixed-broadbandpenetration (%)
Mobile Internetsubscription
penetration (%)
Number of IPv4registrations
per capita
Number of IPv6registrations
per capita
Peak fixed-broadband
connection speed
Average fixed-broadband
connection speed
Peak mobile-connection speed
Average mobile-connection speed
Fixed-broadbandpricing ($ per
month at PPP)
Mobile pricing($ per minute local
call off-net [peak]at PPP)
Traffic volumesper capita
Internationaltraffic volumes
per capita
Exchange pointsper capita
Number ofnetworks (ASNs)
per capita
Content registeredto ccTLD hosted
onshore (%)
Existence ofindependent
regulator
e-Friction Score: 57Rank: 41
INFRASTRUCTURE
Indicator Ranke-Friction score e-Friction score
INDUSTRY
Indicator Rank e-Friction score Rank e-Friction score Rank
INDIVIDUAL
Indicator
INFORMATION
Indicator
Overall Overall Overall Overall
41
39
45*
40
NA
32
NA
NA
36
19
24
45
41
45
47
NA
NA
37
40
36
54
21
43
20
21
15
26
38
21
19
6
35
34
34
26
36
53
54
35
55
48
48
37
54
21
52
33
29
51
37
40
11*
39
30
36
46 29 34 48
Chile
Source: BCG e-Friction index model.Note: iPv4 = internet Protocol version 4; iPv6 = internet Protocol version 6; PPP = purchasing power parity; aSn = autonomous system number; ccTlD = country code top-level domain; iCT = information and communications technology; * = discrete scale, with several countries sharing an equal ranking; na = not available. For definitions and source information for each indicator, please see exhibit 3.

The Boston Consulting Group | 19
Speed
Architecture
Traffic
Price
0 50 7525 100
Infrastructure
Labor
Technology
Economy
Capital
0 50 7525 100
Ability
Access
Trust
Payments
Banking
0 50 7525 100
Sites
Content
Obstacles
Objectivity
Data
0 50 7525 100
Access
Internetbandwidthper capita
Quality of transportinfrastructure for
physical fulfilmentQuality of
education system
Number ofdomains registeredto each ccTLD per
capita
Number of onlineopen-encyclopedia
pages in homelanguage
Number ofmicromessagesmade in home
language
Share ofpopulation using
social networks(%)
Commitment toopen data
Press FreedomIndex
Freedom onthe Net
Filteringscore
Adult literacyrate (%)
ICT skills
Internet users (%)
Availability offinancial services
Affordability offinancial services
Market penetrationof bank accounts
(%)
Population usingonline personal
finance (%)
Debit cardpenetration (%)
Cyber securitybeing adequately
addressed
Trust in privacyof credit card
and otherfinancial data
Trust in privacyof other
personal data
Quality ofelectricity and
telephonyinfrastructure
ICT skills
Quality ofmath and
science education
Availability ofqualified engineers
Capacity forinnovation
Financial-marketsophistication
Financing throughlocal equity market
Ease of accessto loans
Foreign direct-investment-to-GDP
ratio
Venture capitalavailability
Strength ofintellectual
property protection
Burden of customsprocedures
Prevalence oftrade barriers
Number of daysto set up a
business
Company-leveltechnologyabsorption
InternationalInternet bandwidth
per capita
Consumerbroadband
penetration (%)
Businessfixed-broadbandpenetration (%)
Mobile Internetsubscription
penetration (%)
Number of IPv4registrations
per capita
Number of IPv6registrations
per capita
Peak fixed-broadband
connection speed
Average fixed-broadband
connection speed
Peak mobile-connection speed
Average mobile-connection speed
Fixed-broadbandpricing ($ per
month at PPP)
Mobile pricing($ per minute local
call off-net [peak]at PPP)
Traffic volumesper capita
Internationaltraffic volumes
per capita
Exchange pointsper capita
Number ofnetworks (ASNs)
per capita
Content registeredto ccTLD hosted
onshore (%)
Existence ofindependent
regulator
e-Friction Score: 69Rank: 53
INFRASTRUCTURE
Indicator Ranke-Friction score e-Friction score
INDUSTRY
Indicator Rank e-Friction score Rank e-Friction score Rank
INDIVIDUAL
Indicator
INFORMATION
Indicator
Overall Overall Overall Overall
65
1
38*
53
42
65
65
57
58
32
44
47
61
58
50
NA
NA
30
4
54
61
64
20
24
49
35
30
33
27
52
30
23
13
34
39
44
63
45
49
32
42
35
51
47
35
34
48
31
44
53
65 65*39*
61
65
56 37 46 57
China
Source: BCG e-Friction index model.Note: iPv4 = internet Protocol version 4; iPv6 = internet Protocol version 6; PPP = purchasing power parity; aSn = autonomous system number; ccTlD = country code top-level domain; iCT = information and communications technology; * = discrete scale, with several countries sharing an equal ranking; na = not available. For definitions and source information for each indicator, please see exhibit 3.

20 | Greasing the Wheels of the Internet Economy
Speed
Architecture
Traffic
Price
0 50 7525 100
Infrastructure
Labor
Technology
Economy
Capital
0 50 7525 100
Ability
Access
Trust
Payments
Banking
0 50 7525 100
Sites
Content
Obstacles
Objectivity
Data
0 50 7525 100
Access
Internetbandwidthper capita
Quality of transportinfrastructure for
physical fulfilmentQuality of
education system
Number ofdomains registeredto each ccTLD per
capita
Number of onlineopen-encyclopedia
pages in homelanguage
Number ofmicromessagesmade in home
language
Share ofpopulation using
social networks(%)
Commitment toopen data
Press FreedomIndex
Freedom onthe Net
Filteringscore
Adult literacyrate (%)
ICT skills
Internet users (%)
Availability offinancial services
Affordability offinancial services
Market penetrationof bank accounts
(%)
Population usingonline personal
finance (%)
Debit cardpenetration (%)
Cyber securitybeing adequately
addressed
Trust in privacyof credit card
and otherfinancial data
Trust in privacyof other
personal data
Quality ofelectricity and
telephonyinfrastructure
ICT skills
Quality ofmath and
science education
Availability ofqualified engineers
Capacity forinnovation
Financial-marketsophistication
Financing throughlocal equity market
Ease of accessto loans
Foreign direct-investment-to-GDP
ratio
Venture capitalavailability
Strength ofintellectual
property protection
Burden of customsprocedures
Prevalence oftrade barriers
Number of daysto set up a
business
Company-leveltechnologyabsorption
InternationalInternet bandwidth
per capita
Consumerbroadband
penetration (%)
Businessfixed-broadbandpenetration (%)
Mobile Internetsubscription
penetration (%)
Number of IPv4registrations
per capita
Number of IPv6registrations
per capita
Peak fixed-broadband
connection speed
Average fixed-broadband
connection speed
Peak mobile-connection speed
Average mobile-connection speed
Fixed-broadbandpricing ($ per
month at PPP)
Mobile pricing($ per minute local
call off-net [peak]at PPP)
Traffic volumesper capita
Internationaltraffic volumes
per capita
Exchange pointsper capita
Number ofnetworks (ASNs)
per capita
Content registeredto ccTLD hosted
onshore (%)
Existence ofindependent
regulator
e-Friction Score: 71Rank: 56
INFRASTRUCTURE
Indicator Ranke-Friction score e-Friction score
INDUSTRY
Indicator Rank e-Friction score Rank e-Friction score Rank
INDIVIDUAL
Indicator
INFORMATION
Indicator
Overall Overall Overall Overall
23
NA
45*
50
NA
46
NA
47
NA
35
47
44
32
52
48
62
61
46
32
NA
52
59
54
64
61
48
54
55
59
50
45
40
43
45
53
52
62
47
53
21
46
46
54
47
37
55
53
50
48
56
NA
NA 36*11*
53
55 58 54 47
Colombia
Source: BCG e-Friction index model.Note: iPv4 = internet Protocol version 4; iPv6 = internet Protocol version 6; PPP = purchasing power parity; aSn = autonomous system number; ccTlD = country code top-level domain; iCT = information and communications technology; * = discrete scale, with several countries sharing an equal ranking; na = not available. For definitions and source information for each indicator, please see exhibit 3.

The Boston Consulting Group | 21
Speed
Architecture
Traffic
Price
0 50 7525 100
Infrastructure
Labor
Technology
Economy
Capital
0 50 7525 100
Ability
Access
Trust
Payments
Banking
0 50 7525 100
Sites
Content
Obstacles
Objectivity
Data
0 50 7525 100
Access
Internetbandwidthper capita
Quality of transportinfrastructure for
physical fulfilmentQuality of
education system
Number ofdomains registeredto each ccTLD per
capita
Number of onlineopen-encyclopedia
pages in homelanguage
Number ofmicromessagesmade in home
language
Share ofpopulation using
social networks(%)
Commitment toopen data
Press FreedomIndex
Freedom onthe Net
Filteringscore
Adult literacyrate (%)
ICT skills
Internet users (%)
Availability offinancial services
Affordability offinancial services
Market penetrationof bank accounts
(%)
Population usingonline personal
finance (%)
Debit cardpenetration (%)
Cyber securitybeing adequately
addressed
Trust in privacyof credit card
and otherfinancial data
Trust in privacyof other
personal data
Quality ofelectricity and
telephonyinfrastructure
ICT skills
Quality ofmath and
science education
Availability ofqualified engineers
Capacity forinnovation
Financial-marketsophistication
Financing throughlocal equity market
Ease of accessto loans
Foreign direct-investment-to-GDP
ratio
Venture capitalavailability
Strength ofintellectual
property protection
Burden of customsprocedures
Prevalence oftrade barriers
Number of daysto set up a
business
Company-leveltechnologyabsorption
InternationalInternet bandwidth
per capita
Consumerbroadband
penetration (%)
Businessfixed-broadbandpenetration (%)
Mobile Internetsubscription
penetration (%)
Number of IPv4registrations
per capita
Number of IPv6registrations
per capita
Peak fixed-broadband
connection speed
Average fixed-broadband
connection speed
Peak mobile-connection speed
Average mobile-connection speed
Fixed-broadbandpricing ($ per
month at PPP)
Mobile pricing($ per minute local
call off-net [peak]at PPP)
Traffic volumesper capita
Internationaltraffic volumes
per capita
Exchange pointsper capita
Number ofnetworks (ASNs)
per capita
Content registeredto ccTLD hosted
onshore (%)
Existence ofindependent
regulator
e-Friction Score: 46Rank: 32
INFRASTRUCTURE
Indicator Ranke-Friction score e-Friction score
INDUSTRY
Indicator Rank e-Friction score Rank e-Friction score Rank
INDIVIDUAL
Indicator
INFORMATION
Indicator
Overall Overall Overall Overall
40
33
46
46
43
23
38
54
35
44
39
33
40
55
40
37
36
8
46
25
40
48
24
NA
23
29
NA
NA
37
55
NA
NA
36
12
NA
NA
16
45
57
27
25
48
18
8
27
5
61
45
NA
14
27
12
5
1*
16
23 44 29 39
Czech Republic
Source: BCG e-Friction index model.Note: iPv4 = internet Protocol version 4; iPv6 = internet Protocol version 6; PPP = purchasing power parity; aSn = autonomous system number; ccTlD = country code top-level domain; iCT = information and communications technology; * = discrete scale, with several countries sharing an equal ranking; na = not available. For definitions and source information for each indicator, please see exhibit 3.

22 | Greasing the Wheels of the Internet Economy
Speed
Architecture
Traffic
Price
0 50 7525 100
Infrastructure
Labor
Technology
Economy
Capital
0 50 7525 100
Ability
Access
Trust
Payments
Banking
0 50 7525 100
Sites
Content
Obstacles
Objectivity
Data
0 50 7525 100
Access
Internetbandwidthper capita
Quality of transportinfrastructure for
physical fulfilmentQuality of
education system
Number ofdomains registeredto each ccTLD per
capita
Number of onlineopen-encyclopedia
pages in homelanguage
Number ofmicromessagesmade in home
language
Share ofpopulation using
social networks(%)
Commitment toopen data
Press FreedomIndex
Freedom onthe Net
Filteringscore
Adult literacyrate (%)
ICT skills
Internet users (%)
Availability offinancial services
Affordability offinancial services
Market penetrationof bank accounts
(%)
Population usingonline personal
finance (%)
Debit cardpenetration (%)
Cyber securitybeing adequately
addressed
Trust in privacyof credit card
and otherfinancial data
Trust in privacyof other
personal data
Quality ofelectricity and
telephonyinfrastructure
ICT skills
Quality ofmath and
science education
Availability ofqualified engineers
Capacity forinnovation
Financial-marketsophistication
Financing throughlocal equity market
Ease of accessto loans
Foreign direct-investment-to-GDP
ratio
Venture capitalavailability
Strength ofintellectual
property protection
Burden of customsprocedures
Prevalence oftrade barriers
Number of daysto set up a
business
Company-leveltechnologyabsorption
InternationalInternet bandwidth
per capita
Consumerbroadband
penetration (%)
Businessfixed-broadbandpenetration (%)
Mobile Internetsubscription
penetration (%)
Number of IPv4registrations
per capita
Number of IPv6registrations
per capita
Peak fixed-broadband
connection speed
Average fixed-broadband
connection speed
Peak mobile-connection speed
Average mobile-connection speed
Fixed-broadbandpricing ($ per
month at PPP)
Mobile pricing($ per minute local
call off-net [peak]at PPP)
Traffic volumesper capita
Internationaltraffic volumes
per capita
Exchange pointsper capita
Number ofnetworks (ASNs)
per capita
Content registeredto ccTLD hosted
onshore (%)
Existence ofindependent
regulator
e-Friction Score: 21Rank: 3
INFRASTRUCTURE
Indicator Ranke-Friction score e-Friction score
INDUSTRY
Indicator Rank e-Friction score Rank e-Friction score Rank
INDIVIDUAL
Indicator
INFORMATION
Indicator
Overall Overall Overall Overall 0
4
26
13*
4
4
4
NA
1*
8
3
NA
NA
12
7
NA
34
16
NA
NA
39
10
NA
5
19
14
17
1*
26
9
5
28
29
12
22
46
39
52
22
20
25
21
18
17
16
8
5
4
28
30
1
4
3
6
NA
NA
4 22 7 1
Denmark
Source: BCG e-Friction index model.Note: iPv4 = internet Protocol version 4; iPv6 = internet Protocol version 6; PPP = purchasing power parity; aSn = autonomous system number; ccTlD = country code top-level domain; iCT = information and communications technology; * = discrete scale, with several countries sharing an equal ranking; na = not available. For definitions and source information for each indicator, please see exhibit 3.
The Boston Consulting Group | 23
Speed
Architecture
Traffic
Price
0 50 7525 100
Infrastructure
Labor
Technology
Economy
Capital
0 50 7525 100
Ability
Access
Trust
Payments
Banking
0 50 7525 100
Sites
Content
Obstacles
Objectivity
Data
0 50 7525 100
Access
Internetbandwidthper capita
Quality of transportinfrastructure for
physical fulfilmentQuality of
education system
Number ofdomains registeredto each ccTLD per
capita
Number of onlineopen-encyclopedia
pages in homelanguage
Number ofmicromessagesmade in home
language
Share ofpopulation using
social networks(%)
Commitment toopen data
Press FreedomIndex
Freedom onthe Net
Filteringscore
Adult literacyrate (%)
ICT skills
Internet users (%)
Availability offinancial services
Affordability offinancial services
Market penetrationof bank accounts
(%)
Population usingonline personal
finance (%)
Debit cardpenetration (%)
Cyber securitybeing adequately
addressed
Trust in privacyof credit card
and otherfinancial data
Trust in privacyof other
personal data
Quality ofelectricity and
telephonyinfrastructure
ICT skills
Quality ofmath and
science education
Availability ofqualified engineers
Capacity forinnovation
Financial-marketsophistication
Financing throughlocal equity market
Ease of accessto loans
Foreign direct-investment-to-GDP
ratio
Venture capitalavailability
Strength ofintellectual
property protection
Burden of customsprocedures
Prevalence oftrade barriers
Number of daysto set up a
business
Company-leveltechnologyabsorption
InternationalInternet bandwidth
per capita
Consumerbroadband
penetration (%)
Businessfixed-broadbandpenetration (%)
Mobile Internetsubscription
penetration (%)
Number of IPv4registrations
per capita
Number of IPv6registrations
per capita
Peak fixed-broadband
connection speed
Average fixed-broadband
connection speed
Peak mobile-connection speed
Average mobile-connection speed
Fixed-broadbandpricing ($ per
month at PPP)
Mobile pricing($ per minute local
call off-net [peak]at PPP)
Traffic volumesper capita
Internationaltraffic volumes
per capita
Exchange pointsper capita
Number ofnetworks (ASNs)
per capita
Content registeredto ccTLD hosted
onshore (%)
Existence ofindependent
regulator
e-Friction Score: 76Rank: 63
INFRASTRUCTURE
Indicator Ranke-Friction score e-Friction score
INDUSTRY
Indicator Rank e-Friction score Rank e-Friction score Rank
INDIVIDUAL
Indicator
INFORMATION
Indicator
Overall Overall Overall Overall
53
20
6*
NA
54
59
53
1*
60
58
59
58
57
55
60
62
65
58
65
7
NA
NA
NA
56
59
38
1*
51
59
NA
64
38
60
53
35
51
34
52
51
63
31
56
NA
64
60
NA
50
62
57
65
NA
63
NA
NA
NA
60 59 65 40
Egypt
Source: BCG e-Friction index model.Note: iPv4 = internet Protocol version 4; iPv6 = internet Protocol version 6; PPP = purchasing power parity; aSn = autonomous system number; ccTlD = country code top-level domain; iCT = information and communications technology; * = discrete scale, with several countries sharing an equal ranking; na = not available. For definitions and source information for each indicator, please see exhibit 3.

24 | Greasing the Wheels of the Internet Economy
Speed
Architecture
Traffic
Price
0 50 7525 100
Infrastructure
Labor
Technology
Economy
Capital
0 50 7525 100
Ability
Access
Trust
Payments
Banking
0 50 7525 100
Sites
Content
Obstacles
Objectivity
Data
0 50 7525 100
Access
Internetbandwidthper capita
Quality of transportinfrastructure for
physical fulfilmentQuality of
education system
Number ofdomains registeredto each ccTLD per
capita
Number of onlineopen-encyclopedia
pages in homelanguage
Number ofmicromessagesmade in home
language
Share ofpopulation using
social networks(%)
Commitment toopen data
Press FreedomIndex
Freedom onthe Net
Filteringscore
Adult literacyrate (%)
ICT skills
Internet users (%)
Availability offinancial services
Affordability offinancial services
Market penetrationof bank accounts
(%)
Population usingonline personal
finance (%)
Debit cardpenetration (%)
Cyber securitybeing adequately
addressed
Trust in privacyof credit card
and otherfinancial data
Trust in privacyof other
personal data
Quality ofelectricity and
telephonyinfrastructure
ICT skills
Quality ofmath and
science education
Availability ofqualified engineers
Capacity forinnovation
Financial-marketsophistication
Financing throughlocal equity market
Ease of accessto loans
Foreign direct-investment-to-GDP
ratio
Venture capitalavailability
Strength ofintellectual
property protection
Burden of customsprocedures
Prevalence oftrade barriers
Number of daysto set up a
business
Company-leveltechnologyabsorption
InternationalInternet bandwidth
per capita
Consumerbroadband
penetration (%)
Businessfixed-broadbandpenetration (%)
Mobile Internetsubscription
penetration (%)
Number of IPv4registrations
per capita
Number of IPv6registrations
per capita
Peak fixed-broadband
connection speed
Average fixed-broadband
connection speed
Peak mobile-connection speed
Average mobile-connection speed
Fixed-broadbandpricing ($ per
month at PPP)
Mobile pricing($ per minute local
call off-net [peak]at PPP)
Traffic volumesper capita
Internationaltraffic volumes
per capita
Exchange pointsper capita
Number ofnetworks (ASNs)
per capita
Content registeredto ccTLD hosted
onshore (%)
Existence ofindependent
regulator
e-Friction Score: 35Rank: 20
INFRASTRUCTURE
Indicator Ranke-Friction score e-Friction score
INDUSTRY
Indicator Rank e-Friction score Rank e-Friction score Rank
INDIVIDUAL
Indicator
INFORMATION
Indicator
Overall Overall Overall Overall
37 43 29 5
37
NA
8
3
NA
1
65
23
30
31
NA
NA
NA
18
NA
NA
30
65
17
57
25
NA
44
33
NA
25
26
10
10
31
32
7
NA
NA
NA
21
NA
NA
NA
60
54
33
22
NA
NA
2
10
10
1*
NA
NA
21 31 26 10
Estonia
Source: BCG e-Friction index model.Note: iPv4 = internet Protocol version 4; iPv6 = internet Protocol version 6; PPP = purchasing power parity; aSn = autonomous system number; ccTlD = country code top-level domain; iCT = information and communications technology; * = discrete scale, with several countries sharing an equal ranking; na = not available. For definitions and source information for each indicator, please see exhibit 3.

The Boston Consulting Group | 25
Speed
Architecture
Traffic
Price
0 50 7525 100
Infrastructure
Labor
Technology
Economy
Capital
0 50 7525 100
Ability
Access
Trust
Payments
Banking
0 50 7525 100
Sites
Content
Obstacles
Objectivity
Data
0 50 7525 100
Access
Internetbandwidthper capita
Quality of transportinfrastructure for
physical fulfilmentQuality of
education system
Number ofdomains registeredto each ccTLD per
capita
Number of onlineopen-encyclopedia
pages in homelanguage
Number ofmicromessagesmade in home
language
Share ofpopulation using
social networks(%)
Commitment toopen data
Press FreedomIndex
Freedom onthe Net
Filteringscore
Adult literacyrate (%)
ICT skills
Internet users (%)
Availability offinancial services
Affordability offinancial services
Market penetrationof bank accounts
(%)
Population usingonline personal
finance (%)
Debit cardpenetration (%)
Cyber securitybeing adequately
addressed
Trust in privacyof credit card
and otherfinancial data
Trust in privacyof other
personal data
Quality ofelectricity and
telephonyinfrastructure
ICT skills
Quality ofmath and
science education
Availability ofqualified engineers
Capacity forinnovation
Financial-marketsophistication
Financing throughlocal equity market
Ease of accessto loans
Foreign direct-investment-to-GDP
ratio
Venture capitalavailability
Strength ofintellectual
property protection
Burden of customsprocedures
Prevalence oftrade barriers
Number of daysto set up a
business
Company-leveltechnologyabsorption
InternationalInternet bandwidth
per capita
Consumerbroadband
penetration (%)
Businessfixed-broadbandpenetration (%)
Mobile Internetsubscription
penetration (%)
Number of IPv4registrations
per capita
Number of IPv6registrations
per capita
Peak fixed-broadband
connection speed
Average fixed-broadband
connection speed
Peak mobile-connection speed
Average mobile-connection speed
Fixed-broadbandpricing ($ per
month at PPP)
Mobile pricing($ per minute local
call off-net [peak]at PPP)
Traffic volumesper capita
Internationaltraffic volumes
per capita
Exchange pointsper capita
Number ofnetworks (ASNs)
per capita
Content registeredto ccTLD hosted
onshore (%)
Existence ofindependent
regulator
e-Friction Score: 17Rank: 2
INFRASTRUCTURE
Indicator Ranke-Friction score e-Friction score
INDUSTRY
Indicator Rank e-Friction score Rank e-Friction score Rank
INDIVIDUAL
Indicator
INFORMATION
Indicator
Overall Overall Overall Overall
11
27
NA
11
9
1
NA
13
4
NA
NA
6
25
29
16
NA
NA
29
11
NA
17
8
19
17
14
28
4
2
1
2
13
15
11
10
1
2
6
48
7
NA
2
8
4
6
7
5
2
13
4
7
NA
NA 1*1*
11
e-Friction Score: 17Rank: 2
5 4 1 4
Finland
Source: BCG e-Friction index model.Note: iPv4 = internet Protocol version 4; iPv6 = internet Protocol version 6; PPP = purchasing power parity; aSn = autonomous system number; ccTlD = country code top-level domain; iCT = information and communications technology; * = discrete scale, with several countries sharing an equal ranking; na = not available. For definitions and source information for each indicator, please see exhibit 3.

26 | Greasing the Wheels of the Internet Economy
Speed
Architecture
Traffic
Price
0 50 7525 100
Infrastructure
Labor
Technology
Economy
Capital
0 50 7525 100
Ability
Access
Trust
Payments
Banking
0 50 7525 100
Sites
Content
Obstacles
Objectivity
Data
0 50 7525 100
Access
Internetbandwidthper capita
Quality of transportinfrastructure for
physical fulfilmentQuality of
education system
Number ofdomains registeredto each ccTLD per
capita
Number of onlineopen-encyclopedia
pages in homelanguage
Number ofmicromessagesmade in home
language
Share ofpopulation using
social networks(%)
Commitment toopen data
Press FreedomIndex
Freedom onthe Net
Filteringscore
Adult literacyrate (%)
ICT skills
Internet users (%)
Availability offinancial services
Affordability offinancial services
Market penetrationof bank accounts
(%)
Population usingonline personal
finance (%)
Debit cardpenetration (%)
Cyber securitybeing adequately
addressed
Trust in privacyof credit card
and otherfinancial data
Trust in privacyof other
personal data
Quality ofelectricity and
telephonyinfrastructure
ICT skills
Quality ofmath and
science education
Availability ofqualified engineers
Capacity forinnovation
Financial-marketsophistication
Financing throughlocal equity market
Ease of accessto loans
Foreign direct-investment-to-GDP
ratio
Venture capitalavailability
Strength ofintellectual
property protection
Burden of customsprocedures
Prevalence oftrade barriers
Number of daysto set up a
business
Company-leveltechnologyabsorption
InternationalInternet bandwidth
per capita
Consumerbroadband
penetration (%)
Businessfixed-broadbandpenetration (%)
Mobile Internetsubscription
penetration (%)
Number of IPv4registrations
per capita
Number of IPv6registrations
per capita
Peak fixed-broadband
connection speed
Average fixed-broadband
connection speed
Peak mobile-connection speed
Average mobile-connection speed
Fixed-broadbandpricing ($ per
month at PPP)
Mobile pricing($ per minute local
call off-net [peak]at PPP)
Traffic volumesper capita
Internationaltraffic volumes
per capita
Exchange pointsper capita
Number ofnetworks (ASNs)
per capita
Content registeredto ccTLD hosted
onshore (%)
Existence ofindependent
regulator
e-Friction Score: 34Rank: 19
INFRASTRUCTURE
Indicator Ranke-Friction score e-Friction score
INDUSTRY
Indicator Rank e-Friction score Rank e-Friction score Rank
INDIVIDUAL
Indicator
INFORMATION
Indicator
Overall Overall Overall Overall
40
34
NA
13
26
23
10
1*
18
10
7
23
32
16
36
44
34
52
30
25
56
12
12
28
32
20
1*
4
10
20
9
20
15
12
23
29
33
10
31
22
31
28
56
27
8
20
16
27
27
11
8
17
10
18
24
25 18 14 19
France
Source: BCG e-Friction index model.Note: iPv4 = internet Protocol version 4; iPv6 = internet Protocol version 6; PPP = purchasing power parity; aSn = autonomous system number; ccTlD = country code top-level domain; iCT = information and communications technology; * = discrete scale, with several countries sharing an equal ranking; na = not available. For definitions and source information for each indicator, please see exhibit 3.

The Boston Consulting Group | 27
Speed
Architecture
Traffic
Price
0 50 7525 100
Infrastructure
Labor
Technology
Economy
Capital
0 50 7525 100
Ability
Access
Trust
Payments
Banking
0 50 7525 100
Sites
Content
Obstacles
Objectivity
Data
0 50 7525 100
Access
Internetbandwidthper capita
Quality of transportinfrastructure for
physical fulfilmentQuality of
education system
Number ofdomains registeredto each ccTLD per
capita
Number of onlineopen-encyclopedia
pages in homelanguage
Number ofmicromessagesmade in home
language
Share ofpopulation using
social networks(%)
Commitment toopen data
Press FreedomIndex
Freedom onthe Net
Filteringscore
Adult literacyrate (%)
ICT skills
Internet users (%)
Availability offinancial services
Affordability offinancial services
Market penetrationof bank accounts
(%)
Population usingonline personal
finance (%)
Debit cardpenetration (%)
Cyber securitybeing adequately
addressed
Trust in privacyof credit card
and otherfinancial data
Trust in privacyof other
personal data
Quality ofelectricity and
telephonyinfrastructure
ICT skills
Quality ofmath and
science education
Availability ofqualified engineers
Capacity forinnovation
Financial-marketsophistication
Financing throughlocal equity market
Ease of accessto loans
Foreign direct-investment-to-GDP
ratio
Venture capitalavailability
Strength ofintellectual
property protection
Burden of customsprocedures
Prevalence oftrade barriers
Number of daysto set up a
business
Company-leveltechnologyabsorption
InternationalInternet bandwidth
per capita
Consumerbroadband
penetration (%)
Businessfixed-broadbandpenetration (%)
Mobile Internetsubscription
penetration (%)
Number of IPv4registrations
per capita
Number of IPv6registrations
per capita
Peak fixed-broadband
connection speed
Average fixed-broadband
connection speed
Peak mobile-connection speed
Average mobile-connection speed
Fixed-broadbandpricing ($ per
month at PPP)
Mobile pricing($ per minute local
call off-net [peak]at PPP)
Traffic volumesper capita
Internationaltraffic volumes
per capita
Exchange pointsper capita
Number ofnetworks (ASNs)
per capita
Content registeredto ccTLD hosted
onshore (%)
Existence ofindependent
regulator
e-Friction Score: 26Rank: 11
INFRASTRUCTURE
Indicator Ranke-Friction score e-Friction score
INDUSTRY
Indicator Rank e-Friction score Rank e-Friction score Rank
INDIVIDUAL
Indicator
INFORMATION
Indicator
Overall Overall Overall Overall
2
29
13*
23
16
13
5
1*
20
6
16
8
26
12
2
24
25
22
10
55
30
26
7
34
28
3
1*
5
6
31
14
15
3
21
27
31
27
12
24
34
49
15
10
8
31
15
16
16
8
14
6
17
1
1
63
10 20 8 9
Germany
Source: BCG e-Friction index model.Note: iPv4 = internet Protocol version 4; iPv6 = internet Protocol version 6; PPP = purchasing power parity; aSn = autonomous system number; ccTlD = country code top-level domain; iCT = information and communications technology; * = discrete scale, with several countries sharing an equal ranking; na = not available. For definitions and source information for each indicator, please see exhibit 3.

28 | Greasing the Wheels of the Internet Economy
Speed
Architecture
Traffic
Price
0 50 7525 100
Infrastructure
Labor
Technology
Economy
Capital
0 50 7525 100
Ability
Access
Trust
Payments
Banking
0 50 7525 100
Sites
Content
Obstacles
Objectivity
Data
0 50 7525 100
Access
Internetbandwidthper capita
Quality of transportinfrastructure for
physical fulfilmentQuality of
education system
Number ofdomains registeredto each ccTLD per
capita
Number of onlineopen-encyclopedia
pages in homelanguage
Number ofmicromessagesmade in home
language
Share ofpopulation using
social networks(%)
Commitment toopen data
Press FreedomIndex
Freedom onthe Net
Filteringscore
Adult literacyrate (%)
ICT skills
Internet users (%)
Availability offinancial services
Affordability offinancial services
Market penetrationof bank accounts
(%)
Population usingonline personal
finance (%)
Debit cardpenetration (%)
Cyber securitybeing adequately
addressed
Trust in privacyof credit card
and otherfinancial data
Trust in privacyof other
personal data
Quality ofelectricity and
telephonyinfrastructure
ICT skills
Quality ofmath and
science education
Availability ofqualified engineers
Capacity forinnovation
Financial-marketsophistication
Financing throughlocal equity market
Ease of accessto loans
Foreign direct-investment-to-GDP
ratio
Venture capitalavailability
Strength ofintellectual
property protection
Burden of customsprocedures
Prevalence oftrade barriers
Number of daysto set up a
business
Company-leveltechnologyabsorption
InternationalInternet bandwidth
per capita
Consumerbroadband
penetration (%)
Businessfixed-broadbandpenetration (%)
Mobile Internetsubscription
penetration (%)
Number of IPv4registrations
per capita
Number of IPv6registrations
per capita
Peak fixed-broadband
connection speed
Average fixed-broadband
connection speed
Peak mobile-connection speed
Average mobile-connection speed
Fixed-broadbandpricing ($ per
month at PPP)
Mobile pricing($ per minute local
call off-net [peak]at PPP)
Traffic volumesper capita
Internationaltraffic volumes
per capita
Exchange pointsper capita
Number ofnetworks (ASNs)
per capita
Content registeredto ccTLD hosted
onshore (%)
Existence ofindependent
regulator
e-Friction Score: 53Rank: 38
INFRASTRUCTURE
Indicator Ranke-Friction score e-Friction score
INDUSTRY
Indicator Rank e-Friction score Rank e-Friction score Rank
INDIVIDUAL
Indicator
INFORMATION
Indicator
Overall Overall Overall Overall
39
6
13*
NA
49
35
NA
NA
29
30
NA
NA
29
33
51
42
38
1
6
14
54
NA
44
47
33
63
1*
44
26
27
36
4
61
58
64
65
65
42
48
14
44
51
NA
58
36
27
38
59
61
25
NA
37
43
NA
NA
37 47 44 27
Greece
Source: BCG e-Friction index model.Note: iPv4 = internet Protocol version 4; iPv6 = internet Protocol version 6; PPP = purchasing power parity; aSn = autonomous system number; ccTlD = country code top-level domain; iCT = information and communications technology; * = discrete scale, with several countries sharing an equal ranking; na = not available. For definitions and source information for each indicator, please see exhibit 3.

The Boston Consulting Group | 29
Speed
Architecture
Traffic
Price
0 50 7525 100
Infrastructure
Labor
Technology
Economy
Capital
0 50 7525 100
Ability
Access
Trust
Payments
Banking
0 50 7525 100
Sites
Content
Obstacles
Objectivity
Data
0 50 7525 100
Access
Internetbandwidthper capita
Quality of transportinfrastructure for
physical fulfilmentQuality of
education system
Number ofdomains registeredto each ccTLD per
capita
Number of onlineopen-encyclopedia
pages in homelanguage
Number ofmicromessagesmade in home
language
Share ofpopulation using
social networks(%)
Commitment toopen data
Press FreedomIndex
Freedom onthe Net
Filteringscore
Adult literacyrate (%)
ICT skills
Internet users (%)
Availability offinancial services
Affordability offinancial services
Market penetrationof bank accounts
(%)
Population usingonline personal
finance (%)
Debit cardpenetration (%)
Cyber securitybeing adequately
addressed
Trust in privacyof credit card
and otherfinancial data
Trust in privacyof other
personal data
Quality ofelectricity and
telephonyinfrastructure
ICT skills
Quality ofmath and
science education
Availability ofqualified engineers
Capacity forinnovation
Financial-marketsophistication
Financing throughlocal equity market
Ease of accessto loans
Foreign direct-investment-to-GDP
ratio
Venture capitalavailability
Strength ofintellectual
property protection
Burden of customsprocedures
Prevalence oftrade barriers
Number of daysto set up a
business
Company-leveltechnologyabsorption
InternationalInternet bandwidth
per capita
Consumerbroadband
penetration (%)
Businessfixed-broadbandpenetration (%)
Mobile Internetsubscription
penetration (%)
Number of IPv4registrations
per capita
Number of IPv6registrations
per capita
Peak fixed-broadband
connection speed
Average fixed-broadband
connection speed
Peak mobile-connection speed
Average mobile-connection speed
Fixed-broadbandpricing ($ per
month at PPP)
Mobile pricing($ per minute local
call off-net [peak]at PPP)
Traffic volumesper capita
Internationaltraffic volumes
per capita
Exchange pointsper capita
Number ofnetworks (ASNs)
per capita
Content registeredto ccTLD hosted
onshore (%)
Existence ofindependent
regulator
e-Friction Score: 21Rank: 5
INFRASTRUCTURE
Indicator Ranke-Friction score e-Friction score
INDUSTRY
Indicator Rank e-Friction score Rank e-Friction score Rank
INDIVIDUAL
Indicator
INFORMATION
Indicator
Overall Overall Overall Overall
33
17
1*
NA
58
31
NA
NA
1
NA
1
16
1
NA
NA
1
5
29
25
36
NA
NA
NA
15
NA
16
1*
2
1
NA
6
26
26
5
1
2
1
8
3
1
3
11
1
17
NA
NA
28
3
1
20
NA
14
23
NA
NA
3 1 9 26
Hong Kong
Source: BCG e-Friction index model.Note: iPv4 = internet Protocol version 4; iPv6 = internet Protocol version 6; PPP = purchasing power parity; aSn = autonomous system number; ccTlD = country code top-level domain; iCT = information and communications technology; * = discrete scale, with several countries sharing an equal ranking; na = not available. For definitions and source information for each indicator, please see exhibit 3.
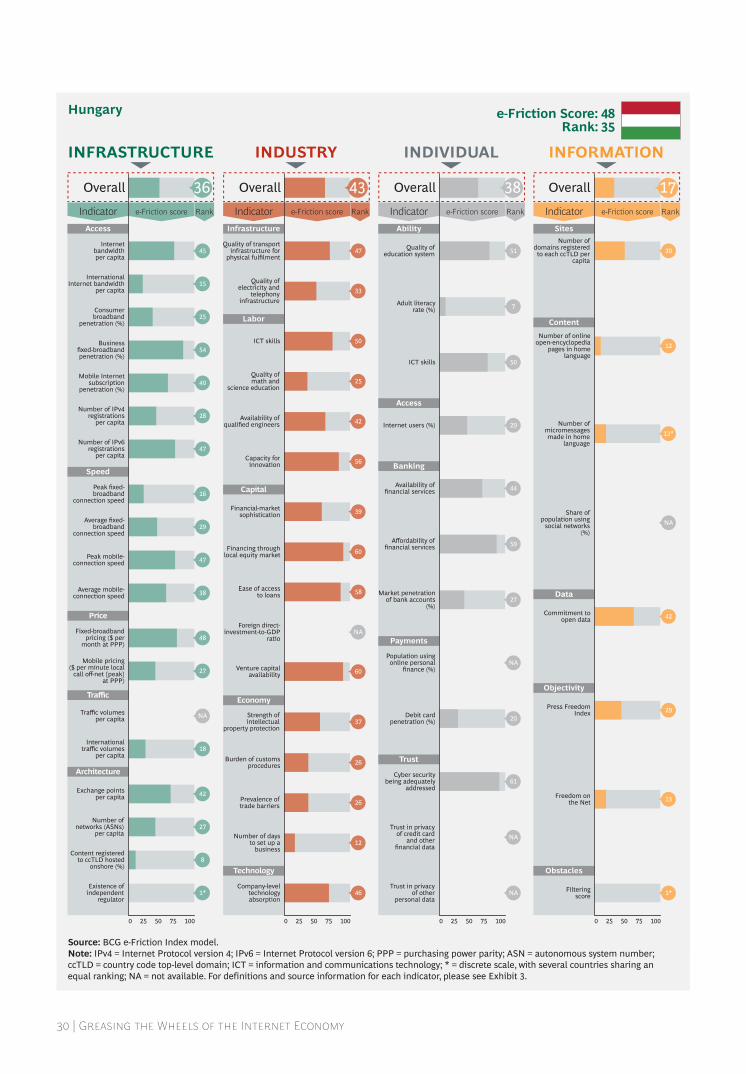
30 | Greasing the Wheels of the Internet Economy
Speed
Architecture
Traffic
Price
0 50 7525 100
Infrastructure
Labor
Technology
Economy
Capital
0 50 7525 100
Ability
Access
Trust
Payments
Banking
0 50 7525 100
Sites
Content
Obstacles
Objectivity
Data
0 50 7525 100
Access
Internetbandwidthper capita
Quality of transportinfrastructure for
physical fulfilmentQuality of
education system
Number ofdomains registeredto each ccTLD per
capita
Number of onlineopen-encyclopedia
pages in homelanguage
Number ofmicromessagesmade in home
language
Share ofpopulation using
social networks(%)
Commitment toopen data
Press FreedomIndex
Freedom onthe Net
Filteringscore
Adult literacyrate (%)
ICT skills
Internet users (%)
Availability offinancial services
Affordability offinancial services
Market penetrationof bank accounts
(%)
Population usingonline personal
finance (%)
Debit cardpenetration (%)
Cyber securitybeing adequately
addressed
Trust in privacyof credit card
and otherfinancial data
Trust in privacyof other
personal data
Quality ofelectricity and
telephonyinfrastructure
ICT skills
Quality ofmath and
science education
Availability ofqualified engineers
Capacity forinnovation
Financial-marketsophistication
Financing throughlocal equity market
Ease of accessto loans
Foreign direct-investment-to-GDP
ratio
Venture capitalavailability
Strength ofintellectual
property protection
Burden of customsprocedures
Prevalence oftrade barriers
Number of daysto set up a
business
Company-leveltechnologyabsorption
InternationalInternet bandwidth
per capita
Consumerbroadband
penetration (%)
Businessfixed-broadbandpenetration (%)
Mobile Internetsubscription
penetration (%)
Number of IPv4registrations
per capita
Number of IPv6registrations
per capita
Peak fixed-broadband
connection speed
Average fixed-broadband
connection speed
Peak mobile-connection speed
Average mobile-connection speed
Fixed-broadbandpricing ($ per
month at PPP)
Mobile pricing($ per minute local
call off-net [peak]at PPP)
Traffic volumesper capita
Internationaltraffic volumes
per capita
Exchange pointsper capita
Number ofnetworks (ASNs)
per capita
Content registeredto ccTLD hosted
onshore (%)
Existence ofindependent
regulator
e-Friction Score: 48Rank: 35
INFRASTRUCTURE
Indicator Ranke-Friction score e-Friction score
INDUSTRY
Indicator Rank e-Friction score Rank e-Friction score Rank
INDIVIDUAL
Indicator
INFORMATION
Indicator
Overall Overall Overall Overall
30
12
13*
NA
42
29
13
1*
45
15
25
54
40
28
47
16
29
47
38
48
27
NA
18
42
27
8
1*
47
33
50
25
42
56
39
60
58
60
37
26
26
12
46
NA
51
7
50
29
44
59
27
NA
20
61
NA
NA
36 43 38 17
Hungary
Source: BCG e-Friction index model.Note: iPv4 = internet Protocol version 4; iPv6 = internet Protocol version 6; PPP = purchasing power parity; aSn = autonomous system number; ccTlD = country code top-level domain; iCT = information and communications technology; * = discrete scale, with several countries sharing an equal ranking; na = not available. For definitions and source information for each indicator, please see exhibit 3.

The Boston Consulting Group | 31
Speed
Architecture
Traffic
Price
0 50 7525 100
Infrastructure
Labor
Technology
Economy
Capital
0 50 7525 100
Ability
Access
Trust
Payments
Banking
0 50 7525 100
Sites
Content
Obstacles
Objectivity
Data
0 50 7525 100
Access
Internetbandwidthper capita
Quality of transportinfrastructure for
physical fulfilmentQuality of
education system
Number ofdomains registeredto each ccTLD per
capita
Number of onlineopen-encyclopedia
pages in homelanguage
Number ofmicromessagesmade in home
language
Share ofpopulation using
social networks(%)
Commitment toopen data
Press FreedomIndex
Freedom onthe Net
Filteringscore
Adult literacyrate (%)
ICT skills
Internet users (%)
Availability offinancial services
Affordability offinancial services
Market penetrationof bank accounts
(%)
Population usingonline personal
finance (%)
Debit cardpenetration (%)
Cyber securitybeing adequately
addressed
Trust in privacyof credit card
and otherfinancial data
Trust in privacyof other
personal data
Quality ofelectricity and
telephonyinfrastructure
ICT skills
Quality ofmath and
science education
Availability ofqualified engineers
Capacity forinnovation
Financial-marketsophistication
Financing throughlocal equity market
Ease of accessto loans
Foreign direct-investment-to-GDP
ratio
Venture capitalavailability
Strength ofintellectual
property protection
Burden of customsprocedures
Prevalence oftrade barriers
Number of daysto set up a
business
Company-leveltechnologyabsorption
InternationalInternet bandwidth
per capita
Consumerbroadband
penetration (%)
Businessfixed-broadbandpenetration (%)
Mobile Internetsubscription
penetration (%)
Number of IPv4registrations
per capita
Number of IPv6registrations
per capita
Peak fixed-broadband
connection speed
Average fixed-broadband
connection speed
Peak mobile-connection speed
Average mobile-connection speed
Fixed-broadbandpricing ($ per
month at PPP)
Mobile pricing($ per minute local
call off-net [peak]at PPP)
Traffic volumesper capita
Internationaltraffic volumes
per capita
Exchange pointsper capita
Number ofnetworks (ASNs)
per capita
Content registeredto ccTLD hosted
onshore (%)
Existence ofindependent
regulator
e-Friction Score: 22Rank: 7
INFRASTRUCTURE
Indicator Ranke-Friction score e-Friction score
INDUSTRY
Indicator Rank e-Friction score Rank e-Friction score Rank
INDIVIDUAL
Indicator
INFORMATION
Indicator
Overall Overall Overall Overall
2 22 12 1
16
13*
NA
21
6
1
NA
11
1
55
56
NA
NA
NA
NA
NA
27
8
7
11
15
22
29
48
45
NA
39
24
11
51
12
2
NA
9
NA
NA
NA
5
NA
25
26
NA
NA
18
20
NA
NA
1
22
1
1*
2 19 20 3
Iceland
Source: BCG e-Friction index model.Note: iPv4 = internet Protocol version 4; iPv6 = internet Protocol version 6; PPP = purchasing power parity; aSn = autonomous system number; ccTlD = country code top-level domain; iCT = information and communications technology; * = discrete scale, with several countries sharing an equal ranking; na = not available. For definitions and source information for each indicator, please see exhibit 3.

32 | Greasing the Wheels of the Internet Economy
Speed
Architecture
Traffic
Price
0 50 7525 100
Infrastructure
Labor
Technology
Economy
Capital
0 50 7525 100
Ability
Access
Trust
Payments
Banking
0 50 7525 100
Sites
Content
Obstacles
Objectivity
Data
0 50 7525 100
Access
Internetbandwidthper capita
Quality of transportinfrastructure for
physical fulfilmentQuality of
education system
Number ofdomains registeredto each ccTLD per
capita
Number of onlineopen-encyclopedia
pages in homelanguage
Number ofmicromessagesmade in home
language
Share ofpopulation using
social networks(%)
Commitment toopen data
Press FreedomIndex
Freedom onthe Net
Filteringscore
Adult literacyrate (%)
ICT skills
Internet users (%)
Availability offinancial services
Affordability offinancial services
Market penetrationof bank accounts
(%)
Population usingonline personal
finance (%)
Debit cardpenetration (%)
Cyber securitybeing adequately
addressed
Trust in privacyof credit card
and otherfinancial data
Trust in privacyof other
personal data
Quality ofelectricity and
telephonyinfrastructure
ICT skills
Quality ofmath and
science education
Availability ofqualified engineers
Capacity forinnovation
Financial-marketsophistication
Financing throughlocal equity market
Ease of accessto loans
Foreign direct-investment-to-GDP
ratio
Venture capitalavailability
Strength ofintellectual
property protection
Burden of customsprocedures
Prevalence oftrade barriers
Number of daysto set up a
business
Company-leveltechnologyabsorption
InternationalInternet bandwidth
per capita
Consumerbroadband
penetration (%)
Businessfixed-broadbandpenetration (%)
Mobile Internetsubscription
penetration (%)
Number of IPv4registrations
per capita
Number of IPv6registrations
per capita
Peak fixed-broadband
connection speed
Average fixed-broadband
connection speed
Peak mobile-connection speed
Average mobile-connection speed
Fixed-broadbandpricing ($ per
month at PPP)
Mobile pricing($ per minute local
call off-net [peak]at PPP)
Traffic volumesper capita
Internationaltraffic volumes
per capita
Exchange pointsper capita
Number ofnetworks (ASNs)
per capita
Content registeredto ccTLD hosted
onshore (%)
Existence ofindependent
regulator
e-Friction Score: 73Rank: 58
INFRASTRUCTURE
Indicator Ranke-Friction score e-Friction score
INDUSTRY
Indicator Rank e-Friction score Rank e-Friction score Rank
INDIVIDUAL
Indicator
INFORMATION
Indicator
Overall Overall Overall Overall
51
60
NA
63
31
51
42
52*
62
62
64
55
64
63
62
61
62
NA
NA
2
2
65
65
63
62
59
1*
31
62
12
21
13
33
36
16
27
23
43
50
36
60
36
47
23
61
12
63
33
29
51
63
60
53
59
48
62 34 51 60
India
Source: BCG e-Friction index model.Note: iPv4 = internet Protocol version 4; iPv6 = internet Protocol version 6; PPP = purchasing power parity; aSn = autonomous system number; ccTlD = country code top-level domain; iCT = information and communications technology; * = discrete scale, with several countries sharing an equal ranking; na = not available. For definitions and source information for each indicator, please see exhibit 3.
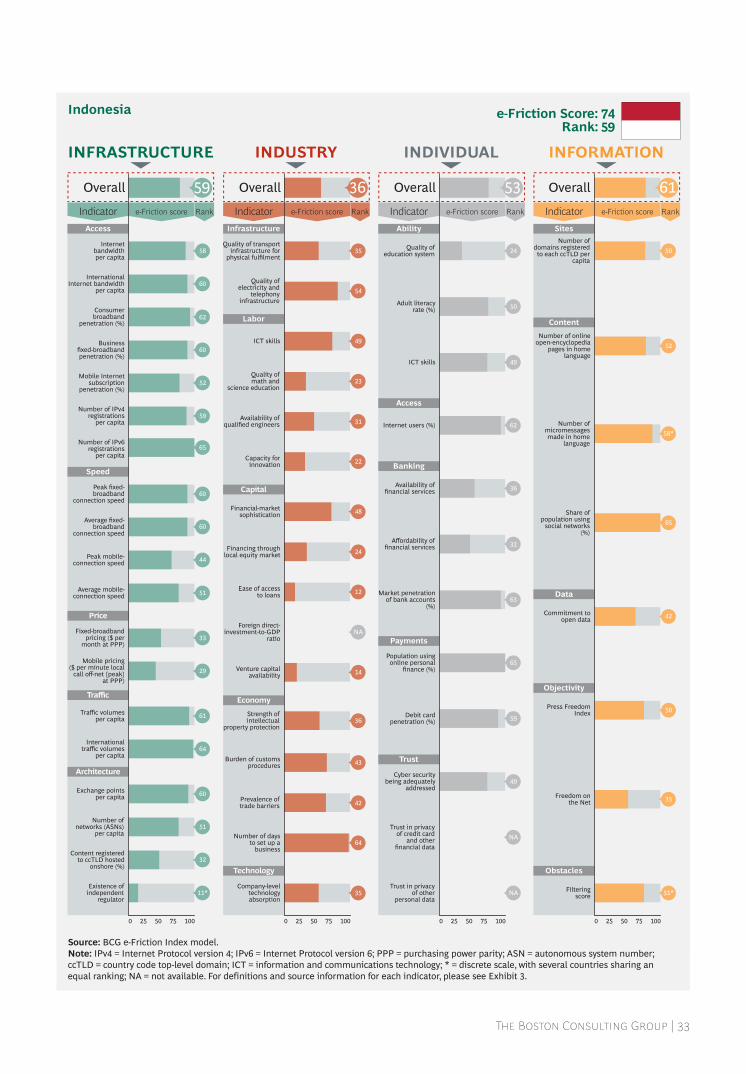
The Boston Consulting Group | 33
Speed
Architecture
Traffic
Price
0 50 7525 100
Infrastructure
Labor
Technology
Economy
Capital
0 50 7525 100
Ability
Access
Trust
Payments
Banking
0 50 7525 100
Sites
Content
Obstacles
Objectivity
Data
0 50 7525 100
Access
Internetbandwidthper capita
Quality of transportinfrastructure for
physical fulfilmentQuality of
education system
Number ofdomains registeredto each ccTLD per
capita
Number of onlineopen-encyclopedia
pages in homelanguage
Number ofmicromessagesmade in home
language
Share ofpopulation using
social networks(%)
Commitment toopen data
Press FreedomIndex
Freedom onthe Net
Filteringscore
Adult literacyrate (%)
ICT skills
Internet users (%)
Availability offinancial services
Affordability offinancial services
Market penetrationof bank accounts
(%)
Population usingonline personal
finance (%)
Debit cardpenetration (%)
Cyber securitybeing adequately
addressed
Trust in privacyof credit card
and otherfinancial data
Trust in privacyof other
personal data
Quality ofelectricity and
telephonyinfrastructure
ICT skills
Quality ofmath and
science education
Availability ofqualified engineers
Capacity forinnovation
Financial-marketsophistication
Financing throughlocal equity market
Ease of accessto loans
Foreign direct-investment-to-GDP
ratio
Venture capitalavailability
Strength ofintellectual
property protection
Burden of customsprocedures
Prevalence oftrade barriers
Number of daysto set up a
business
Company-leveltechnologyabsorption
InternationalInternet bandwidth
per capita
Consumerbroadband
penetration (%)
Businessfixed-broadbandpenetration (%)
Mobile Internetsubscription
penetration (%)
Number of IPv4registrations
per capita
Number of IPv6registrations
per capita
Peak fixed-broadband
connection speed
Average fixed-broadband
connection speed
Peak mobile-connection speed
Average mobile-connection speed
Fixed-broadbandpricing ($ per
month at PPP)
Mobile pricing($ per minute local
call off-net [peak]at PPP)
Traffic volumesper capita
Internationaltraffic volumes
per capita
Exchange pointsper capita
Number ofnetworks (ASNs)
per capita
Content registeredto ccTLD hosted
onshore (%)
Existence ofindependent
regulator
e-Friction Score: 74Rank: 59
INFRASTRUCTURE
Indicator Ranke-Friction score e-Friction score
INDUSTRY
Indicator Rank e-Friction score Rank e-Friction score Rank
INDIVIDUAL
Indicator
INFORMATION
Indicator
Overall Overall Overall Overall
50
52
58*
65
42
50
35
51*
58
60
62
60
52
59
65
60
60
44
51
33
29
61
64
60
51
32
11*
35
54
49
23
31
22
48
24
12
14
36
43
42
64
35
NA
24
50
49
62
36
32
63
65
59
49
NA
NA
59 36 53 61
Indonesia
Source: BCG e-Friction index model.Note: iPv4 = internet Protocol version 4; iPv6 = internet Protocol version 6; PPP = purchasing power parity; aSn = autonomous system number; ccTlD = country code top-level domain; iCT = information and communications technology; * = discrete scale, with several countries sharing an equal ranking; na = not available. For definitions and source information for each indicator, please see exhibit 3.

34 | Greasing the Wheels of the Internet Economy
Speed
Architecture
Traffic
Price
0 50 7525 100
Infrastructure
Labor
Technology
Economy
Capital
0 50 7525 100
Ability
Access
Trust
Payments
Banking
0 50 7525 100
Sites
Content
Obstacles
Objectivity
Data
0 50 7525 100
Access
Internetbandwidthper capita
Quality of transportinfrastructure for
physical fulfilmentQuality of
education system
Number ofdomains registeredto each ccTLD per
capita
Number of onlineopen-encyclopedia
pages in homelanguage
Number ofmicromessagesmade in home
language
Share ofpopulation using
social networks(%)
Commitment toopen data
Press FreedomIndex
Freedom onthe Net
Filteringscore
Adult literacyrate (%)
ICT skills
Internet users (%)
Availability offinancial services
Affordability offinancial services
Market penetrationof bank accounts
(%)
Population usingonline personal
finance (%)
Debit cardpenetration (%)
Cyber securitybeing adequately
addressed
Trust in privacyof credit card
and otherfinancial data
Trust in privacyof other
personal data
Quality ofelectricity and
telephonyinfrastructure
ICT skills
Quality ofmath and
science education
Availability ofqualified engineers
Capacity forinnovation
Financial-marketsophistication
Financing throughlocal equity market
Ease of accessto loans
Foreign direct-investment-to-GDP
ratio
Venture capitalavailability
Strength ofintellectual
property protection
Burden of customsprocedures
Prevalence oftrade barriers
Number of daysto set up a
business
Company-leveltechnologyabsorption
InternationalInternet bandwidth
per capita
Consumerbroadband
penetration (%)
Businessfixed-broadbandpenetration (%)
Mobile Internetsubscription
penetration (%)
Number of IPv4registrations
per capita
Number of IPv6registrations
per capita
Peak fixed-broadband
connection speed
Average fixed-broadband
connection speed
Peak mobile-connection speed
Average mobile-connection speed
Fixed-broadbandpricing ($ per
month at PPP)
Mobile pricing($ per minute local
call off-net [peak]at PPP)
Traffic volumesper capita
Internationaltraffic volumes
per capita
Exchange pointsper capita
Number ofnetworks (ASNs)
per capita
Content registeredto ccTLD hosted
onshore (%)
Existence ofindependent
regulator
e-Friction Score: 34Rank: 18
INFRASTRUCTURE
Indicator Ranke-Friction score e-Friction score
INDUSTRY
Indicator Rank e-Friction score Rank e-Friction score Rank
INDIVIDUAL
Indicator
INFORMATION
Indicator
Overall Overall Overall Overall
9
19
13*
14
31
11
NA
NA
15
14
NA
NA
34
14
14
32
20
21
12
35
55
NA
21
10
22
39
1*
33
15
37
16
18
18
35
51
59
40
17
9
11
40
22
10
5
8
37
23
45
40
16
28
16
22
NA
NA
18 26 21 12
Ireland
Source: BCG e-Friction index model.Note: iPv4 = internet Protocol version 4; iPv6 = internet Protocol version 6; PPP = purchasing power parity; aSn = autonomous system number; ccTlD = country code top-level domain; iCT = information and communications technology; * = discrete scale, with several countries sharing an equal ranking; na = not available. For definitions and source information for each indicator, please see exhibit 3.

The Boston Consulting Group | 35
Speed
Architecture
Traffic
Price
0 50 7525 100
Infrastructure
Labor
Technology
Economy
Capital
0 50 7525 100
Ability
Access
Trust
Payments
Banking
0 50 7525 100
Sites
Content
Obstacles
Objectivity
Data
0 50 7525 100
Access
Internetbandwidthper capita
Quality of transportinfrastructure for
physical fulfilmentQuality of
education system
Number ofdomains registeredto each ccTLD per
capita
Number of onlineopen-encyclopedia
pages in homelanguage
Number ofmicromessagesmade in home
language
Share ofpopulation using
social networks(%)
Commitment toopen data
Press FreedomIndex
Freedom onthe Net
Filteringscore
Adult literacyrate (%)
ICT skills
Internet users (%)
Availability offinancial services
Affordability offinancial services
Market penetrationof bank accounts
(%)
Population usingonline personal
finance (%)
Debit cardpenetration (%)
Cyber securitybeing adequately
addressed
Trust in privacyof credit card
and otherfinancial data
Trust in privacyof other
personal data
Quality ofelectricity and
telephonyinfrastructure
ICT skills
Quality ofmath and
science education
Availability ofqualified engineers
Capacity forinnovation
Financial-marketsophistication
Financing throughlocal equity market
Ease of accessto loans
Foreign direct-investment-to-GDP
ratio
Venture capitalavailability
Strength ofintellectual
property protection
Burden of customsprocedures
Prevalence oftrade barriers
Number of daysto set up a
business
Company-leveltechnologyabsorption
InternationalInternet bandwidth
per capita
Consumerbroadband
penetration (%)
Businessfixed-broadbandpenetration (%)
Mobile Internetsubscription
penetration (%)
Number of IPv4registrations
per capita
Number of IPv6registrations
per capita
Peak fixed-broadband
connection speed
Average fixed-broadband
connection speed
Peak mobile-connection speed
Average mobile-connection speed
Fixed-broadbandpricing ($ per
month at PPP)
Mobile pricing($ per minute local
call off-net [peak]at PPP)
Traffic volumesper capita
Internationaltraffic volumes
per capita
Exchange pointsper capita
Number ofnetworks (ASNs)
per capita
Content registeredto ccTLD hosted
onshore (%)
Existence ofindependent
regulator
e-Friction Score: 39Rank: 22
INFRASTRUCTURE
Indicator Ranke-Friction score e-Friction score
INDUSTRY
Indicator Rank e-Friction score Rank e-Friction score Rank
INDIVIDUAL
Indicator
INFORMATION
Indicator
Overall Overall Overall Overall
41 33 7
51
65*
28
30
41
NA
1*
8
1
27
32
44
18
31
62
1
NA
NA
20
1
44
7
4
25
38
40
15
8
28
36
46
56
5
28
38
11
31
22
23
45
9
22
NA
NA
1
40
NA
NA
35
23
8
33*
22 23 23 31
Israel
Source: BCG e-Friction index model.Note: iPv4 = internet Protocol version 4; iPv6 = internet Protocol version 6; PPP = purchasing power parity; aSn = autonomous system number; ccTlD = country code top-level domain; iCT = information and communications technology; * = discrete scale, with several countries sharing an equal ranking; na = not available. For definitions and source information for each indicator, please see exhibit 3.

36 | Greasing the Wheels of the Internet Economy
Speed
Architecture
Traffic
Price
0 50 7525 100
Infrastructure
Labor
Technology
Economy
Capital
0 50 7525 100
Ability
Access
Trust
Payments
Banking
0 50 7525 100
Sites
Content
Obstacles
Objectivity
Data
0 50 7525 100
Access
Internetbandwidthper capita
Quality of transportinfrastructure for
physical fulfilmentQuality of
education system
Number ofdomains registeredto each ccTLD per
capita
Number of onlineopen-encyclopedia
pages in homelanguage
Number ofmicromessagesmade in home
language
Share ofpopulation using
social networks(%)
Commitment toopen data
Press FreedomIndex
Freedom onthe Net
Filteringscore
Adult literacyrate (%)
ICT skills
Internet users (%)
Availability offinancial services
Affordability offinancial services
Market penetrationof bank accounts
(%)
Population usingonline personal
finance (%)
Debit cardpenetration (%)
Cyber securitybeing adequately
addressed
Trust in privacyof credit card
and otherfinancial data
Trust in privacyof other
personal data
Quality ofelectricity and
telephonyinfrastructure
ICT skills
Quality ofmath and
science education
Availability ofqualified engineers
Capacity forinnovation
Financial-marketsophistication
Financing throughlocal equity market
Ease of accessto loans
Foreign direct-investment-to-GDP
ratio
Venture capitalavailability
Strength ofintellectual
property protection
Burden of customsprocedures
Prevalence oftrade barriers
Number of daysto set up a
business
Company-leveltechnologyabsorption
InternationalInternet bandwidth
per capita
Consumerbroadband
penetration (%)
Businessfixed-broadbandpenetration (%)
Mobile Internetsubscription
penetration (%)
Number of IPv4registrations
per capita
Number of IPv6registrations
per capita
Peak fixed-broadband
connection speed
Average fixed-broadband
connection speed
Peak mobile-connection speed
Average mobile-connection speed
Fixed-broadbandpricing ($ per
month at PPP)
Mobile pricing($ per minute local
call off-net [peak]at PPP)
Traffic volumesper capita
Internationaltraffic volumes
per capita
Exchange pointsper capita
Number ofnetworks (ASNs)
per capita
Content registeredto ccTLD hosted
onshore (%)
Existence ofindependent
regulator
e-Friction Score: 49Rank: 36
INFRASTRUCTURE
Indicator Ranke-Friction score e-Friction score
INDUSTRY
Indicator Rank e-Friction score Rank e-Friction score Rank
INDIVIDUAL
Indicator
INFORMATION
Indicator
Overall Overall Overall Overall
14
NA
36
24
30
13
36*
27
25
29
30
20
24
52
45
37
12
14
22
37
NA
27
40
35
28
1*
27
17
55
38
23
28
47
52
64
63
41
41
39
21
58
61
38
29
55
37
48
60
29
36
35
50
30
42
30 45 41 23
38
Italy
Source: BCG e-Friction index model.Note: iPv4 = internet Protocol version 4; iPv6 = internet Protocol version 6; PPP = purchasing power parity; aSn = autonomous system number; ccTlD = country code top-level domain; iCT = information and communications technology; * = discrete scale, with several countries sharing an equal ranking; na = not available. For definitions and source information for each indicator, please see exhibit 3.
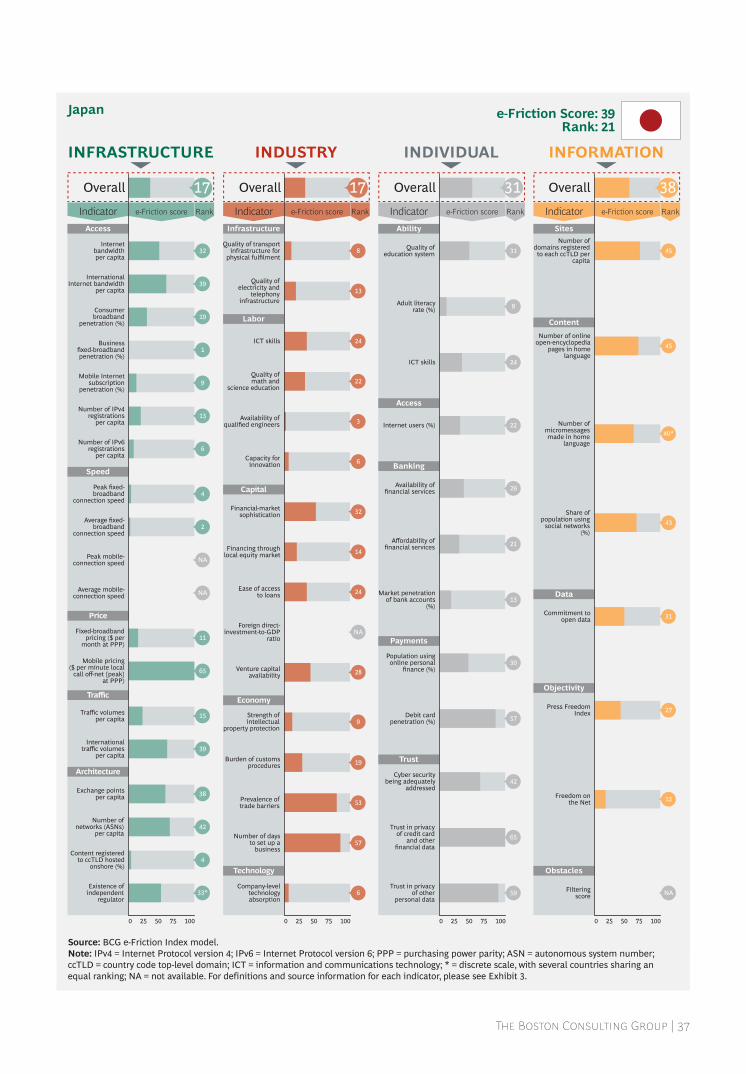
The Boston Consulting Group | 37
Speed
Architecture
Traffic
Price
0 50 7525 100
Infrastructure
Labor
Technology
Economy
Capital
0 50 7525 100
Ability
Access
Trust
Payments
Banking
0 50 7525 100
Sites
Content
Obstacles
Objectivity
Data
0 50 7525 100
Access
Internetbandwidthper capita
Quality of transportinfrastructure for
physical fulfilmentQuality of
education system
Number ofdomains registeredto each ccTLD per
capita
Number of onlineopen-encyclopedia
pages in homelanguage
Number ofmicromessagesmade in home
language
Share ofpopulation using
social networks(%)
Commitment toopen data
Press FreedomIndex
Freedom onthe Net
Filteringscore
Adult literacyrate (%)
ICT skills
Internet users (%)
Availability offinancial services
Affordability offinancial services
Market penetrationof bank accounts
(%)
Population usingonline personal
finance (%)
Debit cardpenetration (%)
Cyber securitybeing adequately
addressed
Trust in privacyof credit card
and otherfinancial data
Trust in privacyof other
personal data
Quality ofelectricity and
telephonyinfrastructure
ICT skills
Quality ofmath and
science education
Availability ofqualified engineers
Capacity forinnovation
Financial-marketsophistication
Financing throughlocal equity market
Ease of accessto loans
Foreign direct-investment-to-GDP
ratio
Venture capitalavailability
Strength ofintellectual
property protection
Burden of customsprocedures
Prevalence oftrade barriers
Number of daysto set up a
business
Company-leveltechnologyabsorption
InternationalInternet bandwidth
per capita
Consumerbroadband
penetration (%)
Businessfixed-broadbandpenetration (%)
Mobile Internetsubscription
penetration (%)
Number of IPv4registrations
per capita
Number of IPv6registrations
per capita
Peak fixed-broadband
connection speed
Average fixed-broadband
connection speed
Peak mobile-connection speed
Average mobile-connection speed
Fixed-broadbandpricing ($ per
month at PPP)
Mobile pricing($ per minute local
call off-net [peak]at PPP)
Traffic volumesper capita
Internationaltraffic volumes
per capita
Exchange pointsper capita
Number ofnetworks (ASNs)
per capita
Content registeredto ccTLD hosted
onshore (%)
Existence ofindependent
regulator
e-Friction Score: 39Rank: 21
INFRASTRUCTURE
Indicator Ranke-Friction score e-Friction score
INDUSTRY
Indicator Rank e-Friction score Rank e-Friction score Rank
INDIVIDUAL
Indicator
INFORMATION
Indicator
Overall Overall Overall Overall
32 8 31 45
45
40*
43
31
27
12
NA
8
24
22
26
21
13
30
57
42
59
13
24
22
3
6
32
14
24
NA
28
9
19
53
57
6
39
19
1
9
13
6
4
2
NA
NA
11
65
15
39
38
42
4
33*
17 17 31 38
65
Japan
Source: BCG e-Friction index model.Note: iPv4 = internet Protocol version 4; iPv6 = internet Protocol version 6; PPP = purchasing power parity; aSn = autonomous system number; ccTlD = country code top-level domain; iCT = information and communications technology; * = discrete scale, with several countries sharing an equal ranking; na = not available. For definitions and source information for each indicator, please see exhibit 3.
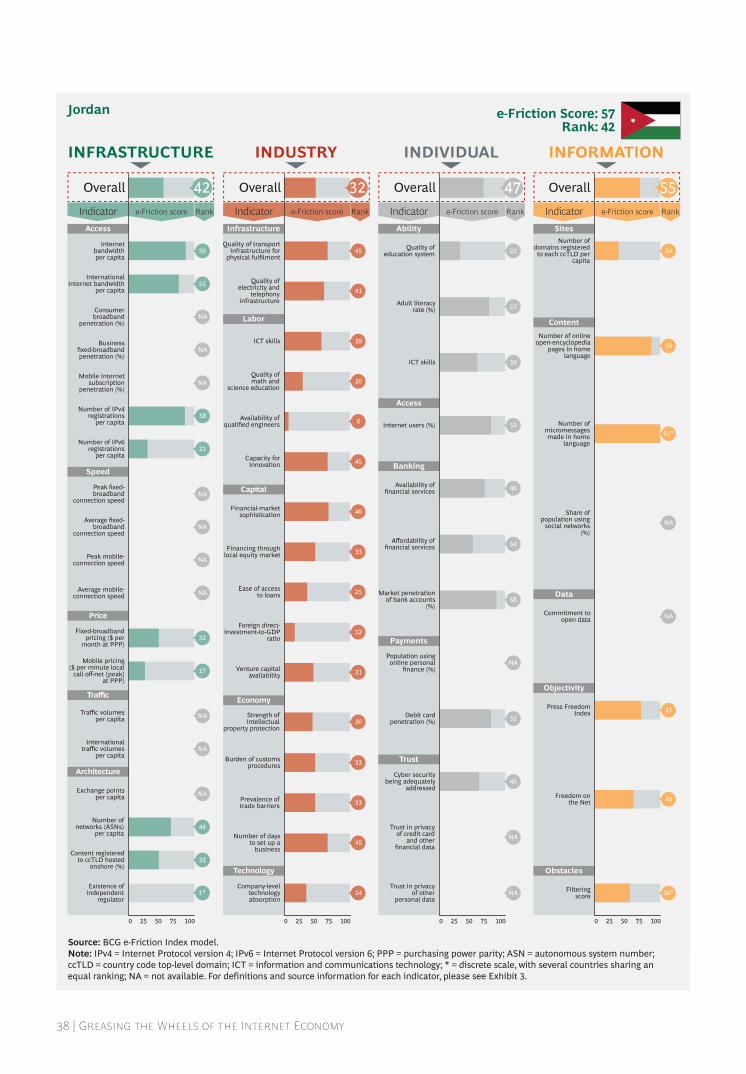
38 | Greasing the Wheels of the Internet Economy
Speed
Architecture
Traffic
Price
0 50 7525 100
Infrastructure
Labor
Technology
Economy
Capital
0 50 7525 100
Ability
Access
Trust
Payments
Banking
0 50 7525 100
Sites
Content
Obstacles
Objectivity
Data
0 50 7525 100
Access
Internetbandwidthper capita
Quality of transportinfrastructure for
physical fulfilmentQuality of
education system
Number ofdomains registeredto each ccTLD per
capita
Number of onlineopen-encyclopedia
pages in homelanguage
Number ofmicromessagesmade in home
language
Share ofpopulation using
social networks(%)
Commitment toopen data
Press FreedomIndex
Freedom onthe Net
Filteringscore
Adult literacyrate (%)
ICT skills
Internet users (%)
Availability offinancial services
Affordability offinancial services
Market penetrationof bank accounts
(%)
Population usingonline personal
finance (%)
Debit cardpenetration (%)
Cyber securitybeing adequately
addressed
Trust in privacyof credit card
and otherfinancial data
Trust in privacyof other
personal data
Quality ofelectricity and
telephonyinfrastructure
ICT skills
Quality ofmath and
science education
Availability ofqualified engineers
Capacity forinnovation
Financial-marketsophistication
Financing throughlocal equity market
Ease of accessto loans
Foreign direct-investment-to-GDP
ratio
Venture capitalavailability
Strength ofintellectual
property protection
Burden of customsprocedures
Prevalence oftrade barriers
Number of daysto set up a
business
Company-leveltechnologyabsorption
InternationalInternet bandwidth
per capita
Consumerbroadband
penetration (%)
Businessfixed-broadbandpenetration (%)
Mobile Internetsubscription
penetration (%)
Number of IPv4registrations
per capita
Number of IPv6registrations
per capita
Peak fixed-broadband
connection speed
Average fixed-broadband
connection speed
Peak mobile-connection speed
Average mobile-connection speed
Fixed-broadbandpricing ($ per
month at PPP)
Mobile pricing($ per minute local
call off-net [peak]at PPP)
Traffic volumesper capita
Internationaltraffic volumes
per capita
Exchange pointsper capita
Number ofnetworks (ASNs)
per capita
Content registeredto ccTLD hosted
onshore (%)
Existence ofindependent
regulator
e-Friction Score: 57Rank: 42
INFRASTRUCTURE
Indicator Ranke-Friction score e-Friction score
INDUSTRY
Indicator Rank e-Friction score Rank e-Friction score Rank
INDIVIDUAL
Indicator
INFORMATION
Indicator
Overall Overall Overall Overall
24
58
65*
NA
NA
47
40
36*
45
41
39
20
6
45
46
33
25
31
30
33
33
45
24
12
22
51
39
52
46
34
58
52
40
59
52
NA
58
21
NA
NA
NA
NA
NA
NA
32
17
NA
NA
NA
NA
NA
NA
44
32
1*
42 32 47 55
Jordan
Source: BCG e-Friction index model.Note: iPv4 = internet Protocol version 4; iPv6 = internet Protocol version 6; PPP = purchasing power parity; aSn = autonomous system number; ccTlD = country code top-level domain; iCT = information and communications technology; * = discrete scale, with several countries sharing an equal ranking; na = not available. For definitions and source information for each indicator, please see exhibit 3.

The Boston Consulting Group | 39
Speed
Architecture
Traffic
Price
0 50 7525 100
Infrastructure
Labor
Technology
Economy
Capital
0 50 7525 100
Ability
Access
Trust
Payments
Banking
0 50 7525 100
Sites
Content
Obstacles
Objectivity
Data
0 50 7525 100
Access
Internetbandwidthper capita
Quality of transportinfrastructure for
physical fulfilmentQuality of
education system
Number ofdomains registeredto each ccTLD per
capita
Number of onlineopen-encyclopedia
pages in homelanguage
Number ofmicromessagesmade in home
language
Share ofpopulation using
social networks(%)
Commitment toopen data
Press FreedomIndex
Freedom onthe Net
Filteringscore
Adult literacyrate (%)
ICT skills
Internet users (%)
Availability offinancial services
Affordability offinancial services
Market penetrationof bank accounts
(%)
Population usingonline personal
finance (%)
Debit cardpenetration (%)
Cyber securitybeing adequately
addressed
Trust in privacyof credit card
and otherfinancial data
Trust in privacyof other
personal data
Quality ofelectricity and
telephonyinfrastructure
ICT skills
Quality ofmath and
science education
Availability ofqualified engineers
Capacity forinnovation
Financial-marketsophistication
Financing throughlocal equity market
Ease of accessto loans
Foreign direct-investment-to-GDP
ratio
Venture capitalavailability
Strength ofintellectual
property protection
Burden of customsprocedures
Prevalence oftrade barriers
Number of daysto set up a
business
Company-leveltechnologyabsorption
InternationalInternet bandwidth
per capita
Consumerbroadband
penetration (%)
Businessfixed-broadbandpenetration (%)
Mobile Internetsubscription
penetration (%)
Number of IPv4registrations
per capita
Number of IPv6registrations
per capita
Peak fixed-broadband
connection speed
Average fixed-broadband
connection speed
Peak mobile-connection speed
Average mobile-connection speed
Fixed-broadbandpricing ($ per
month at PPP)
Mobile pricing($ per minute local
call off-net [peak]at PPP)
Traffic volumesper capita
Internationaltraffic volumes
per capita
Exchange pointsper capita
Number ofnetworks (ASNs)
per capita
Content registeredto ccTLD hosted
onshore (%)
Existence ofindependent
regulator
e-Friction Score: 64Rank: 46
INFRASTRUCTURE
Indicator Ranke-Friction score e-Friction score
INDUSTRY
Indicator Rank e-Friction score Rank e-Friction score Rank
INDIVIDUAL
Indicator
INFORMATION
Indicator
Overall Overall Overall Overall
52
NA
NA
NA
61
51
43*
41
51
NA
NA
NA
52
34
NA
NA
NA
NA
26
21
NA
55
50
41
19
33*
54
35
44
42
60
46
55
57
36
43
45
44
29
53
47
NA
48
3
44
43
41
38
46
NA
39
59
NA
NA
45 49 40 58
36
Kazakhstan
Source: BCG e-Friction index model.Note: iPv4 = internet Protocol version 4; iPv6 = internet Protocol version 6; PPP = purchasing power parity; aSn = autonomous system number; ccTlD = country code top-level domain; iCT = information and communications technology; * = discrete scale, with several countries sharing an equal ranking; na = not available. For definitions and source information for each indicator, please see exhibit 3.
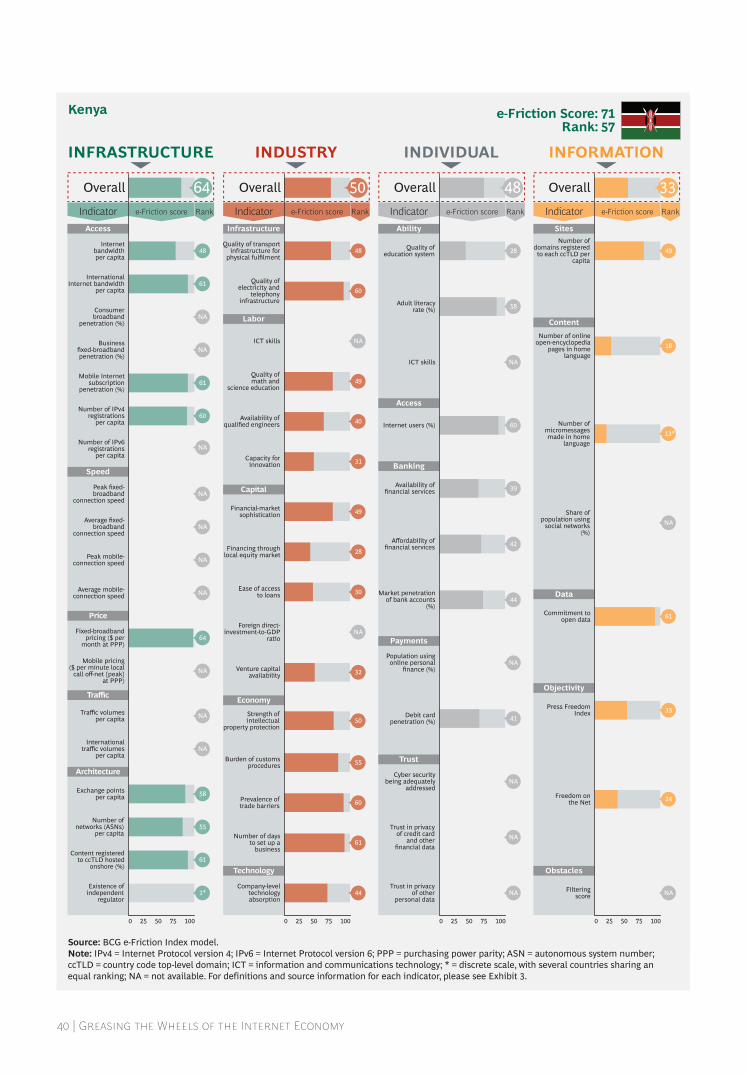
40 | Greasing the Wheels of the Internet Economy
Speed
Architecture
Traffic
Price
0 50 7525 100
Infrastructure
Labor
Technology
Economy
Capital
0 50 7525 100
Ability
Access
Trust
Payments
Banking
0 50 7525 100
Sites
Content
Obstacles
Objectivity
Data
0 50 7525 100
Access
Internetbandwidthper capita
Quality of transportinfrastructure for
physical fulfilmentQuality of
education system
Number ofdomains registeredto each ccTLD per
capita
Number of onlineopen-encyclopedia
pages in homelanguage
Number ofmicromessagesmade in home
language
Share ofpopulation using
social networks(%)
Commitment toopen data
Press FreedomIndex
Freedom onthe Net
Filteringscore
Adult literacyrate (%)
ICT skills
Internet users (%)
Availability offinancial services
Affordability offinancial services
Market penetrationof bank accounts
(%)
Population usingonline personal
finance (%)
Debit cardpenetration (%)
Cyber securitybeing adequately
addressed
Trust in privacyof credit card
and otherfinancial data
Trust in privacyof other
personal data
Quality ofelectricity and
telephonyinfrastructure
ICT skills
Quality ofmath and
science education
Availability ofqualified engineers
Capacity forinnovation
Financial-marketsophistication
Financing throughlocal equity market
Ease of accessto loans
Foreign direct-investment-to-GDP
ratio
Venture capitalavailability
Strength ofintellectual
property protection
Burden of customsprocedures
Prevalence oftrade barriers
Number of daysto set up a
business
Company-leveltechnologyabsorption
InternationalInternet bandwidth
per capita
Consumerbroadband
penetration (%)
Businessfixed-broadbandpenetration (%)
Mobile Internetsubscription
penetration (%)
Number of IPv4registrations
per capita
Number of IPv6registrations
per capita
Peak fixed-broadband
connection speed
Average fixed-broadband
connection speed
Peak mobile-connection speed
Average mobile-connection speed
Fixed-broadbandpricing ($ per
month at PPP)
Mobile pricing($ per minute local
call off-net [peak]at PPP)
Traffic volumesper capita
Internationaltraffic volumes
per capita
Exchange pointsper capita
Number ofnetworks (ASNs)
per capita
Content registeredto ccTLD hosted
onshore (%)
Existence ofindependent
regulator
e-Friction Score: 71Rank: 57
INFRASTRUCTURE
Indicator Ranke-Friction score e-Friction score
INDUSTRY
Indicator Rank e-Friction score Rank e-Friction score Rank
INDIVIDUAL
Indicator
INFORMATION
Indicator
Overall Overall Overall Overall
49
18
13*
NA
61
33
24
NA
48
61
NA
NA
61
60
NA
NA
NA
NA
NA
64
NA
NA
NA
58
55
61
1*
48
60
NA
49
40
31
49
28
30
32
50
55
60
61
44
NA
28
58
NA
60
39
42
44
NA
41
NA
NA
NA
64 50 48 33
Kenya
Source: BCG e-Friction index model.Note: iPv4 = internet Protocol version 4; iPv6 = internet Protocol version 6; PPP = purchasing power parity; aSn = autonomous system number; ccTlD = country code top-level domain; iCT = information and communications technology; * = discrete scale, with several countries sharing an equal ranking; na = not available. For definitions and source information for each indicator, please see exhibit 3.

The Boston Consulting Group | 41
Speed
Architecture
Traffic
Price
0 50 7525 100
Infrastructure
Labor
Technology
Economy
Capital
0 50 7525 100
Ability
Access
Trust
Payments
Banking
0 50 7525 100
Sites
Content
Obstacles
Objectivity
Data
0 50 7525 100
Access
Internetbandwidthper capita
Quality of transportinfrastructure for
physical fulfilmentQuality of
education system
Number ofdomains registeredto each ccTLD per
capita
Number of onlineopen-encyclopedia
pages in homelanguage
Number ofmicromessagesmade in home
language
Share ofpopulation using
social networks(%)
Commitment toopen data
Press FreedomIndex
Freedom onthe Net
Filteringscore
Adult literacyrate (%)
ICT skills
Internet users (%)
Availability offinancial services
Affordability offinancial services
Market penetrationof bank accounts
(%)
Population usingonline personal
finance (%)
Debit cardpenetration (%)
Cyber securitybeing adequately
addressed
Trust in privacyof credit card
and otherfinancial data
Trust in privacyof other
personal data
Quality ofelectricity and
telephonyinfrastructure
ICT skills
Quality ofmath and
science education
Availability ofqualified engineers
Capacity forinnovation
Financial-marketsophistication
Financing throughlocal equity market
Ease of accessto loans
Foreign direct-investment-to-GDP
ratio
Venture capitalavailability
Strength ofintellectual
property protection
Burden of customsprocedures
Prevalence oftrade barriers
Number of daysto set up a
business
Company-leveltechnologyabsorption
InternationalInternet bandwidth
per capita
Consumerbroadband
penetration (%)
Businessfixed-broadbandpenetration (%)
Mobile Internetsubscription
penetration (%)
Number of IPv4registrations
per capita
Number of IPv6registrations
per capita
Peak fixed-broadband
connection speed
Average fixed-broadband
connection speed
Peak mobile-connection speed
Average mobile-connection speed
Fixed-broadbandpricing ($ per
month at PPP)
Mobile pricing($ per minute local
call off-net [peak]at PPP)
Traffic volumesper capita
Internationaltraffic volumes
per capita
Exchange pointsper capita
Number ofnetworks (ASNs)
per capita
Content registeredto ccTLD hosted
onshore (%)
Existence ofindependent
regulator
e-Friction Score: 56Rank: 40
INFRASTRUCTURE
Indicator Ranke-Friction score e-Friction score
INDUSTRY
Indicator Rank e-Friction score Rank e-Friction score Rank
INDIVIDUAL
Indicator
INFORMATION
Indicator
Overall Overall Overall Overall
28
23
13*
34
57*
46
38
NA
51
47
65
57
33
46
42
40
54
55
61
41
NA
56
44
NA
21
49
37
22
NA
NA
NA
NA
11
NA
NA
NA
49
NA
NA
NA
NA
34
NA
38
53
9
49
16
NA
NA
NA
NA
34
29
49*
44 57 32 30
Kuwait
Source: BCG e-Friction index model.Note: iPv4 = internet Protocol version 4; iPv6 = internet Protocol version 6; PPP = purchasing power parity; aSn = autonomous system number; ccTlD = country code top-level domain; iCT = information and communications technology; * = discrete scale, with several countries sharing an equal ranking; na = not available. For definitions and source information for each indicator, please see exhibit 3.

42 | Greasing the Wheels of the Internet Economy
Speed
Architecture
Traffic
Price
0 50 7525 100
Infrastructure
Labor
Technology
Economy
Capital
0 50 7525 100
Ability
Access
Trust
Payments
Banking
0 50 7525 100
Sites
Content
Obstacles
Objectivity
Data
0 50 7525 100
Access
Internetbandwidthper capita
Quality of transportinfrastructure for
physical fulfilmentQuality of
education system
Number ofdomains registeredto each ccTLD per
capita
Number of onlineopen-encyclopedia
pages in homelanguage
Number ofmicromessagesmade in home
language
Share ofpopulation using
social networks(%)
Commitment toopen data
Press FreedomIndex
Freedom onthe Net
Filteringscore
Adult literacyrate (%)
ICT skills
Internet users (%)
Availability offinancial services
Affordability offinancial services
Market penetrationof bank accounts
(%)
Population usingonline personal
finance (%)
Debit cardpenetration (%)
Cyber securitybeing adequately
addressed
Trust in privacyof credit card
and otherfinancial data
Trust in privacyof other
personal data
Quality ofelectricity and
telephonyinfrastructure
ICT skills
Quality ofmath and
science education
Availability ofqualified engineers
Capacity forinnovation
Financial-marketsophistication
Financing throughlocal equity market
Ease of accessto loans
Foreign direct-investment-to-GDP
ratio
Venture capitalavailability
Strength ofintellectual
property protection
Burden of customsprocedures
Prevalence oftrade barriers
Number of daysto set up a
business
Company-leveltechnologyabsorption
InternationalInternet bandwidth
per capita
Consumerbroadband
penetration (%)
Businessfixed-broadbandpenetration (%)
Mobile Internetsubscription
penetration (%)
Number of IPv4registrations
per capita
Number of IPv6registrations
per capita
Peak fixed-broadband
connection speed
Average fixed-broadband
connection speed
Peak mobile-connection speed
Average mobile-connection speed
Fixed-broadbandpricing ($ per
month at PPP)
Mobile pricing($ per minute local
call off-net [peak]at PPP)
Traffic volumesper capita
Internationaltraffic volumes
per capita
Exchange pointsper capita
Number ofnetworks (ASNs)
per capita
Content registeredto ccTLD hosted
onshore (%)
Existence ofindependent
regulator
e-Friction Score: 44Rank: 28
INFRASTRUCTURE
Indicator Ranke-Friction score e-Friction score
INDUSTRY
Indicator Rank e-Friction score Rank e-Friction score Rank
INDIVIDUAL
Indicator
INFORMATION
Indicator
Overall Overall Overall Overall
34
42
46
36
21
46
35
41
46
8
27
47
16
NA
48
52
45
27
1* 29
12
20
18
25
7
NA
5
7
25
14
17
18
25
37
15 15
48
25
32
21
13
31
40
46
8
NA
NA 1*
38
53
NA
38
13*
15
13
41 15 25 22
Malaysia
Source: BCG e-Friction index model.Note: iPv4 = internet Protocol version 4; iPv6 = internet Protocol version 6; PPP = purchasing power parity; aSn = autonomous system number; ccTlD = country code top-level domain; iCT = information and communications technology; * = discrete scale, with several countries sharing an equal ranking; na = not available. For definitions and source information for each indicator, please see exhibit 3.
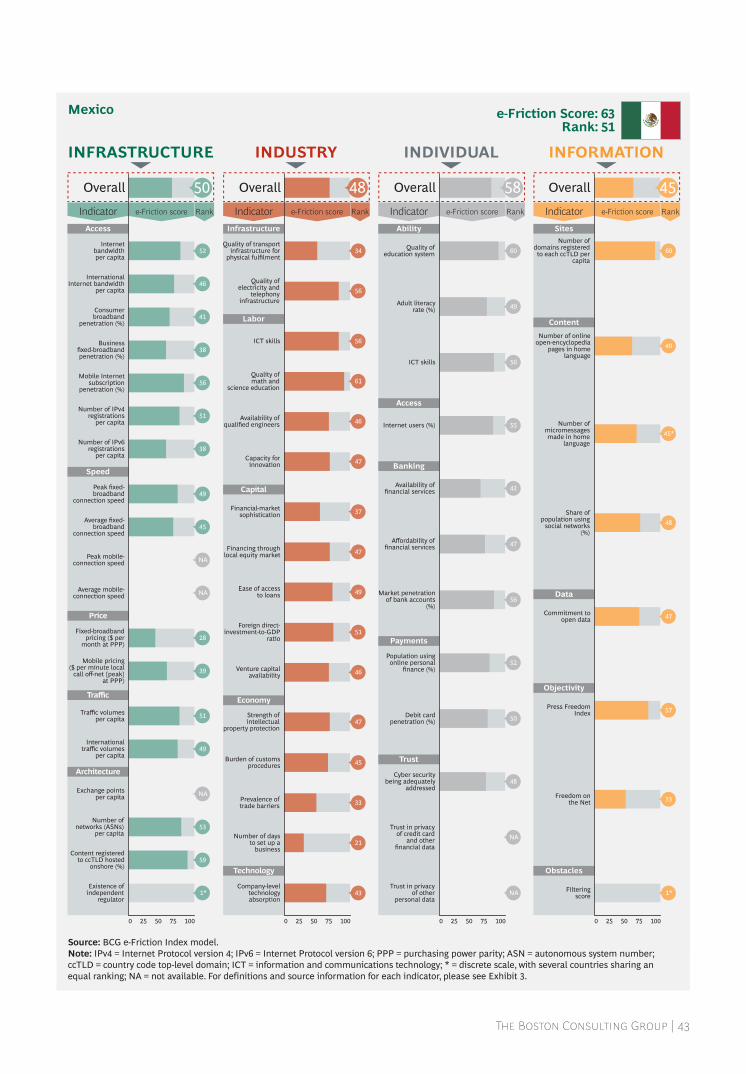
The Boston Consulting Group | 43
Speed
Architecture
Traffic
Price
0 50 7525 100
Infrastructure
Labor
Technology
Economy
Capital
0 50 7525 100
Ability
Access
Trust
Payments
Banking
0 50 7525 100
Sites
Content
Obstacles
Objectivity
Data
0 50 7525 100
Access
Internetbandwidthper capita
Quality of transportinfrastructure for
physical fulfilmentQuality of
education system
Number ofdomains registeredto each ccTLD per
capita
Number of onlineopen-encyclopedia
pages in homelanguage
Number ofmicromessagesmade in home
language
Share ofpopulation using
social networks(%)
Commitment toopen data
Press FreedomIndex
Freedom onthe Net
Filteringscore
Adult literacyrate (%)
ICT skills
Internet users (%)
Availability offinancial services
Affordability offinancial services
Market penetrationof bank accounts
(%)
Population usingonline personal
finance (%)
Debit cardpenetration (%)
Cyber securitybeing adequately
addressed
Trust in privacyof credit card
and otherfinancial data
Trust in privacyof other
personal data
Quality ofelectricity and
telephonyinfrastructure
ICT skills
Quality ofmath and
science education
Availability ofqualified engineers
Capacity forinnovation
Financial-marketsophistication
Financing throughlocal equity market
Ease of accessto loans
Foreign direct-investment-to-GDP
ratio
Venture capitalavailability
Strength ofintellectual
property protection
Burden of customsprocedures
Prevalence oftrade barriers
Number of daysto set up a
business
Company-leveltechnologyabsorption
InternationalInternet bandwidth
per capita
Consumerbroadband
penetration (%)
Businessfixed-broadbandpenetration (%)
Mobile Internetsubscription
penetration (%)
Number of IPv4registrations
per capita
Number of IPv6registrations
per capita
Peak fixed-broadband
connection speed
Average fixed-broadband
connection speed
Peak mobile-connection speed
Average mobile-connection speed
Fixed-broadbandpricing ($ per
month at PPP)
Mobile pricing($ per minute local
call off-net [peak]at PPP)
Traffic volumesper capita
Internationaltraffic volumes
per capita
Exchange pointsper capita
Number ofnetworks (ASNs)
per capita
Content registeredto ccTLD hosted
onshore (%)
Existence ofindependent
regulator
e-Friction Score: 63Rank: 51
INFRASTRUCTURE
Indicator Ranke-Friction score e-Friction score
INDUSTRY
Indicator Rank e-Friction score Rank e-Friction score Rank
INDIVIDUAL
Indicator
INFORMATION
Indicator
Overall Overall Overall Overall
60
40
45*
48
47
57
33
1*
52
46
41
38
56
51
38
49
45
NA
NA
28
39
51
49
NA
53
59
1*
34
56
56
61
46
47
37
47
49
46
47
45
33
21
43
51
60
49
56
55
42
47
56
52
50
48
NA
NA
50 48 58 45
Mexico
Source: BCG e-Friction index model.Note: iPv4 = internet Protocol version 4; iPv6 = internet Protocol version 6; PPP = purchasing power parity; aSn = autonomous system number; ccTlD = country code top-level domain; iCT = information and communications technology; * = discrete scale, with several countries sharing an equal ranking; na = not available. For definitions and source information for each indicator, please see exhibit 3.
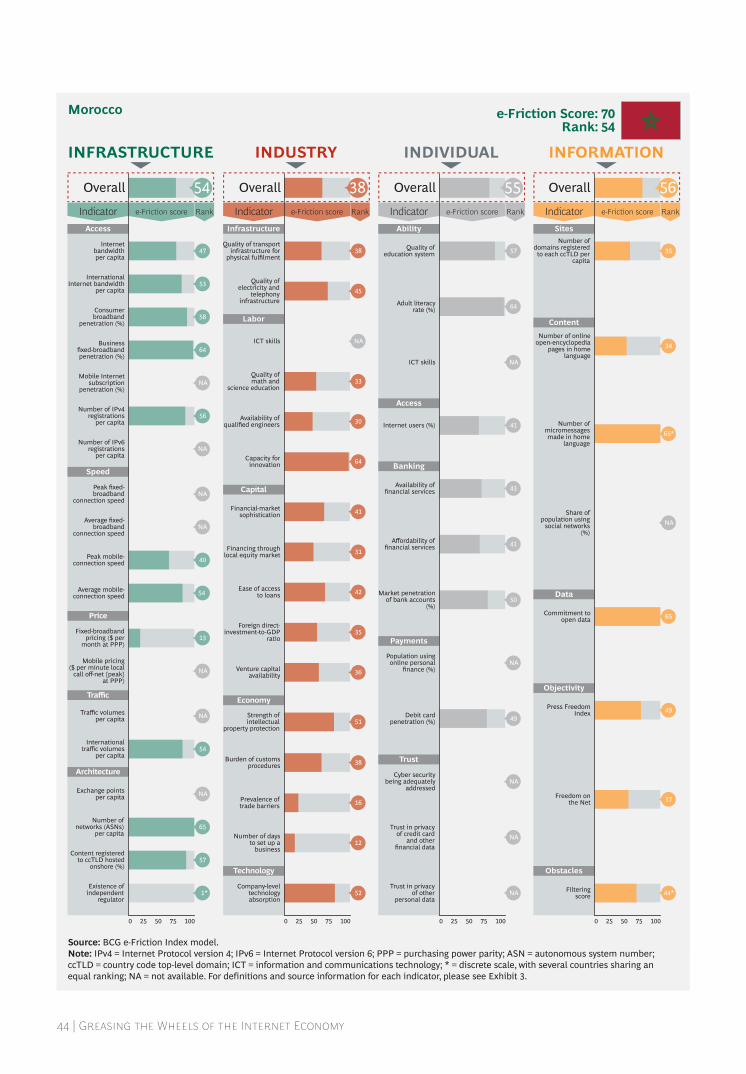
44 | Greasing the Wheels of the Internet Economy
Speed
Architecture
Traffic
Price
0 50 7525 100
Infrastructure
Labor
Technology
Economy
Capital
0 50 7525 100
Ability
Access
Trust
Payments
Banking
0 50 7525 100
Sites
Content
Obstacles
Objectivity
Data
0 50 7525 100
Access
Internetbandwidthper capita
Quality of transportinfrastructure for
physical fulfilmentQuality of
education system
Number ofdomains registeredto each ccTLD per
capita
Number of onlineopen-encyclopedia
pages in homelanguage
Number ofmicromessagesmade in home
language
Share ofpopulation using
social networks(%)
Commitment toopen data
Press FreedomIndex
Freedom onthe Net
Filteringscore
Adult literacyrate (%)
ICT skills
Internet users (%)
Availability offinancial services
Affordability offinancial services
Market penetrationof bank accounts
(%)
Population usingonline personal
finance (%)
Debit cardpenetration (%)
Cyber securitybeing adequately
addressed
Trust in privacyof credit card
and otherfinancial data
Trust in privacyof other
personal data
Quality ofelectricity and
telephonyinfrastructure
ICT skills
Quality ofmath and
science education
Availability ofqualified engineers
Capacity forinnovation
Financial-marketsophistication
Financing throughlocal equity market
Ease of accessto loans
Foreign direct-investment-to-GDP
ratio
Venture capitalavailability
Strength ofintellectual
property protection
Burden of customsprocedures
Prevalence oftrade barriers
Number of daysto set up a
business
Company-leveltechnologyabsorption
InternationalInternet bandwidth
per capita
Consumerbroadband
penetration (%)
Businessfixed-broadbandpenetration (%)
Mobile Internetsubscription
penetration (%)
Number of IPv4registrations
per capita
Number of IPv6registrations
per capita
Peak fixed-broadband
connection speed
Average fixed-broadband
connection speed
Peak mobile-connection speed
Average mobile-connection speed
Fixed-broadbandpricing ($ per
month at PPP)
Mobile pricing($ per minute local
call off-net [peak]at PPP)
Traffic volumesper capita
Internationaltraffic volumes
per capita
Exchange pointsper capita
Number ofnetworks (ASNs)
per capita
Content registeredto ccTLD hosted
onshore (%)
Existence ofindependent
regulator
e-Friction Score: 70Rank: 54
INFRASTRUCTURE
Indicator Ranke-Friction score e-Friction score
INDUSTRY
Indicator Rank e-Friction score Rank e-Friction score Rank
INDIVIDUAL
Indicator
INFORMATION
Indicator
Overall Overall Overall Overall
35
34
65*
NA
65
49
37
53
NA
64
58
56
NA
NA
NA
40
54
13
NA
NA
54
NA
65
57
38
45
NA
33
30
64
41
31
42
36
51
38
16
12
52
35
57
64
NA
41
43
41
50
NA
49
NA
NA
NA 44*1*
47
54 38 55 56
Morocco
Source: BCG e-Friction index model.Note: iPv4 = internet Protocol version 4; iPv6 = internet Protocol version 6; PPP = purchasing power parity; aSn = autonomous system number; ccTlD = country code top-level domain; iCT = information and communications technology; * = discrete scale, with several countries sharing an equal ranking; na = not available. For definitions and source information for each indicator, please see exhibit 3.

The Boston Consulting Group | 45
Speed
Architecture
Traffic
Price
0 50 7525 100
Infrastructure
Labor
Technology
Economy
Capital
0 50 7525 100
Ability
Access
Trust
Payments
Banking
0 50 7525 100
Sites
Content
Obstacles
Objectivity
Data
0 50 7525 100
Access
Internetbandwidthper capita
Quality of transportinfrastructure for
physical fulfilmentQuality of
education system
Number ofdomains registeredto each ccTLD per
capita
Number of onlineopen-encyclopedia
pages in homelanguage
Number ofmicromessagesmade in home
language
Share ofpopulation using
social networks(%)
Commitment toopen data
Press FreedomIndex
Freedom onthe Net
Filteringscore
Adult literacyrate (%)
ICT skills
Internet users (%)
Availability offinancial services
Affordability offinancial services
Market penetrationof bank accounts
(%)
Population usingonline personal
finance (%)
Debit cardpenetration (%)
Cyber securitybeing adequately
addressed
Trust in privacyof credit card
and otherfinancial data
Trust in privacyof other
personal data
Quality ofelectricity and
telephonyinfrastructure
ICT skills
Quality ofmath and
science education
Availability ofqualified engineers
Capacity forinnovation
Financial-marketsophistication
Financing throughlocal equity market
Ease of accessto loans
Foreign direct-investment-to-GDP
ratio
Venture capitalavailability
Strength ofintellectual
property protection
Burden of customsprocedures
Prevalence oftrade barriers
Number of daysto set up a
business
Company-leveltechnologyabsorption
InternationalInternet bandwidth
per capita
Consumerbroadband
penetration (%)
Businessfixed-broadbandpenetration (%)
Mobile Internetsubscription
penetration (%)
Number of IPv4registrations
per capita
Number of IPv6registrations
per capita
Peak fixed-broadband
connection speed
Average fixed-broadband
connection speed
Peak mobile-connection speed
Average mobile-connection speed
Fixed-broadbandpricing ($ per
month at PPP)
Mobile pricing($ per minute local
call off-net [peak]at PPP)
Traffic volumesper capita
Internationaltraffic volumes
per capita
Exchange pointsper capita
Number ofnetworks (ASNs)
per capita
Content registeredto ccTLD hosted
onshore (%)
Existence ofindependent
regulator
e-Friction Score: 25Rank: 9
INFRASTRUCTURE
Indicator Ranke-Friction score e-Friction score
INDUSTRY
Indicator Rank e-Friction score Rank e-Friction score Rank
INDIVIDUAL
Indicator
INFORMATION
Indicator
Overall Overall Overall Overall
1
5
19
30
4
19
12
6
63
49
34
47
NA
1
16
17
11
1*
9 7
11
10
8
32
9
8
25
32
NA
18
7
6
8
12
20
9
8
10
4
11
19
6
3
1
24
NA
NA
25
29
60*
3
6
2
NA
NA
12 6 4 16
Netherlands
Source: BCG e-Friction index model.Note: iPv4 = internet Protocol version 4; iPv6 = internet Protocol version 6; PPP = purchasing power parity; aSn = autonomous system number; ccTlD = country code top-level domain; iCT = information and communications technology; * = discrete scale, with several countries sharing an equal ranking; na = not available. For definitions and source information for each indicator, please see exhibit 3.

46 | Greasing the Wheels of the Internet Economy
Speed
Architecture
Traffic
Price
0 50 7525 100
Infrastructure
Labor
Technology
Economy
Capital
0 50 7525 100
Ability
Access
Trust
Payments
Banking
0 50 7525 100
Sites
Content
Obstacles
Objectivity
Data
0 50 7525 100
Access
Internetbandwidthper capita
Quality of transportinfrastructure for
physical fulfilmentQuality of
education system
Number ofdomains registeredto each ccTLD per
capita
Number of onlineopen-encyclopedia
pages in homelanguage
Number ofmicromessagesmade in home
language
Share ofpopulation using
social networks(%)
Commitment toopen data
Press FreedomIndex
Freedom onthe Net
Filteringscore
Adult literacyrate (%)
ICT skills
Internet users (%)
Availability offinancial services
Affordability offinancial services
Market penetrationof bank accounts
(%)
Population usingonline personal
finance (%)
Debit cardpenetration (%)
Cyber securitybeing adequately
addressed
Trust in privacyof credit card
and otherfinancial data
Trust in privacyof other
personal data
Quality ofelectricity and
telephonyinfrastructure
ICT skills
Quality ofmath and
science education
Availability ofqualified engineers
Capacity forinnovation
Financial-marketsophistication
Financing throughlocal equity market
Ease of accessto loans
Foreign direct-investment-to-GDP
ratio
Venture capitalavailability
Strength ofintellectual
property protection
Burden of customsprocedures
Prevalence oftrade barriers
Number of daysto set up a
business
Company-leveltechnologyabsorption
InternationalInternet bandwidth
per capita
Consumerbroadband
penetration (%)
Businessfixed-broadbandpenetration (%)
Mobile Internetsubscription
penetration (%)
Number of IPv4registrations
per capita
Number of IPv6registrations
per capita
Peak fixed-broadband
connection speed
Average fixed-broadband
connection speed
Peak mobile-connection speed
Average mobile-connection speed
Fixed-broadbandpricing ($ per
month at PPP)
Mobile pricing($ per minute local
call off-net [peak]at PPP)
Traffic volumesper capita
Internationaltraffic volumes
per capita
Exchange pointsper capita
Number ofnetworks (ASNs)
per capita
Content registeredto ccTLD hosted
onshore (%)
Existence ofindependent
regulator
e-Friction Score: 33Rank: 17
INFRASTRUCTURE
Indicator Ranke-Friction score e-Friction score
INDUSTRY
Indicator Rank e-Friction score Rank e-Friction score Rank
INDIVIDUAL
Indicator
INFORMATION
Indicator
Overall Overall Overall Overall
19
21
13*
6
13
5
NA
NA
31
37
9
26
24
18
11
46
41
44
39
51
57
22
NA
5
6
32
1*
32
24
50
7
41
19
NA
8
8
15
3
4
2
40
17
NA
8
8
50
7
17
12
NA
11
NA
35
NA
NA
29 16 16 8
New Zealand
Source: BCG e-Friction index model.Note: iPv4 = internet Protocol version 4; iPv6 = internet Protocol version 6; PPP = purchasing power parity; aSn = autonomous system number; ccTlD = country code top-level domain; iCT = information and communications technology; * = discrete scale, with several countries sharing an equal ranking; na = not available. For definitions and source information for each indicator, please see exhibit 3.
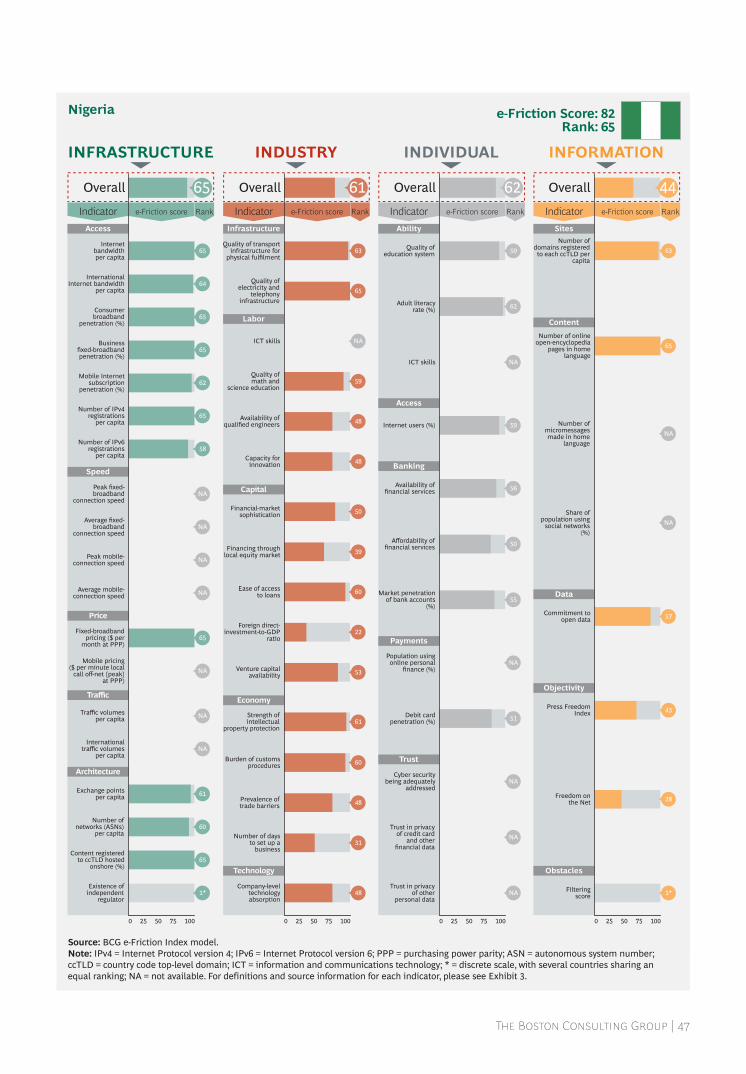
The Boston Consulting Group | 47
Speed
Architecture
Traffic
Price
0 50 7525 100
Infrastructure
Labor
Technology
Economy
Capital
0 50 7525 100
Ability
Access
Trust
Payments
Banking
0 50 7525 100
Sites
Content
Obstacles
Objectivity
Data
0 50 7525 100
Access
Internetbandwidthper capita
Quality of transportinfrastructure for
physical fulfilmentQuality of
education system
Number ofdomains registeredto each ccTLD per
capita
Number of onlineopen-encyclopedia
pages in homelanguage
Number ofmicromessagesmade in home
language
Share ofpopulation using
social networks(%)
Commitment toopen data
Press FreedomIndex
Freedom onthe Net
Filteringscore
Adult literacyrate (%)
ICT skills
Internet users (%)
Availability offinancial services
Affordability offinancial services
Market penetrationof bank accounts
(%)
Population usingonline personal
finance (%)
Debit cardpenetration (%)
Cyber securitybeing adequately
addressed
Trust in privacyof credit card
and otherfinancial data
Trust in privacyof other
personal data
Quality ofelectricity and
telephonyinfrastructure
ICT skills
Quality ofmath and
science education
Availability ofqualified engineers
Capacity forinnovation
Financial-marketsophistication
Financing throughlocal equity market
Ease of accessto loans
Foreign direct-investment-to-GDP
ratio
Venture capitalavailability
Strength ofintellectual
property protection
Burden of customsprocedures
Prevalence oftrade barriers
Number of daysto set up a
business
Company-leveltechnologyabsorption
InternationalInternet bandwidth
per capita
Consumerbroadband
penetration (%)
Businessfixed-broadbandpenetration (%)
Mobile Internetsubscription
penetration (%)
Number of IPv4registrations
per capita
Number of IPv6registrations
per capita
Peak fixed-broadband
connection speed
Average fixed-broadband
connection speed
Peak mobile-connection speed
Average mobile-connection speed
Fixed-broadbandpricing ($ per
month at PPP)
Mobile pricing($ per minute local
call off-net [peak]at PPP)
Traffic volumesper capita
Internationaltraffic volumes
per capita
Exchange pointsper capita
Number ofnetworks (ASNs)
per capita
Content registeredto ccTLD hosted
onshore (%)
Existence ofindependent
regulator
e-Friction Score: 82Rank: 65
INFRASTRUCTURE
Indicator Ranke-Friction score e-Friction score
INDUSTRY
Indicator Rank e-Friction score Rank e-Friction score Rank
INDIVIDUAL
Indicator
INFORMATION
Indicator
Overall Overall Overall Overall
65
NA
NA
57
43
28
1*
65
64
65
65
62
65
58
NA
NA
NA
NA
65
NA
NA
NA
61
60
65
1*
63
65
NA
59
48
48
50
39
60
53
61
60
48
31
48
22
59
62
NA
59
56
50
55
NA
51
NA
NA
NA
65 61 62 44
63
Nigeria
Source: BCG e-Friction index model.Note: iPv4 = internet Protocol version 4; iPv6 = internet Protocol version 6; PPP = purchasing power parity; aSn = autonomous system number; ccTlD = country code top-level domain; iCT = information and communications technology; * = discrete scale, with several countries sharing an equal ranking; na = not available. For definitions and source information for each indicator, please see exhibit 3.

48 | Greasing the Wheels of the Internet Economy
Speed
Architecture
Traffic
Price
0 50 7525 100
Infrastructure
Labor
Technology
Economy
Capital
0 50 7525 100
Ability
Access
Trust
Payments
Banking
0 50 7525 100
Sites
Content
Obstacles
Objectivity
Data
0 50 7525 100
Access
Internetbandwidthper capita
Quality of transportinfrastructure for
physical fulfilmentQuality of
education system
Number ofdomains registeredto each ccTLD per
capita
Number of onlineopen-encyclopedia
pages in homelanguage
Number ofmicromessagesmade in home
language
Share ofpopulation using
social networks(%)
Commitment toopen data
Press FreedomIndex
Freedom onthe Net
Filteringscore
Adult literacyrate (%)
ICT skills
Internet users (%)
Availability offinancial services
Affordability offinancial services
Market penetrationof bank accounts
(%)
Population usingonline personal
finance (%)
Debit cardpenetration (%)
Cyber securitybeing adequately
addressed
Trust in privacyof credit card
and otherfinancial data
Trust in privacyof other
personal data
Quality ofelectricity and
telephonyinfrastructure
ICT skills
Quality ofmath and
science education
Availability ofqualified engineers
Capacity forinnovation
Financial-marketsophistication
Financing throughlocal equity market
Ease of accessto loans
Foreign direct-investment-to-GDP
ratio
Venture capitalavailability
Strength ofintellectual
property protection
Burden of customsprocedures
Prevalence oftrade barriers
Number of daysto set up a
business
Company-leveltechnologyabsorption
InternationalInternet bandwidth
per capita
Consumerbroadband
penetration (%)
Businessfixed-broadbandpenetration (%)
Mobile Internetsubscription
penetration (%)
Number of IPv4registrations
per capita
Number of IPv6registrations
per capita
Peak fixed-broadband
connection speed
Average fixed-broadband
connection speed
Peak mobile-connection speed
Average mobile-connection speed
Fixed-broadbandpricing ($ per
month at PPP)
Mobile pricing($ per minute local
call off-net [peak]at PPP)
Traffic volumesper capita
Internationaltraffic volumes
per capita
Exchange pointsper capita
Number ofnetworks (ASNs)
per capita
Content registeredto ccTLD hosted
onshore (%)
Existence ofindependent
regulator
e-Friction Score: 23Rank: 8
INFRASTRUCTURE
Indicator Ranke-Friction score e-Friction score
INDUSTRY
Indicator Rank e-Friction score Rank e-Friction score Rank
INDIVIDUAL
Indicator
INFORMATION
Indicator
Overall Overall Overall Overall
6
17
NA
NA
NA
28
2
8
37
22
26
17
44
7
NA
19
3
16
22
1*
36 14 2
50
8
5
3
NA
1*
8
9
2
10
7
NA
9
NA
21
NA
NA
27
9
29
33
11
17
11
10
NA
4
13
15
28
12
8
8 11 6 11
Norway
Source: BCG e-Friction index model.Note: iPv4 = internet Protocol version 4; iPv6 = internet Protocol version 6; PPP = purchasing power parity; aSn = autonomous system number; ccTlD = country code top-level domain; iCT = information and communications technology; * = discrete scale, with several countries sharing an equal ranking; na = not available. For definitions and source information for each indicator, please see exhibit 3.
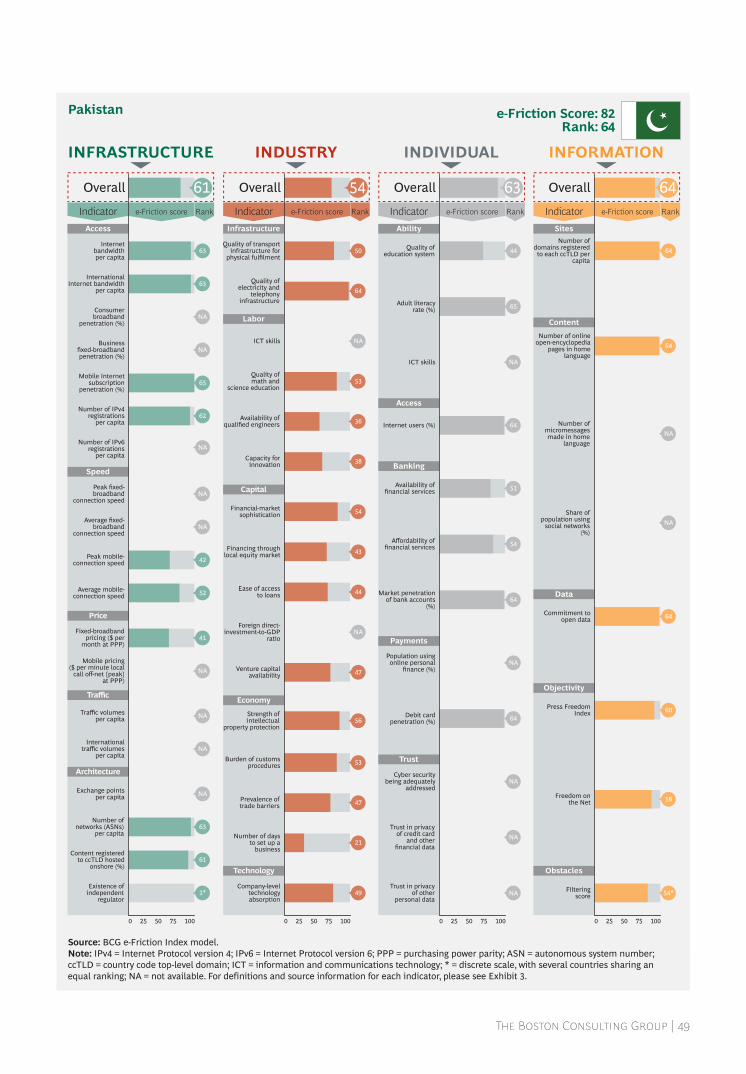
The Boston Consulting Group | 49
Speed
Architecture
Traffic
Price
0 50 7525 100
Infrastructure
Labor
Technology
Economy
Capital
0 50 7525 100
Ability
Access
Trust
Payments
Banking
0 50 7525 100
Sites
Content
Obstacles
Objectivity
Data
0 50 7525 100
Access
Internetbandwidthper capita
Quality of transportinfrastructure for
physical fulfilmentQuality of
education system
Number ofdomains registeredto each ccTLD per
capita
Number of onlineopen-encyclopedia
pages in homelanguage
Number ofmicromessagesmade in home
language
Share ofpopulation using
social networks(%)
Commitment toopen data
Press FreedomIndex
Freedom onthe Net
Filteringscore
Adult literacyrate (%)
ICT skills
Internet users (%)
Availability offinancial services
Affordability offinancial services
Market penetrationof bank accounts
(%)
Population usingonline personal
finance (%)
Debit cardpenetration (%)
Cyber securitybeing adequately
addressed
Trust in privacyof credit card
and otherfinancial data
Trust in privacyof other
personal data
Quality ofelectricity and
telephonyinfrastructure
ICT skills
Quality ofmath and
science education
Availability ofqualified engineers
Capacity forinnovation
Financial-marketsophistication
Financing throughlocal equity market
Ease of accessto loans
Foreign direct-investment-to-GDP
ratio
Venture capitalavailability
Strength ofintellectual
property protection
Burden of customsprocedures
Prevalence oftrade barriers
Number of daysto set up a
business
Company-leveltechnologyabsorption
InternationalInternet bandwidth
per capita
Consumerbroadband
penetration (%)
Businessfixed-broadbandpenetration (%)
Mobile Internetsubscription
penetration (%)
Number of IPv4registrations
per capita
Number of IPv6registrations
per capita
Peak fixed-broadband
connection speed
Average fixed-broadband
connection speed
Peak mobile-connection speed
Average mobile-connection speed
Fixed-broadbandpricing ($ per
month at PPP)
Mobile pricing($ per minute local
call off-net [peak]at PPP)
Traffic volumesper capita
Internationaltraffic volumes
per capita
Exchange pointsper capita
Number ofnetworks (ASNs)
per capita
Content registeredto ccTLD hosted
onshore (%)
Existence ofindependent
regulator
e-Friction Score: 82Rank: 64
INFRASTRUCTURE
Indicator Ranke-Friction score e-Friction score
INDUSTRY
Indicator Rank e-Friction score Rank e-Friction score Rank
INDIVIDUAL
Indicator
INFORMATION
Indicator
Overall Overall Overall Overall
64
NA
NA
64
60
58
54*
63
63
NA
NA
65
62
NA
NA
NA
42
52
41
NA
NA
NA
NA
63
61
1*
50
64
NA
53
36
38
54
43
44
47
56
53
47
21
49
NA
44
65
NA
64
51
54
64
NA
64
NA
NA
NA
64
61 54 63 64
Pakistan
Source: BCG e-Friction index model.Note: iPv4 = internet Protocol version 4; iPv6 = internet Protocol version 6; PPP = purchasing power parity; aSn = autonomous system number; ccTlD = country code top-level domain; iCT = information and communications technology; * = discrete scale, with several countries sharing an equal ranking; na = not available. For definitions and source information for each indicator, please see exhibit 3.

50 | Greasing the Wheels of the Internet Economy
Speed
Architecture
Traffic
Price
0 50 7525 100
Infrastructure
Labor
Technology
Economy
Capital
0 50 7525 100
Ability
Access
Trust
Payments
Banking
0 50 7525 100
Sites
Content
Obstacles
Objectivity
Data
0 50 7525 100
Access
Internetbandwidthper capita
Quality of transportinfrastructure for
physical fulfilmentQuality of
education system
Number ofdomains registeredto each ccTLD per
capita
Number of onlineopen-encyclopedia
pages in homelanguage
Number ofmicromessagesmade in home
language
Share ofpopulation using
social networks(%)
Commitment toopen data
Press FreedomIndex
Freedom onthe Net
Filteringscore
Adult literacyrate (%)
ICT skills
Internet users (%)
Availability offinancial services
Affordability offinancial services
Market penetrationof bank accounts
(%)
Population usingonline personal
finance (%)
Debit cardpenetration (%)
Cyber securitybeing adequately
addressed
Trust in privacyof credit card
and otherfinancial data
Trust in privacyof other
personal data
Quality ofelectricity and
telephonyinfrastructure
ICT skills
Quality ofmath and
science education
Availability ofqualified engineers
Capacity forinnovation
Financial-marketsophistication
Financing throughlocal equity market
Ease of accessto loans
Foreign direct-investment-to-GDP
ratio
Venture capitalavailability
Strength ofintellectual
property protection
Burden of customsprocedures
Prevalence oftrade barriers
Number of daysto set up a
business
Company-leveltechnologyabsorption
InternationalInternet bandwidth
per capita
Consumerbroadband
penetration (%)
Businessfixed-broadbandpenetration (%)
Mobile Internetsubscription
penetration (%)
Number of IPv4registrations
per capita
Number of IPv6registrations
per capita
Peak fixed-broadband
connection speed
Average fixed-broadband
connection speed
Peak mobile-connection speed
Average mobile-connection speed
Fixed-broadbandpricing ($ per
month at PPP)
Mobile pricing($ per minute local
call off-net [peak]at PPP)
Traffic volumesper capita
Internationaltraffic volumes
per capita
Exchange pointsper capita
Number ofnetworks (ASNs)
per capita
Content registeredto ccTLD hosted
onshore (%)
Existence ofindependent
regulator
e-Friction Score: 48Rank: 34
INFRASTRUCTURE
Indicator Ranke-Friction score e-Friction score
INDUSTRY
Indicator Rank e-Friction score Rank e-Friction score Rank
INDIVIDUAL
Indicator
INFORMATION
Indicator
Overall Overall Overall Overall
22
NA
5
43
32
31
NA
NA
NA
NA
24
NA
28
NA
25
52
1*
42
NA
30
36
NA
57
50
39
11
20
7
11
29
30
30
12
25
5
40
43
NA
48
9
6
59
NA
58
NA
NA
NA
8
42
45*
NA
NA
40
NA
NA
28 24 36 49
Panama
Source: BCG e-Friction index model.Note: iPv4 = internet Protocol version 4; iPv6 = internet Protocol version 6; PPP = purchasing power parity; aSn = autonomous system number; ccTlD = country code top-level domain; iCT = information and communications technology; * = discrete scale, with several countries sharing an equal ranking; na = not available. For definitions and source information for each indicator, please see exhibit 3.

The Boston Consulting Group | 51
Speed
Architecture
Traffic
Price
0 50 7525 100
Infrastructure
Labor
Technology
Economy
Capital
0 50 7525 100
Ability
Access
Trust
Payments
Banking
0 50 7525 100
Sites
Content
Obstacles
Objectivity
Data
0 50 7525 100
Access
Internetbandwidthper capita
Quality of transportinfrastructure for
physical fulfilmentQuality of
education system
Number ofdomains registeredto each ccTLD per
capita
Number of onlineopen-encyclopedia
pages in homelanguage
Number ofmicromessagesmade in home
language
Share ofpopulation using
social networks(%)
Commitment toopen data
Press FreedomIndex
Freedom onthe Net
Filteringscore
Adult literacyrate (%)
ICT skills
Internet users (%)
Availability offinancial services
Affordability offinancial services
Market penetrationof bank accounts
(%)
Population usingonline personal
finance (%)
Debit cardpenetration (%)
Cyber securitybeing adequately
addressed
Trust in privacyof credit card
and otherfinancial data
Trust in privacyof other
personal data
Quality ofelectricity and
telephonyinfrastructure
ICT skills
Quality ofmath and
science education
Availability ofqualified engineers
Capacity forinnovation
Financial-marketsophistication
Financing throughlocal equity market
Ease of accessto loans
Foreign direct-investment-to-GDP
ratio
Venture capitalavailability
Strength ofintellectual
property protection
Burden of customsprocedures
Prevalence oftrade barriers
Number of daysto set up a
business
Company-leveltechnologyabsorption
InternationalInternet bandwidth
per capita
Consumerbroadband
penetration (%)
Businessfixed-broadbandpenetration (%)
Mobile Internetsubscription
penetration (%)
Number of IPv4registrations
per capita
Number of IPv6registrations
per capita
Peak fixed-broadband
connection speed
Average fixed-broadband
connection speed
Peak mobile-connection speed
Average mobile-connection speed
Fixed-broadbandpricing ($ per
month at PPP)
Mobile pricing($ per minute local
call off-net [peak]at PPP)
Traffic volumesper capita
Internationaltraffic volumes
per capita
Exchange pointsper capita
Number ofnetworks (ASNs)
per capita
Content registeredto ccTLD hosted
onshore (%)
Existence ofindependent
regulator
e-Friction Score: 75Rank: 60
INFRASTRUCTURE
Indicator Ranke-Friction score e-Friction score
INDUSTRY
Indicator Rank e-Friction score Rank e-Friction score Rank
INDIVIDUAL
Indicator
INFORMATION
Indicator
Overall Overall Overall Overall
44
45*
55
NA
37
NA
1*
55
43
52
61
NA
57
NA
53
57
NA
NA
62
61
NA
56
48
61
57
1*
58
55
61
63
64
59
44
41
22
33
60
42
43
35
50
13
63
56
61
56
35
39
62
57
55
63
NA
NA
63 53 61 41
42
Peru
Source: BCG e-Friction index model.Note: iPv4 = internet Protocol version 4; iPv6 = internet Protocol version 6; PPP = purchasing power parity; aSn = autonomous system number; ccTlD = country code top-level domain; iCT = information and communications technology; * = discrete scale, with several countries sharing an equal ranking; na = not available. For definitions and source information for each indicator, please see exhibit 3.

52 | Greasing the Wheels of the Internet Economy
Speed
Architecture
Traffic
Price
0 50 7525 100
Infrastructure
Labor
Technology
Economy
Capital
0 50 7525 100
Ability
Access
Trust
Payments
Banking
0 50 7525 100
Sites
Content
Obstacles
Objectivity
Data
0 50 7525 100
Access
Internetbandwidthper capita
Quality of transportinfrastructure for
physical fulfilmentQuality of
education system
Number ofdomains registeredto each ccTLD per
capita
Number of onlineopen-encyclopedia
pages in homelanguage
Number ofmicromessagesmade in home
language
Share ofpopulation using
social networks(%)
Commitment toopen data
Press FreedomIndex
Freedom onthe Net
Filteringscore
Adult literacyrate (%)
ICT skills
Internet users (%)
Availability offinancial services
Affordability offinancial services
Market penetrationof bank accounts
(%)
Population usingonline personal
finance (%)
Debit cardpenetration (%)
Cyber securitybeing adequately
addressed
Trust in privacyof credit card
and otherfinancial data
Trust in privacyof other
personal data
Quality ofelectricity and
telephonyinfrastructure
ICT skills
Quality ofmath and
science education
Availability ofqualified engineers
Capacity forinnovation
Financial-marketsophistication
Financing throughlocal equity market
Ease of accessto loans
Foreign direct-investment-to-GDP
ratio
Venture capitalavailability
Strength ofintellectual
property protection
Burden of customsprocedures
Prevalence oftrade barriers
Number of daysto set up a
business
Company-leveltechnologyabsorption
InternationalInternet bandwidth
per capita
Consumerbroadband
penetration (%)
Businessfixed-broadbandpenetration (%)
Mobile Internetsubscription
penetration (%)
Number of IPv4registrations
per capita
Number of IPv6registrations
per capita
Peak fixed-broadband
connection speed
Average fixed-broadband
connection speed
Peak mobile-connection speed
Average mobile-connection speed
Fixed-broadbandpricing ($ per
month at PPP)
Mobile pricing($ per minute local
call off-net [peak]at PPP)
Traffic volumesper capita
Internationaltraffic volumes
per capita
Exchange pointsper capita
Number ofnetworks (ASNs)
per capita
Content registeredto ccTLD hosted
onshore (%)
Existence ofindependent
regulator
e-Friction Score: 64Rank: 47
INFRASTRUCTURE
Indicator Ranke-Friction score e-Friction score
INDUSTRY
Indicator Rank e-Friction score Rank e-Friction score Rank
INDIVIDUAL
Indicator
INFORMATION
Indicator
Overall Overall Overall Overall
58
22
13*
62
NA
54
19
1*
54
55
57
24
42
61
NA
NA
NA
NA
NA
58
24
NA
59
53
52
56
11*
55
58
22
50
51
37
40
22
26
29
48
61
35
21
33
NA
26
40
22
57
31
25
57
62
56
54
NA
NA
53 42 45 25
Philippines
Source: BCG e-Friction index model.Note: iPv4 = internet Protocol version 4; iPv6 = internet Protocol version 6; PPP = purchasing power parity; aSn = autonomous system number; ccTlD = country code top-level domain; iCT = information and communications technology; * = discrete scale, with several countries sharing an equal ranking; na = not available. For definitions and source information for each indicator, please see exhibit 3.

The Boston Consulting Group | 53
Speed
Architecture
Traffic
Price
0 50 7525 100
Infrastructure
Labor
Technology
Economy
Capital
0 50 7525 100
Ability
Access
Trust
Payments
Banking
0 50 7525 100
Sites
Content
Obstacles
Objectivity
Data
0 50 7525 100
Access
Internetbandwidthper capita
Quality of transportinfrastructure for
physical fulfilmentQuality of
education system
Number ofdomains registeredto each ccTLD per
capita
Number of onlineopen-encyclopedia
pages in homelanguage
Number ofmicromessagesmade in home
language
Share ofpopulation using
social networks(%)
Commitment toopen data (0–1)
Press FreedomIndex (0–100)
Freedom onthe Net (0–100)
Filteringscore (1–15)
Adult literacyrate (%)
ICT skills
Internet users (%)
Availability offinancial services
Affordability offinancial services
Market penetrationof bank accounts
(%)
Population usingonline personal
finance (%)
Debit cardpenetration (%)
Cyber securitybeing adequately
addressed
Trust in privacyof credit card
and otherfinancial data
Trust in privacyof other
personal data
Quality ofelectricity and
telephonyinfrastructure
ICT skills
Quality ofmath and
science education
Availability ofqualified engineers
Capacity forinnovation
Financial-marketsophistication
Financing throughlocal equity market
Ease of accessto loans
Foreign direct-investment-to-GDP
ratio
Venture capitalavailability
Strength ofintellectual
property protection
Burden of customsprocedures
Prevalence oftrade barriers
Number of daysto set up a
business
Company-leveltechnologyabsorption
InternationalInternet bandwidth
per capita
Consumerbroadband
penetration (%)
Businessfixed-broadbandpenetration (%)
Mobile Internetsubscription
penetration (%)
Number of IPv4registrations
per capita
Number of IPv6registrations
per capita
Peak fixed-broadband
connection speed
Average fixed-broadband
connection speed
Peak mobile-connection speed
Average mobile-connection speed
Fixed-broadbandpricing ($ per
month at PPP)
Mobile pricing($ per minute local
call off-net [peak]at PPP)
Traffic volumesper capita
Internationaltraffic volumes
per capita
Exchange pointsper capita
Number ofnetworks (ASNs)
per capita
Content registeredto ccTLD hosted
onshore (%)
Existence ofindependent
regulator
e-Friction Score: 45Rank: 29
INFRASTRUCTURE
Indicator Ranke-Friction score e-Friction score
INDUSTRY
Indicator Rank e-Friction score Rank e-Friction score Rank
INDIVIDUAL
Indicator
INFORMATION
Indicator
Overall Overall Overall Overall
26
28
37
50
36
31
43
29
32
14
28
37
26
40
32
29
18
25
1* 60
35
45
40
44
54
26
50
45
43
42
44
40
7
42
56 47 38
3
13*
31
40
16
NA
NANA
NA
16
32
33
30
33
38
33
7
6
32 46 24 18
Poland
Source: BCG e-Friction index model.Note: iPv4 = internet Protocol version 4; iPv6 = internet Protocol version 6; PPP = purchasing power parity; aSn = autonomous system number; ccTlD = country code top-level domain; iCT = information and communications technology; * = discrete scale, with several countries sharing an equal ranking; na = not available. For definitions and source information for each indicator, please see exhibit 3.

54 | Greasing the Wheels of the Internet Economy
Speed
Architecture
Traffic
Price
0 50 7525 100
Infrastructure
Labor
Technology
Economy
Capital
0 50 7525 100
Ability
Access
Trust
Payments
Banking
0 50 7525 100
Sites
Content
Obstacles
Objectivity
Data
0 50 7525 100
Access
Internetbandwidthper capita
Quality of transportinfrastructure for
physical fulfilmentQuality of
education system
Number ofdomains registeredto each ccTLD per
capita
Number of onlineopen-encyclopedia
pages in homelanguage
Number ofmicromessagesmade in home
language
Share ofpopulation using
social networks(%)
Commitment toopen data
Press FreedomIndex
Freedom onthe Net
Filteringscore
Adult literacyrate (%)
ICT skills
Internet users (%)
Availability offinancial services
Affordability offinancial services
Market penetrationof bank accounts
(%)
Population usingonline personal
finance (%)
Debit cardpenetration (%)
Cyber securitybeing adequately
addressed
Trust in privacyof credit card
and otherfinancial data
Trust in privacyof other
personal data
Quality ofelectricity and
telephonyinfrastructure
ICT skills
Quality ofmath and
science education
Availability ofqualified engineers
Capacity forinnovation
Financial-marketsophistication
Financing throughlocal equity market
Ease of accessto loans
Foreign direct-investment-to-GDP
ratio
Venture capitalavailability
Strength ofintellectual
property protection
Burden of customsprocedures
Prevalence oftrade barriers
Number of daysto set up a
business
Company-leveltechnologyabsorption
InternationalInternet bandwidth
per capita
Consumerbroadband
penetration (%)
Businessfixed-broadbandpenetration (%)
Mobile Internetsubscription
penetration (%)
Number of IPv4registrations
per capita
Number of IPv6registrations
per capita
Peak fixed-broadband
connection speed
Average fixed-broadband
connection speed
Peak mobile-connection speed
Average mobile-connection speed
Fixed-broadbandpricing ($ per
month at PPP)
Mobile pricing($ per minute local
call off-net [peak]at PPP)
Traffic volumesper capita
Internationaltraffic volumes
per capita
Exchange pointsper capita
Number ofnetworks (ASNs)
per capita
Content registeredto ccTLD hosted
onshore (%)
Existence ofindependent
regulator
e-Friction Score: 45Rank: 30
INFRASTRUCTURE
Indicator Ranke-Friction score e-Friction score
INDUSTRY
Indicator Rank e-Friction score Rank e-Friction score Rank
INDIVIDUAL
Indicator
INFORMATION
Indicator
Overall Overall Overall Overall
NA
31
46
39
44
1* 26
1
7
22
31
56
NA
57
59
27
34
14
41
15
14
18 34
41
15
34
34
45
23
38
18
37
NA
NA NA
NA
18
28
33
41*
46
18
31
43
NA
NA
36
20
NA
30
10
40
22
27
12
28 30 3431
Portugal
Source: BCG e-Friction index model.Note: iPv4 = internet Protocol version 4; iPv6 = internet Protocol version 6; PPP = purchasing power parity; aSn = autonomous system number; ccTlD = country code top-level domain; iCT = information and communications technology; * = discrete scale, with several countries sharing an equal ranking; na = not available. For definitions and source information for each indicator, please see exhibit 3.

The Boston Consulting Group | 55
Speed
Architecture
Traffic
Price
0 50 7525 100
Infrastructure
Labor
Technology
Economy
Capital
0 50 7525 100
Ability
Access
Trust
Payments
Banking
0 50 7525 100
Sites
Content
Obstacles
Objectivity
Data
0 50 7525 100
Access
Internetbandwidthper capita
Quality of transportinfrastructure for
physical fulfilmentQuality of
education system
Number ofdomains registeredto each ccTLD per
capita
Number of onlineopen-encyclopedia
pages in homelanguage
Number ofmicromessagesmade in home
language
Share ofpopulation using
social networks(%)
Commitment toopen data
Press FreedomIndex
Freedom onthe Net
Filteringscore
Adult literacyrate (%)
ICT skills
Internet users (%)
Availability offinancial services
Affordability offinancial services
Market penetrationof bank accounts
(%)
Population usingonline personal
finance (%)
Debit cardpenetration (%)
Cyber securitybeing adequately
addressed
Trust in privacyof credit card
and otherfinancial data
Trust in privacyof other
personal data
Quality ofelectricity and
telephonyinfrastructure
ICT skills
Quality ofmath and
science education
Availability ofqualified engineers
Capacity forinnovation
Financial-marketsophistication
Financing throughlocal equity market
Ease of accessto loans
Foreign direct-investment-to-GDP
ratio
Venture capitalavailability
Strength ofintellectual
property protection
Burden of customsprocedures
Prevalence oftrade barriers
Number of daysto set up a
business
Company-leveltechnologyabsorption
InternationalInternet bandwidth
per capita
Consumerbroadband
penetration (%)
Businessfixed-broadbandpenetration (%)
Mobile Internetsubscription
penetration (%)
Number of IPv4registrations
per capita
Number of IPv6registrations
per capita
Peak fixed-broadband
connection speed
Average fixed-broadband
connection speed
Peak mobile-connection speed
Average mobile-connection speed
Fixed-broadbandpricing ($ per
month at PPP)
Mobile pricing($ per minute local
call off-net [peak]at PPP)
Traffic volumesper capita
Internationaltraffic volumes
per capita
Exchange pointsper capita
Number ofnetworks (ASNs)
per capita
Content registeredto ccTLD hosted
onshore (%)
Existence ofindependent
regulator
e-Friction Score: 14Rank: 23
INFRASTRUCTURE
Indicator Ranke-Friction score e-Friction score
INDUSTRY
Indicator Rank e-Friction score Rank e-Friction score Rank
INDIVIDUAL
Indicator
INFORMATION
Indicator
Overall Overall Overall Overall
33
35
NA
NA
NA
36
27
NA
NA
3
39
63
19
NA
NA
NA
48
48
17*
19
32
34
5
2
16
NA
4
1
2
4
8
3
3
10
NA
4
37
34
8
13
2
NA
NA
NA
13
NA
NA
12
14
6*
NA
NA
39
NA
57*
39 5 11 28
Qatar
Source: BCG e-Friction index model.Note: iPv4 = internet Protocol version 4; iPv6 = internet Protocol version 6; PPP = purchasing power parity; aSn = autonomous system number; ccTlD = country code top-level domain; iCT = information and communications technology; * = discrete scale, with several countries sharing an equal ranking; na = not available. For definitions and source information for each indicator, please see exhibit 3.
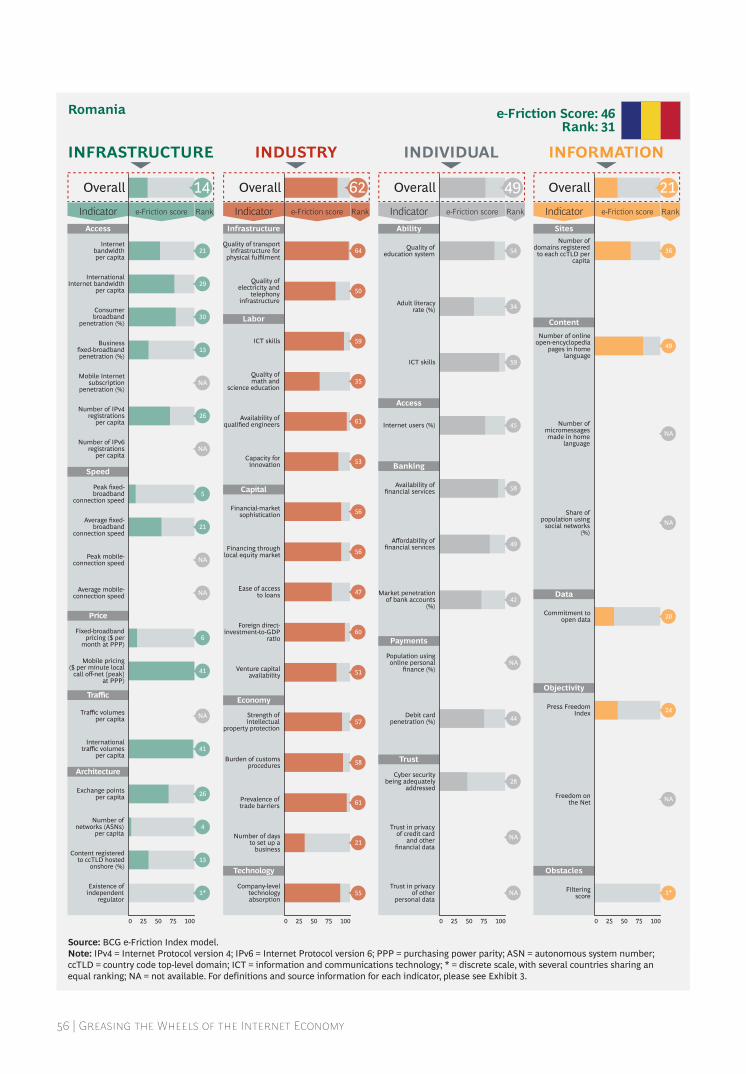
56 | Greasing the Wheels of the Internet Economy
Speed
Architecture
Traffic
Price
0 50 7525 100
Infrastructure
Labor
Technology
Economy
Capital
0 50 7525 100
Ability
Access
Trust
Payments
Banking
0 50 7525 100
Sites
Content
Obstacles
Objectivity
Data
0 50 7525 100
Access
Internetbandwidthper capita
Quality of transportinfrastructure for
physical fulfilmentQuality of
education system
Number ofdomains registeredto each ccTLD per
capita
Number of onlineopen-encyclopedia
pages in homelanguage
Number ofmicromessagesmade in home
language
Share ofpopulation using
social networks(%)
Commitment toopen data
Press FreedomIndex
Freedom onthe Net
Filteringscore
Adult literacyrate (%)
ICT skills
Internet users (%)
Availability offinancial services
Affordability offinancial services
Market penetrationof bank accounts
(%)
Population usingonline personal
finance (%)
Debit cardpenetration (%)
Cyber securitybeing adequately
addressed
Trust in privacyof credit card
and otherfinancial data
Trust in privacyof other
personal data
Quality ofelectricity and
telephonyinfrastructure
ICT skills
Quality ofmath and
science education
Availability ofqualified engineers
Capacity forinnovation
Financial-marketsophistication
Financing throughlocal equity market
Ease of accessto loans
Foreign direct-investment-to-GDP
ratio
Venture capitalavailability
Strength ofintellectual
property protection
Burden of customsprocedures
Prevalence oftrade barriers
Number of daysto set up a
business
Company-leveltechnologyabsorption
InternationalInternet bandwidth
per capita
Consumerbroadband
penetration (%)
Businessfixed-broadbandpenetration (%)
Mobile Internetsubscription
penetration (%)
Number of IPv4registrations
per capita
Number of IPv6registrations
per capita
Peak fixed-broadband
connection speed
Average fixed-broadband
connection speed
Peak mobile-connection speed
Average mobile-connection speed
Fixed-broadbandpricing ($ per
month at PPP)
Mobile pricing($ per minute local
call off-net [peak]at PPP)
Traffic volumesper capita
Internationaltraffic volumes
per capita
Exchange pointsper capita
Number ofnetworks (ASNs)
per capita
Content registeredto ccTLD hosted
onshore (%)
Existence ofindependent
regulator
e-Friction Score: 46Rank: 31
INFRASTRUCTURE
Indicator Ranke-Friction score e-Friction score
INDUSTRY
Indicator Rank e-Friction score Rank e-Friction score Rank
INDIVIDUAL
Indicator
INFORMATION
Indicator
Overall Overall Overall Overall
50
35
59
61
53
56
56
47
60
51
57
58
61
21
55
59
34
45
58
49
42
NA
44
28
NA
NA
54
49
NA
NA
20
24
NA
1*
3664
29
NA
NA
13
30
26
5
21
NA
NA
6
41
NA
41
26
4
13
1*
21
14 62 49 21
Romania
Source: BCG e-Friction index model.Note: iPv4 = internet Protocol version 4; iPv6 = internet Protocol version 6; PPP = purchasing power parity; aSn = autonomous system number; ccTlD = country code top-level domain; iCT = information and communications technology; * = discrete scale, with several countries sharing an equal ranking; na = not available. For definitions and source information for each indicator, please see exhibit 3.

The Boston Consulting Group | 57
Speed
Architecture
Traffic
Price
0 50 7525 100
Infrastructure
Labor
Technology
Economy
Capital
0 50 7525 100
Ability
Access
Trust
Payments
Banking
0 50 7525 100
Sites
Content
Obstacles
Objectivity
Data
0 50 7525 100
Access
Internetbandwidthper capita
Quality of transportinfrastructure for
physical fulfilmentQuality of
education system
Number ofdomains registeredto each ccTLD per
capita
Number of onlineopen-encyclopedia
pages in homelanguage
Number ofmicromessagesmade in home
language
Share ofpopulation using
social networks(%)
Commitment toopen data
Press FreedomIndex
Freedom onthe Net
Filteringscore
Adult literacyrate (%)
ICT skills
Internet users (%)
Availability offinancial services
Affordability offinancial services
Market penetrationof bank accounts
(%)
Population usingonline personal
finance (%)
Debit cardpenetration (%)
Cyber securitybeing adequately
addressed
Trust in privacyof credit card
and otherfinancial data
Trust in privacyof other
personal data
Quality ofelectricity and
telephonyinfrastructure
ICT skills
Quality ofmath and
science education
Availability ofqualified engineers
Capacity forinnovation
Financial-marketsophistication
Financing throughlocal equity market
Ease of accessto loans
Foreign direct-investment-to-GDP
ratio
Venture capitalavailability
Strength ofintellectual
property protection
Burden of customsprocedures
Prevalence oftrade barriers
Number of daysto set up a
business
Company-leveltechnologyabsorption
InternationalInternet bandwidth
per capita
Consumerbroadband
penetration (%)
Businessfixed-broadbandpenetration (%)
Mobile Internetsubscription
penetration (%)
Number of IPv4registrations
per capita
Number of IPv6registrations
per capita
Peak fixed-broadband
connection speed
Average fixed-broadband
connection speed
Peak mobile-connection speed
Average mobile-connection speed
Fixed-broadbandpricing ($ per
month at PPP)
Mobile pricing($ per minute local
call off-net [peak]at PPP)
Traffic volumesper capita
Internationaltraffic volumes
per capita
Exchange pointsper capita
Number ofnetworks (ASNs)
per capita
Content registeredto ccTLD hosted
onshore (%)
Existence ofindependent
regulator
e-Friction Score: 57Rank: 43
INFRASTRUCTURE
Indicator Ranke-Friction score e-Friction score
INDUSTRY
Indicator Rank e-Friction score Rank e-Friction score Rank
INDIVIDUAL
Indicator
INFORMATION
Indicator
Overall Overall Overall Overall
57
31
NA
NA
38
55
49
NA
39
34
NA
34
54
44
61
53
41
41
58
59
59
40
64
28
45
5
NA
44
52
51
39
NA
34
NA
NA
NA
39
41
39
45
48
43
28
33
28
6
1
4
NA
37
42
37
21
29
65*
38 55 37 51
Russia
Source: BCG e-Friction index model.Note: iPv4 = internet Protocol version 4; iPv6 = internet Protocol version 6; PPP = purchasing power parity; aSn = autonomous system number; ccTlD = country code top-level domain; iCT = information and communications technology; * = discrete scale, with several countries sharing an equal ranking; na = not available. For definitions and source information for each indicator, please see exhibit 3.

58 | Greasing the Wheels of the Internet Economy
Speed
Architecture
Traffic
Price
0 50 7525 100
Infrastructure
Labor
Technology
Economy
Capital
0 50 7525 100
Ability
Access
Trust
Payments
Banking
0 50 7525 100
Sites
Content
Obstacles
Objectivity
Data
0 50 7525 100
Access
Internetbandwidthper capita
Quality of transportinfrastructure for
physical fulfilmentQuality of
education system
Number ofdomains registeredto each ccTLD per
capita
Number of onlineopen-encyclopedia
pages in homelanguage
Number ofmicromessagesmade in home
language
Share ofpopulation using
social networks(%)
Commitment toopen data
Press FreedomIndex
Freedom onthe Net
Filteringscore
Adult literacyrate (%)
ICT skills
Internet users (%)
Availability offinancial services
Affordability offinancial services
Market penetrationof bank accounts
(%)
Population usingonline personal
finance (%)
Debit cardpenetration (%)
Cyber securitybeing adequately
addressed
Trust in privacyof credit card
and otherfinancial data
Trust in privacyof other
personal data
Quality ofelectricity and
telephonyinfrastructure
ICT skills
Quality ofmath and
science education
Availability ofqualified engineers
Capacity forinnovation
Financial-marketsophistication
Financing throughlocal equity market
Ease of accessto loans
Foreign direct-investment-to-GDP
ratio
Venture capitalavailability
Strength ofintellectual
property protection
Burden of customsprocedures
Prevalence oftrade barriers
Number of daysto set up a
business
Company-leveltechnologyabsorption
InternationalInternet bandwidth
per capita
Consumerbroadband
penetration (%)
Businessfixed-broadbandpenetration (%)
Mobile Internetsubscription
penetration (%)
Number of IPv4registrations
per capita
Number of IPv6registrations
per capita
Peak fixed-broadband
connection speed
Average fixed-broadband
connection speed
Peak mobile-connection speed
Average mobile-connection speed
Fixed-broadbandpricing ($ per
month at PPP)
Mobile pricing($ per minute local
call off-net [peak]at PPP)
Traffic volumesper capita
Internationaltraffic volumes
per capita
Exchange pointsper capita
Number ofnetworks (ASNs)
per capita
Content registeredto ccTLD hosted
onshore (%)
Existence ofindependent
regulator
e-Friction Score: 58Rank: 44
INFRASTRUCTURE
Indicator Ranke-Friction score e-Friction score
INDUSTRY
Indicator Rank e-Friction score Rank e-Friction score Rank
INDIVIDUAL
Indicator
INFORMATION
Indicator
Overall Overall Overall Overall
32
57
65*
NA
55
62
60
60*
23
31
NA
39
25
35
28
17
18
21
23
34
21
3
14
29
25
59
NA
42
33
22
41
NA
29
NA
NA
NA
36
48
32
42
17
49
30
54
52
4
39
38
NA
NA
NA
NA
47
43
7*
43 21 33 65
Saudi Arabia
Source: BCG e-Friction index model.Note: iPv4 = internet Protocol version 4; iPv6 = internet Protocol version 6; PPP = purchasing power parity; aSn = autonomous system number; ccTlD = country code top-level domain; iCT = information and communications technology; * = discrete scale, with several countries sharing an equal ranking; na = not available. For definitions and source information for each indicator, please see exhibit 3.

The Boston Consulting Group | 59
Speed
Architecture
Traffic
Price
0 50 7525 100
Infrastructure
Labor
Technology
Economy
Capital
0 50 7525 100
Ability
Access
Trust
Payments
Banking
0 50 7525 100
Sites
Content
Obstacles
Objectivity
Data
0 50 7525 100
Access
Internetbandwidthper capita
Quality of transportinfrastructure for
physical fulfilmentQuality of
education system
Number ofdomains registeredto each ccTLD per
capita
Number of onlineopen-encyclopedia
pages in homelanguage
Number ofmicromessagesmade in home
language
Share ofpopulation using
social networks(%)
Commitment toopen data
Press FreedomIndex
Freedom onthe Net
Filteringscore
Adult literacyrate (%)
ICT skills
Internet users (%)
Availability offinancial services
Affordability offinancial services
Market penetrationof bank accounts
(%)
Population usingonline personal
finance (%)
Debit cardpenetration (%)
Cyber securitybeing adequately
addressed
Trust in privacyof credit card
and otherfinancial data
Trust in privacyof other
personal data
Quality ofelectricity and
telephonyinfrastructure
ICT skills
Quality ofmath and
science education
Availability ofqualified engineers
Capacity forinnovation
Financial-marketsophistication
Financing throughlocal equity market
Ease of accessto loans
Foreign direct-investment-to-GDP
ratio
Venture capitalavailability
Strength ofintellectual
property protection
Burden of customsprocedures
Prevalence oftrade barriers
Number of daysto set up a
business
Company-leveltechnologyabsorption
InternationalInternet bandwidth
per capita
Consumerbroadband
penetration (%)
Businessfixed-broadbandpenetration (%)
Mobile Internetsubscription
penetration (%)
Number of IPv4registrations
per capita
Number of IPv6registrations
per capita
Peak fixed-broadband
connection speed
Average fixed-broadband
connection speed
Peak mobile-connection speed
Average mobile-connection speed
Fixed-broadbandpricing ($ per
month at PPP)
Mobile pricing($ per minute local
call off-net [peak]at PPP)
Traffic volumesper capita
Internationaltraffic volumes
per capita
Exchange pointsper capita
Number ofnetworks (ASNs)
per capita
Content registeredto ccTLD hosted
onshore (%)
Existence ofindependent
regulator
e-Friction Score: 31Rank: 15
INFRASTRUCTURE
Indicator Ranke-Friction score e-Friction score
INDUSTRY
Indicator Rank e-Friction score Rank e-Friction score Rank
INDIVIDUAL
Indicator
INFORMATION
Indicator
Overall Overall Overall Overall
27
48
25
50
56
NA
36*
3
4
2
46
6
20
17
6
29
49
45
53
6
NA
2
12
15
42
1*
3
5
19
1
12
17
7
5
4
6
2
1
4
12
12
3
3
38
19
26
4
3
7
16
43
12
NA
NA
15 2 12 50
NA
Singapore
Source: BCG e-Friction index model.Note: iPv4 = internet Protocol version 4; iPv6 = internet Protocol version 6; PPP = purchasing power parity; aSn = autonomous system number; ccTlD = country code top-level domain; iCT = information and communications technology; * = discrete scale, with several countries sharing an equal ranking; na = not available. For definitions and source information for each indicator, please see exhibit 3.

60 | Greasing the Wheels of the Internet Economy
Speed
Architecture
Traffic
Price
0 50 7525 100
Infrastructure
Labor
Technology
Economy
Capital
0 50 7525 100
Ability
Access
Trust
Payments
Banking
0 50 7525 100
Sites
Content
Obstacles
Objectivity
Data
0 50 7525 100
Access
Internetbandwidthper capita
Quality of transportinfrastructure for
physical fulfilmentQuality of
education system
Number ofdomains registeredto each ccTLD per
capita
Number of onlineopen-encyclopedia
pages in homelanguage
Number ofmicromessagesmade in home
language
Share ofpopulation using
social networks(%)
Commitment toopen data
Press FreedomIndex
Freedom onthe Net
Filteringscore
Adult literacyrate (%)
ICT skills
Internet users (%)
Availability offinancial services
Affordability offinancial services
Market penetrationof bank accounts
(%)
Population usingonline personal
finance (%)
Debit cardpenetration (%)
Cyber securitybeing adequately
addressed
Trust in privacyof credit card
and otherfinancial data
Trust in privacyof other
personal data
Quality ofelectricity and
telephonyinfrastructure
ICT skills
Quality ofmath and
science education
Availability ofqualified engineers
Capacity forinnovation
Financial-marketsophistication
Financing throughlocal equity market
Ease of accessto loans
Foreign direct-investment-to-GDP
ratio
Venture capitalavailability
Strength ofintellectual
property protection
Burden of customsprocedures
Prevalence oftrade barriers
Number of daysto set up a
business
Company-leveltechnologyabsorption
InternationalInternet bandwidth
per capita
Consumerbroadband
penetration (%)
Businessfixed-broadbandpenetration (%)
Mobile Internetsubscription
penetration (%)
Number of IPv4registrations
per capita
Number of IPv6registrations
per capita
Peak fixed-broadband
connection speed
Average fixed-broadband
connection speed
Peak mobile-connection speed
Average mobile-connection speed
Fixed-broadbandpricing ($ per
month at PPP)
Mobile pricing($ per minute local
call off-net [peak]at PPP)
Traffic volumesper capita
Internationaltraffic volumes
per capita
Exchange pointsper capita
Number ofnetworks (ASNs)
per capita
Content registeredto ccTLD hosted
onshore (%)
Existence ofindependent
regulator
e-Friction Score: 44Rank: 26
INFRASTRUCTURE
Indicator Ranke-Friction score e-Friction score
INDUSTRY
Indicator Rank e-Friction score Rank e-Friction score Rank
INDIVIDUAL
Indicator
INFORMATION
Indicator
Overall Overall Overall Overall
19
NA
NA
NA
NA
NA
54
34
59
35
NA
NA
13
2
13
1* 42
45
27
27
32
62
NA
61
61
NA
40
53
11
32
21
19
9
18
33
4
32
31
63
62
NA
NA
NA
31
NA
NA
3
61
NA
NA
11
21
NA
NA
42
20 39 35 29
Slovenia
Source: BCG e-Friction index model.Note: iPv4 = internet Protocol version 4; iPv6 = internet Protocol version 6; PPP = purchasing power parity; aSn = autonomous system number; ccTlD = country code top-level domain; iCT = information and communications technology; * = discrete scale, with several countries sharing an equal ranking; na = not available. For definitions and source information for each indicator, please see exhibit 3.
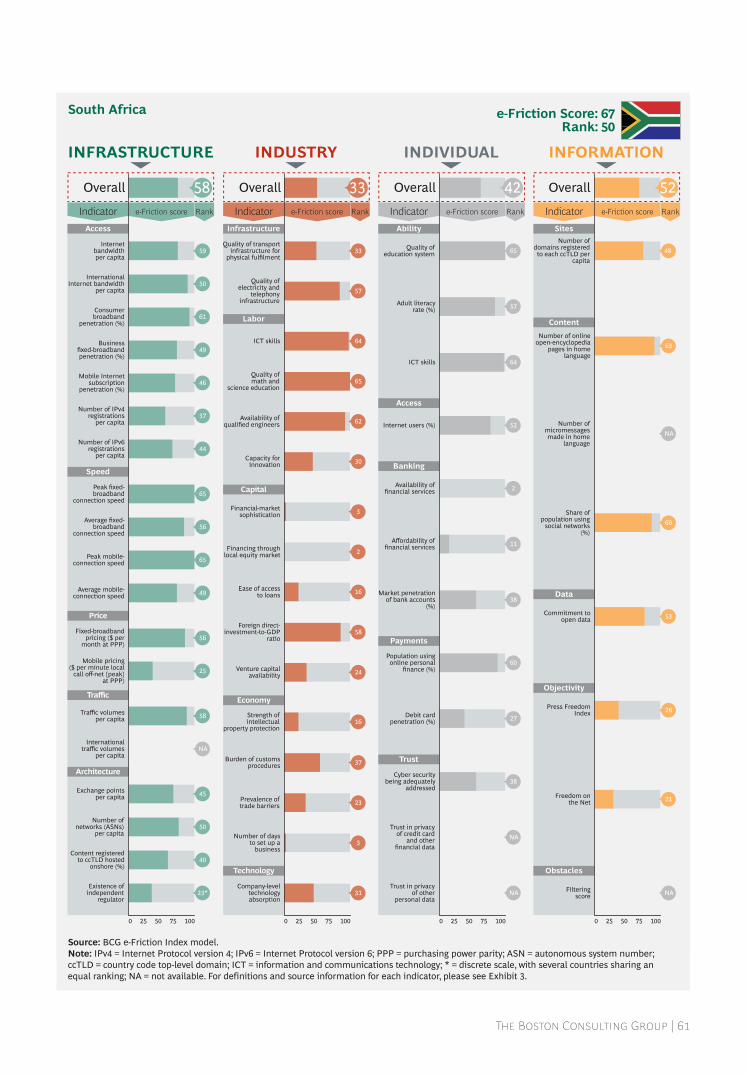
The Boston Consulting Group | 61
Speed
Architecture
Traffic
Price
0 50 7525 100
Infrastructure
Labor
Technology
Economy
Capital
0 50 7525 100
Ability
Access
Trust
Payments
Banking
0 50 7525 100
Sites
Content
Obstacles
Objectivity
Data
0 50 7525 100
Access
Internetbandwidthper capita
Quality of transportinfrastructure for
physical fulfilmentQuality of
education system
Number ofdomains registeredto each ccTLD per
capita
Number of onlineopen-encyclopedia
pages in homelanguage
Number ofmicromessagesmade in home
language
Share ofpopulation using
social networks(%)
Commitment toopen data
Press FreedomIndex
Freedom onthe Net
Filteringscore
Adult literacyrate (%)
ICT skills
Internet users (%)
Availability offinancial services
Affordability offinancial services
Market penetrationof bank accounts
(%)
Population usingonline personal
finance (%)
Debit cardpenetration (%)
Cyber securitybeing adequately
addressed
Trust in privacyof credit card
and otherfinancial data
Trust in privacyof other
personal data
Quality ofelectricity and
telephonyinfrastructure
ICT skills
Quality ofmath and
science education
Availability ofqualified engineers
Capacity forinnovation
Financial-marketsophistication
Financing throughlocal equity market
Ease of accessto loans
Foreign direct-investment-to-GDP
ratio
Venture capitalavailability
Strength ofintellectual
property protection
Burden of customsprocedures
Prevalence oftrade barriers
Number of daysto set up a
business
Company-leveltechnologyabsorption
InternationalInternet bandwidth
per capita
Consumerbroadband
penetration (%)
Businessfixed-broadbandpenetration (%)
Mobile Internetsubscription
penetration (%)
Number of IPv4registrations
per capita
Number of IPv6registrations
per capita
Peak fixed-broadband
connection speed
Average fixed-broadband
connection speed
Peak mobile-connection speed
Average mobile-connection speed
Fixed-broadbandpricing ($ per
month at PPP)
Mobile pricing($ per minute local
call off-net [peak]at PPP)
Traffic volumesper capita
Internationaltraffic volumes
per capita
Exchange pointsper capita
Number ofnetworks (ASNs)
per capita
Content registeredto ccTLD hosted
onshore (%)
Existence ofindependent
regulator
e-Friction Score: 67Rank: 50
INFRASTRUCTURE
Indicator Ranke-Friction score e-Friction score
INDUSTRY
Indicator Rank e-Friction score Rank e-Friction score Rank
INDIVIDUAL
Indicator
INFORMATION
Indicator
Overall Overall Overall Overall
48
63
60
53
26
21
NA
NA
50
59
61
49
46
37
44
65
56
65
49
56
25
58
45
50
40
23*
33
57
64
65
62
30
3
2
16
24
16
37
23
3
31
58
65
57
64
52
2
11
38
60
27
38
NA
NA
NA
58 33 42 52
South Africa
Source: BCG e-Friction index model.Note: iPv4 = internet Protocol version 4; iPv6 = internet Protocol version 6; PPP = purchasing power parity; aSn = autonomous system number; ccTlD = country code top-level domain; iCT = information and communications technology; * = discrete scale, with several countries sharing an equal ranking; na = not available. For definitions and source information for each indicator, please see exhibit 3.

62 | Greasing the Wheels of the Internet Economy
Speed
Architecture
Traffic
Price
0 50 7525 100
Infrastructure
Labor
Technology
Economy
Capital
0 50 7525 100
Ability
Access
Trust
Payments
Banking
0 50 7525 100
Sites
Content
Obstacles
Objectivity
Data
0 50 7525 100
Access
Internetbandwidthper capita
Quality of transportinfrastructure for
physical fulfilmentQuality of
education system
Number ofdomains registeredto each ccTLD per
capita
Number of onlineopen-encyclopedia
pages in homelanguage
Number ofmicromessagesmade in home
language
Share ofpopulation using
social networks(%)
Commitment toopen data
Press FreedomIndex
Freedom onthe Net
Filteringscore
Adult literacyrate (%)
ICT skills
Internet users (%)
Availability offinancial services
Affordability offinancial services
Market penetrationof bank accounts
(%)
Population usingonline personal
finance (%)
Debit cardpenetration (%)
Cyber securitybeing adequately
addressed
Trust in privacyof credit card
and otherfinancial data
Trust in privacyof other
personal data
Quality ofelectricity and
telephonyinfrastructure
ICT skills
Quality ofmath and
science education
Availability ofqualified engineers
Capacity forinnovation
Financial-marketsophistication
Financing throughlocal equity market
Ease of accessto loans
Foreign direct-investment-to-GDP
ratio
Venture capitalavailability
Strength ofintellectual
property protection
Burden of customsprocedures
Prevalence oftrade barriers
Number of daysto set up a
business
Company-leveltechnologyabsorption
InternationalInternet bandwidth
per capita
Consumerbroadband
penetration (%)
Businessfixed-broadbandpenetration (%)
Mobile Internetsubscription
penetration (%)
Number of IPv4registrations
per capita
Number of IPv6registrations
per capita
Peak fixed-broadband
connection speed
Average fixed-broadband
connection speed
Peak mobile-connection speed
Average mobile-connection speed
Fixed-broadbandpricing ($ per
month at PPP)
Mobile pricing($ per minute local
call off-net [peak]at PPP)
Traffic volumesper capita
Internationaltraffic volumes
per capita
Exchange pointsper capita
Number ofnetworks (ASNs)
per capita
Content registeredto ccTLD hosted
onshore (%)
Existence ofindependent
regulator
e-Friction Score: 41Rank: 25
INFRASTRUCTURE
Indicator Ranke-Friction score e-Friction score
INDUSTRY
Indicator Rank e-Friction score Rank e-Friction score Rank
INDIVIDUAL
Indicator
INFORMATION
Indicator
Overall Overall Overall Overall
NA 9 35
8
21
14
53
43
39
55
56
63*
NA
38
25
29
44*
18
21
13
27
20
NA
49
56
NA
57
33
35
50
31
19
44
NA
2
13
8
5
2
1
NA
NA
50
34
1
47
44
30
1
1* NA
NA
NA
NA
NA
11 30 28 54
South Korea
Source: BCG e-Friction index model.Note: iPv4 = internet Protocol version 4; iPv6 = internet Protocol version 6; PPP = purchasing power parity; aSn = autonomous system number; ccTlD = country code top-level domain; iCT = information and communications technology; * = discrete scale, with several countries sharing an equal ranking; na = not available. For definitions and source information for each indicator, please see exhibit 3.

The Boston Consulting Group | 63
Speed
Architecture
Traffic
Price
0 50 7525 100
Infrastructure
Labor
Technology
Economy
Capital
0 50 7525 100
Ability
Access
Trust
Payments
Banking
0 50 7525 100
Sites
Content
Obstacles
Objectivity
Data
0 50 7525 100
Access
Internetbandwidthper capita
Quality of transportinfrastructure for
physical fulfilmentQuality of
education system
Number ofdomains registeredto each ccTLD per
capita
Number of onlineopen-encyclopedia
pages in homelanguage
Number ofmicromessagesmade in home
language
Share ofpopulation using
social networks(%)
Commitment toopen data
Press FreedomIndex
Freedom onthe Net
Filteringscore
Adult literacyrate (%)
ICT skills
Internet users (%)
Availability offinancial services
Affordability offinancial services
Market penetrationof bank accounts
(%)
Population usingonline personal
finance (%)
Debit cardpenetration (%)
Cyber securitybeing adequately
addressed
Trust in privacyof credit card
and otherfinancial data
Trust in privacyof other
personal data
Quality ofelectricity and
telephonyinfrastructure
ICT skills
Quality ofmath and
science education
Availability ofqualified engineers
Capacity forinnovation
Financial-marketsophistication
Financing throughlocal equity market
Ease of accessto loans
Foreign direct-investment-to-GDP
ratio
Venture capitalavailability
Strength ofintellectual
property protection
Burden of customsprocedures
Prevalence oftrade barriers
Number of daysto set up a
business
Company-leveltechnologyabsorption
InternationalInternet bandwidth
per capita
Consumerbroadband
penetration (%)
Businessfixed-broadbandpenetration (%)
Mobile Internetsubscription
penetration (%)
Number of IPv4registrations
per capita
Number of IPv6registrations
per capita
Peak fixed-broadband
connection speed
Average fixed-broadband
connection speed
Peak mobile-connection speed
Average mobile-connection speed
Fixed-broadbandpricing ($ per
month at PPP)
Mobile pricing($ per minute local
call off-net [peak]at PPP)
Traffic volumesper capita
Internationaltraffic volumes
per capita
Exchange pointsper capita
Number ofnetworks (ASNs)
per capita
Content registeredto ccTLD hosted
onshore (%)
Existence ofindependent
regulator
e-Friction Score: 47Rank: 33
INFRASTRUCTURE
Indicator Ranke-Friction score e-Friction score
INDUSTRY
Indicator Rank e-Friction score Rank e-Friction score Rank
INDIVIDUAL
Indicator
INFORMATION
Indicator
Overall Overall Overall Overall
6
19
41
48
10
41
23
58
62
55
33
25
24
21
37
45
41
33
41
29
29
36
17
35
22
34
7
18
34
33
45*
35
31
22
NA
NA
21
33
28
18
27
53
26
33
16
19
42
64
29
24
41
36
46
1*
22
35 35 27 35
Spain
Source: BCG e-Friction index model.Note: iPv4 = internet Protocol version 4; iPv6 = internet Protocol version 6; PPP = purchasing power parity; aSn = autonomous system number; ccTlD = country code top-level domain; iCT = information and communications technology; * = discrete scale, with several countries sharing an equal ranking; na = not available. For definitions and source information for each indicator, please see exhibit 3.

64 | Greasing the Wheels of the Internet Economy
Speed
Architecture
Traffic
Price
0 50 7525 100
Infrastructure
Labor
Technology
Economy
Capital
0 50 7525 100
Ability
Access
Trust
Payments
Banking
0 50 7525 100
Sites
Content
Obstacles
Objectivity
Data
0 50 7525 100
Access
Internetbandwidthper capita
Quality of transportinfrastructure for
physical fulfilmentQuality of
education system
Number ofdomains registeredto each ccTLD per
capita
Number of onlineopen-encyclopedia
pages in homelanguage
Number ofmicromessagesmade in home
language
Share ofpopulation using
social networks(%)
Commitment toopen data
Press FreedomIndex
Freedom onthe Net
Filteringscore
Adult literacyrate (%)
ICT skills
Internet users (%)
Availability offinancial services
Affordability offinancial services
Market penetrationof bank accounts
(%)
Population usingonline personal
finance (%)
Debit cardpenetration (%)
Cyber securitybeing adequately
addressed
Trust in privacyof credit card
and otherfinancial data
Trust in privacyof other
personal data
Quality ofelectricity and
telephonyinfrastructure
ICT skills
Quality ofmath and
science education
Availability ofqualified engineers
Capacity forinnovation
Financial-marketsophistication
Financing throughlocal equity market
Ease of accessto loans
Foreign direct-investment-to-GDP
ratio
Venture capitalavailability
Strength ofintellectual
property protection
Burden of customsprocedures
Prevalence oftrade barriers
Number of daysto set up a
business
Company-leveltechnologyabsorption
InternationalInternet bandwidth
per capita
Consumerbroadband
penetration (%)
Businessfixed-broadbandpenetration (%)
Mobile Internetsubscription
penetration (%)
Number of IPv4registrations
per capita
Number of IPv6registrations
per capita
Peak fixed-broadband
connection speed
Average fixed-broadband
connection speed
Peak mobile-connection speed
Average mobile-connection speed
Fixed-broadbandpricing ($ per
month at PPP)
Mobile pricing($ per minute local
call off-net [peak]at PPP)
Traffic volumesper capita
Internationaltraffic volumes
per capita
Exchange pointsper capita
Number ofnetworks (ASNs)
per capita
Content registeredto ccTLD hosted
onshore (%)
Existence ofindependent
regulator
e-Friction Score: 14Rank: 1
INFRASTRUCTURE
Indicator Ranke-Friction score e-Friction score
INDUSTRY
Indicator Rank e-Friction score Rank e-Friction score Rank
INDIVIDUAL
Indicator
INFORMATION
Indicator
Overall Overall Overall Overall
10
27
9
12
7
NA
NA
1*
5
2
NA
NA
2
3
23
22
10
NA
NA
23
15
NA
4
6
9
25
1*
21
8
2
27
9
7
14
9
9
5
14
7
12
8
1
NA
13
8
2
3
12
18
4
6
2
3
NA
NA
1 3 2 7
Sweden
Source: BCG e-Friction index model.Note: iPv4 = internet Protocol version 4; iPv6 = internet Protocol version 6; PPP = purchasing power parity; aSn = autonomous system number; ccTlD = country code top-level domain; iCT = information and communications technology; * = discrete scale, with several countries sharing an equal ranking; na = not available. For definitions and source information for each indicator, please see exhibit 3.
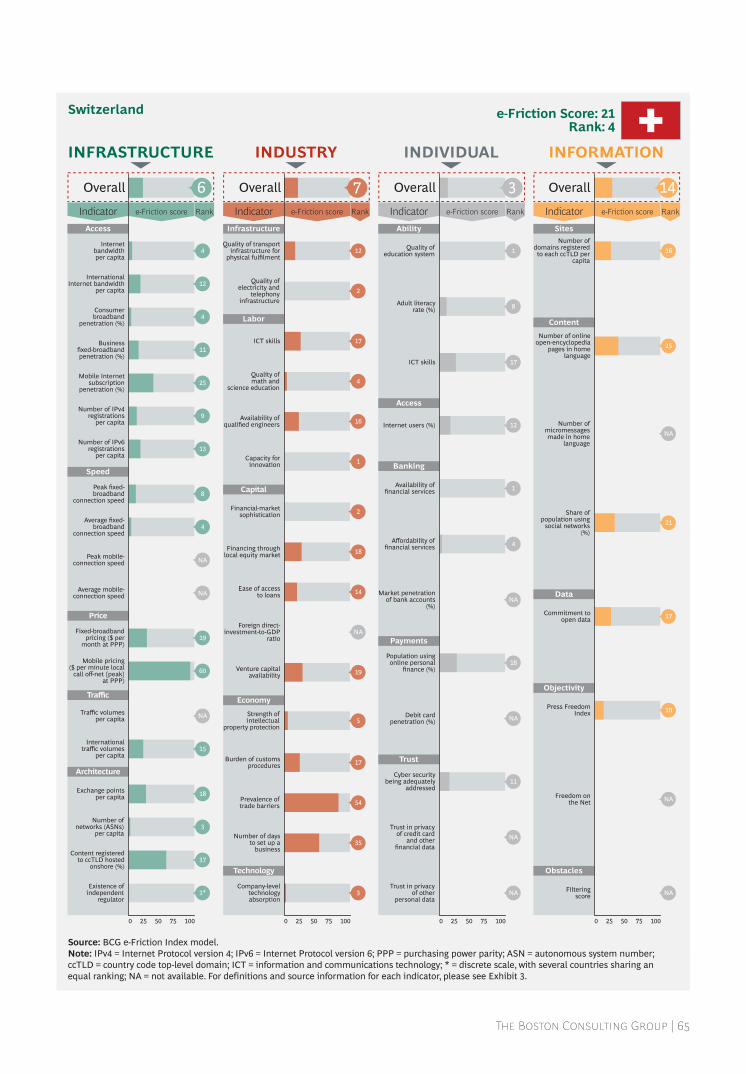
The Boston Consulting Group | 65
Speed
Architecture
Traffic
Price
0 50 7525 100
Infrastructure
Labor
Technology
Economy
Capital
0 50 7525 100
Ability
Access
Trust
Payments
Banking
0 50 7525 100
Sites
Content
Obstacles
Objectivity
Data
0 50 7525 100
Access
Internetbandwidthper capita
Quality of transportinfrastructure for
physical fulfilmentQuality of
education system
Number ofdomains registeredto each ccTLD per
capita
Number of onlineopen-encyclopedia
pages in homelanguage
Number ofmicromessagesmade in home
language
Share ofpopulation using
social networks(%)
Commitment toopen data
Press FreedomIndex
Freedom onthe Net
Filteringscore
Adult literacyrate (%)
ICT skills
Internet users (%)
Availability offinancial services
Affordability offinancial services
Market penetrationof bank accounts
(%)
Population usingonline personal
finance (%)
Debit cardpenetration (%)
Cyber securitybeing adequately
addressed
Trust in privacyof credit card
and otherfinancial data
Trust in privacyof other
personal data
Quality ofelectricity and
telephonyinfrastructure
ICT skills
Quality ofmath and
science education
Availability ofqualified engineers
Capacity forinnovation
Financial-marketsophistication
Financing throughlocal equity market
Ease of accessto loans
Foreign direct-investment-to-GDP
ratio
Venture capitalavailability
Strength ofintellectual
property protection
Burden of customsprocedures
Prevalence oftrade barriers
Number of daysto set up a
business
Company-leveltechnologyabsorption
InternationalInternet bandwidth
per capita
Consumerbroadband
penetration (%)
Businessfixed-broadbandpenetration (%)
Mobile Internetsubscription
penetration (%)
Number of IPv4registrations
per capita
Number of IPv6registrations
per capita
Peak fixed-broadband
connection speed
Average fixed-broadband
connection speed
Peak mobile-connection speed
Average mobile-connection speed
Fixed-broadbandpricing ($ per
month at PPP)
Mobile pricing($ per minute local
call off-net [peak]at PPP)
Traffic volumesper capita
Internationaltraffic volumes
per capita
Exchange pointsper capita
Number ofnetworks (ASNs)
per capita
Content registeredto ccTLD hosted
onshore (%)
Existence ofindependent
regulator
e-Friction Score: 21Rank: 4
INFRASTRUCTURE
Indicator Ranke-Friction score e-Friction score
INDUSTRY
Indicator Rank e-Friction score Rank e-Friction score Rank
INDIVIDUAL
Indicator
INFORMATION
Indicator
Overall Overall Overall Overall
16
25
21
17
10
NA
NA
NA
4
12
4
11
25
9
13
8
4
NA
NA
NA19
60
NA
15
18
3
37
1*
12
2
17
4
16
1
2
18
14
19
5
17
54
35
3
1
8
17
12
1
4
18
11
NA
NA
NA
NA
6 7 3 14
Switzerland
Source: BCG e-Friction index model.Note: iPv4 = internet Protocol version 4; iPv6 = internet Protocol version 6; PPP = purchasing power parity; aSn = autonomous system number; ccTlD = country code top-level domain; iCT = information and communications technology; * = discrete scale, with several countries sharing an equal ranking; na = not available. For definitions and source information for each indicator, please see exhibit 3.
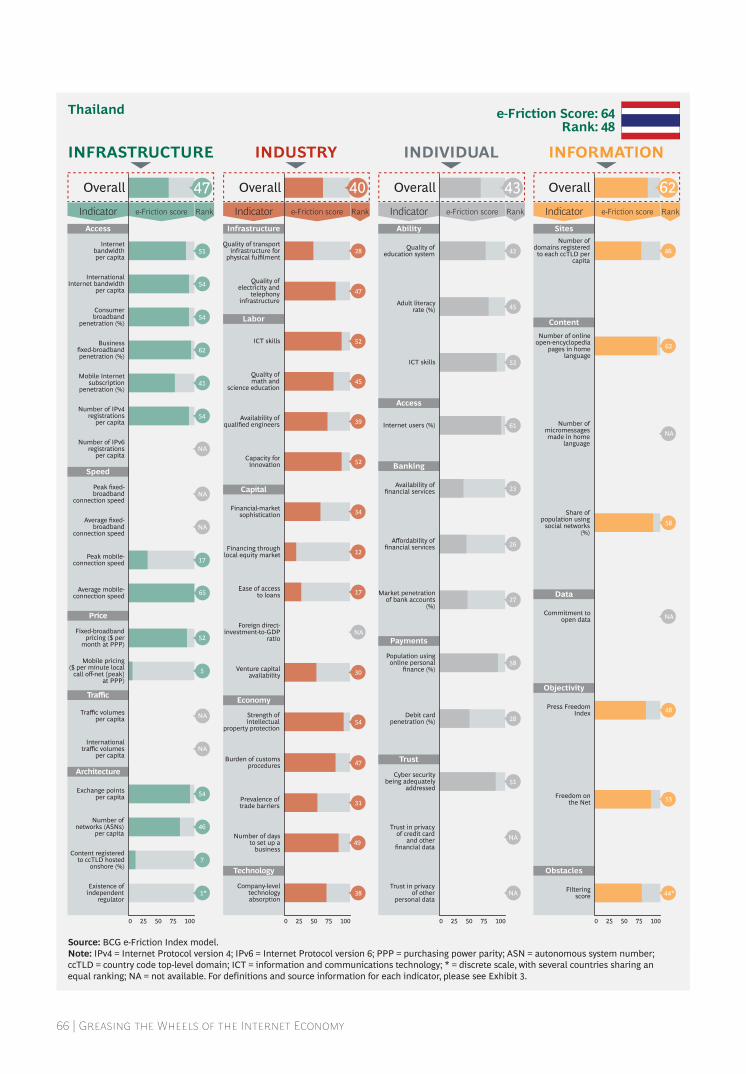
66 | Greasing the Wheels of the Internet Economy
Speed
Architecture
Traffic
Price
0 50 7525 100
Infrastructure
Labor
Technology
Economy
Capital
0 50 7525 100
Ability
Access
Trust
Payments
Banking
0 50 7525 100
Sites
Content
Obstacles
Objectivity
Data
0 50 7525 100
Access
Internetbandwidthper capita
Quality of transportinfrastructure for
physical fulfilmentQuality of
education system
Number ofdomains registeredto each ccTLD per
capita
Number of onlineopen-encyclopedia
pages in homelanguage
Number ofmicromessagesmade in home
language
Share ofpopulation using
social networks(%)
Commitment toopen data
Press FreedomIndex
Freedom onthe Net
Filteringscore
Adult literacyrate (%)
ICT skills
Internet users (%)
Availability offinancial services
Affordability offinancial services
Market penetrationof bank accounts
(%)
Population usingonline personal
finance (%)
Debit cardpenetration (%)
Cyber securitybeing adequately
addressed
Trust in privacyof credit card
and otherfinancial data
Trust in privacyof other
personal data
Quality ofelectricity and
telephonyinfrastructure
ICT skills
Quality ofmath and
science education
Availability ofqualified engineers
Capacity forinnovation
Financial-marketsophistication
Financing throughlocal equity market
Ease of accessto loans
Foreign direct-investment-to-GDP
ratio
Venture capitalavailability
Strength ofintellectual
property protection
Burden of customsprocedures
Prevalence oftrade barriers
Number of daysto set up a
business
Company-leveltechnologyabsorption
InternationalInternet bandwidth
per capita
Consumerbroadband
penetration (%)
Businessfixed-broadbandpenetration (%)
Mobile Internetsubscription
penetration (%)
Number of IPv4registrations
per capita
Number of IPv6registrations
per capita
Peak fixed-broadband
connection speed
Average fixed-broadband
connection speed
Peak mobile-connection speed
Average mobile-connection speed
Fixed-broadbandpricing ($ per
month at PPP)
Mobile pricing($ per minute local
call off-net [peak]at PPP)
Traffic volumesper capita
Internationaltraffic volumes
per capita
Exchange pointsper capita
Number ofnetworks (ASNs)
per capita
Content registeredto ccTLD hosted
onshore (%)
Existence ofindependent
regulator
e-Friction Score: 64Rank: 48
INFRASTRUCTURE
Indicator Ranke-Friction score e-Friction score
INDUSTRY
Indicator Rank e-Friction score Rank e-Friction score Rank
INDIVIDUAL
Indicator
INFORMATION
Indicator
Overall Overall Overall Overall
46
62
58
NA
NA
48
53
44*
51
54
54
41
54
NA
NA
NA
17
52
5
NA
NA
54
46
7
1*
28
47
52
45
39
52
34
12
17
30
54
47
31
49
38
NA
42
45
52
23
26
27
28
51
NA
NA
62
65
61
58
47 40 43 62
Thailand
Source: BCG e-Friction index model.Note: iPv4 = internet Protocol version 4; iPv6 = internet Protocol version 6; PPP = purchasing power parity; aSn = autonomous system number; ccTlD = country code top-level domain; iCT = information and communications technology; * = discrete scale, with several countries sharing an equal ranking; na = not available. For definitions and source information for each indicator, please see exhibit 3.

The Boston Consulting Group | 67
Speed
Architecture
Traffic
Price
0 50 7525 100
Infrastructure
Labor
Technology
Economy
Capital
0 50 7525 100
Ability
Access
Trust
Payments
Banking
0 50 7525 100
Sites
Content
Obstacles
Objectivity
Data
0 50 7525 100
Access
Internetbandwidthper capita
Quality of transportinfrastructure for
physical fulfilmentQuality of
education system
Number ofdomains registeredto each ccTLD per
capita
Number of onlineopen-encyclopedia
pages in homelanguage
Number ofmicromessagesmade in home
language
Share ofpopulation using
social networks(%)
Commitment toopen data
Press FreedomIndex
Freedom onthe Net
Filteringscore
Adult literacyrate (%)
ICT skills
Internet users (%)
Availability offinancial services
Affordability offinancial services
Market penetrationof bank accounts
(%)
Population usingonline personal
finance (%)
Debit cardpenetration (%)
Cyber securitybeing adequately
addressed
Trust in privacyof credit card
and otherfinancial data
Trust in privacyof other
personal data
Quality ofelectricity and
telephonyinfrastructure
ICT skills
Quality ofmath and
science education
Availability ofqualified engineers
Capacity forinnovation
Financial-marketsophistication
Financing throughlocal equity market
Ease of accessto loans
Foreign direct-investment-to-GDP
ratio
Venture capitalavailability
Strength ofintellectual
property protection
Burden of customsprocedures
Prevalence oftrade barriers
Number of daysto set up a
business
Company-leveltechnologyabsorption
InternationalInternet bandwidth
per capita
Consumerbroadband
penetration (%)
Businessfixed-broadbandpenetration (%)
Mobile Internetsubscription
penetration (%)
Number of IPv4registrations
per capita
Number of IPv6registrations
per capita
Peak fixed-broadband
connection speed
Average fixed-broadband
connection speed
Peak mobile-connection speed
Average mobile-connection speed
Fixed-broadbandpricing ($ per
month at PPP)
Mobile pricing($ per minute local
call off-net [peak]at PPP)
Traffic volumesper capita
Internationaltraffic volumes
per capita
Exchange pointsper capita
Number ofnetworks (ASNs)
per capita
Content registeredto ccTLD hosted
onshore (%)
Existence ofindependent
regulator
e-Friction Score: 58Rank: 45
INFRASTRUCTURE
Indicator Ranke-Friction score e-Friction score
INDUSTRY
Indicator Rank e-Friction score Rank e-Friction score Rank
INDIVIDUAL
Indicator
INFORMATION
Indicator
Overall Overall Overall Overall
54
59
NA
45
NA
58
44
44*
25
52
40
52
37
36
31
29
33
49
46
49
49
21
33
44
50
53
40
49
24
23
36
45
24
45
NA
NA
38
40
40
43
37
48
49
40
44
35
45
15
14
NA
38
NA
43
12
1*
40 41 39 59
Turkey
Source: BCG e-Friction index model.Note: iPv4 = internet Protocol version 4; iPv6 = internet Protocol version 6; PPP = purchasing power parity; aSn = autonomous system number; ccTlD = country code top-level domain; iCT = information and communications technology; * = discrete scale, with several countries sharing an equal ranking; na = not available. For definitions and source information for each indicator, please see exhibit 3.

68 | Greasing the Wheels of the Internet Economy
Speed
Architecture
Traffic
Price
0 50 7525 100
Infrastructure
Labor
Technology
Economy
Capital
0 50 7525 100
Ability
Access
Trust
Payments
Banking
0 50 7525 100
Sites
Content
Obstacles
Objectivity
Data
0 50 7525 100
Access
Internetbandwidthper capita
Quality of transportinfrastructure for
physical fulfilmentQuality of
education system
Number ofdomains registeredto each ccTLD per
capita
Number of onlineopen-encyclopedia
pages in homelanguage
Number ofmicromessagesmade in home
language
Share ofpopulation using
social networks(%)
Commitment to open data
Press FreedomIndex
Freedom onthe Net
Filteringscore
Adult literacyrate (%)
ICT skills
Internet users (%)
Availability offinancial services
Affordability offinancial services
Market penetrationof bank accounts
(%)
Population usingonline personal
finance (%)
Debit cardpenetration (%)
Cyber securitybeing adequately
addressed
Trust in privacyof credit card
and otherfinancial data
Trust in privacyof other
personal data
Quality ofelectricity and
telephonyinfrastructure
ICT skills
Quality ofmath and
science education
Availability ofqualified engineers
Capacity forinnovation
Financial-marketsophistication
Financing throughlocal equity market
Ease of accessto loans
Foreign direct-investment-to-GDP
ratio
Venture capitalavailability
Strength ofintellectual
property protection
Burden of customsprocedures
Prevalence oftrade barriers
Number of daysto set up a
business
Company-leveltechnologyabsorption
InternationalInternet bandwidth
per capita
Consumerbroadband
penetration (%)
Businessfixed-broadbandpenetration (%)
Mobile Internetsubscription
penetration (%)
Number of IPv4registrations
per capita
Number of IPv6registrations
per capita
Peak fixed-broadband
connection speed
Average fixed-broadband
connection speed
Peak mobile-connection speed
Average mobile-connection speed
Fixed-broadbandpricing ($ per
month at PPP)
Mobile pricing($ per minute local
call off-net [peak]at PPP)
Traffic volumesper capita
Internationaltraffic volumes
per capita
Exchange pointsper capita
Number ofnetworks (ASNs)
per capita
Content registeredto ccTLD hosted
onshore (%)
Existence ofindependent
regulator
e-Friction Score: 54Rank: 39
INFRASTRUCTURE
Indicator Ranke-Friction score e-Friction score
INDUSTRY
Indicator Rank e-Friction score Rank e-Friction score Rank
INDIVIDUAL
Indicator
INFORMATION
Indicator
Overall Overall Overall Overall
56
32
NA
NA
8
45
24
1*
52
39
60
19
34
57
59
62
55
59
63
63
57
51
54
19
43
2
60
58
61
64
48
NA
38
64
NA
NA
57
36
51
39
60
45
57
NA
NA
11
3
3
1
NA
45
33
13
22
7*
34 60 52 20
Ukraine
Source: BCG e-Friction index model.Note: iPv4 = internet Protocol version 4; iPv6 = internet Protocol version 6; PPP = purchasing power parity; aSn = autonomous system number; ccTlD = country code top-level domain; iCT = information and communications technology; * = discrete scale, with several countries sharing an equal ranking; na = not available. For definitions and source information for each indicator, please see exhibit 3.

The Boston Consulting Group | 69
Speed
Architecture
Traffic
Price
0 50 7525 100
Infrastructure
Labor
Technology
Economy
Capital
0 50 7525 100
Ability
Access
Trust
Payments
Banking
0 50 7525 100
Sites
Content
Obstacles
Objectivity
Data
0 50 7525 100
Access
Internetbandwidthper capita
Quality of transportinfrastructure for
physical fulfilmentQuality of
education system
Number ofdomains registeredto each ccTLD per
capita
Number of onlineopen-encyclopedia
pages in homelanguage
Number ofmicromessagesmade in home
language
Share ofpopulation using
social networks(%)
Commitment toopen data
Press FreedomIndex
Freedom onthe Net
Filteringscore
Adult literacyrate (%)
ICT skills
Internet users (%)
Availability offinancial services
Affordability offinancial services
Market penetrationof bank accounts
(%)
Population usingonline personal
finance (%)
Debit cardpenetration (%)
Cyber securitybeing adequately
addressed
Trust in privacyof credit card
and otherfinancial data
Trust in privacyof other
personal data
Quality ofelectricity and
telephonyinfrastructure
ICT skills
Quality ofmath and
science education
Availability ofqualified engineers
Capacity forinnovation
Financial-marketsophistication
Financing throughlocal equity market
Ease of accessto loans
Foreign direct-investment-to-GDP
ratio
Venture capitalavailability
Strength ofintellectual
property protection
Burden of customsprocedures
Prevalence oftrade barriers
Number of daysto set up a
business
Company-leveltechnologyabsorption
InternationalInternet bandwidth
per capita
Consumerbroadband
penetration (%)
Businessfixed-broadbandpenetration (%)
Mobile Internetsubscription
penetration (%)
Number of IPv4registrations
per capita
Number of IPv6registrations
per capita
Peak fixed-broadband
connection speed
Average fixed-broadband
connection speed
Peak mobile-connection speed
Average mobile-connection speed
Fixed-broadbandpricing ($ per
month at PPP)
Mobile pricing($ per minute local
call off-net [peak]at PPP)
Traffic volumesper capita
Internationaltraffic volumes
per capita
Exchange pointsper capita
Number ofnetworks (ASNs)
per capita
Content registeredto ccTLD hosted
onshore (%)
Existence ofindependent
regulator
e-Friction Score: 41Rank: 24
INFRASTRUCTURE
Indicator Ranke-Friction score e-Friction score
INDUSTRY
Indicator Rank e-Friction score Rank e-Friction score Rank
INDIVIDUAL
Indicator
INFORMATION
Indicator
Overall Overall Overall Overall
17
13
6*
NA
NA
42
56
60*
30
31
26
6
14
42
26
13
NA
NA
NA
60
9
NA
NA
24
49
54
27*
1
23
16
12
11
33
29
19
3
9
18
5
5
40
4
42
11
55
16
13
22
20
35
NA
25
2
NA
NA
33 8 19 32
41
United Arab Emirates
Source: BCG e-Friction index model.Note: iPv4 = internet Protocol version 4; iPv6 = internet Protocol version 6; PPP = purchasing power parity; aSn = autonomous system number; ccTlD = country code top-level domain; iCT = information and communications technology; * = discrete scale, with several countries sharing an equal ranking; na = not available. For definitions and source information for each indicator, please see exhibit 3.

70 | Greasing the Wheels of the Internet Economy
Speed
Architecture
Traffic
Price
0 50 7525 100
Infrastructure
Labor
Technology
Economy
Capital
0 50 7525 100
Ability
Access
Trust
Payments
Banking
0 50 7525 100
Sites
Content
Obstacles
Objectivity
Data
0 50 7525 100
Access
Internetbandwidthper capita
Quality of transportinfrastructure for
physical fulfilmentQuality of
education system
Number ofdomains registeredto each ccTLD per
capita
Number of onlineopen-encyclopedia
pages in homelanguage
Number ofmicromessagesmade in home
language
Share ofpopulation using
social networks(%)
Commitment toopen data
Press FreedomIndex
Freedom onthe Net
Filteringscore
Adult literacyrate (%)
ICT skills
Internet users (%)
Availability offinancial services
Affordability offinancial services
Market penetrationof bank accounts
(%)
Population usingonline personal
finance (%)
Debit cardpenetration (%)
Cyber securitybeing adequately
addressed
Trust in privacyof credit card
and otherfinancial data
Trust in privacyof other
personal data
Quality ofelectricity and
telephonyinfrastructure
ICT skills
Quality ofmath and
science education
Availability ofqualified engineers
Capacity forinnovation
Financial-marketsophistication
Financing throughlocal equity market
Ease of accessto loans
Foreign direct-investment-to-GDP
ratio
Venture capitalavailability
Strength ofintellectual
property protection
Burden of customsprocedures
Prevalence oftrade barriers
Number of daysto set up a
business
Company-leveltechnologyabsorption
InternationalInternet bandwidth
per capita
Consumerbroadband
penetration (%)
Businessfixed-broadbandpenetration (%)
Mobile Internetsubscription
penetration (%)
Number of IPv4registrations
per capita
Number of IPv6registrations
per capita
Peak fixed-broadband
connection speed
Average fixed-broadband
connection speed
Peak mobile-connection speed
Average mobile-connection speed
Fixed-broadbandpricing ($ per
month at PPP)
Mobile pricing($ per minute local
call off-net [peak]at PPP)
Traffic volumesper capita
Internationaltraffic volumes
per capita
Exchange pointsper capita
Number ofnetworks (ASNs)
per capita
Content registeredto ccTLD hosted
onshore (%)
Existence ofindependent
regulator
e-Friction Score: 28Rank: 12
INFRASTRUCTURE
Indicator Ranke-Friction score e-Friction score
INDUSTRY
Indicator Rank e-Friction score Rank e-Friction score Rank
INDIVIDUAL
Indicator
INFORMATION
Indicator
Overall Overall Overall Overall
9
47
13*
26
1
19
17
1*
7
8
12
21
16
17
39
14
10
24
23
10
46
NA
10
32
24
36
1*
13
3
29
32
19
8
1
10
48
17
6
14
13
21
21
40
21
8
29
10
5
14
9
21
8
32
42
36
13 13 18 13
United Kingdom
Source: BCG e-Friction index model.Note: iPv4 = internet Protocol version 4; iPv6 = internet Protocol version 6; PPP = purchasing power parity; aSn = autonomous system number; ccTlD = country code top-level domain; iCT = information and communications technology; * = discrete scale, with several countries sharing an equal ranking; na = not available. For definitions and source information for each indicator, please see exhibit 3.

The Boston Consulting Group | 71
Speed
Architecture
Traffic
Price
0 50 7525 100
Infrastructure
Labor
Technology
Economy
Capital
0 50 7525 100
Ability
Access
Trust
Payments
Banking
0 50 7525 100
Sites
Content
Obstacles
Objectivity
Data
0 50 7525 100
Access
Internetbandwidthper capita
Quality of transportinfrastructure for
physical fulfilmentQuality of
education system
Number ofdomains registeredto each ccTLD per
capita
Number of onlineopen-encyclopedia
pages in homelanguage
Number ofmicromessagesmade in home
language
Share ofpopulation using
social networks(%)
Commitment toopen data
Press FreedomIndex
Freedom onthe Net
Filteringscore
Adult literacyrate (%)
ICT skills
Internet users (%)
Availability offinancial services
Affordability offinancial services
Market penetrationof bank accounts
(%)
Population usingonline personal
finance (%)
Debit cardpenetration (%)
Cyber securitybeing adequately
addressed
Trust in privacyof credit card
and otherfinancial data
Trust in privacyof other
personal data
Quality ofelectricity and
telephonyinfrastructure
ICT skills
Quality ofmath and
science education
Availability ofqualified engineers
Capacity forinnovation
Financial-marketsophistication
Financing throughlocal equity market
Ease of accessto loans
Foreign direct-investment-to-GDP
ratio
Venture capitalavailability
Strength ofintellectual
property protection
Burden of customsprocedures
Prevalence oftrade barriers
Number of daysto set up a
business
Company-leveltechnologyabsorption
InternationalInternet bandwidth
per capita
Consumerbroadband
penetration (%)
Businessfixed-broadbandpenetration (%)
Mobile Internetsubscription
penetration (%)
Number of IPv4registrations
per capita
Number of IPv6registrations
per capita
Peak fixed-broadband
connection speed
Average fixed-broadband
connection speed
Peak mobile-connection speed
Average mobile-connection speed
Fixed-broadbandpricing ($ per
month at PPP)
Mobile pricing($ per minute local
call off-net [peak]at PPP)
Traffic volumesper capita
Internationaltraffic volumes
per capita
Exchange pointsper capita
Number ofnetworks (ASNs)
per capita
Content registeredto ccTLD hosted
onshore (%)
Existence ofindependent
regulator
e-Friction Score: 22Rank: 6
INFRASTRUCTURE
Indicator Ranke-Friction score e-Friction score
INDUSTRY
Indicator Rank e-Friction score Rank e-Friction score Rank
INDIVIDUAL
Indicator
INFORMATION
Indicator
Overall Overall Overall Overall
25
23
14
9
18
1
15
16
9
32
19
12
36
5
22
25
7
13
1*
10
25
6
31
5
5
14
3
13
3
54
21
28
32
21
9
20
8
6
19
6
9
21
23
15
33
36
30
42
5
4*
20
2
20
5
1*
7 10 17 2
United States
Source: BCG e-Friction index model.Note: iPv4 = internet Protocol version 4; iPv6 = internet Protocol version 6; PPP = purchasing power parity; aSn = autonomous system number; ccTlD = country code top-level domain; iCT = information and communications technology; * = discrete scale, with several countries sharing an equal ranking; na = not available. For definitions and source information for each indicator, please see exhibit 3.

72 | Greasing the Wheels of the Internet Economy
Speed
Architecture
Traffic
Price
0 50 7525 100
Infrastructure
Labor
Technology
Economy
Capital
0 50 7525 100
Ability
Access
Trust
Payments
Banking
0 50 7525 100
Sites
Content
Obstacles
Objectivity
Data
0 50 7525 100
Access
Internetbandwidthper capita
Quality of transportinfrastructure for
physical fulfilmentQuality of
education system
Number ofdomains registeredto each ccTLD per
capita
Number of onlineopen-encyclopedia
pages in homelanguage
Number ofmicromessagesmade in home
language
Share ofpopulation using
social networks(%)
Commitment toopen data
Press FreedomIndex
Freedom onthe Net
Filteringscore
Adult literacyrate (%)
ICT skills
Internet users (%)
Availability offinancial services
Affordability offinancial services
Market penetrationof bank accounts
(%)
Population usingonline personal
finance (%)
Debit cardpenetration (%)
Cyber securitybeing adequately
addressed
Trust in privacyof credit card
and otherfinancial data
Trust in privacyof other
personal data
Quality ofelectricity and
telephonyinfrastructure
ICT skills
Quality ofmath and
science education
Availability ofqualified engineers
Capacity forinnovation
Financial-marketsophistication
Financing throughlocal equity market
Ease of accessto loans
Foreign direct-investment-to-GDP
ratio
Venture capitalavailability
Strength ofintellectual
property protection
Burden of customsprocedures
Prevalence oftrade barriers
Number of daysto set up a
business
Company-leveltechnologyabsorption
InternationalInternet bandwidth
per capita
Consumerbroadband
penetration (%)
Businessfixed-broadbandpenetration (%)
Mobile Internetsubscription
penetration (%)
Number of IPv4registrations
per capita
Number of IPv6registrations
per capita
Peak fixed-broadband
connection speed
Average fixed-broadband
connection speed
Peak mobile-connection speed
Average mobile-connection speed
Fixed-broadbandpricing ($ per
month at PPP)
Mobile pricing($ per minute local
call off-net [peak]at PPP)
Traffic volumesper capita
Internationaltraffic volumes
per capita
Exchange pointsper capita
Number ofnetworks (ASNs)
per capita
Content registeredto ccTLD hosted
onshore (%)
Existence ofindependent
regulator
e-Friction Score: 71Rank: 55
INFRASTRUCTURE
Indicator Ranke-Friction score e-Friction score
INDUSTRY
Indicator Rank e-Friction score Rank e-Friction score Rank
INDIVIDUAL
Indicator
INFORMATION
Indicator
Overall Overall Overall Overall
21
41
45*
52
NA
44
47
50
NA
12
50
50
10
64
62
55
61
8
49
NA
58
NA
56
53
65
61
57
60
65
63
62
65
52
58
65
65
64
7
62
NA
62
39
57
NA
64
52
43
53
36
65
NA
NA 1*1*
56
49 64 59 43
Venezuela
Source: BCG e-Friction index model.Note: iPv4 = internet Protocol version 4; iPv6 = internet Protocol version 6; PPP = purchasing power parity; aSn = autonomous system number; ccTlD = country code top-level domain; iCT = information and communications technology; * = discrete scale, with several countries sharing an equal ranking; na = not available. For definitions and source information for each indicator, please see exhibit 3.
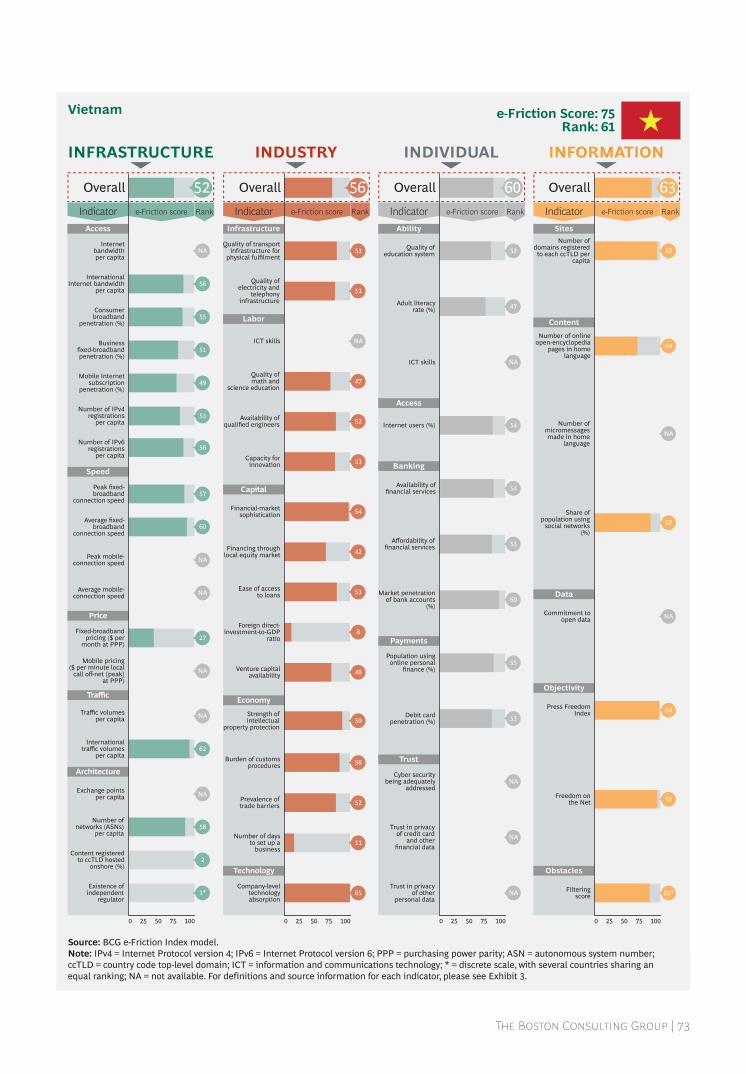
The Boston Consulting Group | 73
Speed
Architecture
Traffic
Price
0 50 7525 100
Infrastructure
Labor
Technology
Economy
Capital
0 50 7525 100
Ability
Access
Trust
Payments
Banking
0 50 7525 100
Sites
Content
Obstacles
Objectivity
Data
0 50 7525 100
Access
Internetbandwidthper capita
Quality of transportinfrastructure for
physical fulfilmentQuality of
education system
Number ofdomains registeredto each ccTLD per
capita
Number of onlineopen-encyclopedia
pages in homelanguage
Number ofmicromessagesmade in home
language
Share ofpopulation using
social networks(%)
Commitment toopen data
Press FreedomIndex
Freedom onthe Net
Filteringscore
Adult literacyrate (%)
ICT skills
Internet users (%)
Availability offinancial services
Affordability offinancial services
Market penetrationof bank accounts
(%)
Population usingonline personal
finance (%)
Debit cardpenetration (%)
Cyber securitybeing adequately
addressed
Trust in privacyof credit card
and otherfinancial data
Trust in privacyof other
personal data
Quality ofelectricity and
telephonyinfrastructure
ICT skills
Quality ofmath and
science education
Availability ofqualified engineers
Capacity forinnovation
Financial-marketsophistication
Financing throughlocal equity market
Ease of accessto loans
Foreign direct-investment-to-GDP
ratio
Venture capitalavailability
Strength ofintellectual
property protection
Burden of customsprocedures
Prevalence oftrade barriers
Number of daysto set up a
business
Company-leveltechnologyabsorption
InternationalInternet bandwidth
per capita
Consumerbroadband
penetration (%)
Businessfixed-broadbandpenetration (%)
Mobile Internetsubscription
penetration (%)
Number of IPv4registrations
per capita
Number of IPv6registrations
per capita
Peak fixed-broadband
connection speed
Average fixed-broadband
connection speed
Peak mobile-connection speed
Average mobile-connection speed
Fixed-broadbandpricing ($ per
month at PPP)
Mobile pricing($ per minute local
call off-net [peak]at PPP)
Traffic volumesper capita
Internationaltraffic volumes
per capita
Exchange pointsper capita
Number ofnetworks (ASNs)
per capita
Content registeredto ccTLD hosted
onshore (%)
Existence ofindependent
regulator
e-Friction Score: 75Rank: 61
INFRASTRUCTURE
Indicator Ranke-Friction score e-Friction score
INDUSTRY
Indicator Rank e-Friction score Rank e-Friction score Rank
INDIVIDUAL
Indicator
INFORMATION
Indicator
Overall Overall Overall Overall
62
44
NA
57
NA
64
63
55*
NA
56
55
51
49
53
56
57
60
NA
NA
27
NA
NA
62
NA
58
2
1*
53
51
NA
47
52
51
64
42
53
48
59
56
52
11
65
8
52
47
NA
54
54
53
60
55
53
NA
NA
NA
52 56 60 63
Vietnam
Source: BCG e-Friction index model.Note: iPv4 = internet Protocol version 4; iPv6 = internet Protocol version 6; PPP = purchasing power parity; aSn = autonomous system number; ccTlD = country code top-level domain; iCT = information and communications technology; * = discrete scale, with several countries sharing an equal ranking; na = not available. For definitions and source information for each indicator, please see exhibit 3.

74 | Greasing the Wheels of the Internet Economy
NOTE TO THE REAdER
About the AuthorsPaul Zwillenberg is a partner and managing director in the london office of The Boston Consulting Group and a leader in the firm’s dig- ital economy initiative. Dominic Field is a partner and managing director in BCG’s london office and the global leader of the firm’s digi-tal economy initiative. David Dean is a senior advisor to BCG and a former senior partner and manag- ing director in the firm’s Technol- ogy, media & Telecommunications practice.
AcknowledgmentsThis report would not have been possible without the efforts of BCG colleagues lauren Daum, Camila Penazzo, and matthew richardson. in addition, the authors are in-debted to Philip evans and to nu-merous other colleagues and exter-nal experts for their support and guidance.
The authors would also like to thank David Duffy for his writing assistance, as well as Katherine andrews, Gary Callahan, angela DiBattista, elyse Friedman, Kim Friedman, abigail Garland, amanda Provost, and Sara Strassenreiter for their help in editing, design, produc-tion, and distribution.
For Further Contactif you would like to discuss this report, please contact one of the authors.
Paul ZwillenbergPartner and Managing DirectorBCG london+44 207 753 [email protected]
Dominic FieldPartner and Managing DirectorBCG london+44 207 753 [email protected]
David DeanSenior AdvisorBCG munich+49 89 231 [email protected]

© The Boston Consulting Group, inc. 2014. all rights reserved.
For information or permission to reprint, please contact BCG at:e-mail: [email protected]: +1 617 850 3901, attention BCG/Permissionsmail: BCG/Permissions The Boston Consulting Group, inc. One Beacon Street Boston, ma 02108 uSa
To find the latest BCG content and register to receive e-alerts on this topic or others, please visit bcgperspectives.com.
Follow bcg.perspectives on Facebook and Twitter.
2/14

Abu DhabiAmsterdamAthensAtlantaAucklandBangkokBarcelonaBeijingBerlinBogotáBostonBrusselsBudapestBuenos AiresCalgaryCanberraCasablanca
ChennaiChicagoCologneCopenhagenDallasDetroitDubaiDüsseldorfFrankfurtGenevaHamburgHelsinkiHo Chi Minh CityHong KongHoustonIstanbulJakarta
JohannesburgKievKuala LumpurLisbonLondonLos AngelesLuandaMadridMelbourneMexico CityMiamiMilanMinneapolisMonterreyMontréalMoscowMumbai
MunichNagoyaNew DelhiNew JerseyNew YorkOsloParisPerthPhiladelphiaPragueRio de JaneiroRomeSan FranciscoSantiagoSão PauloSeattleSeoul
ShanghaiSingaporeStockholmStuttgartSydneyTaipeiTel AvivTokyoTorontoViennaWarsawWashingtonZurich
bcg.com | bcgperspectives.com
Title of publication
Series Title