the demographic challenge to our economic potential chris higgins memorial lecture
DESCRIPTION
The demographic challenge to our economic potential Chris Higgins memorial lecture. Ken Henry Secretary to the Treasury Canberra, 13 November 2002. Unemployment. Per cent. Per cent. 12. 12. 10. 10. 8. 8. 6. 6. 4. 4. 2. 2. 0. 0. 60-61. 64-65. 68-69. 72-73. 76-77. 80-81. - PowerPoint PPT PresentationTRANSCRIPT

DEPARTMENT OF THE TREASURY
The demographic challenge to our economic potential
Chris Higgins memorial lecture
Ken HenrySecretary to the Treasury
Canberra, 13 November 2002

2DEPARTMENT OF THE TREASURY
Unemployment
0
2
4
6
8
10
12
60-61 64-65 68-69 72-73 76-77 80-81 84-85 88-89 92-93 96-97 00-01 04-05 08-09
0
2
4
6
8
10
12Per cent Per cent

3DEPARTMENT OF THE TREASURY
Labour productivity growthwhole economy
0
0.5
1
1.5
2
2.5
3
3.5
1960s 1970s 1980s 1990s
0
0.5
1
1.5
2
2.5
3
3.5
Multi-factor productivityCapital deepening
Per cent Per cent

4DEPARTMENT OF THE TREASURY
Growth prospectsComponents of GDP
Participation
Population
Employment (hours)
Employment (hours)
GDPGDP
Total populationTotal population
Share of population 15+Share of population 15+
Participation rateParticipation rate
Unemployment rateUnemployment rate
Average hours workedAverage hours worked
ProductivityProductivityCapital deepening
Multifactor productivity

5DEPARTMENT OF THE TREASURY
-1
0
1
2
3
4
Population Share ofpopulation 15+
Participationrate
Unemploymentrate
Average hrsworked
Labourproductivity
Real GDP
-1
0
1
2
3
4Percentage contribution Percentage contribution
Components of average annual GDP growth rate over the last 40 years
Population: +2 Participation: - 1/4
11/2
1/2 1/8 -1/8 -1/4
Productivity
2 33/4

6DEPARTMENT OF THE TREASURY
Components of average annual GDP growth rate over the last 40 years
-1
0
1
2
3
4
-1
0
1
2
3
4
Australia USA
Percentage contribution Percentage contribution
Population ParticipationProductivity
2 11/2
-1/4
1/4
2 13/4
33/4 31/2

7DEPARTMENT OF THE TREASURY
Components of average annual GDP growth rate
-1
0
1
2
3
4
Population Share ofpopulation 15+
Participationrate
Unemploymentrate
Average hrsworked
Labourproductivity
Real GDP
-1
0
1
2
3
4
last 40 years next 40 years
Percentage contribution Percentage contribution
Population Participation Productivity
3/41/8
-3/8
13/4
21/4
11/2
1/21/8 -1/8 -1/4
2
33/4

8DEPARTMENT OF THE TREASURY
Growth rates of GDP per capita - Australia past and future
-1
0
1
2
3
4
-1
0
1
2
3
4
Past Future
Percentage contribution Percentage contribution
Population growth
11/2
3/4
33/4
21/4
GDP growth
21/4
11/2
GDP per capita growth
less equals
Over 40 years, 3/4 percentage points a year compounds to a third.
9DEPARTMENT OF THE TREASURY
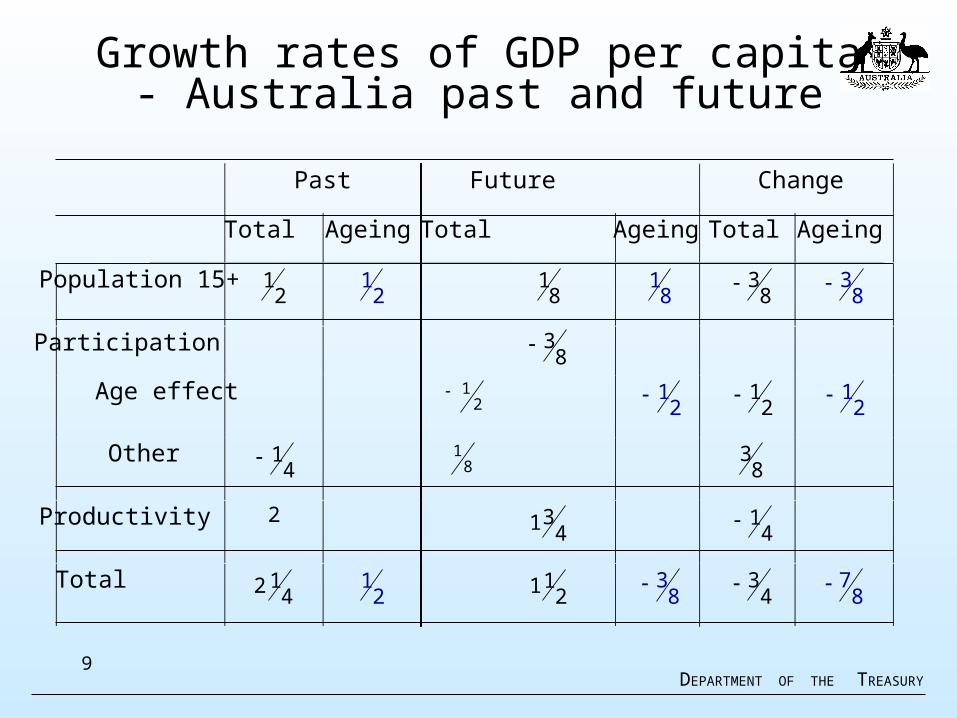
Growth rates of GDP per capita - Australia past and future
Past Future Change
Total Ageing Total Ageing Total Ageing
Population 15+2
18
18
3
Participation
Age effect2
12
1
Other4
1 81
83
Productivity 24
31 41
Total4
12
21
21
211
81
21
83
43
83
21
87
83

10DEPARTMENT OF THE TREASURY
Simple demographic model
AssumptionsChildren aged 0-20Young workers aged 20-40
Older workers aged 40 - 60Retirees aged 60-80
No deaths before age 80
Half of births are female
Only females aged 20-40 give birth
No immigration

11DEPARTMENT OF THE TREASURY
Fertility rate of 2.0
1947 to 1967
1967 to 1987
1987 to 2007
Fertility rate 2.0 2.0 2.0
Children 2.0 2.0 2.0
Young workers 2.0
Older workers 2.0
Retirees 2.0
Total 8.0 8.0 8.0
Dependency ratiosYouth 50.0% 50.0% 50.0%Age 50.0% 50.0% 50.0%
Worker ratio 50.0% 50.0% 50.0%
2.0
2.0
2.0 2.0
2.0
2.0

12DEPARTMENT OF THE TREASURY
Fertility rate of 2.8
1947 to 1967
1967 to 1987
1987 to 2007
Fertility rate 2.8 2.8 2.8
Children 2.8 3.9 5.5
Young workers 2.0
Older workers 1.4
Retirees 1.0
Total 7.2 10.1 14.2
Dependency ratiosYouth 81.7% 81.7% 81.7%Age 29.8% 29.8% 29.8%
Worker ratio 47.3% 47.3% 47.3%
2.0
1.4
2.8 3.9
2.8
2.0

13DEPARTMENT OF THE TREASURY
Fertility rate of 1.7
1947 to 1967
1967 to 1987
1987 to 2007
Fertility rate 1.7 1.7 1.7
Children 1.7 1.4 1.2
Young workers 2.0
Older workers 2.4
Retirees 2.8
Total 8.8 7.5 6.4
Dependency ratiosYouth 39.1% 39.1% 39.1%Age 63.6% 63.6% 63.6%
Worker ratio 49.3% 49.3% 49.3%
2.0
2.4
1.7 1.4
1.7
2.0

14DEPARTMENT OF THE TREASURY
Steady state dependency and‘worker ratios’
Fertility rate 1.7 2.0 2.8
Dependency ratios
Youth 39.1% 50.0% 81.7%Age 63.6% 50.0% 29.8%
Worker ratio 49.3% 50.0% 47.3%

15DEPARTMENT OF THE TREASURY
Fertility rates - steady state choicesRatio of workers to total population
40.0%
42.0%
44.0%
46.0%
48.0%
50.0%
52.0%
54.0%
56.0%
58.0%
60.0%
0.5
0.9
1.3
1.7
2.1
2.5
2.9
3.3
3.7
Fertility rate
A
4.2%
D 1.4%
2.0 2.81.7
G
not

16DEPARTMENT OF THE TREASURY
Stylised population distribution
-
1.0
2.0
3.0
4.0
1947 to 1967 - fertility rate is 2.8
Baby boomers
KidsYoung
workersOlder
workersRetirees
2.8 2.0 1.4 1.0 7.2
Total
Worker ratio 47.3%Age dependency ratio 29.8%
Youth dependency ratio 81.7%
Number of workers 3.4

17DEPARTMENT OF THE TREASURY
Stylised population distribution
-
1.0
2.0
3.0
4.0
2.8 2.0 1.4
KidsYoung
workersOlder
workersRetirees
1967 to 1987 - fertility rate is 1.7
8.6
Total
Baby boomers
2.4
4.8Worker ratio 55.8%Age dependency ratio 29.8%Youth dependency ratio 49.6%
Number of workers

18DEPARTMENT OF THE TREASURY
Stylised population distribution
-
1.0
2.0
3.0
4.0
2.0 2.4 2.8 2.0
KidsYoung
workersOlder
workersRetirees
1987 to 2007 - fertility rate is 1.7
9.2
Total
Baby boomers
Worker ratio 56.3%Age dependency ratio 38.6%Youth dependency ratio 39.1%
Number of workers 5.2

19DEPARTMENT OF THE TREASURY
Stylised population distribution
-
1.0
2.0
3.0
4.0
1.7 2.0 2.4 2.8
KidsYoung
workersOlder
workersRetirees
2007 to 2027 - fertility rate is 1.7
8.9
Total
Baby boomers
Worker ratio 49.3%Age dependency ratio 63.6%Youth dependency ratio 39.1%
Number of workers 4.4

20DEPARTMENT OF THE TREASURY
Fertility rates adjustment pathsRatio of workers to total population
40.0%
42.0%
44.0%
46.0%
48.0%
50.0%
52.0%
54.0%
56.0%
58.0%
60.0%
0.5
0.9
1.3
1.7
2.1
2.5
2.9
3.3
3.7
Fertility rate
A
18%
19%
4.2%
F
B
C
D
E
G 1.4%
2.0 2.81.7

21DEPARTMENT OF THE TREASURY
Ratio of workers to total population
57%
59%
61%
63%
65%
67%
69%
20
00
20
02
20
04
20
06
20
08
20
10
20
12
20
14
20
16
20
18
20
20
20
22
20
24
20
26
20
28
20
30
20
32
20
34
20
36
20
38
20
40
20
42
20
44
20
46
20
48
20
50
20
52
20
54
20
56
20
58
20
60
20
62
20
64
20
66
20
68
20
70
20
72
TFR = 1.74 TFR=2.1

DEPARTMENT OF THE TREASURY
Background slides

23DEPARTMENT OF THE TREASURY
Population growth rate
0.0
0.5
1.0
1.5
2.0
2.5
60-61 63-64 66-67 69-70 72-73 75-76 78-79 81-82 84-85 87-88 90-91 93-94 96-97 99-00
0.0
0.5
1.0
1.5
2.0
2.5Per cent Per cent

24DEPARTMENT OF THE TREASURY
Fertility rate
1.6
1.8
2.0
2.2
2.4
2.6
2.8
1972 1976 1980 1984 1988 1992 1996 2000
1.6
1.8
2.0
2.2
2.4
2.6
2.8
Replacement rate
Total fertility rate Total fertility rate

25DEPARTMENT OF THE TREASURY
Net migration
0
20
40
60
80
100
120
140
160
180
200
1954 1959 1964 1969 1974 1979 1984 1989 1994 1999
0
20
40
60
80
100
120
140
160
180
200Persons ('000) Persons ('000)

26DEPARTMENT OF THE TREASURY
Population growth rate projections
0.0
0.5
1.0
1.5
2.0
2.5
60-61 67-68 74-75 81-82 88-89 95-96 02-03 09-10 16-17 23-24 30-31 37-38
0.0
0.5
1.0
1.5
2.0
2.5Per cent Per cent
IGR projections
ContinueContinue

27DEPARTMENT OF THE TREASURY
Proportion of the population aged 15+
0
10
20
30
40
50
60
70
80
90
60-61 63-64 66-67 69-70 72-73 75-76 78-79 81-82 84-85 87-88 90-91 93-94 96-97 99-00
0
10
20
30
40
50
60
70
80
90Per cent Per cent

28DEPARTMENT OF THE TREASURY
Population 15+ - projections
0
10
20
30
40
50
60
70
80
90
60-61 67-68 74-75 81-82 88-89 95-96 02-03 09-10 16-17 23-24 30-31 37-38
0
10
20
30
40
50
60
70
80
90Per cent Per cent
IGR projections

29DEPARTMENT OF THE TREASURY
Population ageing
0
50
100
150
200
250
300
350
400
450
0 to 14 15 to 54 55 to 64 65 to 84 85+ Total
0
50
100
150
200
250
300
350
400
450
2002 2022 2042
Index value (2002 base=100) Index value (2002 base=100)
ContinueContinue

30DEPARTMENT OF THE TREASURY
Participation rate
50
52
54
56
58
60
62
64
66
68
60-61 63-64 66-67 69-70 72-73 75-76 78-79 81-82 84-85 87-88 90-91 93-94 96-97 99-00
50
52
54
56
58
60
62
64
66
68Per cent Per cent

31DEPARTMENT OF THE TREASURY
Participation rate projections
50
52
54
56
58
60
62
64
66
68
60-61 67-68 74-75 81-82 88-89 95-96 02-03 09-10 16-17 23-24 30-31 37-38
50
52
54
56
58
60
62
64
66
68Per cent Per cent
IGR projections
With 2000-01 age structure
With changing age structure
ContinueContinue

32DEPARTMENT OF THE TREASURY
Unemployment - past and projected
0
2
4
6
8
10
12
60-61 64-65 68-69 72-73 76-77 80-81 84-85 88-89 92-93 96-97 00-01 04-05 08-09
0
2
4
6
8
10
12Per cent Per cent
IGR projections
ContinueContinue

33DEPARTMENT OF THE TREASURY
Average hours worked
31
32
33
34
35
36
37
38
39
40
60-61 64-65 68-69 72-73 76-77 80-81 84-85 88-89 92-93 96-97 00-01 04-05 08-09
31
32
33
34
35
36
37
38
39
40Hours per week Hours per week
ContinueContinue

34DEPARTMENT OF THE TREASURY
Labour productivity growth - past and projected
0
0.5
1
1.5
2
2.5
3
3.5
1960s 1970s 1980s 1990s 2000s 2010s
0
0.5
1
1.5
2
2.5
3
3.5
Multi-factor productivity Capital deepening Labour productivity
Per cent Per cent
IGR projections
ContinueContinue