the demography of victorian england and walescatdir.loc.gov/catdir/samples/cam031/2001268297.pdf ·...
TRANSCRIPT

The Demographyof Victorian
England and Wales
ROBERT WOODSUniversity of Liverpool
published by the press syndicate of the university of cambridgeThe Pitt Building, Trumpington Street, Cambridge, United Kingdom
cambridge university pressThe Edinburgh Building, Cambridge cb2 2ru, UK www.cup.cam.ac.uk
40 West 20th Street, New York, ny 10011-4211, USA www.cup.org10 Stamford Road, Oakleigh, Melbourne 3166, Australia
Ruiz de Alarcón 13, 28014 Madrid, Spain
© Robert Woods 2000
This book is in copyright. Subject to statutory exceptionand to the provisions of relevant collective licensing agreements,
no reproduction of any part may take place withoutthe written permission of Cambridge University Press.
First published 2000
Printed in the United Kingdom at the University Press, Cambridge
Typeface Adobe Palatino 10/12 pt. System QuarkXPress™ [se ]
A catalogue record for this book is available from the British Library
isbn 0 521 78254 6 hardback
Contents
List of figures page ixList of tables xixPreface xxiii
11 Bricks without straw, bones without flesh 1True facts 3Systems 10Transitions 15Time and space 21
12 Vital statistics 31Contents of the Annual Reports 33The quality of registration 38Detection without correction 47
13 Whatever happened to the preventive check? 71The European marriage pattern in the nineteenth century 72Nuptiality patterns in England and Wales 81The effects of urbanisation, migration and occupational
specialisation on nuptiality 88Local studies 95The influence of marriage patterns on illegitimate fertility 101The Victorian marriage pattern and its antecedents 107
14 Family limitation 110Transition theory 112Social diffusion 114Contraceptive revolution? 122Coale and Trussell: stopping or spacing? 124Illegitimate fertility 140Demographic balance 143Preconditions 144Empirical relationships 150Why there are still no firm conclusions 165
vii
15 The laws of vitality 170Age 170Farr’s law 190
16 Mortality by occupation and social group 203The official reporting of occupational mortality in Victorian
England 210Mortality among occupations 214Two dangerous trades: medicine and mining 230The social class gradient of male mortality – the interplay of
occupational, economic, environmental and selective factors 240
17 The origins of the secular decline of childhood mortality 247The characteristics of childhood mortality in Victorian England
and Wales 250The childhood mortality problem: contemporary and recent
approaches 280Fertility and infant mortality 295Poverty, female education, fertility and childhood mortality 300Some preliminary conclusions 304
18 Places and causes 310Causes of death 312Crowding 317Water 325Air 331Phthisis 332Composite disease environments 341The McKeown interpretation further confounded 344
19 The demographic consequences of urbanisation 360
10 The transformation of the English and other demographicregimes 381
11 Conclusions and unresolved conundrums 400
Bibliography 411Index 440
viii Contents

Figures
Note: Figures on pages a–p are in the colour section, between pages96 and 97.
1.1 Long-run trends in mortality and fertility in England and Wales page 6
1.2 Timepath for fertility and mortality change in Englandand Wales, decades 1580s to 1980s 7
1.3 Examples of demographic systems models for Englandand Wales 12
1.4 Three early diagrammatic representations of thedemographic transition in England and Wales 17
1.5 A simple model of the factors affecting mortality levels 272.1 The 614 districts of England and Wales 392.2 Estimates of birth inflation factors for England and Wales
by Farr, Glass and Teitelbaum 422.3 Birth inflation factors for registration counties of England
and Wales, 1851–60 against 1841–50 442.4 Trends in birth inflation factors for selected registration
counties 462.5 The number of births, deaths and marriages registered
per year, 1838–1913, and the enumerated population,1801–1911, England and Wales 48
2.6 Natural increase (births – deaths) and emigration per year,England and Wales, 1838–1913 48
2.7 Estimates of net migration per year, England and Wales,1838–1913 49
2.8 Annual sex ratio at birth (SRB), England and Wales,1838–1913 52
2.9 The number of legitimate and illegitimate births registeredper year, England and Wales, 1845–1913 53
ix

2.10 Long-term trends in the sex ratio at birth (SRB), Englandand Wales, 1846–51 to 1976–80 54
2.11 Comparison of early age mortality curves for England,1725–49, 1800–24 and 1825–37, with the Third English LifeTable (ELT 3) for 1838–54, a Healthy Districts Life Table(63 HDs) for 1849–53, and England and Wales urbancounties (1905 Urban) and rural counties (1905 Rural) for1905 59
2.12 Comparison of early age mortality curves for Liverpool,London and Surrey in 1841 61
2.13 The relationship between neonatal mortality, infantmortality rate and endogenous mortality among the 45registration counties of England and Wales, 1839–44 65
2.14 Comparison of early age mortality curves for the WestRiding, Lancashire, Middlesex and Cornwall, 1839–44 66
2.15 Number of males and females enumerated by single yearsof age in the 1911 census, England and Wales 67
2.16 Number of single and married males and femalesenumerated by single years of age 0 to 50 in the 1911census, England and Wales 68
2.17 Relative deviations from trend by enumerated totalpopulation and registered deaths, England and Wales, 1911 69
2.18 Probability of survival from birth to age x in 1911, Englandand Wales 70
3.1 Timepath for change in the annual crude birth and deathrates, Norway, 1735–1975 75
3.2 Regional timepaths for change in marital fertility andnuptiality, Spain, 1787, 1797, 1887, 1900 and 1910 78
3.3 Timepath for change in marital fertility (Ig) and nuptiality(Im), Denmark, 1787–1970 79
3.4 Timepath for change in marital fertility (Ig) and nuptiality(Im), France, 1741–45 to 1931–35 80
3.5 Timepath for the relationship between proportion marriedand mean age at marriage, England, 1576–1600 to 1826–50,and England and Wales, 1851–1931 82
3.6 Timepath for change in marital fertility (Ig) and nuptiality(Im), England, 1551–75 to 1951–75 83
3.7 Examples of regional variations in the timepaths for changein marital fertility (Ig) and nuptiality (Im), Scotland,1861–1931, England and Wales, 1851–1931 85
3.8 Variations in Im among the districts of England and Wales,1861, 1891 and 1911 a
x List of figures

3.9 Relationship between percentage of women never marriedaged 45–49 and the singulate mean age at marriage forwomen distinguishing categories of Im, Germanadministrative areas in 1880 88
3.10 Time-series for Im, the mean age at first marriage forfemales, the proportion of females marrying aged under 21,and the proportions of females ever-married at age 50 andcurrently married at age 50, Denmark and England andWales in the nineteenth century 89
3.11 Variations in Im residuals among the districts of Englandand Wales, 1861, 1891 and 1911 b
3.12 Changing relationship between marital fertility (Ig) andnuptiality (Im), London districts, 1861, 1891 and 1911 97
3.13 Relative age distribution of unmarried and married womenemployed in textile manufacture, Keighley, West Riding ofYorkshire, 1861 100
3.14 Hypothetical relationship between illegitimate fertility andnuptiality 102
3.15 Relationship between illegitimate fertility (Ih) andnuptiality (Im) among English and Welsh districts, 1861and 1911 103
3.16 Timepaths for change in nuptiality (Im) and illegitimatefertility (Ih), Denmark, 1787–1970, and England, 1551–75 to1951–75 104
3.17 Relationship between illegitimate fertility (Ih) andnuptiality (Im), selected countries of Europe 105
3.18 Variations in mean age at first marriage among ten Englishparishes, 1551–1837 108
4.1 Fertility of women aged 45 and over in 1911 disaggregatedby date of and age at marriage, all married couples,England and Wales: (a) children born per married couple(average parity), (b) surviving children per married couple 117
4.2 Fertility of married women with husbands in selected‘Social Classes’, England and Wales 120
4.3 Children born per married couple in three occupationalgroups: physicians, surgeons and registered practitioners;farmers and graziers; and coal and shale miners at the face,England and Wales 121
4.4 Examples of natural fertility 1264.5 British fertility standard (nB(a)) with –vB(a) derived by
letting rB(a) be the age-specific marital fertility schedule forEngland and Wales, 1938 131
List of figures xi
4.6 Generalised relationships between the index of familylimitation (m), the percentage of married women practisingcontraception, and the index of marital fertility (Ig), basedon the experiences of Sweden and Thailand 133
4.7 British fertility standards (nB(a) and rB(a)) compared withfertility schedules drawn from selected marriage cohorts forthree Kent parishes; Colyton, Devon; and 14 German villages 135
4.8 Age-specific marital fertility schedules for Sweden, 1750–59to 1950–59 136
4.9 Indexed (1871–805100) age-specific marital andillegitimate fertility rates, Sweden, 1871–80 to 1931–40 138
4.10 The relationship between selected age-specific maritalfertility schedules and the British fertility standard 139
4.11 The changing relationship between Ig and Ih, English andWelsh districts, 1861 and 1911 142
4.12 Variations in Ih among the districts of England and Wales,1861, 1891 and 1911 c
4.13 Percentage of partners signing the marriage register,England, 1754–1901 148
4.14 Variations in the percentage of brides signing the marriageregister and literacy residuals among the districts ofEngland and Wales, 1861 d
4.15 Variations in estimates of the total fertility rate (TFR)among the districts of England and Wales, 1861, 1891and 1911 e
4.16 Variations in If among the districts of England and Wales,1861, 1891 and 1911 f
4.17 Variations in Ig among the districts of England and Wales,1861, 1891 and 1911 g
4.18 Changes in the distribution of Ig and Im, English and Welshdistricts, 1861, 1891 and 1911 154
4.19 Percentage of the population of England and Wales livingin districts with different levels of Ig and Ih, 1861, 1891 and1911 156
4.20 Variations in Ig residuals among the districts of Englandand Wales, 1891 urban and 1911 rural h
4.21 Time-series for marital fertility, literacy, real wage andsecularisation indices, England and Wales 166
5.1 Illustration of T. R. Edmonds’s law of mortality using hisMean mortality for England and Wales 177
5.2 The probability of dying by single years of age (qx) from
xii List of figures

English Life Tables 1 (1841), 3 (1838–54) and 7 (1901–10) forfemales compared with Edmonds’s theory 181
5.3 The age pattern of mortality decline shown by the ratio ofqxs (ELT 6/ELT 3), males and females combined 182
5.4 Location of the 63 districts selected for Farr’s HealthyDistricts Life Table 1, 1849–53 183
5.5 The probability of dying by single years of age,comparison of English Life Table 3 (1838–54) and HealthyDistricts Life Table 1 (1849–53) 184
5.6 Ratio of national to healthy districts qxs for ELT 3 andHDLT 1 for the 1840s, and ELT 6 and HDLT 2 for the 1890s 185
5.7 Trends in selected annual age-specific mortality rates(0–4, 15–19, 25–34, 55–64), England and Wales, 1838–1913 186
5.8 Ratio of male to female qxs from ELT 3 and HDLT 1 1875.9 Trends in the ratio of male to female annual mortality rates
for selected ages (0–4, 15–19, 25–34, 55–64), England andWales, 1838–1913 188
5.10 Age-related mortality and sickness curves, England andWales 189
5.11 Illustration of Farr’s law for the 593 registration districtsof England and Wales (excluding London), 1861–70 192
5.12 The association between life expectancy at birth andpopulation density among English and Welsh districts forthe five decades 1851–60 to 1891–1900 193
5.13 The association between life expectancy at birth andpopulation density among the 103 most populous districtsof England and Wales 196
5.14 The association between life expectancy at birth andpopulation density among the most populous districts ofEngland and Wales 197
5.15 The association between partial life expectancy ages 25–65and population density among English and Welsh districtsfor the five decades 1851–60 to 1891–1900 198
5.16 Relationship between percentage change between the1860s and the 1890s in life expectancy at birth and partiallife expectancy ages 25–65 and population density amongthe districts of England and Wales 199
5.17 Variations in life expectancy at birth in years (e0) amongthe districts of England and Wales, 1851–60 to 1891–1900 i
5.18 Variations in partial life expectancy in years between ages25 and 65 (e25–65) among the districts of England and Wales,1851–60 to 1891–1900 j
List of figures xiii

5.19 Variations in residuals expressing mortality differentialsbetween males and females among the districts of Englandand Wales, 1861–70 and 1891–1900 k
6.1 The social class mortality gradient in England and Wales:(a) SMRs for age group 25–64, 1921–23 and 1930–32; (b)indexed SMRs for occupied and retired men, 1910–12, andlegitimate infant mortality rates (IMRs), 1911; (c) SMRs foroccupied and retired men, 1930–32, where length of linerepresents relative size of group 207
6.2 Variations in life expectancy at age 20 among men,England and Wales, 1831–1931 217
6.3 A framework for describing the age composition ofmortality change among 71 occupations 219
6.4 Age composition of mortality change among 71occupations 220
6.5 Age composition of mortality change among fouroccupations: clergymen, doctors, file makers and potters 221
6.6 Trends in age-specific mortality differentials (log variance)among 71 occupations 223
6.7 Variations in life expectancy at age 20 among malemembers of selected professional occupations 228
6.8 Variations in life expectancy at age 20 among male members of selected shopkeeping occupations 229
6.9 Variations in life expectancy at age 20 among malemembers of selected clerical occupations 230
6.10 Variations in life expectancy at age 20 among malemembers of selected mining occupations 231
6.11 Variations in life expectancy at age 20 among malemembers of selected occupations engaged in theproduction or sale of alcohol 232
6.12 Variations in life expectancy at age 20 among malemembers of selected skilled trades 233
6.13 Social group-specific variations in life expectancy at age20 among men, England and Wales 235
6.14 The Victorian social mortality gradient 2366.15 Partial life expectancy between ages 25 and 65 in years
among all men and members of the medical profession,England and Wales 238
6.16 The relationship between partial life expectancy betweenages 25 and 65 for males and the legitimate infantmortality rate among 71 occupations, England and Wales 243
6.17 The social mortality gradient in England and Wales c. 1911 245
xiv List of figures

7.1 Approximate trends in the childhood mortality rate and theratio of infant to early childhood mortality, England andWales, 1580s to 1940s 252
7.2 Annual infant mortality rate (IMR, 0) and early childhoodmortality rate (ECMR, 1–4) series, England and Wales,1841–1940 253
7.3 Estimates of infant and early childhood mortality ratesbased on parish register data compared with those basedon civil registration data post-1841 255
7.4 Cumulative mortality rate from 28 weeks gestation to fiveyears generalised for Victorian England and Walescomparing urban and rural places 261
7.5 Variations in the infant mortality rate (IMR) among thedistricts of England and Wales, 1851–60 to 1901–10 l
7.6 Variations in the early childhood mortality rate (ECMR,ages 1–4) among the districts of England and Wales,1851–60 to 1901–10 m
7.7 Changes in class-specific legitimate infant mortality rates,England and Wales 265
7.8 Social class differentials in legitimate infant mortality ratedistinguished by broad cause of death categories, Englandand Wales, 1911 268
7.9 Cause- and age-specific mortality rates for males, Englandand Wales, 1861–70 272
7.10 Cause- and age-specific mortality rates for males, Englandand Wales, 1901–10 273
7.11 Annual premature birth infant mortality rates, Englandand Wales, 1860–1913 274
7.12 Time-series for selected annual infant mortality rates,England and Wales, London and Birmingham compared 275
7.13 Relationship between infant mortality and parity,Sundsvall, Sweden, nineteenth century 277
7.14 Relationship between infant mortality and maternal ageand parity, eight United States cities, 1916–18 278
7.15 Revised version of the Mosley–Chen framework forstudying the factors affecting childhood mortality 293
7.16 Time-series for selected annual mortality and fertilityrates, England and Wales 297
7.17 Path models of the effects of fertility, female education,poverty and population density on variations in infantmortality (non-diarrhoeal infant mortality rate, 1901–10),among the districts of England and Wales 302
List of figures xv
8.1 Copy of a medical cause of death certificate used in the1850s 313
8.2 Age-specific mortality patterns from selected causesamong females, England and Wales, 1861–70 317
8.3 Change in age-specific mortality patterns from selectedcauses among females, England and Wales, 1861–70 to1891–1900 318
8.4 Relationship between Measles and Diseases of the Lungearly childhood mortality rate and population density,English and Welsh districts, 1861–70 and 1891–1900 324
8.5 Relationship between Scarlet fever early childhoodmortality rate and population density, English and Welshdistricts, 1861–70 and 1891–1900 326
8.6 Relationship between Diarrhoea & Dysentery infantmortality rate and population density, English and Welshdistricts, 1861–70 and 1891–1900 328
8.7 Relationship between Diarrhoea & Dysentery infantmortality rate and mortality rate ages 65–74 andpopulation density, English and Welsh districts, 1861–70 329
8.8 Variations in Diarrhoea & Dysentery mortality rates amonghigh population density districts, England and Wales,1861–70 330
8.9 Relationship between Diarrhoea & Dysentery mortalityrate and Diseases of the Lung mortality rate ages 65–74 andpopulation density, English and Welsh districts, 1861–70 333
8.10 Ratio of age-specific mortality rates among females forDiseases of the Lung or Respiratory system and Diarrhoea& Dysentery, England and Wales to those for London,1861–70 and 1891–1900 334
8.11 Relationship between Phthisis early adult mortality rateand population density, English and Welsh districts,1861–70 and 1891–1900 337
8.12 Disease environments defined using Z-scores, English andWelsh districts 343
8.13 Variations in disease Z-scores among the districts ofEngland and Wales n
8.14 Life expectancy at birth among English and Welsh districtsgrouped by disease environment 345
8.15 Classification of disease environments, English and Welshdistricts o
8.16 Percentage contribution to changes in cause-specificmortality, England and Wales, 1861–70 to 1891–1900 353
xvi List of figures

8.17 Comparison of contributions to mortality decline fromthree causes of death, England and Wales, 1861–70 to1891–1900 355
8.18 The location of the 53 districts contributing in sum 50per cent of the decline in deaths from Diarrhoea & Typhus(Contribution) and residuals from the regression ofproportionate contribution to decline on proportion ofpopulation of England and Wales in each district(Performance) p
8.19 Relationship between proportionate contribution to thedecline of deaths from Diarrhoea & Typhus (Contribution)and the residuals from the regression of that proportionatecontribution on the proportionate population size amongthe districts of England and Wales (Performance) 357
9.1 Relationship between population density (persons persq. km) and population size among the 614 English andWelsh districts 363
9.2 Relationship between population size, population densityand life expectancy at birth among English and Welshdistricts, 1851–60 364
9.3 Timepath for the changing relationship between childhoodmortality and life expectancy at birth, England and Wales,1801–10 to 1901–10 367
9.4 Estimates of life expectancy at birth for urban and ruralareas of England and Wales, 1801–10 to 1901–10 371
9.5 Estimates of childhood mortality rate for urban and ruralareas of England and Wales, 1801–10 to 1901–10 372
9.6 Variations in the relationship between life expectancy atbirth and childhood mortality rate among estimates forurban and rural areas of England and Wales 375
9.7 Differences in terms of life expectancy at birth betweenlarge towns and rural areas of England and Wales, 1801–10to 1901–10 376
9.8 Relationship between population density (a) and lifeexpectancy at birth (b) with distance from the centre ofLondon 377
9.9 Percentage population change and percentage change in lifeexpectancy at birth with distance from the centre of London 379
10.1 Contemporary international variations in fertility andchildhood mortality c. 1990 391
10.2 Variations in fertility and childhood mortality among thedistricts of England and Wales, 1861–70 and 1901–10 392
List of figures xvii

10.3 Timepaths for fertility and childhood mortality changes inselected populations 394
10.4 Timepaths for fertility and childhood mortality changes in Japan 395
10.5 Contemporary variations in fertility and childhoodmortality among African provinces and the timepath forKenya, 1940–93 398
xviii List of figures

Tables
1.1 Hajnal’s rules for the formation of household systems inpre-industrial societies 23
2.1 The balance of population change, England and Wales,1838–1913 50
2.2 Birth inflation factors, sex ratios and infant mortalitymeasures for the registration counties of England and Wales 62
3.1 Mean age at first marriage for selected occupations,England and Wales, 1884–85 86
3.2 Definitions of variables used in multiple regressionanalysis of Im 91
3.3 Summary of results for stepwise multiple regressionanalysis on variations in the index of proportion married(Im) for 590 districts, England and Wales, 1861, 1891 and1911 92
3.4 Percentage ever-married by age 30 in 1861 and Im for 1861,1891 and 1911, selected English districts 99
4.1 Average parities for ‘Social Classes’, England and Wales 1184.2 British standard fertility schedules and age-specific
marital fertility rates for England and Wales 1304.3 Age-specific marital fertility schedules (r(a)) for three Kent
parishes 1344.4 Associations between average and effective parities of
women aged 45 and over in 1911 based on 200 occupationsin the 1911 Census of Fertility 145
4.5 Definitions of variables used in multiple regressionanalysis of Ig 157
4.6 Summary of results for stepwise multiple regressionanalysis on variations in the index of marital fertility (Ig)for 590 districts, England and Wales, 1861, 1891 and 1911 159
xix

4.7 Summary of results for stepwise multiple regressionanalysis on variations in the index of marital fertility (Ig)for 222 urban districts, England and Wales, 1861, 1891 and1911 160
4.8 Summary of results for stepwise multiple regressionanalysis on variations in the index of marital fertility (Ig)for 368 rural districts, England and Wales, 1861, 1891 and1911 161
5.1 The principal publications of T. R. Edmonds on the subjectof health and mortality 174
5.2 T. R. Edmonds’s rate of mortality constants for specifiedage ranges and minimum mortality rates for various lifetable populations 176
5.3 The changing association between life expectancy in years(y) and population density measured by persons per sq.km or population size (x) among 614 English and Welshdistricts using the equation y5a2blogx 194
5.4 Variations in the level of mortality among the 614 districtsof England and Wales, 1851–60 to 1891–1900 201
6.1 Comparison of social differences in mortality levels innineteenth-century England and Wales 209
6.2 Data on occupational mortality in the Supplements to theRegistrar General’s Annual Reports 212
6.3 Standardised mortality ratios (SMRs) for men, Englandand Wales 215
6.4 Probabilities of dying in ten-year age groups among allmen aged 25–64 in England and Wales and men in 71occupations 216
6.5 Inequalities in age-specific mortality among 71occupations measured by log variance and the coefficientof variation for the partial life expectancy between ages25 and 65 222
6.6 Estimates of male life expectancy at age 20 in years for 71occupations, England and Wales 224
6.7 Measures of mortality for five social groups and theirconstituent male occupations, England and Wales 234
6.8 Estimates of partial life expectancy between ages 25 and65 in years among members of the medical profession,England and Wales 237
6.9 Estimates of partial life expectancy between ages 25 and65 in years among miners and non-miners in 19registration districts of England and Wales, 1849–53 240
xx List of tables
6.10 Estimated excess mortality experienced by certainoccupations, England and Wales, c. 1911 244
7.1 Causes of death in infancy in three towns and three ruralcounties of England, 1889–91 258
7.2 Infant life tables for Victorian England and Wales, ‘rural’and ‘urban’ places 260
7.3 Estimates of legitimate infant mortality rates for ‘SocialClasses’, England and Wales 264
7.4 Variations in legitimate infant mortality rates within the1911 ‘Social Classes’ 267
7.5 A summary of the factors influencing infant mortalityproposed by Sir Arthur Newsholme 282
7.6 Methods of infant feeding in selected English towns in the1900s 287
7.7 Method of infant feeding by age groups in selectedEnglish towns 288
7.8 Duration of breastfeeding in Salford, 1908–10 2897.9 Definitions of variables used in infant mortality path
analysis model 3018.1 Nosologies used in Registrars General Decennial
Supplements to report cause of death for registrationdistricts, England and Wales, 1851–60 to 1901–10 314
8.2 Effects of measles attack and fatality rates on 100,000births illustrated by the case of Aberdeen, 1883–1902 322
8.3 Associations between selected mortality variables amongthe 614 districts of England and Wales 325
8.4 Classification of English and Welsh districts on the basisof disease environments 344
8.5 McKeown’s table of the mean annual standardisedmortality rates per million living due to certaincommunicable diseases, England and Wales, 1851–60 and1891–1900 346
8.6 Combinations of causes of death used in the RegistrarGeneral’s Decennial Supplements for England and Wales 349
8.7 Alternative approaches to the measurement of changes incause-specific mortality, England and Wales, 1861–70 and1891–1900 350
9.1 Percentage of the population of England and Wales livingin towns and rural areas, 1701–1951 362
9.2 Probability distributions of the population of Englandand Wales among categories of urban places arranged bysize 362
List of tables xxi
9.3 Estimates of life expectancy at birth and childhoodmortality for England and Wales and London 365
9.4 Estimates of life expectancy at birth and childhoodmortality rates for categories of urban places arranged bysize, England and Wales 369
10.1 The elements of historical demographic regimes 384
xxii List of tables
1
Bricks without straw, bones without flesh
Demographers are more akin to hedgehogs than foxes. They possess aparticular unifying principle and relate everything to a single centralvision. The foxes, on the other hand, think in a diffuse fashion: theymove on many levels collecting objects and experiences withoutseeking to fit them into any form of all-embracing scheme.1
Demographers are like hedgehogs in another sense: they tend to rely onone highly effective strategy for survival against which the cunning offoxes will usually fail. The unifying principle is the notion of the demo-graphic system and transition, while the survival strategy involvesquantification within an empiricist-positivist methodology.
Although this caricature cannot do justice to the contributions ofdemographers, it nonetheless highlights certain important character-istics about the way questions are asked and answers attempted.Philosophical introspection is rarely indulged in and thoughts on whatmight be an appropriate epistemology for demography are not aired.Even among historical demographers, at least some of whom have beendrawn from the ranks of history and geography where disciplinary self-doubt has been rife,2 there is a quiet contentment with very specific linesof enquiry in which the first step invariably involves the measurementand description of a certain set of events: birth, marriage, death, migra-tion. This is usually followed by the search for some form of demo-graphic order, pattern recognition and modelling. Finally, explanationor interpretation is attempted although this may take many formsvarying from formal hypothesis testing to ‘thick description’. Whateverthe finer points of the approach there is always a sense in which it isbetter to practise, to engage with the materials of demography, than to
1
11 Berlin (1953). Of course Berlin was not thinking of demographers as such when he drewthis distinction. 12 See, for example, Evans (1997).

enter the methodological and ideological debates.3 This account of thedemography of Victorian England and Wales will be no exception. Itfollows the lead given by The Population of India and Pakistan, ThePopulation of Japan and The Demography of Tropical Africa4 in that it willprovide a detailed description via demographic measures of changesand especially variations in nuptiality, fertility and mortality. It will alsooffer some lines of interpretation based, as far as is possible, on the avail-able empirical evidence. There will be a place for speculation and con-jecture where, as often happens, the evidence appears unsound or theresimply is none. The approach adopted is also multi-disciplinary; nosingle perspective dominates although in places there are contributionswhich statisticians, economists, sociologists, geographers and epidemi-ologists, as well as several branches of history, would certainly recog-nise as their own. It is true that our understanding of nineteenth-centurydemography is still in a state of flux. There are many unanswered ques-tions especially relating to the causes of change whether economic andtechnological, social and cultural; the extent to which Victorians gainedmore control of their everyday lives must be set against the increasingrole of the state, both national and local, and its power to intervene andregulate, to initiate change through public policy. Similar tensions andconfusions exist in attempts to set the forces for integration and confor-mity against those which encouraged diversity and variation – forexample, those that exacerbated inequalities among social groups andbetween places in terms of poverty, health and mortality.
Before returning to a discussion of that unifying principle in demog-raphy, the notion of system and transition, two further points must bemade. First, it is tempting to view England and Wales in isolation andthe reconstruction of its demography as an end in itself. But Englandand Wales was part of several far larger spheres in terms of the so-calledEuropean marriage pattern; the Western system of applied scientificknowledge, engineering and medical science included; and the interna-tional flows of capital, goods and people, to give three obvious exam-ples. There are two other senses in which neither the place nor theperiod will be treated in isolation in this study. The demographic expe-rience of other societies will be used to plug gaps in our knowledgewhen direct evidence is lacking. This is a device well known among his-torical demographers who often have resort especially to theScandinavian model of demographic change, occasionally with unfor-tunate consequences. Further, there are even today populations in
2 The demography of Victorian England and Wales
13 This tradition is now subject to healthy criticism and challenge, for example, Kertzerand Fricke (1997).
14 Respectively, Davis (1951), Taeuber (1958) and Brass et al. (1968).
Africa and Asia with relatively high fertility and mortality. Studies oftheir characteristics may prove of value in our attempt to understandVictorian society just as the ‘lessons from the past’ argument has beenused to draw analogies between the historical experience of the West,but mainly western Europe, and the way in which matters are likely toprogress among non-European populations. Secondly, Victorian scien-tists, especially the medical statisticians, knew a great deal about thedemography of their society both from the published tabulations andsurveys, and from first-hand experience. Sir Edwin Chadwick, WilliamFarr, Sir Arthur Newsholme, Seebohm Rowntree and Charles Boothestablished the British tradition of empirical social enquiry. Their find-ings, even their surmises, must not be overlooked otherwise they arelikely merely to be discovered again.
One unifying principle with two distinct parts has tended to domi-nate the thinking of scholars working especially on the demography ofpast societies: the Malthusian demographic system and the demo-graphic transition model. These will be considered in their turn asframeworks for our present account of the Victorian period. But first wemust say a little by way of introduction about the empirical nature ofthese enquiries.
True facts
English historical demographers have been justly applauded for theirability to make bricks without straw whilst at the same time being crit-icised for failing to put sufficient flesh on their statistical skeletons.5
Although it sometimes appears that social historians are energetic inshowing us the flesh and blood of real people whilst eschewing thedeeper demographic structures and generalities that give the behav-iour of their subjects some wider meaning, no one could accuse thenineteenth-century statisticians and actuaries in this regard. For themthe search for ‘true facts’ was of prime importance and without themtheir work would be meaningless, just theory. Those who campaignedfor legislation to establish a regular population census and an accuratesystem for the registration of births, deaths and marriages had severalmotives, but the need to keep human accounts for the sake of efficient
Bricks without straw, bones without flesh 3
15 J. D. Chambers took ‘Bricks without straw: the course of population change in the eight-eenth century’ as the title of one of his chapters in Population, Economy, and Society inPre-industrial England (Chambers, 1972), while Wrigley et al. (1997) have used an alter-native analogy to ‘bones without flesh’ when they talk about ‘laying the foundationsand erecting the main fabric of a house, but leaving its finishing and furnishing toanother day’ (p. 5).
administration would surely have been one of their foremost concerns.Another would have been rather more intellectual: to determine thetrue course of population growth in the eighteenth century.6 With theestablishment of the regular decennial census in 1801 and the introduc-tion of civil registration in 1837 it might be supposed that the contro-versy that fuelled their campaign would have come to an end, but it hasnot been until recent decades that we have finally secured reliable esti-mates of the size of England’s population before 1801 and of trends inthe major demographic indices prior to 1837. With these materials weare now in a position to place the nineteenth century and especially theVictorian age in context.7
Figure 1.1 helps us to see at a glance why the Victorian period was soimportant as a turning point in England’s longer population history.8 Itshows that life expectancy at birth in years (e0), perhaps the best singlenumber measure of mortality, varied between 30 and 40 in the seven-teenth and eighteenth centuries. It was around 40 years early in thenineteenth century and stayed at about that level until the third quarterof the century when the secular decline of mortality began. Lifeexpectancy at birth has doubled in the past 150 years. In figure 1.1 fertil-ity has been measured by the total fertility rate (TFR), that is, the numberof children a woman might expect to have had on passing through thereproductive ages 15–49. Until the middle of the eighteenth century,
4 The demography of Victorian England and Wales
16 See Glass (1973).17 Wrigley and Schofield (1981), Wrigley et al. (1997) and Wrigley (1997, 1998) summarise
the Cambridge Group for the History of Population and Social Structure’s project tofully analyse Anglican parish registers for the period 1538–1837. The 1989 reprint ofWrigley and Schofield (1981) also contains a chapter entitled ‘The debate about Thepopulation history of England: an introductory note’ (pp. viii–xxxiv) which offers a replyto some criticisms, including the standing of the back projection estimates, and a usefullist of reviews and reactions. Although these estimates are obviously not above crit-icism, they not only provide measures far superior in quality and detail to any previ-ously available, but also ones that are unlikely to be bettered. See especially Wrigley etal. (1997), pp. 515–44, on ‘Reconstitution and inverse projection’, but also Levine (1998)and Razzell (1998).
18 The measures used to construct figures 1.1 and 1.2 have been derived from Wrigley etal. (1997), table A9.1, pp. 614–15, up to 1840 and from the Registrar General’s AnnualReports, Decennial Supplements and Annual Statistical Reviews thereafter. The 31 decades1581–90 to 1981–90 are shown for England and Wales. Although, strictly speaking, theestimates for the decades prior to 1841 are for England, it has been assumed that theycan reasonably stand for England and Wales as a whole. The reported gross reproduc-tion rate (GRR) has been inflated by 2.05 to give the total fertility rate (TFR). For the1840s to the 1930s TFR has been estimated; see Office of Population Censuses andSurveys, Birth Statistics: Historical Series of Statistics from Registrations of Births in Englandand Wales, 1837–1983, Series FM1 No. 13 (London: HMSO, 1987), table 1.4, and also table4.2 below. The quality of Victorian civil registration is considered in chapter 2, and lifeexpectancy at birth and the childhood mortality rate are reported and further discussedin table 9.3.
TFR varied from about 3.75 to 4.50; thereafter it rose substantially topeak at 5.75 in the early decades of the nineteenth century. A longdecline then set in, although this appears to have been temporarilyhalted during the 1850s and 1860s. From the fourth quarter of the nine-teenth century fertility was apparently in free fall, only ending itsdecline in the 1940s. Clearly the Victorian era was above all one ofdemographic change in which the secular declines of both mortality andfertility began, and by 1901 new, lower than previously experiencedlevels had been reached. Figure 1.2 captures this sense that the peopleof England and Wales were entering a new demographic age duringVictoria’s reign in an even more striking fashion. It shows the timepathfor fertility–mortality again for the 31 decades used in figure 1.1. It alsoindicates, using Model West, the levels of TFR-e0 that would be neces-sary to generate rates of natural population growth of 0 and 2 per centper year.9 Before the middle of the nineteenth century, populationgrowth in England and Wales was largely the result of fluctuations infertility; variation along the vertical axis of figure 1.2 is substantiallygreater than along the horizontal, but in or by the 1870s fertility andmortality set off together on a new, joint downward course into previ-ously uncharted demographic territory.
The Model West, referred to above, comes from Coale and Demeny’sRegional Model Life Tables and Stable Populations, first published in 1966.10
This single work more than any other symbolises efforts to utilise to thefull demographic data from the nineteenth century and to draw paral-lels between that largely European experience of high mortality andconditions in much of Africa, Asia and Latin America today. Coale andDemeny’s models have established a framework within which thequality of historical European mortality statistics may be evaluated aswell as allowing the estimation of vital rates for populations which,while regularly enumerated, lacked effective registration systems. Ofthe 326 life tables selected for analysis, 113 related to periods prior to1918 and of these 86 were European in origin. From the set of 326 empir-ical life tables, Coale and Demeny identified four distinct age patternsof mortality which they labelled North, South, East and West therebysignifying the regions of Europe from which the constituent tables wereprincipally drawn. For example, the life tables underlying the Northmodel were: Sweden, 1851–90 (4 tables); Norway, 1856–80 and 1946–55
Bricks without straw, bones without flesh 5
19 Model life tables, of which West is one, will be used at various points throughout thisbook. They offer a convenient device for representing the various age profiles of mortal-ity in terms of life expectancy at birth and of illustrating what population age structureswill look like given certain levels of mortality and fertility.
10 Coale and Demeny (1966).

(4); and Iceland, 1941–50 (1). Model West, on the other hand, repre-sented a residual category once the North, South and East patterns hadbeen removed. Here the underlying tables were drawn mainly fromEngland and Wales, France, the Netherlands, Denmark, Canada, theUSA, Australia and New Zealand.11 Model life tables were estimated foreach of the four families using life expectancy at birth as the referencefor defining levels of mortality, and these in turn became the basis forstable population models with various constant rates of populationchange.
These regional model life tables have been used extensively byEnglish historical demographers as devices for checking the quality ofdata, for estimating mortality rates for which empirical data are entirelymissing, and as a general reference tool, providing co-ordinates indemographic space. As such, they have proved of exceptional value.However, in recent years there has come to be an uncritical over-
6 The demography of Victorian England and Wales
11 In passing, it is interesting to note that Coale and Demeny (1966), p. 12, excluded fromfurther consideration life tables for periods prior to 1870 for England and Wales, Franceand the Netherlands because they had ‘irregular patterns that appeared to arise fromfaulty data’, although 11 for England and Wales 1871–1959 were used.
Figure 1.1. Long-run trends in mortality and fertility in England and WalesNote: The axis showing life expectancy at birth has been reversed to illustrate
the decline of mortality.Source: See text for explanation.
1
2
3
4
5
6
Fer
tility
(To
tal f
ertil
ity r
ate,
TF
R)
20
30
40
50
60
70
801551 1601 1651 1701 1751 1801 1851 1901 1951 2001
Decades
TFR
e0
Mor
talit
y (L
ife e
xpec
tanc
y at
birt
h in
yea
rs,
e 0)
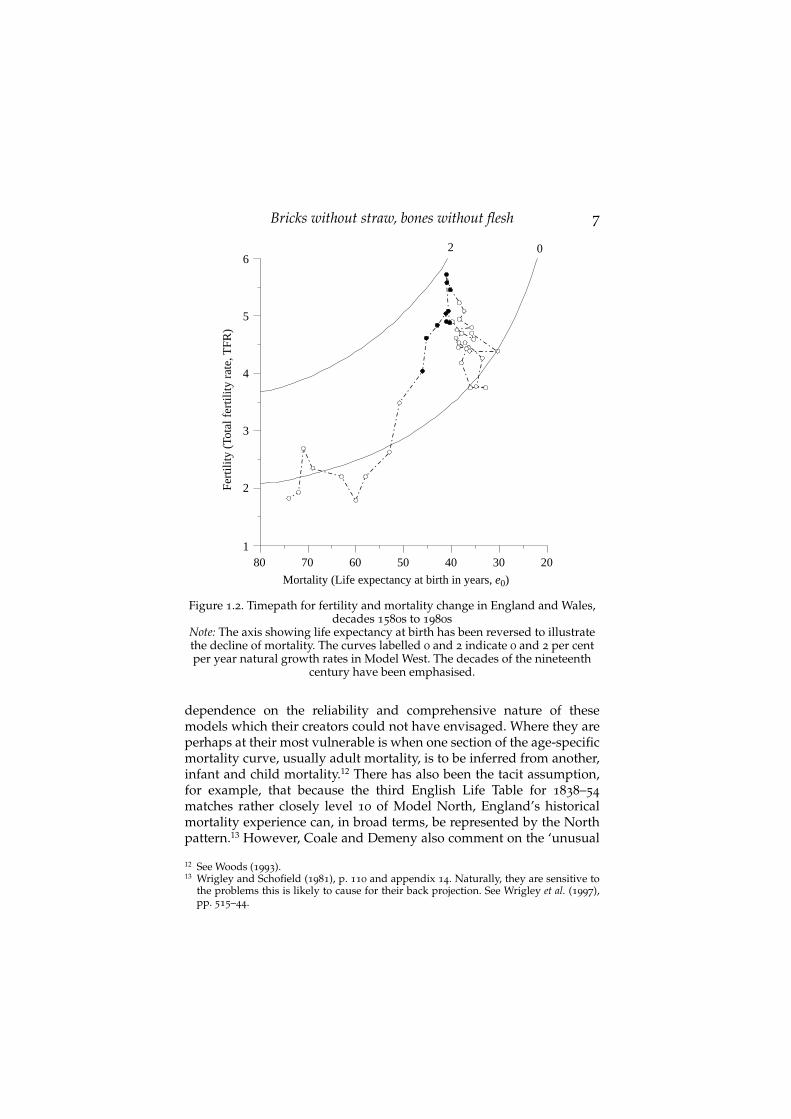
dependence on the reliability and comprehensive nature of thesemodels which their creators could not have envisaged. Where they areperhaps at their most vulnerable is when one section of the age-specificmortality curve, usually adult mortality, is to be inferred from another,infant and child mortality.12 There has also been the tacit assumption,for example, that because the third English Life Table for 1838–54matches rather closely level 10 of Model North, England’s historicalmortality experience can, in broad terms, be represented by the Northpattern.13 However, Coale and Demeny also comment on the ‘unusual
Bricks without straw, bones without flesh 7
12 See Woods (1993).13 Wrigley and Schofield (1981), p. 110 and appendix 14. Naturally, they are sensitive to
the problems this is likely to cause for their back projection. See Wrigley et al. (1997),pp. 515–44.
Figure 1.2. Timepath for fertility and mortality change in England and Wales,decades 1580s to 1980s
Note: The axis showing life expectancy at birth has been reversed to illustratethe decline of mortality. The curves labelled 0 and 2 indicate 0 and 2 per centper year natural growth rates in Model West. The decades of the nineteenth
century have been emphasised.
1
2
3
4
5
6
Fer
tility
(To
tal f
ertil
ity r
ate,
TF
R)
20304050607080
Mortality (Life expectancy at birth in years, e0)
02

incidence of tuberculosis’ in North and that ‘Model tables incorporatingthis experience would be suitable only for populations with a highendemicity of tuberculosis.’14 If this assertion did indeed prove to bevalid it would have important implications for epidemiological studiesof the early modern period. But more detailed recent work with a largernumber of family reconstitution studies has tended to cast doubt on thewisdom of making such broad generalisations linking mortality experi-ence to one family over such a long period. Wrigley et al. have confirmedthat as far as infancy and early childhood are concerned:
mortality in the early modern period did not conform either to model West orto model North, though edging closer to model North pattern in the late eight-eenth and early nineteenth centuries. Indeed, mortality in infancy and child-hood in the English historical past does not appear to have resembled thepatterns found in any of the families of tables which were extrapolated frommore recent data in the Princeton tables.15
Presumably Model West is still appropriate for England and Wales post-1871.
The use of the Princeton model life tables epitomises the problemsfaced by historical demographers, even those working on the nine-teenth century. Bricks may be created without straw, but they are bricksof perhaps uncertain quality which will not necessarily make the sound-est foundations for a new residence.
A variation on the same theme can also be illustrated by the PrincetonEuropean Fertility Project of which Ansley J. Coale was the guidingspirit. In order to chart the progress of fertility decline among theprovinces of nineteenth- and early twentieth-century Europe it was nec-essary to develop a set of indices that not only captured the general levelof fertility, but also made it possible to differentiate the contributions oflegitimate and illegitimate fertility as well as the effects of fertilitywithin marriage compared with the influence of nuptiality itself. Innormal circumstances this problem would have been solved by usingthe total period fertility rate and the total marital fertility rate or somemodification of the gross and net reproduction rates. But many coun-tries, including Great Britain, whilst possessing a system for civilregistration lacked data on the age of mother at the birth of her children.Age-specific total or marital fertility rates could not be calculated, there-fore. Coale’s solution to this problem involved the development of a setof four indirectly standardised measures: If, the index of overall fertil-ity; Ig, the index of marital fertility; Ih, the index of illegitimate or non-
8 The demography of Victorian England and Wales
14 Coale and Demeny (1966), p. 12. Figure 8.2 illustrates what this means especially formortality in the age group 15–34. 15 Wrigley at al. (1997), p. 263.

marital fertility; and Im, the index of proportion married.16 These mea-sures have several characteristics which make them especially impor-tant. First, they require relatively little empirical data: at minimum thenumbers of legitimate and illegitimate live births, and the numbers ofcurrently married and single women distinguished by five-year agegroups 15–19 to 45–49. The births could be found from civil registrationand marital condition from population censuses.17 This usually meantthat local and regional as well as national patterns could be charted.Secondly, the four measures are age-standardised and therefore avoidthe problems of distortion associated with the use of the crude birth rateor even the general fertility rate. Thirdly, the indices are related one toanother in a way that has certain useful properties for representingchanges and variations in the joint effects of marital fertility andnuptiality on overall fertility. Since
If5Ig• Im1 Ih(12 Im) (1.1)
if Ih is zero, or at least very low, then overall fertility can be said to bethe product of marital fertility and proportion married (If5 Ig• Im).18
Fourthly, and of particular significance, in choosing a standard age-specific marital fertility schedule Coale was careful to select a popula-tion with what has come to be known as natural fertility, that is fertilitythat was not being limited in a parity-specific way. His choice of theespecially well-documented Hutterite population and, in particular, thefertility experienced by the 1921–30 first marriage cohort meant that Ignot only measured marital fertility, but it also set the level of fertilityagainst that achieved by the Hutterites for whom Ig was by definition1.0.19 Further analysis of a range of Ig values suggested to Coale that ifthe index was found to be greater than 0.6 it was likely to indicate thepresence of natural fertility and thus the absence of deliberate familylimitation behaviour.20
Bricks without straw, bones without flesh 9
16 Coale (1967).17 In fact Wilson and Woods (1991) offer a method for deriving these measures based on
Wrigley and Schofield’s (1981) back projection results for England in the parish regis-ter era before 1837.
18 This property has been used extensively in several figures in chapters 3 and 4. Forexample, figure 3.6 shows the Ig-Im timepath for England and Wales, while figure 4.18illustrates the changing pattern of variation among districts.
19 Eaton and Mayer (1954), table 1, p. 84. The Hutterites were, of course, a most unusualpopulation. The total marital fertility rate for those women married in the 1920s was 12and only 3.4 per cent of all marriages were childless representing an exceptionally lowlevel of natural sterility. Eaton and Mayer also speculate that whilst contraception wasnot used, coital frequency may have declined rapidly once a woman reached her latethirties (p. 24).
20 The matter of identifying the presence or absence of certain forms of family limitationbehaviour has proved to be far more complicated in practice, see pp. 124–40.

In reality, however, our account of demographic change and varia-tion, even for England and Wales in the second half of the nineteenthcentury, cannot be made out of true facts as the Victorian actuariesmight have wished. Rather, it has to employ estimates and approxima-tions, use subjective judgement, and be selective and at times partial.This point may be illustrated just as effectively when we turn to the uni-fying principle of demography which has guided our understanding ofpopulation history: the concepts of demographic system and demo-graphic transition.
Systems
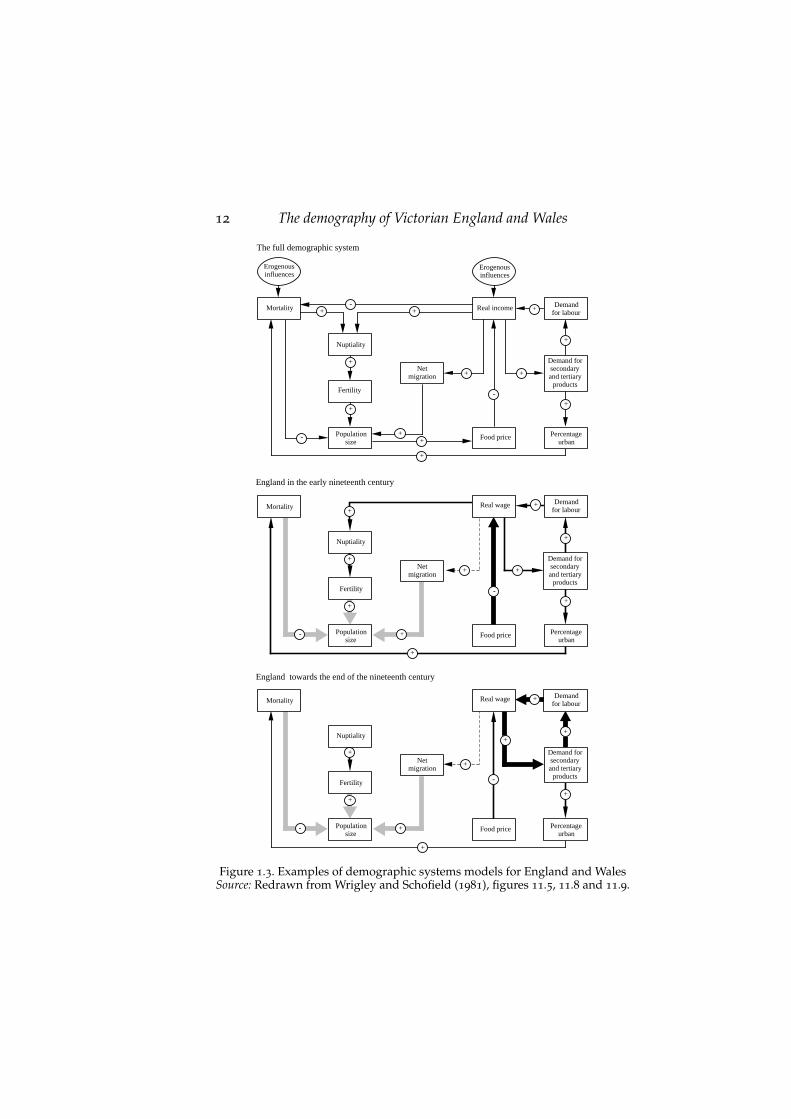
The concluding chapter of The Population History of England, 1541–1871outlines a systems model designed to capture the dynamic relationshipbetween population and environment in early modern England.21 At itscentre the model contains a diagrammatic representation of the ways inwhich the two checks to population outlined by T. R. Malthus in his AnEssay on the Principle of Population are capable of exerting regulatoryinfluences on the size of a population. The model is illustrated here infigure 1.3. In the outer circuit we have the positive check which worksby raising mortality if and when real incomes are depressed becausefood prices have increased as a consequence of too rapid populationgrowth. The preventive check occupies the inner circuit. Here the effectof falling real incomes will be to reduce nuptiality which will conse-quently lead to lower fertility and a reduced rate of population growth.These two routes, the first emphasised by Malthus in his 1798 Essay interms of famine, disease and war, and the second in the 1803 and sub-sequent editions of the Essay, particularly as moral restraint operatingvia prudential and especially delayed marriage, offer alternative paths.If the preventive check is firmly in place and working effectively thenthere may be no need for the positive check, misery and vice may beavoided to a large extent, and there may even be positive economic ben-efits in terms of higher real incomes and higher living standards ingeneral.22 On to this essentially Malthusian, self-regulating negativefeedback system, dominated by what the biologists term ‘homeostasis’,Wrigley and Schofield have bolted a number of additional sub-systems,endogenous and exogenous factors.23 The first of these involves what
10 The demography of Victorian England and Wales
21 Wrigley and Schofield (1981), pp. 454–84.22 Wrigley (1988) provides a more elaborate statement of some of the economic–
demographic arguments.23 Wilson and Airey (1999) offer an interesting discussion of the application of homeo-
static arguments in demography.

they call the system of ecological niches. Now mortality is not only neg-atively linked to population size to represent the positive check, but itis also positively linked to nuptiality. In certain forms of largely agrar-ian society, access to a secure livelihood on the land will require theinheritance of property. If for some reason mortality increases this mayfree up access to land which will in turn remove the need for marriageto be delayed. By this means a population suddenly affected by anexogenous mortality shock will be able to recover quite rapidly throughincreased fertility. The second inserts the effect of net migration linkingreal income with population size in a positive fashion. If real incomesincrease, people will be drawn in, but if they decline then emigrationwill be a possible response with the same effects as the positive and pre-ventive checks. Finally, an additional economic sub-system dominatedby positive feedback is associated with real incomes to allow for theeffects that rising incomes will have on the demand for consumer prod-ucts and services, and in turn the demand for labour which will producewage inflation. This sub-system is also linked via urbanisation tomortality. Assuming the presence of a sharp urban–rural mortalitygradient, the demand for manufactured goods and services which willstimulate urban growth and urbanisation is likely to increase averagemortality levels as more people crowd into the unhealthy towns. Thecompleted model, with the addition of exogenous influences affectingthe demand for labour and mortality, is shown as the top panel of figure1.3.
The model works rather well until the beginning of the nineteenthcentury when the positive link between population size and food priceceases to have an influence, with population growth continuing apacewithout adversely affecting the price of food and thus real income.Representations of the model for England in both the seventeenth andsixteenth centuries give special emphasis to this link and the preventivecheck circuit in general, whilst relegating to negligible significance therole of the positive check and the negative link between real income andmortality. This new emphasis has led to a radical revision of our under-standing of the demography of the early modern period in England.24 Ithas diverted attention away from mortality and towards fertility as theprime initiator of long-run population growth and has been especiallydamaging to the arguments of those who see the stabilisation and even-tual disappearance of demographic crises as the initiating factor inmortality decline. It has also encouraged considerable discussion of thepossibility that, in England in particular and western Europe in general,
Bricks without straw, bones without flesh 11
24 See Wrigley and Schofield (1989), pp. xiii–xxxiv.
12 The demography of Victorian England and Wales
Figure 1.3. Examples of demographic systems models for England and WalesSource: Redrawn from Wrigley and Schofield (1981), figures 11.5, 11.8 and 11.9.
England in the early nineteenth century
England towards the end of the nineteenth century
Mortality Real wage
Nuptiality
Demand for labour
Net migration
Population size
Demand for secondary and tertiary products
Fertility
Food price Percentage urban
Mortality Real wage
Nuptiality
Demand for labour
Net migration
Population size
Demand for secondary and tertiary products
Fertility
Food price Percentage urban
The full demographic system
Mortality Real income
Nuptiality
Demand for labour
Net migration
Population size
Demand for secondary and tertiary products
Fertility
Food price Percentage urban
Erogenous influences
Erogenous influences
-+ +
+
+
++
+ +
+
+
+
-
-
-
+
+
+
+
++
+
+
+
+
+
+
+
+
+
+
+
+
+
-
-
+
-
-
the lower level of fertility together with its capacity to adjust to eco-nomic circumstances via the preventive check gave the region someinitial demographically inspired economic advantage – an advantagethat encouraged consumer-led economic growth and laid favourablepreconditions for industrialisation. England could take advantage of itsbeneficial low-pressure demographic system, while China, to use anexample popular with Malthus, was locked into a high-pressure systemat the mercy of the positive check.25
The debate about The Population History of England has tended to focuson the following issues: the reliability of the demographic estimates andespecially back projection; the mechanism of economic–demographicchange, but particularly the absence of an endogenous positive check inEngland, the lagged response of nuptiality to real wages (including thecredibility of the real wage series used), and the need to decomposenuptiality into proportion marrying and age at marriage; and, ingeneral, whether ‘dilatory homeostasis’ is an appropriate device formodelling the early modern experience. On all of these matters a gooddeal of progress has been made.26 But there are two further pointswhich, although occasionally mentioned, have failed to attract sus-tained attention. The first is the matter of regional and local variations,and the second relates to the question of how demographic change inthe nineteenth century might be modelled when homeostasis was nolonger even dilatory.
Finally, the functioning of the national aggregate will never be well understoodunless analyses or relations that appear to characterise the national entity areparalleled by similar work on a local scale. Only in this way can those aspectsof English demographic and economic history in which there was homogeneityof behaviour throughout the country be distinguished from those where thenational aggregate reflects an average condition that may prove to have beentrue of few individual communities, and that may therefore tend to lead to mis-guided conclusions about the relations between demographic and economicbehaviour in the past.27
Bricks without straw, bones without flesh 13
25 There are frequent references to misery and vice in China in Malthus’s first Essay (1798)while the second Essay (1803) has chapter 12 of book 1 devoted to the subject. See alsoWrigley and Schofield (1989), p. xxiv, and Wrigley et al. (1997), p. 549. We shall returnto a comparison of the demographic regimes of England and China in chapter 10.
26 Much of this has been summarised by the contributors to Rotberg and Rabb (1986), butsee also Wrigley and Schofield (1989), pp. xiii–xxxiv, and Schofield (1989) which bringsthe role of welfare policy, especially the Poor Law, into the equation particularly in thelate eighteenth century. The nuptiality question is considered again in chapter 3 (pp.107–9).
27 Wrigley and Schofield (1981), p. 482. Wrigley et al. (1997) do not, in general, take thispoint further; indeed, it would be difficult to do so with family reconstitutions for atmaximum 26 parishes and for some periods as few as eight (see chapter 3,‘Representativeness’). As Wrigley and Schofield point out, they come closest to takingup their own challenge in the analysis of crisis mortality among the 404 parishes inappendix 10.

The problem is one of level, trend and variation. It may well be that asfar as nuptiality is concerned most parishes trended together, but thatthe variation between parishes was not insubstantial and that itincreased over time. In the case of mortality there was certainly a widedifference between the urban and rural parishes, but also among thelatter between those in the marshes and fens, and those located in moresalubrious regions. And what of real wages? These would certainlyhave had strong regional and local components in their trends and, likemortality, their distributions would probably have become moreskewed as time progressed, although not necessarily in the same way.
As far as the nineteenth century is concerned, even weak homeosta-sis appears to offer little potential as the basis for modelling demo-graphic change and variation. Figure 1.3 also shows Wrigley andSchofield’s models for the early and late nineteenth century. The threelogical demographic links between mortality, fertility, net migrationand population size are illustrated in grey while the other significantlinks are represented by lines of varying thickness. In the model for theearly nineteenth century there is still a strong positive link between realwages and nuptiality, but by the end of the century this has all but dis-appeared. The positive link between percentage urban and mortalityhas weakened, but not disappeared, although links between the con-sumer demand and demand for labour sub-systems which drive urban-isation have strengthened.28 In neither nineteenth-century model arethere links between population size and food price, and between realwages and mortality. The former is regarded as having become redun-dant in or about 1806 while the latter only appears as a weak negativelink in the model for the sixteenth century. Similarly, the ecologicalniche link between mortality and nuptiality is only shown in its weakestform in the models for the sixteenth and late seventeenth centuries. Hadthe model been taken on a further hundred years from the 1870s to, say,the 1970s virtually all of its non-logical links would have disappeared.Nuptiality would no longer be linked to fertility, except via divorce; thedemand for secondary and tertiary products would not be linked to per-centage urban or even the demand for labour; and the link from foodprices to real wages would have become much weaker.
Clearly, all would agree that a dynamic systems model founded onthe principle of homeostasis is not the best way to represent the demo-
14 The demography of Victorian England and Wales
28 Wrigley and Schofield (1981) remark of the late nineteenth century that ‘Even the linkbetween urban growth and mortality was of much reduced importance. The gapbetween urban and rural death rates had begun to close, and in the early decades of thetwentieth century disappeared entirely.’ (p. 476) As we shall see in chapter 5, matterswere in fact not quite so simple.

graphic experience of nineteenth-century England and Wales.29 How,then, should we proceed? Let us take four steps. First, it must be appre-ciated that demographic change, and especially the secular decline ofmortality and fertility, cannot be understood simply in terms of the rela-tionship between population and resources, population and theeconomy. Many other factors are involved including the application ofscientific knowledge in public policy and the often only boundedlyrational behaviour of individuals with respect to their own reproduc-tion. Secondly, population growth and redistribution can be seen to actas a stimulus to economic development, social and cultural change; itneed not always be taken as a red light, a warning to rein back. Thirdly,whilst there is much to be learned by modelling the processes that regu-late animal numbers, especially as this may be assisted by laboratoryexperiment and is sufficiently simple to allow considerable mathemat-ical sophistication, there are many dangers in its application to even theleast developed human societies.30 Fourthly, there is the need to recog-nise the importance of chance, fortuitous coincidences and unforeseenconsequences in both their temporal and spatial senses. Jenner andcowpox, the Irish potato famine and the Bradlaugh–Besant trial eachhad important, although very different, effects on demographic changein the nineteenth century, as also did the reform of Parliamentarydemocracy and the demands it placed on politicians to concern them-selves with public opinion and its management.
Transitions
It might be argued that the ‘ideal type’ model proposed by Wrigleyand Schofield can offer a new and superior way of envisioning the first
Bricks without straw, bones without flesh 15
29 Wilson and Airey (1999) ask the key question without answering it in respect to demo-graphic transition theory.
30 The story of the development of the models proposed by Wrigley and Schofield is ofinterest in its own right. The influences of Malthus, Darwin, Wynne-Edwards and Leeare clear and often mentioned, but the way in which their ideas were combined, appliedand especially represented in diagrammatic form is of fundamental importance. Thefollowing appear to mark significant points in the course of the story: Wrigley (1967,1969), Schofield (1976, 1986) and Lee (1986, 1987). Bideau (1980) offers a sceptical reviewof the early work by historical demographers. In anthropology, Wynne-Edwards’sthesis was not taken up thanks, undoubtedly, to a critique delivered in 1966 by MaryDouglas (1966). The central idea of V. C. Wynne-Edwards’s Animal Dispersion in Relationto Social Behaviour (1962) is that in certain cases special forms of animal behaviour haveevolved that give information on population density, thereby helping to make territori-ality a more effective demographic regulator, and that, in general, group self-regulationof population size developed through the course of evolution. These views werealways controversial among zoologists and were ultimately also rejected by their orig-inator.

pre-industrial stage in the classic demographic transition model, thatsecond part of demography’s central unifying principle. But this couldprove damaging to the model as a whole because it would raise nuptial-ity to the key position and would undermine the role of mortalitydecline as the initiator of rapid population growth. It would also requirethe model and its accompanying theory to be made more flexible so thata number of different routes to low mortality and fertility could beaccommodated. These substantial revisions could easily be justified,however. Before attempting such a major revision, it is necessary to con-sider the origins of the demographic transition model and theory inrather more detail.
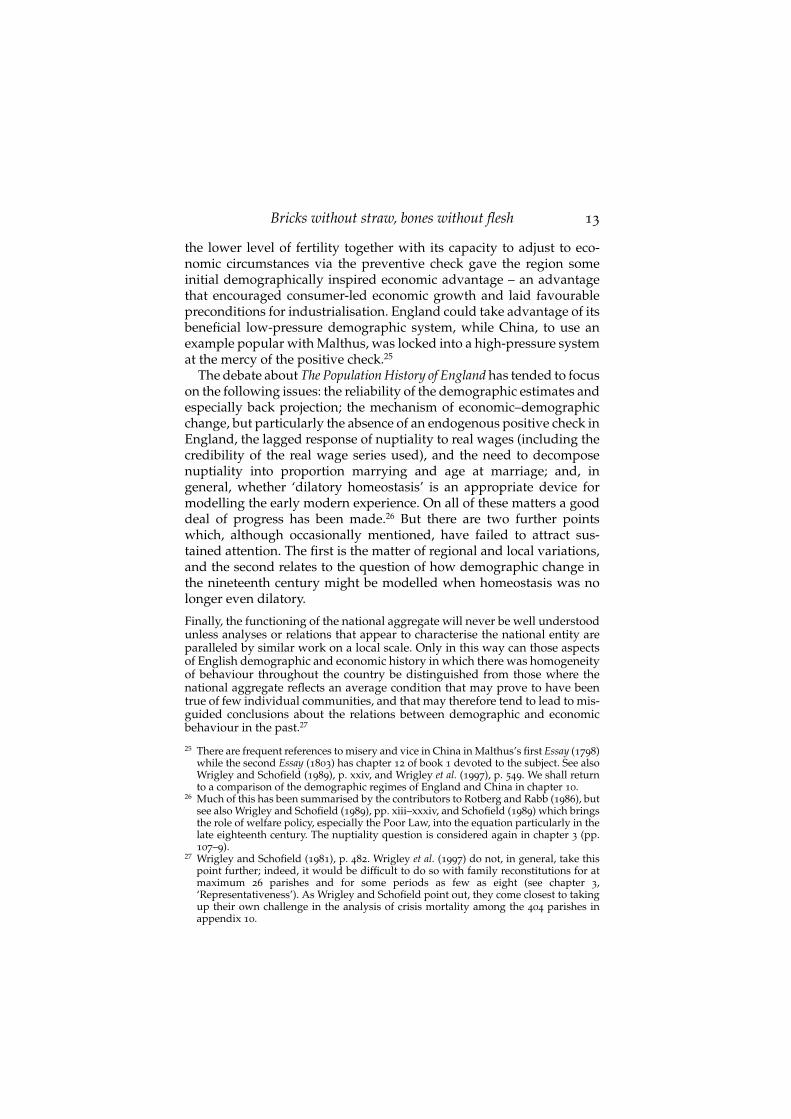
Figure 1.4 illustrates three early versions of the demographic transi-tion diagram for England and Wales. The top panel shows C. P. Blackerand D. V. Glass’s representation of John Brownlee’s figures for the crudebirth and death rates.31 It is probably the first attempt to give diagram-matic expression to the now familiar time-series. The middle panelshows the same graph, but now it is in a form so much simplified thatit can for the first time be called a model.32 Although the Political andEconomic Planning Report was published anonymously, it seems likelythat the identification of the four stages in the model owed much to C.P. Blacker’s influence.33 Finally, the bottom panel of figure 1.4 repro-duces a version of the model from a medical textbook of the 1960s.34 Thisappears to have been the only occasion on which Thomas McKeownventured to render the long-run population history of England andWales in diagrammatic form.
It is now generally accepted that Brownlee’s estimates of the crudebirth and death rates for decades before the 1800s are seriously flawed.35
16 The demography of Victorian England and Wales
31 Blacker and Glass (1936), figure 1, p. 7, cite as the source of their data Brownlee (1916),table XI, p. 232. Blacker and Glass note in their figure caption that ‘The figures after 1876are accurate.’
32 Political and Economic Planning (1955), figure III, p. 108. The Blacker and Glassdiagram is also reproduced as figure II, but no reference is made to Brownlee’s originalestimates.
33 Blacker (1947).34 McKeown and Lowe (1966), figure 2, p. 6. Again, no mention is made of Brownlee,
although McKeown and Brown (1955) do refer to his estimates with approval (pp.134–35).
35 See Wrigley and Schofield (1981), especially pp. 144–52 and 577–86. Brownlee based hisestimates on data drawn from the Parish Register Abstracts compiled and publishedby John Rickman in the early nineteenth century. All their users, including William Farr,have appreciated their shortcomings, but until the new collection of parish registermaterial (co-ordinated by members of the Cambridge Group) and the development ofback projection these could not be overcome. The following table gives a very simplesummary of the differences between Brownlee’s estimates and those by Wrigley et al.(1997), table A9.1.
Bricks without straw, bones without flesh 17
Figure 1.4. Three early diagrammatic representations of thedemographic transition in England and Wales
1701 1751 1801 1851 1901 1951
40
30
20
10
0
40
30
20
10
0
40
30
20
10
0
50
40
30
20
10
0
Blacker and Glass (1936) following Brownlee (1916)
Political and Economic Planning (1955)
McKeown and Lowe (1966)
Cru
de b
irth
and
deat
h ra
tes
Cru
de b
irth
and
deat
h ra
tes
Cru
de b
irth
and
deat
h ra
tes
Pop
ulat
ion
(mill
ion)
STAGE IHIGH
FLUCTUATING(High birth
and death rates)
STAGE IIEARLY
EXPANDING(High birth rates,
declining death rates)
Registration ofbirths and deaths
STAGE IIILATE
EXPANDING(Declining birthand death rates)
STAGE IVLOW
FLUCTUATING(Low birth
and death rates)
Birth rate
Death rate
Birth rateDeath rate
Birth rate
Death rate
Populati
on

The picture of long-term changes in fertility and mortality are bettercaptured by using the total fertility rate and life expectancy at birth,measures which are not vulnerable to shifts in the age structure of apopulation. That is, figures 1.1 and 1.2 have been substituted for figure1.4. But, as Szreter has recently argued, ‘the principal virtue and func-tion of the idea of demographic transition has always been in providinga graphic metaphor that summarily describes – and predicts – a long-term emergent pattern of change’.36 It is this ‘graphic metaphor’ thatpersists in the demographic transition model, now more a pedagogicdevice than an explanatory tool.
However, there is still considerable debate about the existence of aglobal demographic transition and whether the various processesinvolved may be expressed in the form of a general theory. AlthoughWarren S. Thompson and Adolphe Landry are widely credited with theidentification of different demographic patterns in terms of populationgrowth potential, it was Frank W. Notestein who in the 1940s and early1950s offered the first coherent statement of what could be called atheory of the demographic transition.37 To oversimplify, Notestein’stheory can be reduced to the following four propositions.
1. The demographic transition is initiated by the secular decline ofmortality.
2. Mortality decline is caused by the cumulative influences of the agri-cultural, the industrial and the sanitary revolutions which, respec-tively, lead to better food supplies, an improvement in the factors ofproduction and the standard of living in general, and improvementsin public health.
3. Rapid population growth is the result of the temporal lag betweenthe decline of mortality and that of fertility.
4. Fertility decline eventually occurs because the social and economicsupports to high fertility are removed. The materialism and
18 The demography of Victorian England and Wales
footnote 35 (cont.)
1701–10 1751–60 1801–10Brownlee CDR 31.6 30.3 23.9
CBR 28.6 36.9 37.5Wrigley et al. CDR 26.0 25.2 23.9
CBR 30.3 32.4 37.8
There is a remarkable match between the estimates for 1801–10, but there the similar-ity ends. 36 Szreter (1993), quoted from p. 692.
37 Landry (1934 also 1909), Thompson (1929), Notestein (1945, 1953). Of the three, thework of Adolphe Landry (1874–1956) has been rather neglected although he coined thephrase ‘le régime démographique’. See Sauvy (1956).
individualism associated with the urban way of life give impetus tothe rational control of fertility by means of contraceptive practices.38
Notestein’s 1953 paper offers some additional points of emphasis forthe theory. For example, although ‘it is evident that urbanization pro-vides no mystical means for the reduction of fertility’ it seems likelythat the particular pressures of urban-industrial life created the condi-tions for the weakening of old ideas and beliefs, and the establishmentof a new small family size ideal. The principal factors involved wereprobably as follows: ‘the growing importance of the individual ratherthan the family, and particularly the extended family group; thedevelopment of a rational and secular point of view; the growingawareness of the world and modern techniques through populareducation; improved health; and the appearance of alternatives toearly marriage and childbearing as a means of livelihood and prestigefor women.’39 But perhaps of greater importance, the 1953 paper alsogives some of Notestein’s arguments on historical precedents: Europeas model. ‘An understanding of their experience [Europe and theindustrialised countries of the New World] gives us considerableinformation about the kinds of processes likely to be found in otherparts of the world as technological development gets under way.’40
And, ‘Both the Japanese experience and the different course of eventsproduced by a different sort of economic development in such areasas Ceylon, Formosa, and Puerto Rico tend to confirm the hypothesisthat the principles drawn from the European demographic transitionare widely applicable throughout the world.’41 ‘But in the denselysettled regions of Asia the initial conditions are strikingly differentfrom those of Europe a century ago.’42 There it is less likely that
Bricks without straw, bones without flesh 19
38 See Woods (1982a), p. 161, for a more detailed discussion of Notestein’s ideas; alsoChesnais (1992), especially pp. 1–28, Jones et al. (1997) and Dupâquier’s introduction toBardet and Dupâquier (1998), pp. 7–17. 39 Notestein (1953), p. 18.
40 Notestein (1953), p. 15.41 Notestein (1953), p. 21. See also Notestein (1945), figure 4, p. 47, where the similarities
between CDR and CBR trends in England and Wales, 1881–1939, and Japan, 1921–41,are illustrated.
42 Notestein (1953), p. 21. Notestein concludes his paper by proposing a list of policies tospeed the process of social change because of the difficulty of relying on the sort of eco-nomic development which automatically produces the socio-economic changerequired for the transition to low mortality and fertility. Examples of the policies are:lifting the age at marriage; promoting community education; communicating informa-tion on the practice of birth control; weakening the support system provided in theextended family by providing some element of basic economic security. See alsoNotestein (1948) written at a time when Notestein was not only Director of the Officeof Population Research at Princeton University, but also Consultant-Director of theUnited Nations Population Division.

without policy interventions events will follow the course they havetaken in Europe.
Although Notestein’s theory has been elaborated, revised and crit-icised it still retains, even after fifty years, relevant arguments about thenature of demographic change as the response to socio-economicdevelopment, the possibility of drawing and applying lessons from theEuropean past, and the justification for policy interventions when eco-nomic development has stalled or failed to induce rapid modernisa-tion.43 From the perspective of Europe’s population history, andespecially the experience of England and Wales in the nineteenthcentury, Notestein’s theory of the demographic transition fits only someof the facts. First, and as will already be obvious from figure 1.1, thedemographic transition in England and Wales was not initiated by thesecular decline of mortality, but rather the modern rise of populationwas launched by a cyclical upswing in fertility after which mortalityand fertility declined together. Secondly, nuptiality variations did notplay a prominent part in the theory although the western Europeanexperience appears to have been influenced by the presence of a dis-tinctive form of marriage pattern, one which had dominated for severalcenturies in place of the extended family norm. Thirdly, althoughEngland might be described as the first industrial-urban nation, the pro-cesses of industrialisation and urbanisation cannot be said to have ini-tiated demographic change in any simple way. Indeed, urbanisationprobably worsened the life chances of the working population duringthe eighteenth and nineteenth centuries. However, the decline inmarital fertility probably was, as Notestein argued, very much a matterof changed attitudes, a new small family size ideal formed in the settingcreated by improved education, secularisation and the enhanced bar-gaining power of women.
Although it must be acknowledged that only a small part ofNotestein’s version of demographic transition theory applies to nine-teenth-century England and Wales it nonetheless provides a valuablepoint of departure; a framework against which to set empirical experi-ence so far as it is now known, and one to which reference will be madeon several occasions in the chapters that follow. But there are otherapproaches, rather less well formalised perhaps, which attempt to con-
20 The demography of Victorian England and Wales
43 These criticisms and revisions are far too numerous to list, but Greenhalgh (1995), pp.3–28, in particular raises important issues in relation to the limitations of modernisa-tion theory, the need to combine concepts of structure and agency, the dangers ofEurocentrism, and the importance of gender and culture. It is also important to appre-ciate that there are several parallel transition theories, for example Omran (1971) on epi-demiology and Zelinsky (1971) on mobility.