the design experience challenge 2 - awim.org · looking at gears in bicycles ..... 45 questions...
TRANSCRIPT

CHALLENGE 2
O R L D I N O T I O NA
T H E D E S I G N E X P E R I E N C ETM

Lesson Plans are not included in this document.
Check out the sample lesson plan located in the curriculum
resources.


The Society of Automotive Engineers, Inc. (SAE) is a nonprofit scientific organization dedicated to theadvancement of mobility technology in order to better serve humanity. A global society of nearly 70,000members, SAE is the leading professional organization for engineers and scientists involved with land, sea,air, and space mobility. Its members come from all branches of engineering, science, and technology. SAEcreates and distributes information through meetings, books, technical papers, magazines, standards, reports,continuing education programs, and electronic databases.
SAE’s educational goals include the promotion of excellence in math, science, and technology education in grades K–12 and beyond through the development of curriculum materials and volunteer mobilization. To this end, SAE invites and supports collaboration and partnership among schools, industry, communityorganizations, teachers, volunteers, and students. The materials for this program were made possible by agrant from the National Science Foundation and generous donations from corporations and individuals in the mobility industries. To lend your support to the program, please contact the SAE Foundation at (412) 776-4841.
SAE FoundationSociety of Automotive Engineers, Inc.
Copyright © 1996 by The Society of Automotive Engineers, Inc. Allrights reserved. Permission to reproduce the teacher manual and studentreproducibles is hereby granted by The Society of Automotive Engineers
to teachers for classroom use.

Acknowledgements
This program was developed for and supported by the Society of Automotive Engineers, International and the SAE Foundation.Pittsburgh, PennsylvaniaMary Beth Ament: Program CoordinatorJohn Boynton: Education Program DeveloperVeronica Meury: Foundation ManagerBarbara Pontello: Division Manager, Public Affairs and SAE Foundation
Written and Developed by Education Development Center, Inc.Newton, MassachusettsDan Dick, Bernie Zubrowski, Doug Haller, Shelley Isaacson, Cindy Char, Jan Ellis, Lorena Martinez, Brian Williams, Myles Gordon, and Marilyn Quinsaat
Formative Research and Student Assessment by the Learning Research andDevelopment Center, University of Pittsburgh.Pittsburgh, PennsylvaniaAnne Louise Fay, Britte Cheng, Erika Sueker, and Robert Glaser
Graphic Design by The Mazer Corporation.Dayton, OhioBill Franklin, Bill Pflaum, Kim Holtel, Joy Burns, Kay Selke, Jim Bartosik, Jim Higgins,Mark DaGrossa, Jim Redick, Lori Carusone, Ed Pokorski, Mindy Marik, Craig BuchananMazer Digital MediaBoston, MassachusettsJanet Dracksdorf, Chuck Langdon, Judd Gledhill, Rob Dawson
Advisors, Consultants, and ReviewersDorothy Bennett, Kristin Bjork, Robert Daiber, James Kaput, Glenn Kleiman, Diane Lind,Jim Minstrell, Jerry Pine, Ernie Savage, Ron Todd, Dan Watt
From The National Science FoundationGerhard L. Salinger, Program Officer
We would like to thank the following schools for their participation in the field test of the curriculum.
Field Test SchoolsAggassiz School, Cambridge, MAHaggerty School, Cambridge, MALessenger Middle School, Detroit, MIMorse School, Cambridge, MANorthern Granville Middle School, Oxford, NCPeabody School, Cambridge, MARegis College, College Awareness Program, Weston, MA
Classroom TeachersKaren Amati, Maryanne Asselin, George Baccus, Kathy Brown, Darlene Cash, Tim Currin,Mary Ann Cusack, Karen Fitzgerald, Corinne Gaile, Margaret Giacoppo, Glendora Hargrove,Nina Lindsey, Frances Louis, Marie Lynch, Jim McBride, Robin McDaniels, Ruth McMurray,Geralyn Narkiewicz Blossom, Mary Alice Parker, Joseph Pisapia, Nancy Rial, SumnerRichards, Birdie Senior, Amy Woo Skinner, Mary Woodilla
AdministratorsErnest Bibby, Dan Callahan, James Cody, Julie Cuppola, Juanita Clay Chambers, AndreHenry, Jean Nash, Eva Paddock, Juanita Washington
Aknowledgementsiv

Table of Contents v
INTRODUCTIONIntroduction to the Challenge ............................ viiOverview Chart—Activities by Recommended Discipline .................................. xx
Planning Chart ................................................ xxviii
SET GOALS ............................................... 1Reading and Evaluating the Request for Proposals (RFP) .................................................... 3Mobility Toys Inc. Request for Proposals ....... 7Evaluating the RFP Log Sheet ......................... 9
Meeting an Industry Volunteer ........................... 11Designing a Team Name, Logo, and Slogan ..... 13Using Design Logs ............................................... 17
Mobility Toys Inc. Design Log ....................... 21Design Log (blank) .......................................... 23Design Log (pegboard frame) ........................ 25Design Log (write-on lines) ............................ 27
Identifying the Customers .................................. 29Identifying the Customers Log Sheet ............ 31
Seeing the Big Picture ......................................... 33Seeing the Big Picture Log Sheet .................. 35Objectives and Criteria Log Sheet ................. 37
Creating a Design Checklist ................................ 39Checklist Log Sheet ......................................... 41
BUILD KNOWLEDGE .......................... 43Looking at Gears in Bicycles ............................... 45
Questions About Bicycle Gears ...................... 49What We Know About Gears .............................. 51Introducing the Gear Materials .......................... 55Recording Gear Rotations ................................... 61
Gear Rotation Recording Table ..................... 65Gear Rotation Recording Table (blank) ........ 67
Developing the Gear Ratio Formula ................... 69Gear Ratio Recording Table .......................... 73Gear Ratio Recording Table (blank) ............. 75
Using the Gear Ratio Formula ............................ 77Gear Ratio Practice Sheet .............................. 81Gear Ratio Practice Sheet (blank) ................. 83
Measurements and Ratios in Wheels and Gears (optional) ................................................. 85Circle Measurement Recording Table (blank) ................................................. 89
Circle Measurement Recording Table (sample data filled in) .................................. 91
Adding a Motor and Wheels ............................... 93Measuring Performance: Speed and Wheel Rim Force ................................................ 99Performance Recording Table ..................... 105
Challenge 2
TABLE OF CONTENTSActivities are listed in the order in which they appear in the Teacher Manual.Reproducible materials are shown in italics.
O R L D I N O T I O NA
T H E D E S I G N E X P E R I E N C ETM

Compound Gear Trains ..................................... 107Measuring Performance: Compound Gear Trains ....................................................... 113
Multiplying Fractions to Calculate Gear Ratios ....................................................... 117Multiplying Fractions to Calculate Gear Ratios Sheet ................................................ 123
Measuring the Rim Forces of Individual Gears ............................................... 125Measuring the Rim Force of Gears Recording Table .......................................... 131
Torque and Lever Arms ..................................... 133Torque and Calculation Table .................... 139
What We’ve Learned About Gears .................... 141Exploring Body Materials ................................. 143
Materials Testing Table ............................... 147Consumer Research: Conducting Interviews ... 149
Customer Interview Sheet: Child ................. 155Customer Interview Sheet: Parent .............. 157
Consumer Research: Conducting a Survey ...... 159Customer Survey Sheet: Parent ................... 163Customer Survey Sheet: Child ..................... 165
Consumer Research: What We’ve Learned About the Consumers ..................................... 167Sample Data Analysis Table ........................ 173What Have We Learned About the Customers? Sheet ....................................... 175
DESIGN .................................................... 177Integrating and Applying What We Know ...... 179Writing a Design Brief ....................................... 181Designing a Gear Train for the Prototype ....... 185Drawing Body Designs ...................................... 187
BUILD AND TEST .............................. 193Building a Prototype ......................................... 195Performance Testing the Prototype ................. 197Interpreting Performance Test Data ................ 199Redesigning the Prototype ............................... 201Focus Group Testing of Body Designs (optional) .............................................. 203
FINALIZE THE MODEL .................. 209Making a Body Mock-up .................................. 211Constructing the Body ...................................... 215Assembling, Testing, and Adjusting the Final Design ..................................................... 219
Planning for the Proposal and the Presentation .............................................. 221
Preparing the Written Proposal ........................ 223Types of Paragraphs Sheet .......................... 227Peer Evaluation Sheet .................................. 229
Writing a Resume (optional) ............................. 231Selecting and Organizing Information for a Resume ............................................... 235
Model Resume ................................................... 237Resume Worksheet ............................................ 239Preparing the Oral Presentation ....................... 241
Oral Presentation Outline ............................ 243Presentation Roles Worksheet ..................... 245Individual Presentation Skills Evaluation Sheet ........................................ 247
PRESENT ................................................. 249The Final Presentations ..................................... 251
Sample Letter to Review Panel Volunteers ........................................ 255
Reflecting on the Engineering Design Experience ........................................... 257
APPENDICES ........................................ 259Contacting Volunteers ...................................... 261
Sample Letter to Potential Volunteers ....... 264Mobility Toys Inc. Request for Proposals ............................................... 265
Gears, Torque, and Performance ...................... 267Designing a Gear Train for the Prototype: Using Calculations .......................................... 277Designing a Gear Train for the Prototype:Using Calculations Log Sheet ................... 285
Assessment ......................................................... 287Basic Understanding of Gears ..................... 293Design Log Assessment ................................ 297Design Log (Sunnyside Toy Co.) ................. 299Design Log (Wild West Toys, Inc.) ............... 301
Resources ........................................................... 303
Table of Contentsvi

Introduction to theChallenge
To survive and thrive in the society of tomorrow, our children need educationalpreparation that builds upon the technology of today. The needs of our societymandate that we educate students to be scientifically and mathematically literateand to be able to solve problems, communicate, ask and answer questions, assimi-late information, and work cooperatively toward common goals.
As educators we are called upon to go beyond the practice of dispensing scientificinformation and teaching students to manipulate rote formulas; we must alsostrive to help our students to achieve an inherent understanding of scientific phenomena and processes, and to use mathematics as an appropriate tool to solve problems.
Middle school students need to be competent and to feel confident in their abili-ty to use scientific methods to explore, conjecture, and reason logically and togather and manipulate information in order to gain useful knowledge about theworld around them. These abilities are nourished and nurtured when activitiesgrow out of interesting problem situations, and they are further stimulated anddeveloped through the interactive, cooperative processes of discussing, reading,and writing about their experiences.
Welcome to an adventure! The Society of Automotive Engineers has developed A World in Motion II: The Design Experience as an opportunity for students andteachers to use science, mathematics, and technology to explore the process ofdesign. This eight-week, integrated curriculum includes a manual for teachers,student reproducible masters, a set of planning posters, a classroom design poster,hands-on laboratory materials for constructing prototypes, a CD-ROM resourcedisc, and implementation videotapes.
Introduction to the Challenge vii

ABOUT THE CHALLENGEChallenge 2 is one of three challenge programs being developed for the middleschool curriculum A World in Motion II: The Design Experience. It is intended forseventh-grade students whose teachers are using a multidisciplinary approach.
For eight weeks the students engage in a problem-solving context for which theymust create a design to address a particular need. In this case, the challenge isposed in a letter from a fictitious toy company, Mobility Toys, Inc., which is inter-ested in receiving new designs for moving toys. The toy company sends a letter tothe class requesting written proposals, sketches, and working models of designsthat meet a specific set of requirements. Over the course of the curriculum, a vari-ety of activities will prepare the students to develop a proposal and a prototypefor a toy of their own design. The students must work in teams and as a team tocomplete the requirements stated in the letter. The program culminates in studentpresentations of their working models and a discussion of the design teams’efforts to address the challenge.
Students begin the Engineering Design Experience (EDE) process with goal-setting activities that encourage group building and identifying tasks. Studentscontinue to work in teams to develop the prototypes of models through whichthey explore many of the science and engineering concepts central to the toys’successful performance. Teacher-directed activities in the science, mathematics,technology education, social sciences, and language arts classes will cover thebasic concepts and skills needed to understand the principles behind the proto-types and apply them when building the models. These lessons includedemonstrations and hands-on experience examining force and friction, simplemachines, levers and gears, torque, etc. In mathematics, students apply an under-standing of ratio and proportion as they explore the relationship between gearratios and the radius of a wheel. Through gathering information from the clientand eventual “customers” and conducting controlled experiments, the studentsexplore data collection and retrieval techniques and apply basic statistical analysis.In addition, students apply their public speaking and writing skills as they preparea workable proposal and presentation.
THE ENGINEERING DESIGN EXPERIENCEA unique characteristic of this program is its use of a problem-solving processfavored by engineers in design teams and taught at many engineering schoolsacross the country. The EDE provides a problem-solving context in which studentsdesign a product or solution to a problem. The students examine what must beaccomplished and determine the target market; gather and synthesize informa-tion; predict a plausible solution; design, develop, and test a prototype orpotential design, and prepare for a presentation of their design ideas.
Introduction to the Challengeviii

Introduction to the Challenge ix
The EDE, as modified in this curriculum for middle school teachers and students,comprises six phases.
Set Goals. Students define goals through activities that stress sharing ideas andidentifying and setting priorities. They define the problem, identify parameters fordeveloping a solution, determine the users or “customers,” and establish objectivesfor successfully completing the job. Students also begin to develop a plan for thedevelopment process and related tasks, as well as to clarify roles within the team.They begin to develop an identity as a group by developing design team logosand slogans.
Build Knowledge. Students engage in a variety of inquiry-based activities involv-ing direct experiences with the materials to help them develop an understandingof the underlying scientific phenomena and mathematical concepts. Through consumer research activities, students also begin to study the makeup of potentialcustomers and markets.
Design. Students synthesize the information they have acquired with the newskills and concepts they have learned to propose solutions to the challenge. Theythen develop sketches and prepare a design brief that describes their proposedproduct.
Build and Test. Based on their proposed design, students select appropriatematerials for prototype development and performance testing, and develop drawings and diagrams to guide construction. Students develop a testing plan todetermine the likelihood of successful performance and the appropriateness of the solution.
Finalize the Model. Students complete the building of their prototype, carry outperformance tests, and then modify the prototype based on the results, providingevidence to support their changes. Students produce written documentation asevidence of their development process, such as a proposal and product specifica-tions. The proposal incorporates testing data and reflects their understanding ofthe design process and design team capabilities.
Present. Student teams present their work to a review committee comprising representatives from local industry, the community, and the school. The presenta-tions include demonstrations of the prototype, displays of charts and graphs fromthe testing phase, presentations of portfolios with designs and sketches, anddescriptions of the design teams’ contributions.

Introduction to the Challengex
In the middle-schoolyears, students’ workwith scientific investi-gations can becomplemented byactivities that aremeant to meet ahuman need, solve ahuman problem, ordevelop a product . . .
From National Research Council
THE CURRICULUM CONTENTThe EDE is an applied process that enables students to see how the field of engineering integrates knowledge and skills from science, mathematics, and tech-nology. In addition, the design challenge provides a context in which students canapply content and concepts from their previous learning experiences. The chal-lenge, as embodied by the EDE, embraces the direction of national standards inscience and mathematics education. Indeed, Challenge 2 is one of the few cur-riculum programs to address specifically both the National Research Councilstandards to educate students to develop products and solutions to problemsthrough technological design, and the National Council of Teachers ofMathematics curriculum standards emphasizing that students should see mathe-matical connections to the real world through mathematical thinking, modeling,and problem solving.
In addition to addressing the larger, overarching learning outcomes regardingdesign technology and problem solving, the curriculum also addresses specificobjectives in each of the related disciplines described below.
Science• Students begin to develop an understanding of forces acting on moving
objects by exploring the design of a moving toy. • Students extend their understanding of simple machines through their
explorations of gears, axles, wheels, and motors.• Students begin to understand the differences between science and technology
by developing the ability to use technological design processes and skills.
Mathematics• Students extend their understanding of rates and ratios as a relationship
between numbers.• Students systematically collect, organize, and describe data; make inferences
based on data; and develop an appreciation for statistical methods as a meansfor decision making.
• Students use physical materials to build conceptual development of algebraicvariables and relationships.
Technology Education• Students use development and production processes to solve a technological
design problem.• Students learn to create design briefs, sketches, and models. • Students explore properties of materials in designing a product.
Social Studies• Students develop research skills through conducting interviews and gathering
data on consumers.• Students develop marketing skills through an understanding of customer needs.
Language Arts• Students develop writing skills through a variety of writing products such as
design logs, journals, and proposals.• Students develop oral language skills through the preparation and execution of
formal presentations.• Students develop communication skills through performing collaborative tasks
with their peers.
SCIENCE ANDTECHNOLOGYContent Standard E: As a result of activities ingrades 5-B, all studentsshould develop• Abilities of
technological design• Understanding about
science and technology
GUIDE TO THE CONTENT STANDARDFundamental abilitiesand concepts thatunderlie this standardinclude• Abilities of
Technological Design.• Design a Solution
of Product.• Implement a
Proposed Design.• Evaluate Completed
Technological Designsof Products.
• Communicate the Process ofTechnological Design.
From National Research Council National Science Education Standards

INTEGRATED LEARNING AND TEACHINGThe EDE incorporates many facets of learning within the eight-week period. Someactivities include explorations of materials and concepts that are completely newto the students. Others use already familiar mathematical tools such as data col-lection and graphing techniques to organize information. In some cases the bestway of using information from one activity may be to integrate it with informa-tion from another activity. This process requires the collaboration of teachers inplanning and teaching, as well as the cooperation of students in their designteams. The middle school reform movement proposes changing the structure andorganization of schooling and how students learn in the classroom. A teamingapproach to teaching calls for a small group of teachers to have collective respon-sibility for a group of students within the school. The team then jointly plans andimplements the curriculum for all disciplines, thereby fostering interdisciplinarystudies and considering the academic, social, and emotional development of thewhole student. Clearly, this is the optimal environment for A World in Motion II:The Design Experience.
The core teaching team should consist of science, mathematics, and technologyeducation teachers with additional support from social studies, and language artsstaff. Since most of the classroom activities come under the supervision of the science, mathematics, and technology education teachers, the coordinating andfacilitating role will most likely rest with them.
Initially, teachers in the team will need to read the curriculum thoroughly, devotepreparation time to developing an implementation plan and strategy, and definethe scope and nature of the collaboration across the disciplines and classes.Schools may decide to implement this program either with one or two classes, or across an entire grade.
The teachers will need to determine who will teach which activities and how bestto communicate information about activities that are closely integrated. Becauseof the “teaming” nature of the program, it is recommended that teachers in theteam meet at least once a week to reassess the schedule, troubleshoot any exist-ing problems, and plan for the next set of activities. A recommended schedule isprovided in the Overview Chart.
STUDENTS WORKING IN TEAMSIn addition, the teachers will need to decide how students will be placed in designteams and how to handle the logistics of providing materials and support for indi-vidual teams. For a program of this nature, heterogeneous groupings make for thebest combination of individual skills and interests. However, a considerableamount of research indicates that young women in the middle school benefitfrom studying in all-female groups. At that age, young men in the group, whomay well have had more experience working with materials and thus feel moreconfident doing so, tend to dominate explorations with the materials and discus-sions of the phenomena. Many of the young women will be working with gears,axles, wheels and motors for the first time and may be inhibited when talkingabout their emerging understandings of the phenomena. It has also been observed
Introduction to the Challenge xi
STANDARD 4:MATHEMATICALCONNECTIONSIn grades 5–8, themathematics curricu-lum should include theinvestigation of mathe-matical connections sothat students—• apply mathematical
thinking and model-ing to solve problemsthat arise in otherdisciplines, such asart, music, psychology,science, and business;
• explore problemsand describe resultsusing graphical,numerical, physical,algebraic, and verbalmathematical modelsor representations;
From National Council ofTeachers of Mathematics,Curriculum and EvaluationStandards for SchoolMathematics

that teachers of both genders tend to ask boys more questions in activities of thisnature. It has been our experience that mixed-gender groupings work fine whenteachers are aware of the issues and actively work to improve the comfort level oftheir female students. Ultimately, it is the teachers who are best able to decidewhich students can work together in groups. The success of the program is alsoinfluenced by how well the students have worked in groups in the past, and thechances of success are further increased if the students are already familiar withcollaborative and cooperative learning strategies.
VOLUNTEERS IN THE CLASSROOMThis program is unique in encouraging the active participation of volunteers inthe classroom. Volunteers can play a key role in helping design teams to imple-ment the challenge during various phases of the EDE. Some volunteers may act as advisers throughout the eight weeks. Others may assist in one or two activitiesby describing how their own work relates to the students’ design experience.Throughout the activities, suggestions for using volunteers are provided asVolunteer Tips.
Volunteers may be identified through collaborations formed from implementingthe Partnership Builder packet. Others may be found within the local business and industry community, as well as through parents in the school community. For more information on the use of volunteers, see the appendix ContactingVolunteers.
THE ACTIVITY SEQUENCEThe following outline describes how Challenge 2, through the EDE, may unfold inthe school, classroom, and community context. While the description outlines thevarious phases of the EDE process, classroom implementation is iterative as stu-dents take in new information, constantly evaluate and gauge their designdecisions, and explore other options.
Week 1Set Goals. Students receive a request for proposals (RFP) from a fictitious toycompany, Mobility Toys Inc., to develop designs for new motorized, gear-driventoys. These toys can be cars, boats, animals, parade floats, or any moving toy thatthe design teams determine will interest young boys and girls. Each studentdesign team is invited to submit a proposal and prototype model that meets per-formance specifications. The RFP gives very specific criteria for performance, forexample, the ability to climb a 15° grade and to travel 3 meters in 3 seconds orless from a standing start. These criteria provide opportunities to explore conceptsand factors important to mobility such as speed, forces, and friction. The RFPspecifies design guidelines, date of completion, and standards of performance.
Students define their own goals through activities that stress sharing ideas andidentifying and setting priorities. Students establish objectives and discuss whatthey must learn to succeed—all activities that challenge many adults and are critical for a productive work force.
Introduction to the Challengexii

Weeks 2–4Build Knowledge. The activities in this phase encourage students to learn basicconcepts and skills related to the EDE challenge. The need to meet the challengeor solve the problem serve both as a context and motivation for learning. Theseactivities are closely aligned to the specific performance, design, and customerneeds for the prototype designs. During this phase, students explore materials andphenomena through trial and error, experimentation, and questioning. From thishands-on work they begin to gain an understanding of the variables, constraints,materials and phenomena that affect design and performance. For example, stu-dents create vehicles with a variety of gear ratios and test their performance togain a better understanding of how gear ratio affects performance. They investi-gate the concepts underlying the simple lever and wheel, gear configurations, andratios; and through experiments they build an understanding of the relationshipsbetween energy, forces, and motion.
Students may find that in addition to conceptual understanding, they also neednew skills to complete a task. The social studies and mathematics teachers canhelp students in their effort to assess customer needs by teaching consumerresearch skills such as designing a survey, writing good interview questions, select-ing a sample, finding averages and medians, organizing and representing data,and analyzing results. These activities and information feed back to the students’design and development.
Throughout the process, teachers have a range of opportunities for assessing student learning. In many cases assessment and curriculum are integrated, as students’ performance on many of the tasks provide insight into their under-standing. Student design teams maintain portfolios of their work and their designlogs. The design logs contain a collection of checklists, worksheets, and reportforms to be completed. Teachers may also serve as preliminary reviewers for thereview panel. Industry volunteers can be used to assist the design teams and theteachers, or to see if the teams need any additional consultants or specialists fromthe community.
Weeks 5–6Design and Build and Test Phases. Students synthesize their newly acquiredinformation to propose potential solutions to the challenge. In this phase theybegin to design, build, test, and evaluate their final prototype toy cars. Afterexperimenting with various gear configurations, students predict that certain configurations are more appropriate for meeting specific performance criteria.Consumer research will also indicate other factors that may influence a successfuldesign such as body styling and use.
The processes of gathering information and proposing solutions is followed by aprocess of designing a solution, developing drawings and diagrams to guide con-struction, and building the prototype with the materials.
As the prototypes are developed, the students use testing techniques to examineperformance and customer preference. They use quality assurance processes suchas testing in focus groups to evaluate their prototype design features. The goal isto optimize their vehicle’s design and performance. During this time, studentstake on a range of roles. Some design, others build; some create experiments, oth-ers conduct the experiments; some record and organize the data, others analyzethe data. Everyone is essential; all participate.
Introduction to the Challenge xiii

Many of the students find that their initial design is not appropriate and somediscover that their original assumptions and understandings about how gearswork were incorrect. They therefore have to re-examine their designs and retesttheir new prototype. Students repeat this cycle as often as they need to, eventual-ly making only minor adjustments as they become happier with the performanceand design.
Weeks 7–8Finalize the Model. Construction includes building the final models, preparingreports, and developing graphics for the presentation. Each member of the teamtakes responsibility for some aspect of the final product.
Week 8Present. For the culminating activity, the design teams present written, visual,and oral reports documenting the design and development process, the consumerand testing data, solutions, and their design team capabilities.
To prepare for the presentation, teams develop charts and graphs displaying theirtesting and consumer data. In language arts and art classrooms they work ontheir written proposals, resumes, and other visuals. In the technology educationclassrooms, they put the prototypes through their final paces.
At the same time, the volunteers and teachers assemble the review committee forthe final presentation. Representatives from business and industry partners, a localmarketing specialist, the principal, parents, and community representatives may beasked to review the design team presentations. Representatives from the localtelevision station, newspaper, and corporate newsletter may be invited to chroniclethe event.
WRITING AND DESIGN LOGSA World in Motion II: The Design Experience encourages a fair amount of writingby students. Recording and keeping track of data and designs are critical elementsof the EDE. The design logs become a tool for students to organize their designthinking and process systematically. Indeed, many engineers keep logs, journals, orsketches as evidence of their creative work should questions arise concerningcopyright or intellectual ownership.
Writing also enables students to articulate and capture their emerging under-standing of difficult concepts and phenomena. During the EDE, students shouldbe encouraged to write in their design logs often. Each design team should have a three-ring binder as a design log. Student reproducible masters can be copied,completed, and stored in the team design log. Individual student writings, such asjournal entries, can also be kept in special sections.
Introduction to the Challengexiv

ABOUT GEARSThe design of the moving toys as specified in the letter from Mobility Toys, Inc.requires students to construct prototypes with a pegboard frame, steel axles, rub-ber wheels, plastic gears, and a motor powered with an AC adapter. Forces andmotion, as well as general movement, are explored in the assembly of these simpleand complex elements. Gears play a key role in the potential performance of themoving toys. For many students, this may be their opportunity to explore gears,examine the role they can play as an extension of simple machines, and see howthey provide mechanical advantage. Some students will have trouble with some ofthe fundamental concepts about gears, for example, that meshing gears rotate inopposite directions.
The selection of appropriate sizes and assembly of the gears to the motor andaxle are important factors that enable the moving toys to perform in specificways. A simple gear arrangement of a smaller driver gear rotating the driven gearon the axle will enable the car to move relatively fast. A compound gear arrange-ment increases the amount of torque, or twisting force, that will enable themoving toy to climb a steep grade or pull a load.
Developing an understanding of gear ratios, the relationship between the num-ber of rotations of the driver gear and the driven gear, is another concept thatstudents will explore and use in their emerging ideas about gears, forces, andmotion. Understanding that a ratio is really a relationship between two parts is a central mathematical concept.
Students should be given plenty of time to explore with the materials and developtheir own language and understanding of the phenomena. They may not emergewith a full mastery of the concepts, but they will use that understanding to devel-op a prototype and begin to develop a better sense of mechanical advantage,simple and complex machines, and forces and motion. For further informationabout these concepts, see the appendix Gears, Torque, and Performance.
ABOUT CONSUMER RESEARCHThe design process almost always entails designing a product or solving of aproblem for another person or persons. The designer must therefore think beyonda design that is personally pleasing and project the potential preferences of others.In business, a designer must consider who the customers are. In this unit, thetypes of customers students must consider include the actual users (six to tenyear-old boys and girls), the people who buy the product (parents), the peoplewho might market and sell the product (toy store owners), and the people who are requesting the product (Mobility Toys, Inc.).
Like all designers, students will have a tendency to design what they would like,or assume that a customer would like what they like. “Determining customerneeds” is a new objective for the students. They will accomplish it by identifyingwho the customers are, interviewing representatives from the customer group toget a general sense of preferences and interests, analyzing the information, andcollecting data in sufficient numbers to assess the appropriateness of the findings.
Introduction to the Challenge xv

ABOUT COLLECTING, ANALYZING, AND DISPLAYING DATAUsing and manipulating numbers as data are typical activities in middle schoolmathematics. At this age, students continue to develop a sense of how data aregathered, begin to understand the basic fundamentals of statistical analysis, andgrapple with making sense of the data collected. As students interview prospectivecustomers, the design challenge provides a concrete opportunity for them to grap-ple with the use of numbers and information, use mathematical tools to processthat information, and begin to interpret the information in ways that may be useful in developing their ultimate designs.
Introduction to the Challengexvi

Introduction to the Challenge xvii
Recommendations are provided for co-teach-ing within the team. Some activities can betaught together. Some should be taughtimmediately following others.
A concise descriptionof the student tasksprovides teachers witha quick picture of theclassroom activity.
An overview of the concepts helps prepareteachers for student understanding.
The recommended subject area for the activity is markedfor quick reference. Teachers from other subject areasmay facilitate or assist in teaching the activity.
Writing a Design Brief
Introduction
WHAT STUDENTS DO IN THIS ACTIVITYIn this activity, student design teams use the information from the Integratingand Applying What We Know activity to write a design brief. The design specifica-tions outline the characteristics of the toy they plan to design for MTI.
The design specifications include a description of the consumers for whom they are designing, the consumers’ toy preferences, the type of toy (race car, jeep,truck, parade float), the appearance of the toy, and the desired performance of thetoy (fast, slow, high torque, low torque).
RATIONALE Students translate their analysis of what they know about the RFP, gears, and the consumers’ needs into design specifications of the toy’s performance and appearance.
TIME1–2 class sessions
MATERIALS• paper and pencil for writing descriptions• for each design team, any notes they recorded in their Design Logs during the
Integrating and Applying What We Know activity• for each design team, research findings from the Consumer Research:
What We’ve Learned About the Consumers activity, the class charts from theWhat We’ve Learned About Gears activity, and a copy of the RFP
Writing a Design Brief 181
DESIGN
SCIE
NCE
MA
TH
EM
AT
ICS
TE
CH
NO
LO
GY
SO
CIA
L S
TU
DIE
SL
AN
GU
AG
E A
RT
SE
DU
CA
TIO
NMAKINGCONNECTIONSIn this activity, designteams will need todraw on the discus-sions they had in theIntegrating andApplying What WeKnow activity. In addi-tion, students’ designspecifications will inte-grate informationthey’ve gathered aboutthe RFP, gears, and theconsumers during theSet Goals and BuildKnowledge phases. Ifyou are not aware ofwhat students did inthese activities, youmay want to ask otherteachers in the team to help out with this activity.

Introduction to the Challengexviii
Many suggestions for classroom instructionwere provided by teachers who have successfully used the curriculum.
Encourage the active participation of volunteers as a valuable resource forstudents as well as teachers.
Recommended ques-tions guide discussionduring student explorations.
VOLUNTEER TIPStudents canshow theircompleted design briefto an industry volun-teer for comments andfeedback.
Classroom Activity
ACTIVITY DESCRIPTIONTell students that they will be designing a prototype. What is a prototype? The prefix proto- comes from the Greek word protos, or “first”. A prototype is aninitial design to test and evaluate.
Ask students: Have you ever built a model as the first step in designing some-thing? Have you ever built something, then made another, improved model?
One approach to building a prototype product is to take all the available relevant information about the product to be designed and write a brief description of the product. This description is called a design brief. Write this term on the board.
In the Integrating and Applying What We Know activity, students analyzed thedata they gathered about gears and about the consumers. Now, each design teamwrites a design specification for the toy it plans to design.
Students can approach this task in several steps:1. Select the performance criteria you want to achieve in your toy, and what you
want your toy body to look like. Based on what you now know about gearsand about the consumer, which criteria from the RFP will you try to meet?Why? What will the body look like? Why? The team may try to build a toy that will have broad appeal by meeting as many of the RFP criteria as possible,or they may decide to make a specialty toy that is fast, or powerful, or appealsto a particular type of consumer. Students should include reasons for their decisions.
2. Predict the gear train design that you think will meet the criteria you haveselected. What will the gear ratio be? Students should include the evidence for their prediction.
3. Describe your design in detail. The design brief might be roughly one pagelong. It should include brief descriptions of the following:• A profile of the consumer for whom you are designing the toy. The
consumer profile should be based on the consumer research and includeinformation such as ages, genders, toy buying habits, and toy preferences.
• The performance criteria in the RFP that you intend for the toy to meet. Will it be fast, slow, have high torque or low torque? Do you want to designa toy that will go fast, or one that can go up an incline?
• The prototype toy’s functional characteristics. Is it a race car? a jeep? a construction truck? a parade float?
• The appearance of the toy. Teams should include a rough sketch of their toy’s appearance.
FACILITATING STUDENT EXPLORATIONHelp students stay focused on using the data they have gathered. They may want to design a toy that meets their own interests. Remind students that theythemselves are not the customers.
Writing a Design Brief182
TEACHER TIP Some
students will want tostart by working withthe materials. In suchcases, remind the students that it isimportant to envisionand describe what theywant their vehicle toaccomplish beforeattempting to build it.

Introduction to the Challenge xix
Discussion is critical to help students articulatetheir understanding of concepts and to helpdirect their design decisions.
Space is left near theend of lessons forteacher notes.
SHARING AND INTERPRETING Each design team can give a brief presentation of its design brief. This can be anopportunity for students to practice giving oral presentations in preparation forthe final presentation. It can also be an opportunity for students to hear how theother design teams are approaching the design task.
Homework Idea
Students can begin to sketch out ideas for their prototype toy and bring thesesketches to their design team meetings.
Writing a Design Brief 183
Notes
SCIE
NCE
MA
TH
EM
AT
ICS
TE
CH
NO
LO
GY
SO
CIA
L S
TU
DIE
SL
AN
GU
AG
E A
RT
SE
DU
CA
TIO
N

Overview Chartxx
Wee
k 1
Mon
day
Tues
day
Wed
nesd
ayTh
ursd
ayFr
iday
Scie
nce
Mat
hem
atic
s
Tech
nolo
gyEd
ucat
ion
Soci
al S
tudi
es
Lang
uage
Art
s
Read
ing
and
Eval
uating
the
Requ
est
for
Prop
osal
s
Mee
ting
an
Indu
stry
Volu
ntee
r
Usi
ng D
esig
nLo
gs
Iden
tifyi
ng t
heCu
stom
ers
Des
igni
ng a
Te
am N
ame,
Logo
, and
Slo
gan
Seei
ng t
he
Big
Pic
ture
Crea
ting
a D
esig
nCh
eckl
ist
Ove
rvie
w C
ha
rt -
Ac
tiv
itie
s b
y R
ec
om
me
nd
ed
Dis
cip
lin
e
Set
Goa
ls

Overview Chart xxi
Wee
k 2
Mon
day
Tues
day
Wed
nesd
ayTh
ursd
ayFr
iday
Scie
nce
Mat
hem
atic
s
Tech
nolo
gyEd
ucat
ion
Soci
al S
tudi
es
Lang
uage
Art
s
Look
ing
at
Gea
rs in
Bic
ycle
s
Cons
umer
Rese
arch
:Co
nduc
ting
Inte
rvie
ws
Wha
t W
e Kn
owAbo
ut G
ears
Intr
oduc
ing
the
Gea
r M
ater
ials
Bui
ld K
now
ledg
e

Overview Chartxxii
Wee
k 3
Mon
day
Tues
day
Wed
nesd
ayTh
ursd
ayFr
iday
Scie
nce
Mat
hem
atic
s
Tech
nolo
gyEd
ucat
ion
Soci
al S
tudi
es
Lang
uage
Art
s
Intr
oduc
ing
the
Gea
r M
ater
ials
(con
tinu
ed)
Cons
umer
Rese
arch
:Co
nduc
ting
a Su
rvey
Reco
rdin
g G
ear
Rota
tion
sAd
ding
a M
otor
and
Whe
els
Deve
lopi
ng t
heGe
ar R
atio
For
mul
a
Mea
suri
ngPe
rfor
man
ce:
Spee
d an
d W
heel
Rim
For
ce
Usi
ng t
he G
ear
Ratio
Form
ula
Bui
ld K
now
ledg
e (c
ontinu
ed)

Overview Chart xxiii
Wee
k 4
Mon
day
Tues
day
Wed
nesd
ayTh
ursd
ayFr
iday
Scie
nce
Mat
hem
atic
s
Tech
nolo
gyEd
ucat
ion
Soci
al S
tudi
es
Lang
uage
Art
s
Mea
suri
ngPe
rfor
man
ce:
Spee
d an
d W
heel
Rim
For
ce
(con
tinu
ed)
Usin
g th
e Ge
arRa
tio F
orm
ula
(con
tinue
d)
Expl
orin
g Bod
yM
ater
ials
Com
poun
d G
ear
Trai
ns
Mea
sure
men
ts
and
Ratio
s in
Whe
els
and
Gear
s (o
ptio
nal)
Mea
suri
ngPe
rfor
man
ce:
Com
poun
d G
ear
Trai
ns
Mul
tiply
ing
Frac
tions
to
Calc
ulat
e Ge
arRa
tios
Bui
ld K
now
ledg
e (c
ontinu
ed)

Overview Chartxxiv
Wee
k 5
Mon
day
Tues
day
Wed
nesd
ayTh
ursd
ayFr
iday
Scie
nce
Mat
hem
atic
s
Tech
nolo
gyEd
ucat
ion
Soci
al S
tudi
es
Lang
uage
Art
s
Mea
suri
ng t
heRi
m F
orce
s of
Indi
vidu
al G
ears
Torq
ue a
nd
Leve
r Arm
sCo
nsum
erRe
sear
ch: W
hat
We’
ve L
earn
edAbo
ut t
heCo
nsum
ers
Wha
t W
e’ve
Lear
ned
Abo
utG
ears
Inte
grat
ing
and
App
lyin
g W
hat
We
Know
Wri
ting
a
Des
ign
Bri
ef
Dra
win
g Bod
yD
esig
ns
Bui
ld K
now
ledg
e (c
ontinu
ed)
Des
ign

Overview Chart xxv
Wee
k 6
Mon
day
Tues
day
Wed
nesd
ayTh
ursd
ayFr
iday
Scie
nce
Mat
hem
atic
s
Tech
nolo
gyEd
ucat
ion
Soci
al S
tudi
es
Lang
uage
Art
s
Wri
ting
a D
esig
nBri
ef (co
ntin
ued)
Dra
win
g Bod
y D
esig
ns(c
ontinu
ed)
Des
igni
ng a
Gea
rTr
ain
for
the
Prot
otyp
e
Desi
gnin
g a
Gear
Trai
n fo
r th
ePr
otot
ype:
Usi
ngCa
lcul
atio
ns
(opt
iona
l)
Bui
ldin
g a
Prot
otyp
e*
Focu
s G
roup
Test
ing
of
Bod
y D
esig
ns(o
ptio
nal)
Perf
orm
ance
Test
ing
the
Prot
otyp
e*
Inte
rpre
ting
Perf
orm
ance
Te
st D
ata*
Des
ign
(con
tinu
ed)
Bui
ld a
nd T
est
*The
se a
ctiv
itie
s sh
ould
not
be
cons
ider
ed n
eces
sari
ly a
s di
scre
te, s
eque
ntia
l tas
ks. T
he a
ctiv
itites
in
the
Bui
ld a
nd T
est
phas
e ar
e iter
ativ
e an
d m
ay v
ary
in le
ngth
of
tim
e de
pend
ing
on t
he n
eeds
of
the
desi
gn t
eam
s.

Overview Chartxxvi
Wee
k 7
Mon
day
Tues
day
Wed
nesd
ayTh
ursd
ayFr
iday
Scie
nce
Mat
hem
atic
s
Tech
nolo
gyEd
ucat
ion
Soci
al S
tudi
es
Lang
uage
Art
s
Rede
sign
ing
the
Prot
otyp
e*M
akin
g a
Bod
yM
ock-
upCo
nstr
ucting
th
e Bod
y
Plan
ning
for
the
Prop
osal
and
the
Pres
enta
tion
Prep
arin
g th
eW
ritt
en P
ropo
sal
Wri
ting
a R
esum
e(o
ptio
nal)
Bui
ld a
nd T
est
(con
tinu
ed)
Fina
lize
the
Mod
el

Overview Chart xxvii
Wee
k 8
Mon
day
Tues
day
Wed
nesd
ayTh
ursd
ayFr
iday
Scie
nce
Mat
hem
atic
s
Tech
nolo
gyEd
ucat
ion
Soci
al S
tudi
es
Lang
uage
Art
s
Cons
truc
ting
the
Bod
y (c
ontinu
ed)
Prep
arin
g th
eO
ral P
rese
ntat
ion
Asse
mbl
ing,
Test
ing,
and
Adju
stin
g th
eFi
nal D
esig
n
The
Fina
lPr
esen
tation
sRe
flec
ting
on
the
Engi
neer
ing
Des
ign
Expe
rien
ce
Fina
lize
the
Mod
elPr
esen
t

Overview Chartxxviii
Wee
k M
onda
yTu
esda
yW
edne
sday
Thur
sday
Frid
ay
Scie
nce
Mat
hem
atic
s
Tech
nolo
gyEd
ucat
ion
Soci
al S
tudi
es
Lang
uage
Art
s
Pla
nn
ing
Ch
art
Society of Automotive Engineers, Inc. ©
1996

259
Appendices
Contacting Volunteers
Gears, Torque, andPerformance
Designing a Gear Train for the Prototype: UsingCalculations (optional)
Assessment
Resources
Appendices


Contacting Volunteers
The 8-week design challenge is further supported through the involvement ofvolunteers in the community. Through volunteer examples and sharing of
experiences, students begin to see that many of the tasks and processes that theyare learning are indeed taken from real-life design, production, and engineering processes. The following sample letter is a guideline after you have made an initialcontact with potential volunteers for the program. Ongoing communication with thevolunteers is encouraged to ensure that they fully understand the overall goals of theprogram, their role in supporting the program, and logistical details regarding workingwith students in classrooms.
Contacting Volunteers 261

Contacting Volunteers
Volunteers from the community, particularly from business and industry, can beeffective resources to help students address the design challenge and understandthe engineering design experience. To ensure the success of the collaboration,good communication between the teachers and volunteers is essential. Arrangingadequate communication requires careful attention. The volunteers and teacherswill most likely have conflicting schedules. Teachers generally work between theearly morning and late afternoon hours (8:00 am to 4:00 pm). During this time,teachers’ schedules are not very flexible nor are they readily available for meetings.Business and industry volunteers generally work between early morning and lateafternoon hours as well (9:00 am to 5:00 pm). Their schedules do allow for meet-ings, but are generally planned well in advance. In addition, business and industryvolunteers often work well past their usual “quitting times” in order to completeprojects or meet deadlines.
A combination of a few meetings and regular telephone calls will help withsuccessful communication between all collaborators.
FACE-TO-FACE MEETINGSIt will be necessary for teachers and volunteers to meet face-to-face during thecourse of the 8-week program. Three meetings of this nature, at key points duringthe program, should be suitable.• Introductory Meeting—This meeting should occur before the implementation
of the program and serves as an opportunity for the teachers and volunteers tointroduce themselves as well as learn about one another. This meeting shouldalso be used to discuss their past experiences, individual perspectives, goals forthe program, and the program curriculum. The teachers may want to knowabout the volunteer’s experience with students. The volunteers may want toknow how much involvement the teacher expects of them in the classroom.Prior to the meetings, a letter (see Sample Letter to Potential Volunteers)should be sent to volunteers. The sample letter includes suggestions for howthe volunteer may participate in the program.
During the meeting, the curriculum materials should be available to help alladult participants become familiar with the nature of the program. At this time, the volunteers should decide on the level of their participation. They may choose to visit the classroom once as a special guest. Hopefully, they willbecome so excited about the program that they will see a role for themselves as a regular supporter. Be prepared to make copies of any of the materials that may help the volunteers prepare for their specific task.
APPENDICES
Contacting Volunteers262

Contacting Volunteers 263
For example, if a volunteer is planning to share examples from his or herdesign log, journal, or sketchbook with the students, then make a copy of theactivity Using Design Logs.
Prepare a calendar of events or use the planning chart to sketch out poten-tial visits by volunteers. Make sure everyone gets a copy of the planning chart.
Provide volunteers with requirements for any school procedures that need to be followed, such as checking in at the school office during any visit and thenames of key school personnel. Finally, have an open discussion about theneed for scheduling and keeping appointments. Explain to the volunteers thatclassroom visits must be honored. It is difficult for teachers to re-organize theirinstructional time if the volunteers cancel at the last minute. At the same time,teachers need to understand that the demands of many businesses require theiremployees be available for frequent changing needs. If there is an emergencyand the volunteer must reschedule, explain that they must give the teachers asmuch advance notice as possible.
• Mid-project Meeting—If the volunteers are planning to participate throughoutthe 8-week program, then teachers and volunteers should agree to meet again.This meeting should occur somewhere at the halfway point of the program,preferably prior to the Design phase. This meeting has two basic purposes. Thefirst is to evaluate the program’s effectiveness thus far. The teacher and volun-teer should discuss student understanding of the material, areas which mayneed further development, and any problems which may have arisen. The sec-ond purpose of the meeting is to plan for the second half of the program. Thisshould include discussion of future topics, and scheduling of the volunteer’sinvolvement in the classroom. Planning of the final student presentationshould also occur if the volunteers intend to participate as panel reviewers.
• Evaluation Meeting—This meeting should occur after completion of the designexperience to evaluate the program’s effectiveness. Were the goals of the pro-gram achieved? Was the volunteers’ involvement in the classroom effective?How can the program be improved for the future? In addition, use this meetingas an opportunity to celebrate the students’ success and the collaboration ofteachers and volunteers.
TELEPHONE CONVERSATIONSThe telephone may offer the best solution for regular communication betweenteachers and volunteers. Frequent phone conversations, after classroom instruc-tion hours, will alleviate the need for numerous face-to-face meetings. Teachersand volunteers should attempt to make the phone conversations as regular aspossible, with a planned date and time. Many teachers do not have ready accessto a telephone. Explain to the volunteers any logistical procedures for contactingteachers by telephone during school hours. Give volunteers the name of theschool receptionist or secretary.
Use the telephone conversation to update the volunteer on how the studentsare responding to the program. Update any changes to the planning calendar. In addition, verify details and reconfirm appointments for future classroom participation.

Contacting Volunteers264
Society of Automotive Engineers, Inc. ©
1996
Sample Letter toPotential Volunteers
To: Volunteers for A World in Motion II: The Design Experience
From:
Date:Thank you for considering to act as a volunteer in our program A World in Motion II: The DesignExperience. We are excited to embark on this adventure to teach and learn about the designed worldusing processes from the engineering design experience. A World in Motion II: The Design Experienceis an 8-week program in which students work in design teams to address a design challenge.
The design challenge is set in a scenario in order to build coherency and immediacy to theexperience. In brief, the scenario is organized around a letter from a fictitious toy company, MobilityToys, Inc. The letter is structured as a request for proposals (RFP) in which design teams are asked tosubmit designs for a new line of gear-driven, motor-powered toys. A copy of the letter from the toycompany is attached.
During the 8-week program, students in their design teams gather information, learn and applymathematics and science concepts, maintain design logs, and design, test and present their finalprototypes. Throughout the process, they are supported by volunteers from the community who lendknowledge and experience to the process of design, production and engineering. The followingincludes a partial list of the kinds of roles and tasks that volunteers might engage in as a support tothe program:• explain what designers and engineers do• share examples of design logs and journals• share examples of various gears• discuss how to conduct market research• demonstrate how to create design sketches• share your resume• act as an advisor to a design team• review final presentations
Your participation may be a brief presentation to the students, or it may involve a continuing,supporting role in the 8-week experience. I will contact you shortly regarding the details of yourinvolvement. Thank you again for your willingness to be a part of our exciting new venture.

Soci
ety
of A
utom
otiv
e En
gine
ers,
Inc.
©19
96
Dear Designers:
Mobility Toys, Inc. (MTI) is a leading developer and manufacturer of toy cars, airplanes,
trains, boats, pull-toys, and other moving toys. MTI is well known for its Traveler line of
motorized toys. This line includes the Speedster, a drag-racer that speeds across smooth
flat surfaces, and the Splash, an amphibious truck that can travel through water as well
as over land.
OUR DESIGN NEEDS
MTI is looking for designs for a new line of motorized gear-driven toys to replace its
Traveler line. Our market research has shown that the Traveler line has become less pop-
ular with our target audience of boys and girls between the ages of 6 and 10. We need
your designs for the new Globe Rangers line of toys that will appeal to this audience.
We are especially interested in new designs that will interest girls. We don’t currently
have enough information about how different types of moving toys would appeal to
this audience. It may be that new and different designs and styles, including toys that
don’t even necessarily look like cars or trucks, such as animals, parade floats, or robots,
may attract our target customers. We need you to find out what customers want, then
give us designs that will engage them.
THE WRITTEN PROPOSAL
Interested design teams should submit a written proposal to MTI. Each written proposal
should include these items:
• a description of your toy design,
• design drawings,
• an explanation of why you think the design will appeal to 6-to-10-year-old girls
and boys,
• results from consumer research about what the customers want,
• results from performance tests that show that your design meets at least one of the
minimum criteria given below, and
• a brief biography of each member of the design team describing his or her design
experience and roles on the design team, with resumes, if possible.
Request for Proposals
(continued)
265

266
Society of Automotive Engineers, Inc. ©
1996
THE DESIGN PRESENTATION MEETING
On ���������������������������� MTI will hold a design presentation meeting. At this meeting
a review panel will listen to presentations from each design team. Each design team
should be prepared to give us a 10-minute presentation on their toy design. Each
presentation should include these segments:
• Introduce the design team members and their roles in the design process
• Describe how you developed your design
• Demonstrate that your design meets at least one of the minimum criteria
stated below
• Show evidence that your design meets the needs of customers
• Argue strongly for why MTI should use your team’s design
THE MINIMUM PERFORMANCE STANDARDS
MTI is only interested in toys that meet minimum performance standards. In your pre-
sentation, you must demonstrate that your toy can meet at least one of the following
three performance standards. Your toy must be able to do one of the following:
• travel over a course of three meters from a standing start under its own power in
three seconds or less, or
• climb a 30-degree slope from a standing start under its own power for a distance of
at least one meter, or
• climb a 15-degree slope for one meter from a standing start under its own power in
two seconds or less.
We emphasize that these are minimum requirements. We expect that successful designs
will exceed at least one of these performance standards, depending on the type of toy
you design. At a later date, motors, gears, wheels, axles, and frames will be given to
design teams in order to build your prototypes.
At MTI our slogan is, “The customers’ interests are our interests.” Our products are
designed to give our customers what they want. We look forward to seeing your suc-
cessful proposals showing how your designs live up to our slogan.
Sincerely,
Marilyn NewmanDirector of New ProductsMobility Toys, Inc.

Gears, Torque, and Performance
In this challenge students investigate the properties of gears. They use whatthey learn about the performance characteristics of gears to build a motorized
toy that meets certain performance specifications. This section will explain the rela-tionship between the size of the gears and their effect on gear-train performance. Itwill also provide information on the physics that underlie the behavior of gears toallow you to give additional guidance and support to student learning.
Gears, Torque, and Performance 267

Gears, Torque, andPerformance
Gear Trains: Driver Gears and Driven Gears
Here is a simple gear train:
The motor turns the motor axle. The teeth of a gear mounted on the motor axlemesh with the teeth of another gear mounted on a second axle. A wheel ismounted on the second axle and turns with it.
The meshing gears transmit torque, or a turning force, from the motor to thewheel. The two gears do different jobs: The teeth of the gear on the motor axlepush against the teeth of the gear mounted on the wheel axle and turn it. Thefirst gear is a driver gear because it turns, or drives, another gear. The second gear is a driven gear because it is turned, or driven, by the first gear. A driver geartransmits torque from an axle to a driven gear. A driven gear transmits torquefrom a driver gear to an axle.
GEAR RATIO AND PERFORMANCEGear trains are often used in machines to change the amount of torque and rotational speed from one axle to another. The amount of torque and speed transmitted depends on the relative size of the driver gear and driven gear in each meshing pair of gears in a gear train.
APPENDICES
A gear train is a series oftwo or more meshinggears.
Gears, Torque, and Performance268

Gears, Torque, and Performance 269
In this unit students investigate gear ratio by counting the relative number ofrotations of a pair of meshing gears. As they discover, the gear ratio affects the performance of their vehicles.
Students build test vehicles with different gear ratios and test the performanceof these vehicles to see how fast they go and how much torque their wheels have.They discover that vehicles with higher gear ratios have higher torque at the wheeland slower speeds, whereas vehicles with lower gear ratios have lower torque atthe wheel and generally higher speeds.
Students use their understanding of the performance characteristics of differentgear ratios to design a gear train for their toy vehicles. If they want the vehicle tobe able to climb a steep incline, they know it will need a high gear ratio to givethe wheels more torque. If they want their toy vehicle to go fast, they know thatthey need a gear ratio high enough to provide torque but low enough to providerelatively high rotational speed at the wheels.
TORQUEIn this unit the rotating objects are gears and wheels. The gears and wheels rotatearound a pivot point, which is the center of the axle on which the gear or wheel is mounted.
Gears transmit torque from one axle to another. In a meshing pair of gears, thedriver axle provides torque. The teeth of the driver gear push against the teeth ofthe driven gear, turning it. This pushing force transmits the torque to the drivengear, which in turn transmits the torque to the driven axle.
TORQUE AND LEVER-ARM LENGTHThe amount of torque a gear transmits to or from an axle depends on the size ofthe gear. Let’s use a more familiar example to illustrate the effect of the size ofthe gear on the torque it transmits.
A gear ratio is the ratioof the number of turnsof the driver gear to thenumber of turns of thedriven gear.
Torque is the ability of aforce to produce rota-tion in an object.

Gears, Torque, and Performance270
To turn a revolving door, you push on the door with your arm to make thedoor rotate around the pivot point at its center. If you push at the outside edge ofthe door, you need to push with less force than if you push nearer the pivot point.
You can demonstrate this to yourself using any door. First, open the door bypushing near the outside edge. Now open the door by pushing near the pivotpoint, or hinge. You will feel how much harder you have to push.The distancefrom the pivot point to the point where the force is applied is called the lever arm.This definition is valid only when you apply the force perpendicular to a line thatjoins the pivot point and the point at which you apply the force. There are otherways to define lever arm, but the above definition is the simplest and suffices forunderstanding gears.
When you push farther from the pivot point, you are using a longer lever arm.When you push closer to the pivot point, you are using a shorter lever arm.
The farther from the pivot point you push, the longer the lever arm and themore torque you create. This relationship can be expressed more precisely as fol-lows: The amount of torque given to the door is equal to the amount of forceapplied multiplied by the length of the lever arm. Thus, if the lever arm is twice aslong, the torque will also be twice as great.
This can be expressed as a formula:
torque � force � lever arm
A note about unitsForce is often measuredin units called newtons.A force of 1 newton isequal to the weight of a100-gram mass (thoughit is not defined thatway). The standard unitof measuring torque isthe newton meter. Onenewton meter is thetorque created by aforce of 1 newton at alever-arm distance of 1meter. A unit of torquemeasurement used inthe United States is thefoot-pound. One foot-pound is the torquecreated by a 1-poundweight resting at the endof a 1-foot lever arm.

Gears, Torque, and Performance 271
Let’s use the formula to find the torque in the two situations shown below.
Suppose you push with a force of 10 newtons using a lever arm of 1 meter. Let’suse the formula to find the torque in the turning door.
torque � 10 newtons � 1 meter � 10 newton meters
If you push with the same force of 10 newtons but with a lever arm of only .5meters, then
torque � 10 newtons � .5 meters � 5 newton meters
If you push with the same force, but with a lever arm half as long, you create halfthe torque. The torque is directly proportional to the length of the lever arm. Youwould have to push twice as hard using a lever arm of .5 meters to produce thesame torque as you would if the lever arm were 1 meter (twice as long). If the leverarm were .1 meter, you would have to push with 10 times the force to produce thesame amount of torque as if you were pushing with a lever arm of 1 meter.
TORQUE AND DRIVEN GEARSLet’s look at how this relates to gears. Imagine that our revolving door is a spoked wheel.
Now imagine that the interior of the wheel is filled in. The tips of each spokestick out and serve as lever arms.
It now resembles a gear. The ends of the lever arms are the gear teeth. A forcepushing on one of the teeth perpendicular to the lever arm would create torqueto turn the gear, just as a force pushing on one of the doors would turn therevolving door.

Gears, Torque, and Performance272
The length of each lever arm is the same as the radius of the gear (the distancefrom the center to the end of a tooth). The larger the radius of the gear, thelonger the lever arm that transmits the torque to the axle.
As with the revolving door, the longer the lever arm, the greater the torqueproduced. If a 10-newton force were applied perpendicular to a tooth on each ofthe gears, the large driven gear with a radius (lever arm) of 1 meter would pro-duce a torque of 10 newton meters (10 newtons � 1 meter) in the driven axle.
(Note: We will continue to use 1 meter and .5 meters as lever-arm lengths forthe gear examples in order to simplify the torque calculations, even though mostgears are much smaller than this.)
The small gear, with a radius (lever arm) of .5 meters would produce a torqueof 5 newton meters (10 newtons � .5 meter) in the driven axle.
The larger the driven gear, the more torque is produced in the driven axle. Thetorque transmitted from the outside edge of the driven gear to the driven axle isdirectly proportional to the radius (or diameter, or number of teeth) of the drivengear.
In the Measuring the Rim Forces of Individual Gears activity, students test the forces produced at the rim of the 15-tooth gear, the 45-tooth gear, and the75-tooth gear as driven gears. They find that the 75-tooth driven gear producesthe most force in the driven axle and the 15-tooth gear the least force. This isbecause the 75-tooth gear has the longest lever arm of the gears in the kit andthus transmits the most torque to the driven axle. The 15-tooth gear has the

Gears, Torque, and Performance 273
shortest lever arm and transmits the least torque to the driven axle.A gear and the axle on which it is mounted have the same torque because they
move as one object and share a pivot point. Between meshing gears, however, theforce—not torque—is the same, because the two gears do not share a commonpivot point. A gear tooth from the driver gear applies a force on the gear tooth ofthe driven gear. Torque can be reduced or increased from the driver gear to thedriven gear because of the different lengths of their respective lever arms.
In a similar way, the speed of the teeth of two meshing gears is constant—incontrast to the rotational speeds of the gears, which are usually different. Whenthe driver gear advances by one tooth, so does the driven gear. Since the twogears have different numbers of teeth, the rotational speeds (the number of turnsper unit of time) can be different.
TORQUE AND DRIVER GEARSLet’s now consider the torque transmitted by driver gears. In a driver gear, the axleprovides the torque. The driver gear transmits the torque via its teeth to a drivengear. Let’s examine the relationship between the size of a driver gear and thetorque it transmits. For example, the 75-tooth driver gear transmits the least turn-ing force and the 15-tooth gear the most. Let’s examine why.
The relationship of torque, force, and lever arm is the same as with the drivengear we considered earlier. The torque in the axle is still equal to the force timesthe lever arm.
The torque is supplied by the driver axle, perhaps connected to a motor. Lookingat the equation, we see that for a given torque, the greater the lever arm, the lessthe force must be. The force and lever arm are inversely proportional.
Let’s consider an example: If the torque in the driver axle is 10 newton metersand the lever arm of the driver gear is 1 meter, then the force at the end of thelever arm is 10 newtons.
Here is the above example expressed in the form of the torque equation:torque of 10 newton meters = force of 10 newtons � lever arm of 1 meterLet’s look at the force at the gear teeth if the driver gear is half the size:
torque of 10 newton meters � force of 20 newtons � lever arm of .5 meter
If the driver gear is half the size, then the force at its teeth is doubled. The smallerthe driver gear, the more force it will transmit to the driven gear. The larger the
torque � force � lever arm

Gears, Torque, and Performance274
driver gear, the less force it will transmit to the driven gear.The gear train on the left produces twice the torque at the wheel of the gear trainon the right.
You can demonstrate this to yourself by doing the following simple exercise.Hold your arm out straight. Attach a weight on your arm near your shoulder. Tryto raise your arm. Now attach the weight near your elbow and raise your armagain. Now attach the weight to your hand and raise your arm again.
The weight is easiest to lift near your shoulder because the lever arm is shortest.The weight is hardest to lift at the end of your arm because the lever arm is thelongest; your muscles have to supply more torque to your arm to lift the sameamount of weight.
TORQUE, GEAR RATIO, AND PERFORMANCELet’s compare three gear trains to see how the relative size of the driver gear and driven gear affects the torque and rotational speed of the driven axle. We’llassume that all three gear trains use a motor that has the same torque androtational speed.
Gear Train A Gear Train B Gear Train C
In gear train A the driver gear is twice the size of the driven gear. In gear train B,the driver gear and driven gear are the same size. In gear train C, the driver gear ishalf the size of the driven gear.

Gears, Torque and Performance 275
The following table summarizes the measurements of the gears. (Note thatactual measurements of the driven-axle torque would be less because of frictionbetween the moving parts.)
For every turn of the driver gear of gear train A, the driven gear turns twice. Theforce at the teeth of the driver gear is the lowest, as we would expect with thelarge driver gear. The torque at the driven axle is also the lowest of the threeexamples. A vehicle with this gear train would produce a high rate of rotation forthe wheel, but it would probably not have enough torque to climb a hill or per-haps even to begin moving from a standing start. Examples of machines that usea gear train like this are a salad spinner, a hand-cranked egg beater, and a handdrill. These machines increase the rotational speed of the driver axle but reduce its torque.
Because the driver gear and driven gear in gear train B are the same size, thetorque in the driver axle and driven axle of the gear train on the left are the same(except for some loss due to friction). The rate of rotation of the wheel would bethe same as that of the motor. A vehicle with this gear train would produce amoderate rate of wheel rotation and would be a better hill climber than one withgear train A. Because this gear train changes neither rotational speed nor torque,it would have limited use except, perhaps, as part of a multispeed transmission(see below).
Gear train C produces the highest torque in the driven axle, twice that of thedriver axle. The wheel at the end of this gear train would rotate half as fast as thewheel in gear train B and 1⁄4 as fast as the wheel in gear train A. A vehicle withgear train C would produce a slow rate of wheel rotation and would be the besthill climber of the three. Because electric- and gasoline-powered motors common-ly provide a high rotational speed and a relatively low torque, their gear trains areoften designed with a high gear ratio that increases torque while providing aslower, more usable rate of rotation.
Some machines, such as automobiles, have a transmission that offers severalgear ratios, which can be selected depending on the relative amounts of rotationalspeed and torque required for different operating conditions. The highest gearratio (first gear) is used to accelerate from a stop. The lowest gear ratio (fourth or fifth gear) is used for driving at a constant high speed, where lower torque is needed.
Gear train
Driver-axletorque
(in newtonmeters) Gear ratio
Driver-gearlever arm
(in meters)
Force atdriver-gear
teeth
Driven-gearlever arm
(in meters)
Driven-axletorque
(in newtonmeters)
A
B 10 1:1 1 10 1 10
C 10 1:2 1 10 2 20
10 1:2 2 5 1 5


Designing a Gear Train for the Protype: UsingCalculations
Designing the gear train for the toy designs is an important step in the engi-neering design experience. As the students manipulate and test various gear
trains, they begin to develop an understanding of how gears can influence the perfor-mance of their toys. This exploration and experimentation enables students to designa gear train that will meet the challenge specifications. Many real-life engineers usemathematical analyses—in this case, calculations to predict performance of various geartrains—to determine design requirements. Designing a Gear Train for the Prototype:Using Calculations is an example of a mathematical analysis activity. It demonstratesthe type of analysis that engineers might do and students might use in determininggear ratios needed to meet the performance criteria of their toys.
Designing a Gear Train for the Prototype: Using Calculations 277


Designing a Gear Train for the Prototype: Using Calculations 279
APPENDICES
TEACHER TIP For addi-
tional informationabout torque, see theappendix Gears,Torque, andPerformance.
Designing a Gear Trainfor the Prototype: UsingCalculations (optional)
Introduction
WHAT STUDENTS DO IN THIS ACTIVITYIn the Writing a Design Brief activity, design teams wrote specifications for theirprototype designs, including the type of toy and its intended performance. In thisactivity design teams use basic mathematics and what they have learned from theBuild Knowledge phase about the characteristics of gear trains and gear ratios todetermine gear ratios and design gear trains that will meet the speed and torque(climbing the incline) requirements in the RFP.
RATIONALEThis activity gives students an example of how engineers use mathematics in thedesign process. Having students design the gear train using mathematical analysisbefore actual construction allows them to experience an important step for engi-neers in the engineering design process. Calculating the gear ratio that will meetperformance requirements involves mathematical analysis similar to the kind thatengineers use in design, and the activity will therefore help students to appreciatethe power of mathematics in solving problems.
Students will engage in the following:• use mathematics to determine what gear ratios meet the performance
requirements stated in the RFP• use these gear ratios to design a gear train• develop an understanding of how engineers use mathematics in designing
TIME1–2 class sessions
SCIE
NCE
MA
TH
EM
AT
ICS
TE
CH
NO
LO
GY
SO
CIA
L S
TU
DIE
SL
AN
GU
AG
E A
RT
SE
DU
CA
TIO
N

MATERIALSfor each design team• paper • pencils • calculators• Designing a Gear Train for the Prototype: Using Calculations Log Sheet
Classroom Activity
ACTIVITY DESCRIPTIONExplain to the students that engineers bring many kinds of knowledge to everydesign task. They use their understanding of the design requirements, theirknowledge of the properties of the materials they are using, and their experiencein solving related problems. One essential tool that allows engineers to link allthese kinds of knowledge is mathematics. Engineers often use mathematical for-mulas and calculations when they design. They use mathematics to calculate howmuch torque an engine must produce to lift a given weight, how much askyscraper will sway in a 30-mile-per-hour wind, and what gear ratio is requiredto move a given vehicle at a given speed.
In this activity students will see how they can use their knowledge of geartrains and mathematics to determine a gear ratio that will meet the performancerequirements provided in the RFP. They will use mathematics to predict an appro-priate gear ratio for their toys.
Ask students to recall what they already know about their toy and the materialsthat will help them design a gear train to meet the requirements in the RFP.Students may provide a variety of information—such as the diameter of thewheels, the circumference of the wheels, the distance the vehicle needs to travel,or the speed needed to meet the requirements. In mathematics, this information isreferred to as the known values. Students will use some of the known values tocompute the unknown values. Unknown values are data that students do notknow and cannot easily measure.
DESIGNING A GEAR TRAIN TO MEET THE SPEED REQUIREMENTOne requirement of the RFP is that the toy should travel 3 meters in 3 seconds.Students can assume that to meet this speed requirement, the vehicle shouldtravel 1 meter in 1 second. They know that from a standing start the toy vehiclemust accelerate to reach a constant speed. Explain to the students that for thepurpose of meeting the goals of this activity, they should assume that the speed isconstant in their calculations. If they can find out how fast the motor is turningand how fast the wheels need to turn, they can design a gear train to convert themotor speed to the required wheel speed.
Ask the students how they can find out how fast the wheels must turn to makethe car go 1 meter per second. First they need to find out how far a wheel willtravel in 1 rotation. The distance the wheel will roll in 1 rotation is the same asthe circumference of the wheel.
If students did the Measurements and Ratios in Gears and Wheels activity, theyfound the circumference of a wheel either by measuring it, rolling the wheel out
Designing a Gear Train for the Prototype: Using Calculations280

Designing a Gear Train for the Prototype: Using Calculations 281
TEACHER TIP Remind
students to be carefulabout the units theyuse when doing thecalculations. You mayavoid this problem byproviding all knownvalues in standardunits, in this casemeters and seconds.Rotational speed isoften described as rev-olutions per minute,whereas the manufac-turer’s specificationsfor the motor aredefined in revolutionsper second (rps). TheRFP, however, statesthe requirements inmeters per second.Therefore, it’s best touse meters and sec-onds when calculating.
TEACHER TIP If students
have difficulty, con-sider posing the samequestion with easiervalues, for example: If each wheel travels 1 meter in 1 rotation,how many rotationswill it take to travel 4 meters? It may alsohelp students under-stand the concept ofrotational distance ifthey use a chart listingthe number of rota-tions with distancetraveled.
on a piece of paper, or multiplying the diameter by pi (3.14). If the students didnot do the activity, you should help them find the rolling distance now. Thediameter of the wheel is approximately 55 millimeters. The rolling distance isapproximately 172.7 millimeters.
Pass out the Designing a Gear Train for the Prototype: Using Calculations LogSheet. Students should record their answers in the designated area on the Log Sheet.
Check to see that the students know that the wheel will travel 172.7 milli-meters (approximately) in one rotation. Remind the students that the speed of thetoy is measured as the time the vehicle takes to travel one meter. Ask students thefollowing question:• How many times must the wheels rotate in order to travel one meter?
Students should begin to understand the relationship between the values:
number of rotations needed �distance required
distance traveled in one rotation
Now, inserting those values into the above equation, students get:
rotations needed to go 1 meter �1 meter
172.7 millimeters
Students can divide 1 meter by 172.7 millimeters to find the number of wheelrotations needed to go 1 meter. Before dividing, they must convert 172.7 milli-meters to meters. Since 1 millimeter is 1/1000th of a meter, they must multiply172.7 millimeters by .001 meters per millimeter to convert it to meters:
172.7 millimeters �.001 meters
� 0.1727 meters1 millimeter
Students can now divide 1 meter by 0.1727 meters to find the number ofrotations the wheel will make as it travels 1 meter:
rotations needed to go 1 meter �1 meter
� 5.79 rotations0.1727 meters
Now the students know that 5.79 wheel rotations are needed to travel 1 meter. • How fast must the wheel rotate in order to travel 1 meter per second?
The wheel must rotate 5.79 times in 1 second in order to travel 1 meter per second.
rotations per second � number of rotations needed
1 second
Distance traveledNumber of rotations
1 172.72 345.43 518.14 690.85 863.56 1036.1
SCIE
NCE
MA
TH
EM
AT
ICS
TE
CH
NO
LO
GY
SO
CIA
L S
TU
DIE
SL
AN
GU
AG
E A
RT
SE
DU
CA
TIO
N

Now the students know that the drive wheels of the vehicle must rotate 5.79rotations per second to meet the speed requirement of 1 meter per second.
The manufacturer of the motor has determined that a good speed for themotor to turn when powering a car at the desired speed is approximately 1400rotations per minute, or 23.3 rotations per second. The students have calculatedthat in order to go 1 meter per second, the wheels must turn about 6 (5.79)rotations per second. Ask students the following questions:• How can you convert a motor speed of 23 rotations per second to a wheel
speed of 6 rotations per second?• Can you use gears to do this? • Must you increase or decrease the motor speed to match the required
wheel speed?• What gear ratio will convert the motor speed to the required wheel speed?
Students can use the concepts learned in Developing the Gear Ratio Formula toarrive at the answer to the last question. In the students’ toys, the rotation of themotor drives the rotation of the wheels. In other words, the motor is the driverand the wheel is the driven. Students can use the gear ratio equation:
gear ratio required �rotation of motor (driver)rotation of wheels (driven)
required gear ratio �23.3 rotations per second
� approximately 4:15.79 rotations per second
Gear ratios greater than 1 result in a decrease in rotational speed. Students canuse this information to check their values. If their calculated gear ratio is lessthan 1, suggest that they recalculate.
Students now have an idea of the gear ratio needed to achieve the vehicle’sspeed requirements. Using the data in the Designing a Gear Train for thePrototype: Using Calculations Log Sheet, they can use this information to designthe initial gear train for the toy.
Students cannot make a gear ratio of 4:1 using the supplied gears. They maywant to try gear ratios of 3:1 or 5:1.
There are many factors that may cause these calculated ratios not to achievethe desired speed. The required gear ratio will probably be higher than calculatedhere because friction and imperfections in gear fitting reduce the efficiency of themotor-gear train system.
DESIGNING A GEAR TRAIN TO MEET THE TORQUEREQUIREMENTIn this section of the activity, the students will use mathematics to predict thegear train that will enable their vehicle to climb a 30-degree incline. They willneed to use their understanding of forces and gears to complete the analysis. Thestudents will organize their data using the section of the Log Sheet on meetingthe torque requirement. Ask the students again to record any known values thatwill help with their calculations.
Designing a Gear Train for the Prototype: Using Calculations282

Designing a Gear Train for the Prototype: Using Calculations 283
The development of the required torque analysis will require more teacherguidance and involvement. The students will use their understanding of torqueand gear ratios to identify the best gear-train design for their toys.
To meet the speed requirement, students must calculate what gear ratio isrequired to match the motor rotational speed with a slower wheel rotationalspeed. For the torque requirement, students must calculate what gear ratio isrequired to increase the motor torque to meet a higher wheel torque requirement.
Begin by telling students that the force required to travel up a 30-degreeincline is equivalent to pulling with a 320-gram force on level ground.
You may wish to use this analogy to clarify: Consider a game of tug-of-warbetween two teams. If team A is pulling the rope with a force of 320 grams, howhard must team B pull? In order to win, team B must pull with a force greaterthan that with which team A is pulling. The same concept can be applied to thestudents’ toys. In order for the vehicle to move, it must pull with a force greaterthan the weight pulling on it.
Remind students that their toy needs a force of at least 320 grams to move upthe incline. How much force can the vehicle’s wheels produce when they areattached directly to the motor using no gears?
In order to answer this question, students must know the maximum torque ofthe motor. This value is given by the manufacturer as 44 gram centimeters. Nowask students the following question:• How can you use what you know about torque and lever arms to compute the
force at the wheels?
Since torque = force � lever arm, students can use the torque and lever arm tofind the force at the wheels. Since the lever arm of the wheel is equal to its radius,they can measure the radius, or simply divide the diameter they found above bytwo. The wheel radius is approximately 2.8 centimeters.
The relationship between the motor torque and the force produced by thewheels is given by the equation:
maximum force produced by wheels �maximum torque of the motor
radius of the wheels
Filling in their values, students get:
maximum force produced by wheels �44 gram centimeters
� 15.7 grams2.8 centimeters
Thus, the maximum force produced by the wheels when attached directly to themotor with no gears is 15.7 grams. This measurement can be verified by measuringthe force directly using a scale, as students did in the Measuring Performance: Speedand Turning Force and Measuring Performance: Compound Gear Trains activities.
Now students know that they need to produce a force of 320 grams at thewheels to meet the requirements. However, their motor will produce a force ofonly 15.7 grams in the wheels by itself. Ask students the following questions:• How can you increase a wheel force of 15.7 grams to a wheel force of
320 grams?• Can you use gears to do this? • Must you increase or decrease the motor force to match the required
wheel force?• What gear ratio will convert the motor force to the required force?
SCIE
NCE
MA
TH
EM
AT
ICS
TE
CH
NO
LO
GY
SO
CIA
L S
TU
DIE
SL
AN
GU
AG
E A
RT
SE
DU
CA
TIO
N

Designing a Gear Train for the Prototype: Using Calculations284
TEACHER TIP The gear
ratio calculated in therequired torque sectionmay not satisfy theforce requirements forthe toy. The requiredgear ratio will probablybe higher than calcu-lated here becausefriction and imperfec-tions in gear fittingreduce the efficiency ofthe motor-gear trainsystem. The weight ofthe vehicle may bemore or less than the600 grams used in thecalculation. These val-ues serve only as aninitial estimate for thestudents.
The students learned in previous activities that gears can be used to increase theturning force of a motor. They must now determine what gear ratio will increase theturning force of their motor to the force needed to meet the requirements. In otherwords, they must calculate by how much to multiply the turning force of the motorin order to produce the required force. This can be expressed mathematically as:
required gear ratio �force required to go up a 30 degree incline
force produced at the wheels attached directly to the motor
required gear ratio �320 grams
� 20.4:115.7 grams
The calculation tells us that the gear ratio needs to be at least 20:1 in order for avehicle to go up the 30-degree incline.
Gear ratios greater than 1 increase torque. Students can use this knowledge tocheck their values. If their calculations resulted in a gear ratio of less than 1,suggest that they rework their mathematics.
Students now have some idea of the gear ratio needed to achieve their vehicle’sforce requirements. Using the data recorded in their Log Sheet, they can use thisinformation to design the initial gear train for the toy.
SHARING AND INTERPRETINGAssuming that all of the students are using the same motors and wheels, eachdesign team should have the same gear ratios. The importance of this exercise liesin the students’ interpretation of each mathematical step. Students should presenttheir data to the class with an interpretation of each step.
Notes

Name ����������������������������������� Design Team ��������������������������� Date ������������������
Designing a Gear Train for the Prototype: Using Calculations 285
Soci
ety
of A
utom
otiv
e En
gine
ers,
Inc.
©19
96
Wheel diameterWheel
circumference
Distance wheeltravels in 1 rotation
Wheel rotationsrequired to go
1 meter
Wheel rotationsper secondrequired to go 1 meter per second
Motor rotationsper second
Gear ratiorequired to go 1 meter per second
Wheel forcerequired to travel
up a 15-degreeincline
Maximum motortorque Wheel diameter Wheel radius
Force produced at wheel
attached directly to the motor
Gear ratio required to
go up a 15-degree incline
Designing a Gear Trainfor the Prototype: UsingCalculations Log Sheet
1. Designing a Gear Train to Meet the Speed Requirement
2. Designing a Gear Train to Meet the Torque Requirement


Assessment
The success of the 8-week challenge posed by Mobility Toys, Inc. is largelybased on the completion of the final design products. Testing of discrete skills
is not optimal in this situation since students are being asked to use knowledge,skills, and processes to address the design challenge. Evaluations from the reviewpanel, team teachers, and student self-evaluation at the conclusion of the 8-weekexperience are better indicators of the success of the program. However, throughoutthe 8-week period you will need to assess how well the students are understanding thematerial and how effective they are in accomplishing the various tasks.
Included in this section are suggestions for two areas of assessment: PortfolioAssessment and Assessment Activities on Gears. The suggestions for PortfolioAssessment are recommended as evidence of individual student involvement andunderstanding of tasks during the various phases of the design experience. TheAssessment Activities on Gears are suggested to help you gain a better picture of howthe class as a whole is comprehending concepts related to gears.
Assessment 287

PortfolioAssessment
After completing the challenge posed by Mobility Toys, Inc. (MTI), students willlikely be very enthusiastic about their final products. While students should cer-tainly be proud of these accomplishments, they should also realize that theprocess of completing the Engineering Design Experience (EDE) is as important as the end result. Having design teams create a portfolio of the work they com-pleted throughout the EDE will help you and your students assess theiraccomplishments in the context of their work throughout the unit and theirunderstanding of the EDE process, not simply the quality of their final products.
Students can compile their portfolios in preparation for the final activity,Reflecting on the Engineering Design Experience. This final activity is an opportu-nity for students to reflect on what they’ve learned throughout the 8-weekchallenge. The activity asks the class to reflect on some global questions aboutthe EDE, such as the following: What are the phases engineers go through whendesigning a product? What is unique or important about each phase? What aresome of the ways in which engineering draws on math, science, social studies,language arts, and art? How well did your design teams work together?
Design teams should review and select work from each of the phases of the EDE to include in their portfolios. Thinking about the specific activities they completed in each phase will help prepare students for the more globalquestions posed in the discussion section of the Reflecting on the EngineeringDesign Experience.
You may want to begin the portfolio assignment by having the class agree onwhat types of things should be included in their portfolios and what criteriashould be used to assess the portfolios. Alternatively, below is a list of key itemsfrom each phase that design teams might include, as well as some questions tohelp you and your students use their portfolios to assess their progress throughoutthe EDE.
SET GOALS• “Seeing the Big Picture Log Sheet” from Seeing the Big Picture• “Objectives and Criteria Log Sheet” from Seeing the Big Picture• “Checklist Log Sheet” from Creating a Design Checklist
Were students able to understand what the letter from MTI required of them?Were students able to identify the tasks that needed to get done?
APPENDICES
Portfolio Assessment288

Portfolio Assessment 289
BUILD KNOWLEDGE• “Performance Recording Table” from Measuring Performance: Speed and Wheel
Rim Force and Measuring Performance: Compound Gear Trains • Consumer Interviews and Surveys and Summary of Consumer Research Results
Were students able to use the information they gathered about gears and theconsumers to begin to think about a design?
DESIGN, BUILD AND TEST, AND FINALIZE THEMODEL• Design Brief• Performance Testing Data• Focus Group Discussion Guide and Summary of Focus Group Results• Final Design
Did students understand the importance of consumer and performance testing? Did students appreciate the idea of using test results to improve their design? Can students demonstrate how their designs reflect their test results?
PRESENTProposal to MTIOral Presentation Notes
Did students’ proposals and presentations meet all of the requirements specifiedby MTI in the RFP?
OTHER ITEMSTeam LogoSample Design Logs
In what ways did students value working as a team?
Assessment Activities on Gears
The following assessment activities are designed to help you gauge understand-ing of some concepts that students often find difficult. The activities can helpyou identify your students’ reasoning in relation to these concepts and supportthem in developing their ideas further.
These activities can be undertaken by students individually, in teams, or inwhole-class discussions. Alternatively, you may want to do the activities with a ran-dom group of students or with carefully selected students, to help you get a pictureof the class level of understanding. Working on these activities should be a learningexperience for the students, as they are asked to apply their reasoning to new kindsof problems. Having the students present, compare, and discuss their reasoning ofthe problems to you and one another can help you assess their understanding.
There are two assessment activities. The Gear Assessment (Assessment #1)focuses on students’ basic knowledge of gear mechanisms and can be completedany time after the gear activities in the Build Knowledge phase. The Design LogAssessment (Assessment #2) focuses on students’ understanding of design logs as(a) tools for monitoring and thinking about the design process and (b) graphicmodels for gear-driven vehicles. This activity can be completed any time duringor after the Design, and Build and Test phases.

Each of the assessment activities includes background information about stu-dents’ understanding of the concepts, suggestions on how to use the activity toassess students’ understanding, and student assessment sheets.
Assessment #1: Basic Knowledge of Gears
This assessment activity focuses on students’ understanding of gear mechanisms,including the concepts of gear ratio, relative rotation and meshing of teeth, therole of the driver gear vs. the driven gear, and compound gears.
This activity can be used any time after students have completed the gearactivities in the Build Knowledge phase.
BACKGROUND ON STUDENTS’ UNDERSTANDING OF GEARSStudents often have difficulty linking their knowledge of how gears work to themathematical calculations involved in computing gear ratios. Most of the difficul-ties students have working with gear ratios can be traced to this problem,although their ideas about how gears work can further complicate the calculationof gear ratios (such as the idea that simple gears in the middle of a gear trainaffect the gear ratio). Some of their ideas about how gears work and what a gearratio is can be thought of as misconceptions, preconceptions, or emergingconceptions of the phenomenon. We use the word misconceptions in a generalsense to reflect students ideas about a concept.
Below are some common misconceptions students often have about how gears work.
• To calculate gear ratio, add up the number of teeth on each gear in the train(or multiply them together) and divide the result by some number (the totalnumber of gears, pi, the size of the largest gear, etc.).
Although students know that computing a ratio involves dividing one number byanother, they do not connect this to a causal mechanism underlying the conceptof gear ratio (that is, the number of times the driven gear turns relative to thedriver gear). Students who cannot make this connection will not be able to selectthe proper numbers to put into the gear ratio equation.
When calculating gear ratios, students may need guidance in making the linkbetween the notions of driver gear and driven gear, the relative number of teethon each gear, and their relative number of rotations of each gear. Students whocannot remember “which number is which” may be helped by having their atten-tion focused on the output of the gear train, that is, the number of times thedriven gear turns. Continually relating the calculation of gear ratios to the outputof the device can give students the tools to discover patterns; for example, with ahigh ratio, the driver gear turns more times than the driven gear does. Also, whenthe driver and driven gear are the same size, the ratio is 1:1.
Portfolio Assessment290

Portfolio Assessment 291
• To calculate the gear ratio, divide the number of teeth on the driver gear bythe number of teeth on the driven gear.
In other words, students often calculate the ratio “upside down”. Studentsoften mix up the idea of number of rotations with relative numbers of teeth.Students need to understand that a gear ratio is the relationship between thenumber of rotations of the driver gear and the driven gear. Students may also findit helpful to work with the fractions in a non-reduced form.
• All gears have 15, 45, or 75 teeth.
Students tend to get locked into the particular gear sizes provided in the class-room materials. For instance, they may think that in every device with a gear ratioof 3:1, the driver gear has 15 teeth and the driven gear has 45. Because it is notpossible to produce a full range of gear ratios with the classroom gears (forinstance, one cannot produce a simple train with a 4:1 ratio), it is essential to usea variety of gear sizes in discussions of gears. Practicing with examples thatinclude gear sizes other than those in the classroom can help prevent this rigidityof thinking.
EVALUATING STUDENTS’ PERFORMANCEQuestions that ask students to calculate the gear ratio of a pictured gear train orto draw a gear train that has a given ratio can reveal more than just whether theycan perform mathematically correct calculations. Through the nature of theiranswers, you can also learn whether students have grasped the concepts underly-ing gear ratios. For instance, when shown a train that has a driver gear with 40teeth and a driven gear with 10 teeth, the correct computation is 1:4. If studentsarrive at the answer 1:3, they may be assuming that the gears in the picture arethe same kinds of gears as those being used in the classroom, that is, a 45-toothand a 15-tooth gear. The false assumptions may in turn indicate that the studentsdo not have a strategy for determining the size of gears (by counting the teeth).
Other students may reverse the correct ratio and give the answer 4:1 which infact represents the ratio of the relative numbers of teeth on the two gears, but notthe relative rotation. Students who reverse the ratio probably do not understandwhat the numbers in the ratio formula stand for, possibly because they have notconnected their knowledge of relative gear rotation to the computation of gearratio. Alternatively, they may have calculated correctly but then switched thenumbers in the fraction, believing that a gear ratio must always be “something-to-one”.
If students arrive at an answer such as 1:2 or 3:5, they can be considered con-ceptually correct, even though they have not arrived at the correct answer,because at least they put the smaller number first in the ratio. Such answers mayindicate that the students understand the qualitative relationship between thedriver gear and driven gear in the train (that a smaller gear turns more times thana bigger gear) but have miscalculated the resulting ratio—through incorrect com-putation, miscounting the teeth, assuming alternative gear sizes, and so on.Another question gives the gear ratio and asks students to label the driver gear.This question helps determine whether the students had difficulty with the con-cept or the calculation.

Portfolio Assessment292
In some of the problems, the number of teeth on the gears are labeled, while inothers students must count the teeth. Having students actually count the teeth canhelp them understand that the number in the gear ratio represents the number ofteeth and not some other quantity, such as the radius or the diameter of the gears.Counting the number of teeth can also help students focus on the causal or physi-cal mechanism of the teeth. Students sometimes tend to think of the teeth in termsof their quantity, instead of as the mechanism that makes the gears turn. Therefore,they cannot explain why or what makes the gears turn and can only talk about onegear turning faster than another because it has fewer teeth.

Name ����������������������������������� Design Team ��������������������������� Date ������������������
Portfolio Assessment 293
Soci
ety
of A
utom
otiv
e En
gine
ers,
Inc.
©19
96
293
Basic Understanding of Gears1. If the gear ratio is 4 to 1 (4:1), which gear is the driver?
2. If gear A is the driver gear, what is the gear ratio?
3. When gear A rotates one time, how many times does gear B rotate? Explain why.
4. Circle the pictures that show a gear ratio of 3:2, (Gear A is ALWAYS the driver gear).
15A45
B
10A40
B
15A30
B
A20
B30
B20
A30 20 20
D20
C20
B30
A20

Portfolio Assessment294
5. Using any combination of these gears, draw two gear trains that have a gear ratio of 3:1. Be sure tolabel the driver gear of each gear train.
A) Gear Train A
B) Gear Train B
6. Without using the gears from question #5, draw a gear train that has a 3:1 ratio. Label the driver gear.
7. Calculate the gear ratio of this Compound gear train. The driver gear is marked.
15 201030
40
45
60
202020 10
40DriverGear

Portfolio Assessment 295
Assessment #2: Design Log Assessment
This assessment activity asks children to evaluate two Design Log entries. Studentsare asked to explain their evaluation and to suggest how the teams could do bet-ter next time. The evaluations can reveal students’ understanding of design logsas (a) tools for monitoring and thinking about the design process and (b) graphicmodels for gear-driven devices.
This activity can be done any time during or after the Design, Build and Test phases.
BACKGROUND ON STUDENTS’ UNDERSTANDING OFGRAPHIC MODELSGraphic models are an important part of the design process. Like pictures, modelscan be used to communicate information about devices, but a good model ismore than a representation of objects. Rather, it is a demonstration of the func-tional and causal concepts involved in a device or phenomenon. One way in whicha graphic model can be conceptual is by highlighting functional components andeliminating unnecessary detail. For instance, a model can highlight the mechanismof a vehicle by showing only the gear train, not the exact shape of the frame. Agraphic model can also use abstract symbols to represent concepts that cannot beillustrated in a static picture. For example, a model could use words or arrows todescribe the movement of the gears. A model can also be used as an externalmemory device to recall what went on during the design process and visualize thecomponents one is working with or thinking about.
Modeling is a useful assessment tool, because looking at the way in whichstudents use models, both in building their own and evaluating those of othersprovides insight into their thinking. You can thus determine both how muchstudents understand about the function of gears and how well they can commu-nicate that knowledge of gear mechanisms. The components students choose toinclude in the models they produce show what they think is important to repre-sent in a physical device. The degree to which they consider a model as a way ofcommunicating concepts rather than just showing specific, physical objects,demonstrates how well they are using modeling as a scientific tool.
Below are some common ideas students often have about communicating withgraphic models.
• The purpose of a model is simply to show what a device looks like.
When students try to draw a model of a machine “to show how it works,” theyoften simply draw a picture of what the machine looks like. However, a static pic-ture cannot show the functional aspects of a gear-driven device; for instance, therelative rate and direction of rotation cannot be seen just by looking at the device.Students may rate a model of gears that shows all the gear teeth more highly thanone that uses a more symbolic method, such as putting numbers on the gears.They may mistake the components that interact while a gear is functioning (e.g.,the teeth) for the mechanism itself (e.g., the relative rotation of gears in a trainproducing torque). Also, although students may criticize another person’s modelfor not including important information, they often do not put that informationinto their own models. Evaluating another person’s model can help students thinkabout how they might revise their own models.

• A graphic model is redundant if there is a verbal description of the device.
In fact certain types of information are best presented in a graphic model andwould be very difficult to describe in words. But students often do not bother todraw a picture of a device if they have written a description of how it works; andsimilarly they will not write a description if they have drawn a picture. It is cer-tainly more efficient to write a list of all the gear combinations tried and theirgear ratios than to draw pictures of each of them. On the other hand, it is mucheasier to draw a picture of the spatial relationships between a configuration ofgears than to try to describe the arrangement in words.
EVALUATING STUDENTS’ PERFORMANCEStudents who rate the Sunnyside team’s log as better than the entry by the WildWest team are not focusing on the fact that a log entry needs to communicatethe functional characteristics of the device that were tried (i.e., what caused theoutcome of a performance test). Because Sunnyside lists only the results of thetest, the team’s entry is not a model but a picture of the situation in the class-room. The log includes a lot of detail that makes the situation look realistic, but itdoes not show the functional aspects of the device (e.g., the sizes of the gears).Some of the detail (e.g., the fact that the ramp was propped up with books) isrelevant only to this particular test instance—it is not relevant to designing avehicle with enough torque to go up the ramp. Thus, students giving Sunnyside’sentry a high rating do not understand the purpose of a conceptual model.
This assessment activity can also illustrate the nature of students evaluations.For instance, some may criticize Wild West’s entry for not including enoughdetail. Besides being too vague to help the team improve its entry, this evaluationalso reveals that these critics believe that the most realistic picture is the bestmodel. Also, to keep track of their progress, students do not need to modelaspects of their vehicle that always remain the same, such as the exact shape ofthe frame. For example, some students may criticize the Wild West entry for notshowing the 75-tooth gear attached to the wheel.
When discussing the entries, students may confuse the quality of the team’sentry with the quality of the vehicle being tested. For instance, they may say thatto improve its entry, the Wild West team should make its car go faster. This evalu-ation shows that these critics are not thinking about modeling as an importantpart of the design process but are focusing only on the outcome of the team’sconstruction efforts.
Portfoilio Assessment296

Name ����������������������������������� Design Team ��������������������������� Date ������������������
Portfolio Assessment 297
Soci
ety
of A
utom
otiv
e En
gine
ers,
Inc.
©19
96
Design Log AssesmentYou have been asked to evaluate the Design Log entries of two design teams: Sunnyside Toy Co. and WildWest Toys, Inc. Give each design team a rating for its Design Log entry and explain what the team shoulddo to improve next time. Use the back of the sheet if you need more room.
Ratings: Excellent Very Good OK Needs a Lot of Work
Sunnyside Toy Co.: Rating = ��������������������������������������������������������������������������������������������������
What should they do to improve? ��������������������������������������������������������������������������������������������
��������������������������������������������������������������������������������������������������������������������������������������
��������������������������������������������������������������������������������������������������������������������������������������
��������������������������������������������������������������������������������������������������������������������������������������
��������������������������������������������������������������������������������������������������������������������������������������
��������������������������������������������������������������������������������������������������������������������������������������
��������������������������������������������������������������������������������������������������������������������������������������
��������������������������������������������������������������������������������������������������������������������������������������
��������������������������������������������������������������������������������������������������������������������������������������
��������������������������������������������������������������������������������������������������������������������������������������
��������������������������������������������������������������������������������������������������������������������������������������
Wild West Toys, Inc.: Rating = �����������������������������������������������������������������������������������������������
What should they do to improve? ��������������������������������������������������������������������������������������������
��������������������������������������������������������������������������������������������������������������������������������������
��������������������������������������������������������������������������������������������������������������������������������������
��������������������������������������������������������������������������������������������������������������������������������������
��������������������������������������������������������������������������������������������������������������������������������������
��������������������������������������������������������������������������������������������������������������������������������������
��������������������������������������������������������������������������������������������������������������������������������������
��������������������������������������������������������������������������������������������������������������������������������������
��������������������������������������������������������������������������������������������������������������������������������������
��������������������������������������������������������������������������������������������������������������������������������������


Name ����������������������������������� Design Team ��������������������������� Date ������������������
Portfolio Assessment 299
Soci
ety
of A
utom
otiv
e En
gine
ers,
Inc.
©19
96
299
Design LogName of Design Team: S u n nys i de Toy Co. Date: 3/3 1/95 Page: 1
OBSERVATIONS AND DATA
O u r gro u p i s wo r ki ng we l l toge t h e r. To day we got o u r car to go u p a 15- degre e ra m p.T h e fi rs t t wo cars we t ri e d wo u ld n’t go u p, b u t t h e t h i rd car we nt u p t h e ra m p ! T h eo n l y p ro bl e m was, o u r car was s l ow. We race d t h e Re d Race r te a m an d we l os t.
Materials Manager: Jodie
Design Coordinator: Alex
Recorder/Reporter: Kim
gears
Car going u p slow
Tablebooks
15-degree ramp

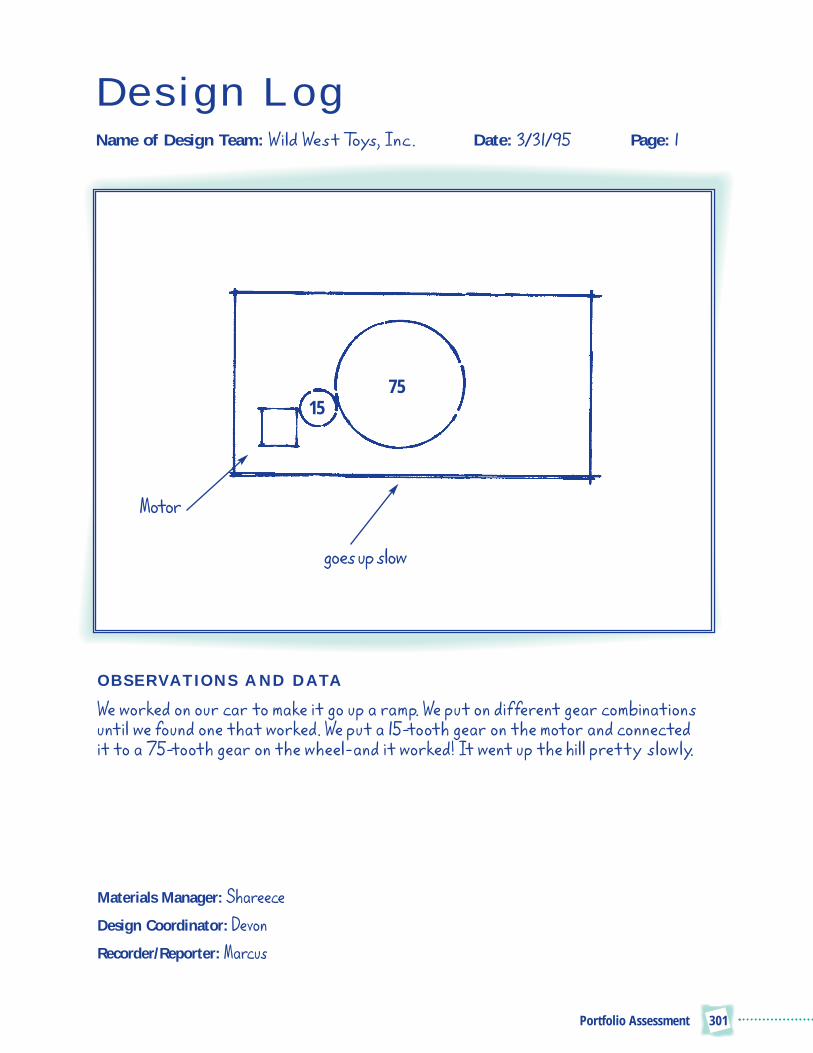
Design LogName of Design Team: W i ld We s t Toys, In c . Date: 3/3 1/95 Page: 1
OBSERVATIONS AND DATA
We wo r ke d o n o u r car to ma ke i t go u p a ra m p. We p u t o n d i ffe re nt ge ar co m bi n at i o n s u nt i l we fo u n d o n e t h at wo r ke d . We p u t a 15-to ot h ge ar o n t h e moto r an d co n n e cte d i t to a 75-to ot h ge ar o n t h e w h e e l - an d i t wo r ke d ! It we nt u p t h e h i l l p re t t y s l ow l y.
Materials Manager: S hareece
Design Coordinator: Devon
Recorder/Reporter: Marcus
Portfolio Assessment 301
goes u p slow
Motor
1575


Resources
The Resources section includes suggestions for background and supportmaterials to enhance the teaching and learning of the challenge. The
resources include books, magazines, hands-on material kits, and software pro-grams. These materials are organized around topics such as basic science, simplemachines, design and technology education, building systems and consumer research.
Resources 303

APPENDICESResources
BASIC SCIENCEChildren’s Ideas in ScienceRosalind Driver, Edith Guesne andAndrée Tiberghien (eds.) Open University Press, UK1985
Evidence of Energy: An Introductionto Mechanics, Book TwoJack E. Gartrell Jr. and Larry E. SchaferNational Science Teachers Association,Washington, DC1990
Mathematics Meets TechnologyBrian BoltCambridge University Press, New York, NY1991
Teaching Physics with ToysBeverly A. P. TaylorTab Books, Division of McGraw Hill,New York, NY1995
Pupils As Scientist?Rosalind DriverOpen University Press, UK1985
BUILDING SYSTEMSSimple Machines Classroom PackTechnology Teaching Systems1994
SomertechPatrick Hicks and John BrookesTechnology Teaching Systems, UK1992
The LINX SystemNoneThe Science Source, UK1992
DESIGN AND TECHNOLOGYEDUCATIONDesign and Problem Solving inTechnologyJohn Hutchinson and John KarsnitzITP Education Division, Chicago, IL1994
Design and TechnologyPat Williams and David JinksThe Falmer Press, Bristol, PA1985
Design and Technology ThroughProblem SolvingRobert JohnseyStanley Thomas Publishing, UK1994
Resources304

Design Technology: Children’sEngineeringSusan Dunn and Rob LarsonThe Falmer Press, Bristol, PA1990
Primary Science and TechnologyDi Bentley and Mike WattsOpen University Press, Philadelphia, PA1994
Problem Solving in School ScienceRobert JohnseyStanley Thomas Publishing, UK1994
Teaching Design and TechnologyJohn EgglestonOpen University Press, Philadelphia, PA1992
Creative TechnologyJ. Aitken and G. MillsHarper Collins, UK1994
Design and TechnologyJames GarrattCambridge University Press, New York, NY1992
How Things Work: Cars, Bikes, Trains,and Other Land MachinesIan GrahamKingfisher Books, New York, NY1993
Rainbow Technology, Techniques forPrimary Design and TechnologyGibson, Harding, Hutchins, Mapstone,and PengellyStanley Thomas Publishing, UK1994
SIMPLE MACHINESAtoms, Energy, and MachinesJack McCormickCreative Education, Mankato, MN1957
Bill Nye the Science Guy, PhysicalScience Part 2 (video)NoneDisney Educational Productions,Newtown, PA1994
Gears (Software)Robert KimbalSunburst Communications Inc.,Pleasantville, NY1992
Resources 305

Into GearJohn Hill and Mick SmithTechnology Teaching Systems,Holmwood, UK1992
Simple MachinesAnne HorvaticE. P. Dutton, New York, NY1989
The How and Why of MechanicalMovementsHarry WaltonPopular Science Publishing Company,E.P. Dutton and Co. Inc. New York, NY1968
The Simple Facts of Simple MachinesCarol Barkin and Elizabeth JamesLothrop, Lee and Shepard Co., New York, NY1975
The Way Things WorkDavid MacaulayHoughton Mifflin Company, Boston, MA1988
This Is the Way It Works: A Collectionof MachinesRobert GardnerDouble Day and Co. Inc., Gardner, NY1980
CONSUMER RESEARCHMiddle School Mathematics CurriculumDeveloped by Education DevelopmentCenter, Inc.Creative Publications, Palo Alto, CA1996
Dealing with Data and ChanceCurriculum and Evaluation Standardsfor School Mathematics AddendaSeries, Grades 5-8. Judith S. Zawojewkski (Ed.)National Council of Teachers ofMathematics, Reston, VA1991
Chance and Data Investigations,Volumes 1 and 2Mathematics Curriculum and TeachingProgramCharles Lovitt and Ian LoweCurriculum Corporation, Australia1993
Zillions (magazine)Consumer Reports for KidsConsumers Union of United States,Inc., Yonkers, NY
Used Numbers Statistics: The Shape ofthe DataUsed Numbers Statistics: Predictionand SamplingUsed Numbers Statistics: Middles,Means, and In-BetweensSusan N. Friel, Janice R. Mokros, andSusan Jo RussellDale Seymour Publications, Palo Alto, CA1992
Resources306

Notes 307
Notes

Notes308
Notes