the development of a new experimental facility for ... · a refractory-lined combustion chamber and...
TRANSCRIPT

The Development of a New Experimental Facility for Pyrolysis
Liquid Biofuel (Bio-Oil) Combustion
by
Sina Zadmajid
A thesis submitted in conformity with the requirements
for the degree of Master of Applied Science
Graduate Department of Mechanical and Industrial Engineering
University of Toronto
© Copyright by Sina Zadmajid 2016

ii
Abstract
The Development of a New Experimental Facility for Pyrolysis Liquid
Biofuel (Bio-Oil) Combustion
Sina Zadmajid
Master of Applied Science
Graduate Department of Mechanical and Industrial Engineering
University of Toronto
2016
Bio-oil is made from pyrolysis of waste biomass, which provides a carbon-neutral combustion
energy alternative. This study focuses on developing burners for use with bio-oil. The previous
burner using bio-oil/ethanol mixtures had a small combustion chamber with no refractory lining.
It was not feasible to stabilize flames of pure bio-oil and the pollutant emissions were relatively
high. In this study, the burner is made more comparable to actual bio-oil burners by implementing
a refractory-lined combustion chamber and increasing the size of the chamber to investigate the
relationship between burner design and combustion performance of bio-oil. After making some
modifications in the new burner configuration and adjusting the operating parameters, stable
flames of pure bio-oil are achieved with no major nozzle coking problems, and almost no unburned
hydrocarbons and low CO emissions (below 10 ppm) in the exhaust gases. The effects of operating
conditions on the pollutant emissions are also investigated.

iii
Acknowledgments
It has been a real honor and pleasure working in Professor Murray J. Thomson’s lab for the past
two years. Many thanks to Professor Thomson for his great guidance and supervision during the
course of this study. I would also like to thank my parents, my sisters, and my friends for their
moral support.
Steven Albert-Green deserves special thanks for his assistance in running the experiments and also
for his role in the viscosity measurement. I am thankful to Dr. Yashar Afarin for providing me
with precious insights into designing the new combustion chamber, and for his guidance and
support during this project. I would like to thank Vijai Sookrah for helping me with the viscosity
and HHV measurements. I would like to thank Dylan who helped me learn how to operate the
burner. The help and support of other members of the combustion research group, especially, Dr.
Armin Veshkini and Ali Naseri is gratefully appreciated. I am also grateful for all the invaluable
insights and design guidelines received from Debbie Soriano and Nicolas Leroux at BMA Inc. as
an industrial partner in this project.
I would like to thank Professor Hongi Tran and Sue Mao (Pulp and Paper Center) for providing us
with the calorimeter in order to measure HHV of bio-oils. I would also like to thank Ryan Mendell
from the departmental machine shop for building many custom components of the burner and
providing design feedback. I would like to thank Cesar Sanches from the departmental purchasing
office for his consideration and follow-ups for the many purchase orders necessary in this project.
Finally, I would like to acknowledge BFN and NSERC for being financially supportive of this
project.
iv
Table of Contents
Abstract ...................................................................................................................................... ii
Acknowledgments ..................................................................................................................... iii
Table of Contents ...................................................................................................................... iv
List of Tables .......................................................................................................................... viii
List of Figures ........................................................................................................................... ix
Nomenclature .......................................................................................................................... xiii
Introduction ........................................................................................................................... 1
1.1 Motivation ...................................................................................................................... 1
1.2 Objective ........................................................................................................................ 2
Literature Review .................................................................................................................. 3
2.1 Thermochemical Conversion of Biomass to Bio-Oil ....................................................... 3
2.2 Properties of Bio-Oil ....................................................................................................... 6
2.2.1 Basic Fuel Properties ........................................................................................... 6
2.2.2 Multiphase Structure ........................................................................................... 7
2.2.3 Water Content ..................................................................................................... 7
2.2.4 Solid Content ...................................................................................................... 8
2.2.5 Other Properties .................................................................................................. 8
2.3 Fundamentals of Bio-Oil Combustion ............................................................................. 9
2.4 Optimizing Bio-Oil Utilization.......................................................................................10
2.4.1 Upgrading Bio-Oil Fuel Quality .........................................................................11
2.4.2 Co-Combustion of Bio-Oil with Fossil Fuels ......................................................13
2.4.3 Optimizing Combustion Devices ........................................................................13
Burner Design.......................................................................................................................15
3.1 Previous Burner Assembly .............................................................................................15
3.2 Design Principles for Industrial Bio-Oil Burners ............................................................16
v
3.3 Upgraded Combustion Chamber ....................................................................................18
3.3.1 Refractory Linings .............................................................................................18
3.3.2 Viewports ...........................................................................................................19
3.3.3 Port Box .............................................................................................................19
3.4 Variable Swirl Generator ...............................................................................................20
3.5 Fuel Energy Throughput ................................................................................................23
3.6 Fuel Atomizing Nozzle ..................................................................................................23
3.6.1 Nozzle Assembly ...............................................................................................23
3.6.2 Nozzle Cooling System ......................................................................................25
3.7 Ignition System ..............................................................................................................25
3.7.1 Pilot Flame .........................................................................................................25
3.7.2 Electric Igniter ...................................................................................................26
Experimental Methodology ...................................................................................................27
4.1 Fuel Analysis .................................................................................................................27
4.1.1 Elemental Analysis .............................................................................................28
4.1.2 Kinematic Viscosity Measurement .....................................................................28
4.1.3 Gross Heat of Combustion (HHV) Measurement ................................................29
4.2 Overall Experimental Setup ...........................................................................................29
4.3 Temperature Measurement .............................................................................................30
4.4 Flame Visualization .......................................................................................................31
4.5 Gas Phase Emission Measurement .................................................................................32
4.5.1 Unburned Hydrocarbon Emissions .....................................................................32
4.5.2 Detailed Exhaust Gas Emissions.........................................................................32
4.5.3 Oxygen Concentration ........................................................................................33
4.6 Particulate Matter Measurement and Analysis ................................................................34
4.6.1 Isokinetic Particulate Sampling ..........................................................................34
vi
4.6.2 Gravimetric Analysis and Loss on Ignition .........................................................37
4.7 Heat Exchanger Analysis ...............................................................................................39
4.8 Burner Test Procedure ...................................................................................................39
4.9 The Facility Maintenance Guide ....................................................................................40
Results and Discussion .........................................................................................................42
5.1 Research Plan ................................................................................................................42
5.2 Fuel Analysis .................................................................................................................42
5.3 Flame Stability...............................................................................................................45
5.3.1 Removing the Swirl Outlet Pipe .........................................................................46
5.3.2 Bluff Body .........................................................................................................46
5.3.3 Placing a Sleeve Inside the Burner Throat ..........................................................47
5.4 Burning Pure Bio-Oil .....................................................................................................48
5.5 Fuel Boiling in Nozzle ...................................................................................................48
5.5.1 Operating Condition Adjustments ......................................................................49
5.5.2 Insulating the Nozzle ..........................................................................................51
5.6 Nozzle Fuel Coking and Clogging .................................................................................51
5.6.1 Operating Condition Adjustments ......................................................................52
5.6.2 Nozzle Design ....................................................................................................53
5.7 Comparative Visualization of Flame ..............................................................................55
5.8 Gas Phase Emissions .....................................................................................................56
5.8.1 Base Point Operation ..........................................................................................56
5.8.2 Transient Base Point Operation ..........................................................................57
5.8.3 Primary Air Flow Rate (Equivalence Ratio) .......................................................60
5.8.4 Swirl Number .....................................................................................................63
5.8.5 Atomizing Air Flow Rate ...................................................................................64
5.8.6 Pilot Flame Energy .............................................................................................68

vii
5.8.7 Primary Air and Fuel Preheat Temperature .........................................................69
5.8.8 Formaldehyde, Acetaldehyde, and Methane Emissions .......................................71
5.9 Particulate Matter Emissions ..........................................................................................71
5.9.1 Wall Deposition Effects .....................................................................................73
5.10 Heat Exchanger Analysis ...............................................................................................73
Conclusions and Recommendations ......................................................................................75
6.1 Conclusions ...................................................................................................................75
6.2 Recommendations and Future Work ..............................................................................78
References .................................................................................................................................80
Appendix A Upgraded Burner Drawings ...................................................................................89
Appendix B Bio-Oil Burner Instruction ................................................................................... 100
Appendix C Nozzle Drawings ................................................................................................. 109
Appendix D Gross Heat of Combustion ................................................................................... 111

viii
List of Tables
Table 2.1. Development of PLB-based gas turbines and diesel engines [50] ............................. 14
Table 3.1. Design parameters and values for the current swirl generator ................................... 22
Table 3.2. Nozzle specifications ............................................................................................... 24
Table 4.1. Fuel properties and test methods .............................................................................. 27
Table 4.2. Detection limits and RSME values of the FTIR ........................................................ 33
Table 4.3. Calculation method for loss on ignition test .............................................................. 38
Table 4.4. Uncertainty levels associated with PM measurements .............................................. 38
Table 5.1. Properties of bio-oil [69, 32, 70, 30, 48] ................................................................... 43
Table 5.2. Comparison of bio-oil properties and ethanol ........................................................... 44
Table 5.3. Base point operating condition ................................................................................. 56
Table 5.4. Base point emissions and repeatability ..................................................................... 57
Table 5.5. Equivalence ratio of bio-oil combustion at different operating points ....................... 60
Table 5.6: Values of dimensionless atomizing air flow (Α) at different operating points ........... 65
Table 5.7. Base point particulate matter emissions .................................................................... 72
Table 5.8. Comparison of CR emissions between the new burner and the previous one ............ 72
Table 6.1. Comparison of CO emissions, UHC emissions, and flame stabilty condition between
the new burner and the previous one ......................................................................................... 76

ix
List of Figures
Figure 2.1. Thermochemical conversion methods and products [13] ........................................... 4
Figure 2.2. Fast pyrolysis process [13] ........................................................................................ 5
Figure 2.3. The effect of storage temperature on the rate of viscosity increase [22] ..................... 6
Figure 2.4. Chemical compounds in bio-oil [25] ......................................................................... 7
Figure 2.5. Stages of bio-oil droplet combustion [7] ................................................................... 9
Figure 2.6. From left to right, steps of single droplet combustion of PLB [33] .......................... 10
Figure 2.7. Video images of solid residues from bio-oil combustion while burning in a flow
reactor [33] ............................................................................................................................... 10
Figure 3.1. Schematic of the previous burner assembly [4] ....................................................... 16
Figure 3.2. Schematic of the new burner assembly ................................................................... 18
Figure 3.3. Cross section view of the new combustion chamber and the refractory linings ........ 19
Figure 3.4. Port box .................................................................................................................. 20
Figure 3.5. Central recirculation zone in a swirl flow [59] ........................................................ 21
Figure 3.6. Geometry of the swirl generator (movable block type) [4] ...................................... 22
Figure 3.7. Schematic of the atomizing nozzle no.1 [62] ........................................................... 24
Figure 3.8. Nozzle cooling system ............................................................................................ 25
Figure 3.9. Schematic of the ignition system............................................................................. 26
Figure 4.1. Measuring viscosities.............................................................................................. 28
Figure 4.2. Schematic of the experimental setup ....................................................................... 29
Figure 4.3. Thermocouple locations .......................................................................................... 30

x
Figure 4.4. Flame temperature measurement: location of the thermocouple .............................. 31
Figure 4.5. Image of the flame .................................................................................................. 31
Figure 4.6. The isokinetic sampling probe [4] ........................................................................... 35
Figure 4.7. Schematic of the PM sampling system [4] .............................................................. 36
Figure 5.1. Viscosity of bio-oil batch 3 vs temperature ............................................................. 44
Figure 5.2. Schematic of the original burner configuration and the swirl outlet pipe ................. 45
Figure 5.3. Flame stability: images of an unstable flame of 80/20 bio-oil/EtOH (a), as well as the
flame condition after removing the swirl outlet pipe (b), placing a bluff body on the nozzle (c, d),
and placing a sleeve inside the burner throat (e). ....................................................................... 46
Figure 5.4. Schematic of the bluff body placed on the nozzle in two different directions
(sectional view of the burner throat) ......................................................................................... 47
Figure 5.5. The sleeve in the sectional view of the burner throat ............................................... 47
Figure 5.6. The sleeve inside the burner throat (view from the top of the swirl box).................. 47
Figure 5.7. Flame images of pure ethanol, 80/20 bio-oil/EtOH, 90/10 bio-oil/EtOH, and pure bio-
oil ............................................................................................................................................. 48
Figure 5.8. Flash-atomization instabilities: from (a) to (l), images of the flame with a time
interval of 0.1s between images. ............................................................................................... 49
Figure 5.9. Nozzle insulation (the nozzle was moved down the throat to take this picture) ........ 51
Figure 5.10. Carbonaceous material (coke) formed on the external surface of nozzle no.1 ........ 52
Figure 5.11. Image of nozzle no.2 and nozzle no.1 ................................................................... 54
Figure 5.12. Images of flame for different nozzle designs ......................................................... 55
Figure 5.13. Burner temperatures during transient base point operation .................................... 58

xi
Figure 5.14. CO emissions during transient base point operation .............................................. 59
Figure 5.15. NOx emissions during transient base point operation ............................................. 59
Figure 5.16. CO emissions vs equivalence ratio ........................................................................ 61
Figure 5.17. Images of bio-oil flame vs equivalence ratio ......................................................... 61
Figure 5.18. Flame temperature vs equivalence ratio ................................................................ 62
Figure 5.19. NOx emissions vs equivalence ratio ...................................................................... 63
Figure 5.20. Flame stability vs swirl number for bio-oil ............................................................ 63
Figure 5.21. The effect of swirl number on the trend of CO emissions vs equivalence ratio ...... 64
Figure 5.22. Images of bio-oil flame vs atomizing air flow rate ................................................ 64
Figure 5.23. CO emissions vs dimensionless atomizing air flow ............................................... 66
Figure 5.24. UHC emissions vs dimensionless atomizing air flow ............................................ 67
Figure 5.25. NOx emissions vs dimensionless atomizing air flow .............................................. 68
Figure 5.26. Images of bio-oil flame vs pilot flame energy ....................................................... 68
Figure 5.27. NOx emissions vs pilot flame energy..................................................................... 69
Figure 5.28. Fuel preheat temperature vs primary air preheat temperature ................................ 70
Figure 5.29. NOx emissions vs primary air preheat temperature ................................................ 71
Figure 5.30. Loaded quartz filter before and after CR burnout .................................................. 72
Figure 5.31. Energy (heat) analysis of the new burner at different equivalence ratios ................ 73
Figure 5.32. The amount of heat extracted by the heat exchanger for both the previous and new
burners ..................................................................................................................................... 74

xii
Figure A. 1. Overall burner assembly ....................................................................................... 90
Figure A. 2. Overall burner assembly (swirl outlet pipe is removed) ......................................... 91
Figure A. 3. Combustion chamber assembly ............................................................................. 92
Figure A. 4. Combustion chamber dimensions .......................................................................... 93
Figure A. 5. Refractory linings ................................................................................................. 94
Figure A. 6. Swirl outlet flange................................................................................................. 95
Figure A. 7. Viewport flange .................................................................................................... 96
Figure A. 8. Port box assembly ................................................................................................. 97
Figure A. 9. Exhaust outlet flange ............................................................................................ 98
Figure A. 10. Igniter ports ........................................................................................................ 99
Figure C. 1. Nozzle no.3: drawing of the air cap (JPG60 custom-machined) ........................... 110
Figure C. 2. Nozzle no.4: drawing of the air cap (JPG60 custom-machined) ........................... 110
Figure D. 1. HHV measurement for mixtures of bio-oil (batch 1) and ethanol ......................... 112
Figure D. 2. HHV measurement for mixtures of bio-oil (batch 2) and ethanol ......................... 112

xiii
Nomenclature
Α Dimensionless atomizing air flow
𝐵 Depth of swirl blocks
d Diameter
𝐺𝑥 Axial flux of the axial momentum in the burner
𝐺𝜑 Axial flux of the angular momentum in the burner
�̇�𝑓𝑢𝑒𝑙 Fuel mass flow rate
P Pressure
𝑅 Swirl generator exit radius
𝑅ℎ Swirl generator inner radius
r Radial distance from the center of the burner
𝑆 Swirl number
T Temperature
t Time
U Axial velocity
�̇�𝑚𝑒𝑎𝑠𝑢𝑟𝑒𝑑 Flow rate of dry gas in PM sampling
�̇�𝑡𝑜𝑡𝑎𝑙 Total exhaust flow rate from the burner
�̇�𝑠𝑎𝑚𝑝𝑙𝑒𝑑 Actual PM sampling flow rate
W Tangential velocity

xiv
∆t Sampling time of the filter
Greek Symbols
𝜌 Density
𝛼 Fixed swirl block angle
𝜉 Adjustable swirl block angle
𝜉𝑚 Maximum opening angle
𝜎 Surface tension
𝜇 Dynamic viscosity
Φ Equivalence ratio
Acronyms
ASTM American society of testing and materials
CR Carbonaceous residue
CRZ Central recirculation zone
EtOH Ethanol
FID Flame ionization detector
FTIR Fourier transform infrared spectrometer
HHV Higher heating value
HMW High molecular weight
LHV Lower heating value
NOx Nitrogen oxides (i.e. NO and NO2)

xv
OD Outer diameter
PLB Pyrolysis liquid biofuel
PM Particulate matter
ppm Part per million
RMSE Root mean square error
SLPM Standard liters per minute
SMD Sauter mean diameter
SOx Oxides of Sulfur
UHC Unburned hydrocarbon

1
C h a pt e r 1
Introduction
1.1 Motivation
Fossil fuels are currently the world's primary energy source, but there are several problems with
these fuels such as: they are non-renewable, they lead to negative effects such as air pollution, they
have severe consequences on the habitats and human health, and they contribute to global climate
change. The increasing trend in world energy consumption and the disadvantages of the fossil fuels
have increased interest in renewable and sustainable sources of energy. One of the potential
candidates for replacing petroleum fuels is wood-derived pyrolysis liquid biofuels, also called bio-
oil. Bio-oil uses almost no fossil inputs and it is made from the pyrolysis of waste biomass, which
is an inexpensive and environmentally attractive method of converting biomass into a liquid fuel.
Bio-oil is carbon-neutral as it does not result in a net increase in atmospheric greenhouse gases [1].
Different from many biofuels such as ethanol, which are made from food resources, bio-oil is made
from waste biomasses [2] and it has no impact on food supply. Hence, it is considered as a
sustainable source of energy.
The current critical challenge to the bio-oil industry is that although fast pyrolysis bio-oil
is a promising candidate to replace petroleum fuels and heavy fuel oils in many stationary
applications such as boilers and furnaces, their physical properties and chemical composition are
completely different from petroleum fuels. Properties of bio-oil such as its high viscosity and
surface tension, high water and oxygen contents, wide volatility distribution, solid and char
content, and it not being fully distillable have significant negative impacts on the atomization
quality, ignition, droplet vaporization and burning rate, coking tendency, clogging, and pollutant
emissions [3]. Hence, combustion devices need to be optimized for these biofuels.

CHAPTER 1. INTRODUCTION 2
1.2 Objective
Combustion of pyrolysis liquid biofuels had been previously studied in a 10 kW burner [4, 5, 6,
7]. There were many problems with the previous burner: (i) there was no refractory lining and the
amount of heat loss was significant, (ii) a diffuser was used in the burner, which is not commonly
used in industrial applications, and (iii) it was likely that much of the spray hit the diffuser walls
before evaporating due to the small width of the diffuser compared to the spray angle. The main
goal is to study bio-oil combustion characteristics; however, it is not possible to study flames of
pure bio-oil using the previous burner, and bio-oil had to be mixed with a solvent such as ethanol
(at least 20 vol. % ethanol) in order to get stable flames. Therefore, this study aims to upgrade the
burner and make it more representable to actual bio-oil burners by implementing a refractory-lined
combustion chamber, removing the diffuser, and also increasing the size of the combustion
chamber to decrease the amount of heat loss, improve ignition quality, and enhance flame stability.
The new setup is used to address the common difficulties in using bio-oil in small-scale
burners such as ignition characteristics, flame stability, nozzle coking, and pollutant emissions.
The setup is flexible and different fuel nozzle designs can be studied to investigate the relationship
between the nozzle design and combustion performance of pyrolysis liquid biofuels. Another
objective of this study is performing a parametric sensitivity analysis to determine the effects of
the burner operating condition on pollutant emissions of bio-oil.

3
C h a pt e r 2
Literature Review
2.1 Thermochemical Conversion of Biomass to Bio-Oil
Carbon dioxide emissions from fossil fuels contribute to global climate change, raising interest in
using renewable sources of energy in order to meet the Renewable Obligation [8]. Using renewable
biomass resources for energy generation is one way to produce clean energy and replace petroleum
fuels in industrial applications. Biomass is an organic material derived directly or indirectly from
living things (i.e. plants and animals), which can be used for three main purposes: electrical or heat
energy sources, chemical feedstocks, and transport fuels [9]. There are two types of biofuel
produced from biomass resources: first generation and second generation biofuels. First generation
biofuels are derived from edible resources such as starchy plants, seeds high in vegetable oil, and
animal fats. Because they compete with and increase the cost of food resources, they are considered
unsustainable biofuels [10]. Second generation biofuels are derived from nonfood wastes and non-
edible plants, which makes them sustainable energy resources. Examples of the plant biomass are
lignocellulosic materials generated from waste wood. One advantage of second generation biofuels
over first generation ones is that they make use of forestry residues to produce carbon neutral
energy. This study investigates combustion performance of a second generation biofuel.
Conversion of biomass into renewable and sustainable fuels has been of great interest to
researchers as it can provide a means for delivering clean energy [11, 12]. There are three main
ways to make use of biomass to produce energy: biological, physical, and thermochemical
conversion methods. Thermochemical conversion of biomass is one way to convert biomass into
energy, which can be done in four different ways: combustion, gasification, liquefaction, and

CHAPTER 2. LITERATURE REVIEW 4
pyrolysis [13]. Figure 2.1 demonstrates these thermochemical conversion processes along with the
resulting products and their applications.
Figure 2.1. Thermochemical conversion methods and products [13]
Direct combustion produces heat from biomass to be used in boilers. This is the most
widely used method to produce bioenergy; however, low efficiency and high pollutant emissions
in large scale applications have increased interests in using different conversion methods.
Gasification is another conversion method which utilizes a reactor to convert biomass into fuel gas
products such as CO, CO2, CH4, and H2 in presence of oxygen and at high temperatures. The
advantage of this method is phase uniformity of the combustible gases, which can be used
efficiently in gas turbines, engines, synthesis of fuels such as diesel and aviation fuels, and boilers.
However, the product gases have low energy density, are difficult to transport, and are difficult to
separate from solid byproducts such as tar.
In order to convert biomass into liquid products, there are two methods used: liquefaction
and pyrolysis. The differences between these two methods are mostly the operating conditions of
their conversion processes and the liquid biofuel yield. The presence of a catalyst is necessary in
the liquefaction process but not in the pyrolysis process. Pyrolysis is a preferred method as it has
a higher liquid fuel yield (up to 75 wt % for pyrolysis compared to 50 wt % for liquefaction) [14].
Pyrolysis is a thermochemical conversion of feedstocks such as wood biomass, agricultural waste
material [15], rice straw [16], and rice husks [17] into liquid fuel, gas products, and charcoal. The
properties of these products strongly depend on the pyrolysis reactor design. Different designs vary

CHAPTER 2. LITERATURE REVIEW 5
in temperature, residence time, and heating rate of biomass. In order to maximize the liquid fuel
and minimize the charcoal byproducts, fast pyrolysis which includes short residence time and high
temperature is favored.
In the fast pyrolysis process, the feedstock is heated to a controlled temperature of about
500°C at a very rapid heating rate in the absence of oxygen, and then the vapors of the process are
quickly cooled down to yield pyrolysis liquid biofuel (PLB), also known as bio-oil [18]. While
bio-oil is the main product, bio-char, ash, and some non-condensable gases are also produced,
which can be recycled back into the process to minimize waste production and increase the
conversion efficiency. Moreover, bio-char can be used to improve the quality of soils and reduce
soil degradation, especially in mudstone areas where soils are in a poor physical condition [19].
Figure 2.2 depicts the principles of this process and its products.
Figure 2.2. Fast pyrolysis process [13]
Using the fast pyrolysis method, up to 75 wt % of biomass can be converted into bio-oil
[13] and hence, fast pyrolysis is known as an efficient way of converting wood biomass into a
liquid fuel with minimal waste products. Moreover, the products can be easily transported and
stored as compared to those of other thermochemical conversion methods. While the flexibility of
the feedstock is vast, the bio-oil in this study is produced from fast pyrolysis of waste wood
biomass.

CHAPTER 2. LITERATURE REVIEW 6
2.2 Properties of Bio-Oil
2.2.1 Basic Fuel Properties
Pyrolysis liquid biofuel is a viscous liquid containing ash, solid particles, and water [7]. PLB is
made from biomass feedstocks and hence, its properties can vary depending on the feedstock and
the process condition under which it is produced. It has a dark brown color and a strong bitter
smell [16]. It has a wide volatility range, high surface tension, and high viscosity, which are
important in its atomization characteristics in spray systems. The viscosity of PLB strongly
depends on its temperature, which is an important factor in pumping and injection of this fuel. In
order to decrease its viscosity and improve the atomization quality, bio-oil is usually preheated
prior to injection.
Bio-oil is chemically unstable, meaning that its properties such as viscosity and volatility
change over time, with the first increasing and the latter decreasing. While high temperature
conditions can increase the fuel instability, storing it at cold temperatures can delay the aging
process [20, 21]. For instance, Figure 2.3 shows the rate at which viscosity increases with change
in temperature for different pyrolysis liquid biofuels during storage. Moreover, Tzanetakis et al.
[5] found only a minor increase in the viscosity of bio-oil after being stored at a temperature
between 2 to 8°C over 6 months. Therefore, the bio-oils in this study are kept at the aforementioned
temperature.
Figure 2.3. The effect of storage temperature on the rate of viscosity increase [22]

CHAPTER 2. LITERATURE REVIEW 7
2.2.2 Multiphase Structure
Several studies have shown that bio-oil has a multiphase structure. It consists of an aqueous phase
as well as a non-aqueous phase, which are shown in Figure 2.4. The aqueous phase contains most
of the low molecular weight (LMW) compounds found in bio-oil with high water content, and the
non-aqueous phase is characterized by high molecular weight (HMW) compounds and oligomers
[23]. Qiang et al. [24] has indicated that there are different kinds of compounds found in bio-oil
structure: polar compounds (water, acids, and alcohols), less polar compounds (esters, ethers, and
phenolic compounds), and non-polar compounds (hexane and other hydrocarbons).
Figure 2.4. Chemical compounds in bio-oil [25]
2.2.3 Water Content
Bio-oil has water content with a wide range of 15 to 30 wt % depending on the moisture of its
biomass feedstock and the process condition. The amount of water in bio-oil can affect the quality
of bio-oil combustion; therefore, water content can be altered pre or post its pyrolysis. Within a
certain range, water decreases viscosity and increases the intensity of micro-explosion [26]. The
components of bio-oil have various boiling points, meaning that while some have not reached their
boiling points, others have. This can cause bursting of droplets which is called micro-explosion or
secondary atomization. Micro-explosion can enhance mixing of fuel and enhance the atomization
quality, reducing the resultant soot and unburned hydrocarbons. Moreover, water acts to reduce
flame temperature resulting in a reduction in NOx emissions. Supplying OH radicals, water can

CHAPTER 2. LITERATURE REVIEW 8
enhance soot oxidation [27, 28]. Moving past a cut-off point, water can make bio-oil unstable by
affecting its microstructure, resulting in phase separation of the polar and non-polar compounds
[24]. Furthermore, too much water can decrease reaction time, increase ignition delay time, and
increase heat of evaporation.
2.2.4 Solid Content
Bio-oil has solid particles, which cause particulate matter (PM) emissions. The solid content
includes organic char particles, which are resulting from incomplete pyrolysis of biomass, and
inorganic ash. Char particles tend to agglomerate during storage and cause accelerated separation,
aging, of bio-oil [20]. They can clog the atomizing nozzles, hindering fuel atomization and
ignition. Therefore, hot pyrolysis vapor filtration and cold filtration of bio-oil can be implemented
to remove these char particles [29, 30]. However, the aforementioned methods are limited by
pressure drop and filter blocking [31].
When bio-oil is heated to a temperature as high as 775°C in the presence of oxygen, the
resulting residue is called ash. One advantage of using bio-oil rather than using biomass directly
for combustion is its lower ash concentration as a result of the pyrolysis process [29]. Studies have
shown that ash contains polar alkali metals. In literature, it is suggested that most of these minerals
are found in the water insoluble phase of bio-oil, bound up to char, and will leak out to the water
soluble phase over time [31]. Ash is detrimental to combustion devices. The alkali metals in ash
can react to produce compounds which tend to stick on the burner surface, decreasing heat transfer
coefficient and promoting corrosion [24].
2.2.5 Other Properties
The water content of bio-oil and the acid compounds found in its structure imply that it has a
corrosive nature. A pH number of 2-4 is reported for this biofuel [24]. Therefore, it is important to
choose corrosion resistant materials such as stainless steel, cobalt materials, and various polymers
when working with bio-oil. This biofuel has a poor ignition quality, a low heating value, and
reduced flame stability due to both the high water content and high oxygen content (35-40 wt %)
of bio-oil. The lower heating value (LHV) of bio-oil is usually in the range of 14-20 MJ/kg, which
is less than half that of hydrocarbon fuels [32].

CHAPTER 2. LITERATURE REVIEW 9
2.3 Fundamentals of Bio-Oil Combustion
It is important to study the fundamentals of bio-oil combustion before it can be used as a
replacement for non-renewable petroleum oils. PLB is distinct from petroleum oils in that it has a
high viscosity, there is low internal circulation within its droplets, pockets of vapor form within
the droplets, vapor-filled droplets undergo swelling, and it is not fully distillable. Therefore,
pyrolysis liquid biofuels have different evaporation and combustion mechanisms. Bio-oil
combustion is characterized by two major stages [7]. First, most of the volatile compounds burn
in a homogeneous combustion mode. The remaining of the first stage is called the secondary char
particle, which is composed of the primary char found in bio-oil (the solid and ash content of the
fuel) and some polymerized high molecular weight (HMW) material formed during the first stage.
In the second stage of combustion, the char particle burns in a heterogeneous mode, resulting PM
emissions. Stages of the droplet combustion of bio-oil and the resulting products are summarized
in Figure 2.5.
Figure 2.5. Stages of bio-oil droplet combustion [7]
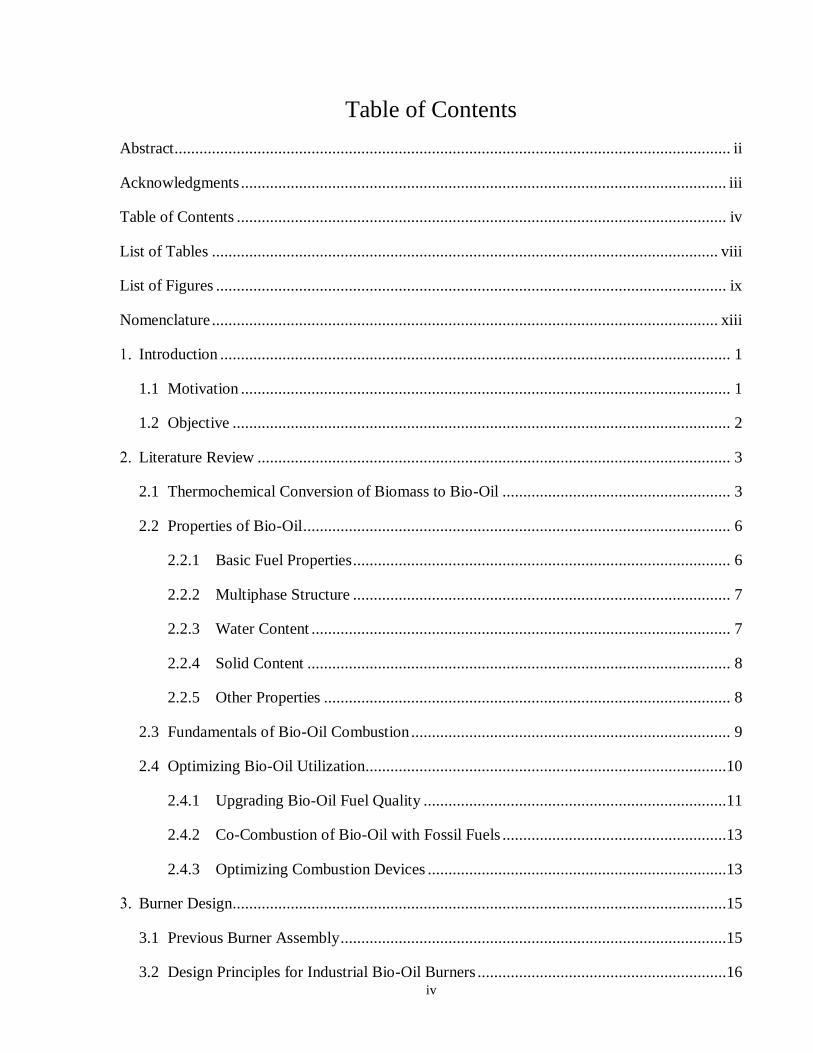
Moreover, according to Wornat et al. [33], these two stages of single droplet combustion
of bio-oil can be divided into four detailed steps: quiescent burning in a blue flame; micro-
explosion due to rapid droplet protrusion; droplet merging while burning in a faint blue flame; and
soot formation from gas-phase pyrolysis. Figure 2.6 depicts these different steps by visualizing the
shape of the burning droplet.
CHAPTER 2. LITERATURE REVIEW 10
Figure 2.6. From left to right, steps of single droplet combustion of PLB [33]
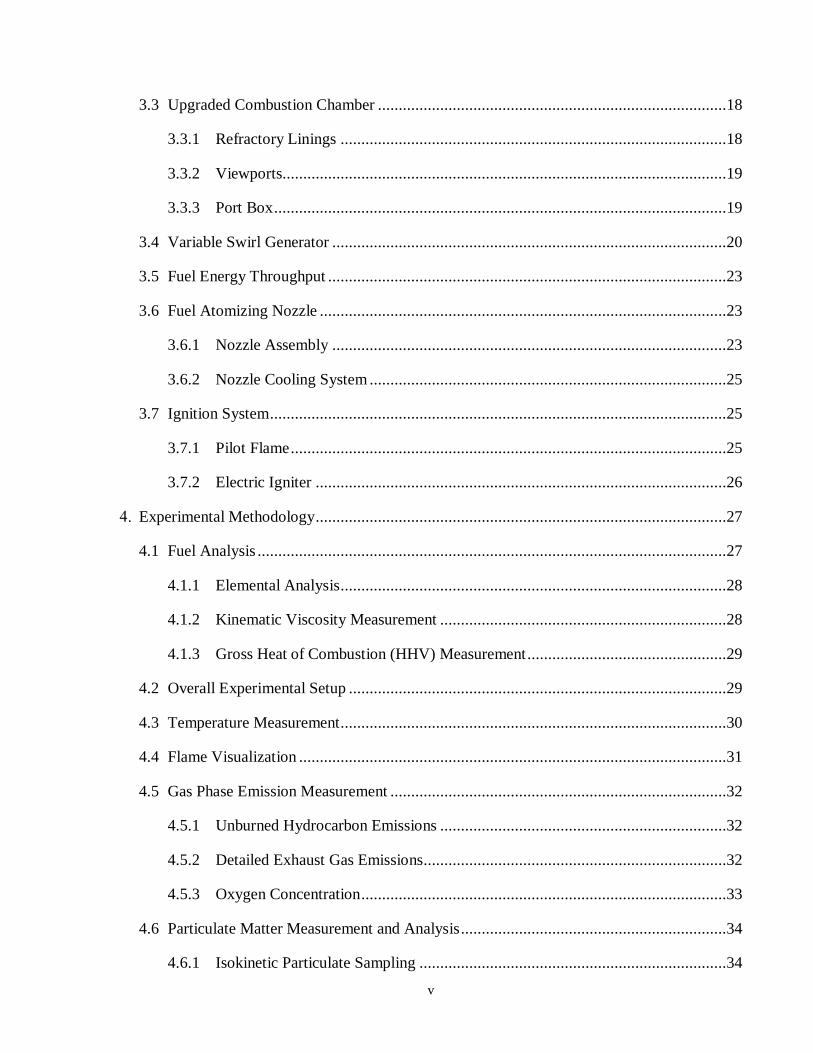
An analysis of the solid residues from bio-oil combustion revealed that there are two types
of residues formed from thermally induced pyrolysis and polymerization of oxygen-rich organic
substances: glassy spheres and cenospheres. These are different from the cokes produced from
petroleum oil burnout [33]. The glassy spheres are the fragments of PLB droplets which have
undergone polymerization instead of a full burnout, and are formed in earlier steps of droplet
combustion. On the other hand, the cenospheres have a porous structure and have undergone a
more thorough burnout. As it is shown in Figure 2.7, if the glassy spheres (a) are heated, they will
transform into cenospheres (b) and furthermore, these cenospheres can fully burnout (c), leaving
ash as the ultimate solid product.
(a) (b) (c)
Figure 2.7. Video images of solid residues from bio-oil combustion while burning in a flow
reactor [33]
2.4 Optimizing Bio-Oil Utilization
Bio-oil is carbon neutral and has the potential to replace petroleum fuels in some applications such
as industrial-scale boilers and furnaces [34, 35, 36], home-scale heating applications [37], gas
turbines [38, 39], and compression ignition diesel engines [27, 40]. However, it is challenging to

CHAPTER 2. LITERATURE REVIEW 11
utilize PLB in those applications due to the fuel properties discussed in section 2.2, such as its high
viscosity, corrosive nature, and coking tendency. Several studies have compared pollutant
emissions of bio-oil combustion to those of light fuel oils in boilers, gas turbines, and diesel
engines. While bio-oil produces slightly higher CO and NOx emissions, SOx emissions are
negligible since there is almost no sulfur content found in bio-oil [6, 35, 41]. Upgrading
combustion devices as well as enhancing the quality of fuel can significantly decrease CO
emissions. Moreover, NOx emissions mostly result from oxidation of fuel-bound nitrogen, which
can be reduced by upgrading fuel quality and removing fuel-bound nitrogen [15]. Bio-oil has
higher particulate matter emissions than light fuel oil does because it has solid and ash contents;
therefore, it is important to control these emissions in combustion systems to avoid problems such
as corrosion.
Shihadeh et al. [40] studied bio-oil combustion in a high-speed diesel engine, and compared
its ignition delay time and thermal efficiency to those of no. 2 fuel oil. While similar thermal
efficiencies were found for these fuels, bio-oil had a longer ignition delay time, which is mainly
due to poor atomization and ignition qualities of this biofuel. Also, PLB can cause corrosion and
clogging problems in engines, especially in the fuel delivery and injector systems. Hence, these
engines should be optimized before using bio-oil.
Bio-oil utilization in industrial-scale applications is a relatively novel area for replacing
petroleum oils with a carbon neutral alternative. Red Arrow Products pyrolysis plant in Wisconsin
is one of the first industrial units that regularly use PLB in a 5 MW swirl burner for heat generation
for over 20 years [32, 42]. Today, Valmet and Ensyn also have such pyrolysis plants in Finland
and New Hampshire, respectively. Therefore, with the increasing need for fossil fuel replacements,
it is important to expand studies further to improve the technology for bio-oil applications. The
optimization methods for bio-oil utilization are described in the following three techniques:
upgrading bio-oil fuel quality, co-combustion of bio-oil with fossil fuels, and optimizing
combustion devices.
2.4.1 Upgrading Bio-Oil Fuel Quality
There are two main methods to improve the quality of pyrolysis liquid biofuels: catalytic
processing and physical upgrading, which are explained briefly in this section.

CHAPTER 2. LITERATURE REVIEW 12
Catalytic Processing
Within the catalytic process, deoxygenation occurs along with removal of water, resulting in a
transportation grade hydrocarbon fuel. There are two common approaches: catalytic cracking, and
catalytic hydrotreating. Catalytic cracking uses a zeolite catalyst at atmospheric pressure in a
temperature of 450°C [43]. In this process, oxygen is transformed into CO and CO2, which reduces
the recovered mass, with a limited conversion rate of 40 %. Another limit to this process is catalyst
deactivation at high temperatures due to coke deposition and also upon reacting with alkali
compounds.
In catalytic hydrotreating, a CoMo or NiMo alumina-supported catalyst is required at a
high pressure and temperature, and presence of an external hydrogen source to carry out the
deoxygenation reaction [32, 43]. In this method, oxygen is removed by transforming it into water.
Although this method faces similar limitations regarding the catalyst deactivation, it has a higher
conversion rate of 50 % compared to the catalytic cracking process. However, it needs an external
hydrogen source and it results in producing waste water.
While upgrading bio-oil into a carbon-neutral hydrocarbon fuel is of great interest to bio-
oil producers, both these catalytic processes have low liquid yield and are resource intensive. There
is also another potential technique for upgrading bio-oil into a hydrocarbon fuel, which is called
hydropyrolysis [44]. This method is relatively new and is not explained here.
Physical Upgrading
Physical upgrading can be achieved via several different methods that are cheaper and less energy
intensive than catalytic processing. Hot gas filtration, liquid filtration, fuel distillation, and solvent
addition are the common techniques. In hot gas filtration method, char particles are removed by
passing the pyrolysis reactor vapors and gases through a 350-400°C heated filter. In this method,
ash and solid are removed, and thus, aging of the fuel is reduced [29, 45]. However, in order to
avoid vapor condensation, pyrolysis residence time has to be increased. Using this method, the
yield of liquid bio-oil is 40-50 wt % [30, 46]. In liquid filtration, although char is effectively
removed from the fuel, ash remains. Removal of char subsequently results in the removal of the
bound lignin, decreasing the heating value of the fuel. A shortcoming of this method is the strong
interactions between char and high molecular weight oligomers within the fuel [29, 30].

CHAPTER 2. LITERATURE REVIEW 13
Fuel distillation is another method of physical upgrading in which contents below 120°C
are removed [47]. This causes a 90 % removal of water and a 10 % removal of aldehydes and
ketones, the latter are responsible for aging. Therefore, while there is an increase in viscosity, the
heating value and the storage capacity are improved. In order to address the issue with the
viscosity, literature has suggested adding a polar solvent such as methanol or ethanol to the fuel,
which is described as another physical upgrading method. This technique is the easiest and most
feasible method, entailing addition of an alcohol such as methanol or ethanol (e.g. 10 wt %) to
reduce viscosity and increase volatility [30]. It also enhances the atomization and ignition quality,
and promotes flame stability [48]. For instance, Lopez Juste et al. [38], who studied combustion
of PLB in a gas turbine combustor, found that mixing bio-oil with 20 % (by volume) ethanol can
improve combustion performance of the fuel to a point similar to that of JP-4. Moreover, polar
solvent addition can reduce aging and thus, enhance storage stability. However, a limitation to this
method remains to be its lack of scalability in industry.
2.4.2 Co-Combustion of Bio-Oil with Fossil Fuels
One way to improve combustion efficiency of PLB is co-combustion of this biofuel with a fossil
fuel such as coal or natural gas [32]. Using bio-oil in applications such as gas turbines requires
more modification to the combustion system than it does in boilers, increasing interests in co-
combustion of PLB with another fuel oil. For instance, bio-oil can be co-fired with a light fuel oil
in gas turbines by implementing a dual-fuel nozzle, which is an inexpensive solution compared to
burning pure PLB in gas turbines [49]. Contrary to the power plants which use 100 % biofuels, co-
firing biofuels with fossil fuels does not require substantial modifications to combustion systems,
and this reduces the investment costs [50]. Furthermore, studies have indicated that co-firing bio-
oil in a coal or natural gas station does not negatively affect the pollutant emissions [51, 52].
2.4.3 Optimizing Combustion Devices
In order to replace the conventional petroleum fuels with a biofuel such as bio-oil, combustion
devices should be optimized. This becomes more important when pure bio-oil is used in
combustion facilities. Using bio-oil in diesel engines and gas turbines for producing electricity and
power is more challenging than using it in boilers for heat generation. Stationary heating
application such as boilers can use a wider variety of fuels than diesel engines and gas turbines
can. Thus, utilizing biofuels such as PLB in engines and gas turbines, which are designed to work

CHAPTER 2. LITERATURE REVIEW 14
best with light fuel oils, requires more investments and optimization. Table 2.1 summarizes the
major modifications and further developments necessary for gas turbines and diesel engines, as
suggested by Chiaramonti et al. [50].
Table 2.1. Development of PLB-based gas turbines and diesel engines [50]
Gas turbine Diesel engine
Major
modifications
Nozzles, materials, in-line
cleaning system, feeding line Injector and fuel pump material
Further
developments
Application of PLB to micro
gas turbines
Use of emulsions and blends for
ignition, fuel handling and
injection improvement
Modifying the fuel nozzle design is one of the most important steps in optimizing burners
or other combustion devices. In literature, it is suggested to use internal-mixing air-blast atomizing
nozzles rather than external-mixing ones since they provide enough pressure and power to atomize
bio-oil [4, 17, 53]. Some studies have revealed that using custom-made nozzles rather than
commercial ones can be advantageous for better bio-oil atomization and ignition qualities [54, 55].
Moreover, bio-oil is corrosive and can destroy fuel delivery and injection systems; hence, it is
important to use corrosion-resistant materials.
As mentioned in section 2.2, bio-oil flame has poor stability characteristics. Studies have
shown that it is necessary to use a swirl generator in bio-oil burners in order to create recirculation
zones around the fuel nozzle and stabilize the flame [4, 36, 56]. Another method for improving
flame stability is to use radiant devices to reflect more energy back into the flame, enhancing the
ignition quality and stability [35]. Furthermore, ignition quality of PLB can be improved by using
conventional fuels or pilot flames to preheat the combustion chamber prior to start bio-oil
combustion. In terms of pollutant emissions such as CO, there are different ways to reduce those
emissions. In boilers and furnaces, CO emissions can be reduced by implementing refractory
linings [48], and by preheating fuel and the combustion air [5, 7, 48]. In diesel engines, one
effective way to reduce CO emissions is to use a catalytic converter [57]. Moreover, it is found
that the combustion air should be preheated to be able to ignite bio-oil in diesel engines [40].
15
C h a pt e r 3
Burner Design
3.1 Previous Burner Assembly
A 10 kW swirl burner, designed by Tzanetakis [4], had been previously used to study bio-oil
combustion. A variable swirl generator was installed on top of the combustion chamber as shown
in Figure 3.1. The combustion chamber had different sections, namely, the diffuser section, the
viewport section, and the extended exhaust section. All these sections were constructed from 316-
grade stainless steel due to the corrosive nature of the fuel. The fuel was injected in a downward
direction by an atomizing nozzle into a combustion chamber. There was no refractory lining inside
the combustion chamber and hence, the amount of heat loss was significant.

CHAPTER 3. BURNER DESIGN 16
Figure 3.1. Schematic of the previous burner assembly [4]
The nozzle tip was located at top of the diffuser, whereas the viewport was located
downstream of the diffuser section. Therefore, it was not possible to visualize the flame through
the viewport and instead, a borescope was inserted into the combustor to take images and videos.
Also, the diffuser was too small for the spray pattern and much of the fuel spray hit the walls prior
to burnout.
3.2 Design Principles for Industrial Bio-Oil Burners
Bio-oil has different properties than petroleum oils and burners should be optimized in order to
use this biofuel. Section 2.4.3 reviewed the most important design factors for industrial PLB
burners suggested in literature, and this section explains how real industrial burners differ from
the previous 10 kW burner used to study bio-oil combustion. Combustion performance of bio-oil
is extremely sensitive to parameters such as burner temperature, turbulence and mixing quality
inside the combustor, and the residence time of burner. In order to improve ignition quality and
flame stability, industrial bio-oil burners use refractory lining to reduce heat loss and increase local
flame temperatures. However, the previous burner lacked refractory lining and it was not feasible
to provide adequate temperature inside the burner and stabilize flames of pure bio-oil.

CHAPTER 3. BURNER DESIGN 17
Similar to the industrial burners, the previous burner used a swirl generator to induce
recirculation zones around the fuel nozzle and promote turbulence and mixing. Whereas industrial
burners do not have a diffuser section, the previous burner used a conical diffuser to enhance the
emergence of recirculation zones. The width of this diffuser section was too small for the spray
and much of the bio-oil spray hit the walls before they could burn out. Moreover, the primary air
velocity was significantly lower in the previous burner than the industrial ones, suggesting that the
previous burner throat was too wide and the degree of swirl was not high enough to anchor bio-oil
flames close to fuel nozzle.
Bio-oil has a wide volatility range, and contains solid and ash contents, which result in
particulate matter (PM) emissions. PM emissions from bio-oil combustion consist of ash and
partially-burned carbonaceous residues (CR). It is important to provide adequate residence times
for bio-oil combustion in order to decrease the amount of pollutant emissions produced from
incomplete combustion. Residence time of a burner is defined as the average time that the
combustion gases remain in the combustion chamber. While industrial burners are able to provide
sufficient residence times to oxidize most of intermediate combustion products, small-scale
burners such as the previous one usually have shorter residence times. Decreasing bio-oil droplet
size and increasing the burner temperature are two effective ways in order to favor complete fuel
oxidation in small-scale burners. The spray droplet size can be decreased by optimizing the nozzle
design, and the burner temperature can be increased by implementing refractory linings.
Considering the design principles for bio-oil burners and all the optimization factors
suggested above, this study aims to upgrade the previous swirl burner for pure bio-oil combustion.
The major modifications that have been taken into account are as follows:
1. Implementing refractory linings inside the combustion chamber,
2. Removing diffuser as industrial burners typically do not have them,
3. Increasing the size of the combustion chamber to prevent the spray from hitting the walls
prior to burnout,
4. Enhancing flame visualization by implementing two quartz viewports,
5. Upgrading the pilot flame and ignition system,

CHAPTER 3. BURNER DESIGN 18
6. Upgrading the fuel nozzle design.
3.3 Upgraded Combustion Chamber
A new refractory lined combustion chamber is designed and manufactured to replace the previous
one in the lab. It has a larger combustion chamber than the previous chamber and has two refractory
linings in order to decrease heat loss and improve combustion efficiency. The upgraded assembly
utilizes the existing swirl box as the swirl air generator. A door is used for maintenance and
cleaning the combustion chamber, fuel nozzle, and viewports after each test. Figure 3.2 depicts a
schematic of the new burner assembly and its overall dimensions. Similar to industry-scale burner
designs, the upgraded combustion chamber does not have a diffuser section. Refer to Appendix A
for detailed drawings of the upgraded burner.
Figure 3.2. Schematic of the new burner assembly
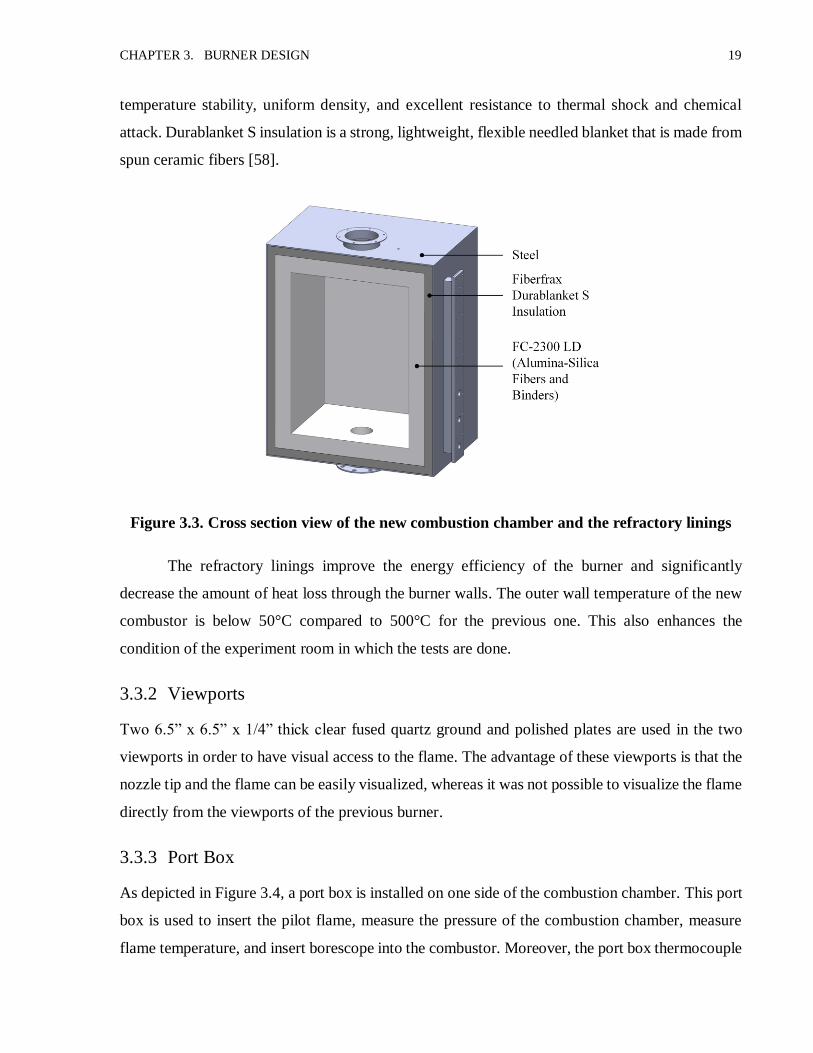
3.3.1 Refractory Linings
As shown in Figure 3.3, there are two refractory linings used in the new combustor: Alumina-
Silica fibers and binders (FC-2300 LD) from “FiberCast Inc.”, and Durablanket S insulation from
“Unifrax I LLC”. FC-2300 LD products are vacuum formed from a slurry of alumina-silica fibers
and binders. They are light-weight, rigid boards and shapes with low thermal conductivity, high
CHAPTER 3. BURNER DESIGN 19
temperature stability, uniform density, and excellent resistance to thermal shock and chemical
attack. Durablanket S insulation is a strong, lightweight, flexible needled blanket that is made from
spun ceramic fibers [58].
Figure 3.3. Cross section view of the new combustion chamber and the refractory linings
The refractory linings improve the energy efficiency of the burner and significantly
decrease the amount of heat loss through the burner walls. The outer wall temperature of the new
combustor is below 50°C compared to 500°C for the previous one. This also enhances the
condition of the experiment room in which the tests are done.
3.3.2 Viewports
Two 6.5” x 6.5” x 1/4” thick clear fused quartz ground and polished plates are used in the two
viewports in order to have visual access to the flame. The advantage of these viewports is that the
nozzle tip and the flame can be easily visualized, whereas it was not possible to visualize the flame
directly from the viewports of the previous burner.
3.3.3 Port Box
As depicted in Figure 3.4, a port box is installed on one side of the combustion chamber. This port
box is used to insert the pilot flame, measure the pressure of the combustion chamber, measure
flame temperature, and insert borescope into the combustor. Moreover, the port box thermocouple

CHAPTER 3. BURNER DESIGN 20
measures the temperature of the port box flange, indicating the outer-wall temperature of the
burner.
Figure 3.4. Port box
3.4 Variable Swirl Generator
Turbulence is an important factor in non-premixed flames, because it increases mixing between
air and fuel, enhancing ignition and flame stability. In order to promote turbulence and flame
stability, a movable block type swirl generator is used to create a swirling flow around the fuel
nozzle [4]. A swirl flow incorporates a certain amount of angular momentum and velocity, which
can induce radial and axial pressure gradients, with low pressure zones in the center and upstream
of the flow. As shown in Figure 3.5, this creates a central recirculation zone (CRZ) inside the
combustor.

CHAPTER 3. BURNER DESIGN 21
Figure 3.5. Central recirculation zone in a swirl flow [59]
In order to characterize swirling flows, literature defines a dimensionless swirl number (S),
indicating the ratio between the axial and angular momentum fluxes [60]:
𝑆 =𝐺𝜑
𝑅.𝐺𝑥 (3.1)
In the above equation, R is the swirl exit radius, 𝐺𝜑 is the axial flux of the angular
momentum, and 𝐺𝑥 is the axial flux of the axial momentum. Both these momentum fluxes are
conserved in free swirling flows, and are determined as below:
𝐺𝜑 = ∫ (𝑊𝑟)𝜌𝑈2𝜋𝑟𝑑𝑟𝑅
0= 𝑐𝑜𝑛𝑠𝑡. (3.2)
𝐺𝑥 = ∫ 𝑈𝜌𝑈2𝜋𝑟𝑑𝑟𝑅
0+ ∫ 𝜌2𝜋𝑟𝑑𝑟
𝑅
0= 𝑐𝑜𝑛𝑠𝑡. (3.3)
Here, W and U are the tangential and axial components of velocity, respectively, and 𝜌 is the static
pressure. The swirl box used in this study consists of 8 movable swirl blocks, which can generate
a swirl number from 0 to 5.41 [4]. However, the predicted swirl number does not remain constant
between the swirl block exit plane and the nozzle tip. Others have proved that the swirl number
can decay up to 40 % along the annular region in the burner throat [61]. Hence, these swirl numbers

CHAPTER 3. BURNER DESIGN 22
are only used as indicators of the swirl intensity inside the burner. The Geometry and design
parameters of the swirl generator are shown in Figure 3.6 and Table 3.1.
Figure 3.6. Geometry of the swirl generator (movable block type) [4]
Table 3.1. Design parameters and values for the current swirl generator
Parameter Description Value
𝑛 Number of swirl blocks 8
𝑅 Swirl generator exit radius 76.2 mm
𝑅ℎ Swirl generator inner radius 9.53 mm
𝐵 Depth of swirl blocks 38.1 mm
𝛼 Fixed swirl block angle 60°
𝜉 Adjustable swirl block angle 0 to 12°
𝜉𝑚 Maximum opening angle 12°
Furthermore, the swirl number is estimated at the exit plane of the swirl box, using the
following equation [4]:
𝑆 ≈2𝜋
𝑛𝜉𝑚. sin 𝛼 .
cos 𝛼[1+tan 𝛼 tan(𝜉/2)](𝜉 𝜉𝑚⁄ )
{1−[1−cos 𝛼(1+tan 𝛼 tan(𝜉/2))]𝜉 𝜉𝑚⁄ }2 .𝑅
2𝐵. [1 − (
𝑅ℎ
𝑅)2] (3.4)
Details on swirl number calculations and analysis for movable block geometries can be
found elsewhere [4, 60, 61].

CHAPTER 3. BURNER DESIGN 23
3.5 Fuel Energy Throughput
The fuel flowrate is calculated based on the heating value (LHV) of the fuel and the energy input
from the fuel, which is 10 kW. This energy input remains constant for all the burner tests to ensure
they are comparable. The fuel flowrate for pure bio-oil is about 30.5 mL/min in this study.
Although this energy throughput is lower than intermediate-size furnaces in industry, it makes it
possible to study different operating conditions for bio-oil combustion without using significant
amount of fuel. Moreover, it can seek the potential for using pyrolysis liquid biofuels in residential
boilers or any other small-scale burner application.
3.6 Fuel Atomizing Nozzle
3.6.1 Nozzle Assembly
The nozzle assembly includes a liquid cap, an air cap, and a ¼” JPL back-connect body provided
by BEX Engineering Ltd, as well as a 13-inch-long extension tube. All these parts are constructed
from 316-grade stainless steel due to the corrosive nature of the fuel [17]. Four different nozzles
are studied in the experiments, all of which are internal-mixing air-blast atomizing nozzles. These
nozzles are only different in their liquid caps and air caps. The first nozzle used in the experiments
is a JPL26B nozzle assembly from BEX Engineering Ltd, including a JL40100 liquid cap and a
JPG60 air cap. As shown in Figure 3.7, the liquid cap has a discharge orifice of 1 mm and the air
cap has six discharge orifices of 0.94 mm each, creating a hollow cone spray pattern. This nozzle
is the same as the one used in the previous burner. However, in order to address the nozzle coking
problem (section 5.6), three other nozzles are utilized to find the best nozzle design for bio-oil
combustion.

CHAPTER 3. BURNER DESIGN 24
Figure 3.7. Schematic of the atomizing nozzle no.1 [62]
The second nozzle is a JPL16 nozzle assembly, also from BEX Engineering Ltd, including
a JL2050 liquid cap and a JPG15 air cap. This nozzle is smaller than the first one, with an orifice
diameter of 0.51 mm on both the liquid and air caps. The next two nozzle assemblies are using the
same liquid cap as for the first nozzle (JL40100 liquid cap), but different JPG60 air caps. One of
the air caps has an orifice diameter of 0.80 mm, whereas the other one has an orifice diameter of
0.66 mm. Table 3.2 summarizes the nozzle specifications and the drawings can be found in
Appendix C.
Table 3.2. Nozzle specifications
Nozzle
no.
Liquid cap
Model no.
Liquid cap
d (mm)
Air cap
Model no.
Air cap
d (mm)
1 JL40100 1 JPG60 0.94
2 JL2050 0.51 JPG15 0.51
3 JL40100 1 JPG60 custom machined 0.80
4 JL40100 1 JPG60 custom machined 0.66
Bio-oil is hard to ignite and has poor flame stability; therefore, it is important to use a
proper nozzle design. Different nozzle designs produce different ranges of spray droplet size,
which can significantly affect the ignition quality of bio-oil. Literature suggests that the Sauter
mean diameter (SMD) of air-blast atomization of a liquid with similar properties to bio-oil can be
estimated by this correlation [63]:
CHAPTER 3. BURNER DESIGN 25
SMD = 0.48 𝑑0 (𝜎
𝜌𝐴𝑈𝑅2𝑑0
)0.4
(1 +�̇�𝐿
�̇�𝐴)
0.4
+ 0.15 𝑑0 (𝜇𝐿
2
𝜎𝜌𝐿𝑑0)
0.5
(1 +�̇�𝐿
�̇�𝐴) (3.5)
Where 𝑑0 is the orifice diameter, 𝜎 is surface tension, 𝜌𝐴 and 𝜌𝐿 are densities of air and liquid, 𝑈𝑅
is the relative velocity of air and liquid, �̇�𝐴 and �̇�𝐿 are mass flow rates of air and liquid, and 𝜇𝐿 is
the dynamic viscosity of liquid at the nozzle temperature.
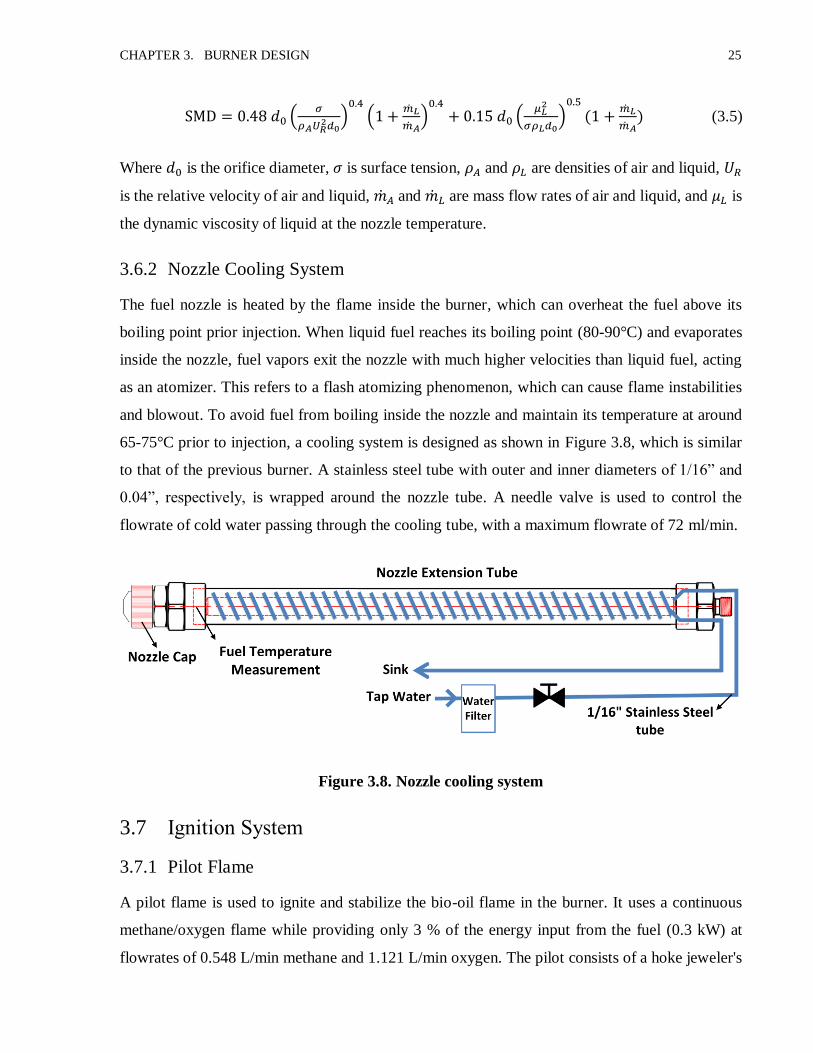
3.6.2 Nozzle Cooling System
The fuel nozzle is heated by the flame inside the burner, which can overheat the fuel above its
boiling point prior injection. When liquid fuel reaches its boiling point (80-90°C) and evaporates
inside the nozzle, fuel vapors exit the nozzle with much higher velocities than liquid fuel, acting
as an atomizer. This refers to a flash atomizing phenomenon, which can cause flame instabilities
and blowout. To avoid fuel from boiling inside the nozzle and maintain its temperature at around
65-75°C prior to injection, a cooling system is designed as shown in Figure 3.8, which is similar
to that of the previous burner. A stainless steel tube with outer and inner diameters of 1/16” and
0.04”, respectively, is wrapped around the nozzle tube. A needle valve is used to control the
flowrate of cold water passing through the cooling tube, with a maximum flowrate of 72 ml/min.
Figure 3.8. Nozzle cooling system
3.7 Ignition System
3.7.1 Pilot Flame
A pilot flame is used to ignite and stabilize the bio-oil flame in the burner. It uses a continuous
methane/oxygen flame while providing only 3 % of the energy input from the fuel (0.3 kW) at
flowrates of 0.548 L/min methane and 1.121 L/min oxygen. The pilot consists of a hoke jeweler's

CHAPTER 3. BURNER DESIGN 26
soldering torch body (Hoke model No. 110-406, provided by Contenti Co.), a 20” long extension
stainless steel tube (1/4” OD), and a pilot tip. Originally, the pilot tip was a standard No. 7 brass
tip with a 1.2 mm orifice diameter. However, due to higher temperatures achieved within the new
burner, the brass tip melts and fails to operate. Thus, a Hi-Heat torch tip (Item No. 14.157, provided
by Grobet USA) is used as the tip for the pilot flame to run the premixed CH4/O2 flame without
getting melted.
3.7.2 Electric Igniter
Previously, the pilot flame was ignited by a lighter outside of the combustor, and then it was
inserted into the pilot port. However, with the new design, an electric igniter is used to start the
pilot flame directly from inside the burner, without opening the door nor removing the pilot from
its port. The pilot flame is ignited by moving its tip close to the electric igniter tip inside the burner
and pushing the red button to spark. Figure 3.9 demonstrates the ignition system. This setup is
safer and also allow the operator to reignite the pilot flame in case it goes off during the test.
Figure 3.9. Schematic of the ignition system
27
C h a pt e r 4
Experimental Methodology
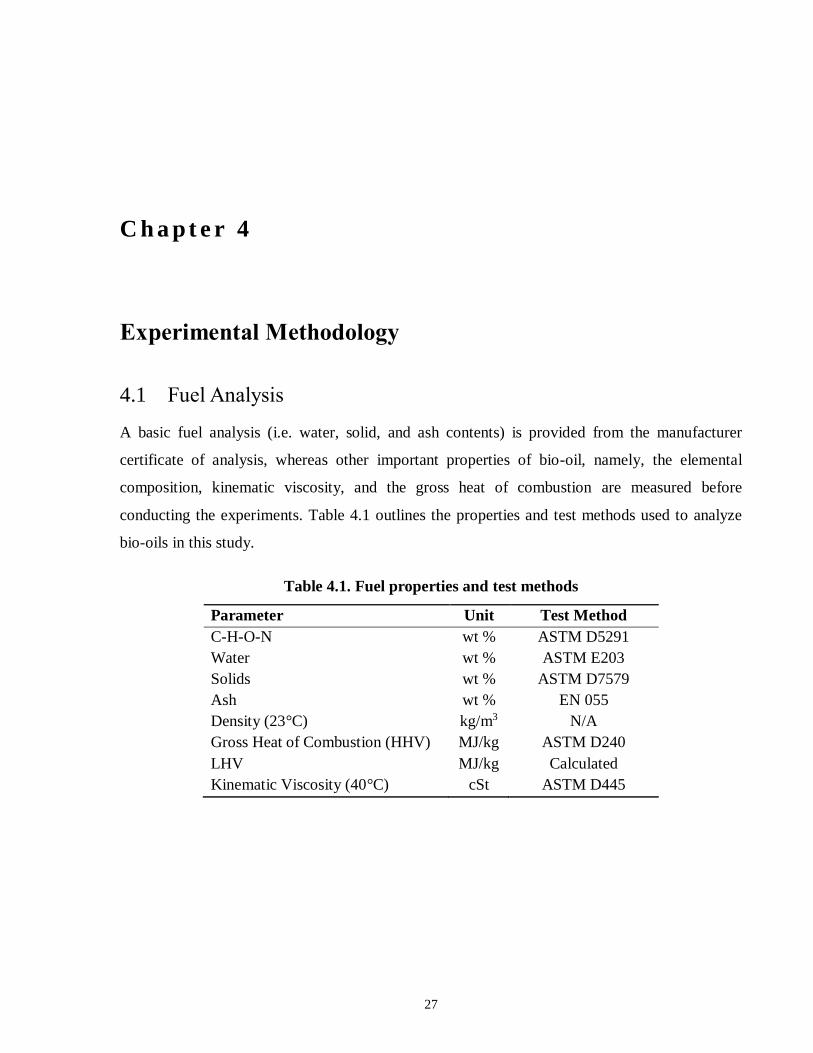
4.1 Fuel Analysis
A basic fuel analysis (i.e. water, solid, and ash contents) is provided from the manufacturer
certificate of analysis, whereas other important properties of bio-oil, namely, the elemental
composition, kinematic viscosity, and the gross heat of combustion are measured before
conducting the experiments. Table 4.1 outlines the properties and test methods used to analyze
bio-oils in this study.
Table 4.1. Fuel properties and test methods
Parameter Unit Test Method
C-H-O-N wt % ASTM D5291
Water wt % ASTM E203
Solids wt % ASTM D7579
Ash wt % EN 055
Density (23°C) kg/m3 N/A
Gross Heat of Combustion (HHV) MJ/kg ASTM D240
LHV MJ/kg Calculated
Kinematic Viscosity (40°C) cSt ASTM D445

CHAPTER 4. EXPERIMENTAL METHODOLOGY 28
4.1.1 Elemental Analysis
An elemental analysis determines carbon, hydrogen, and nitrogen contents of fuel, which is done
in the ANALEST1 facility at the University of Toronto. The oxygen content of fuel is then
calculated by using this elemental analysis and assuming that carbon, hydrogen, nitrogen, and
oxygen are the only constituents of bio-oil.
4.1.2 Kinematic Viscosity Measurement
The kinematic viscosity of fuel is measured in the Rheology Laboratory at the University of
Toronto. It is done according to standard ASTM D445 by a viscometer placed in a constant
temperature tank. First, a proper viscometer is chosen with respect to the expected viscosity range
for bio-oil at the desired temperature. Then, it is inserted into the bath, and the fuel sample is
charged into the viscometer tube by applying suction to the tube. In the next step, the sample liquid
is allowed to flow within the tube from a marked point to another. Finally, the kinematic viscosity
is calculated by measuring the time at which the sample flows and by using a viscometer
calibration data sheet. Figure 4.1 depicts the measurement setup.
Figure 4.1. Measuring viscosities
1 Analytical Lab for Environmental Science Research and Training

CHAPTER 4. EXPERIMENTAL METHODOLOGY 29
4.1.3 Gross Heat of Combustion (HHV) Measurement
The gross heat of combustion measurements were done in the Pulp and Paper Center at the
University of Toronto, using a Parr 6300 calorimeter according to standard ASTM D240. In this
method, the sample is weighed and placed inside the calorimeter, and after about 15-20 minutes,
the heating value of the sample can be read from its screen. Before taking measurements, a sample
of pure ethanol, which has a known heating value (HHV = 29.685 MJ/kg), was used as a reference
to confirm the accuracy of the results. The error was found to be ±2.4 %.
4.2 Overall Experimental Setup
The experimental setup includes various inputs, outputs, and sample lines, which are depicted in
Figure 4.2.
Figure 4.2. Schematic of the experimental setup
Using two peristaltic pumps, the fuel is injected into the combustor by the atomizing
nozzle. A stack fan is used at the end of the exhaust line to pull room air into the combustor and
provide the primary air for combustion. Hence, the exhaust line and the combustion chamber are

CHAPTER 4. EXPERIMENTAL METHODOLOGY 30
all under slight vacuum. An air heater is used to preheat the primary air and consequently, to
preheat fuel inside the nozzle. The pilot flame ignites and stabilizes the main flame. The exhaust
products are collected, and gas phase emissions as well as particulate matters are measured to
investigate the relationship between the burner design and combustion performance of bio-oil.
4.3 Temperature Measurement
Several thermocouples are used to measure temperatures at specific locations. The thermocouples
are connected to a 10-channel reader unit with a digital display, and the temperatures can be read
from the front panel of the LabVIEW software on the computer. The locations of some of these
thermocouples are depicted in Figure 4.3.
Figure 4.3. Thermocouple locations
Fuel boiling results in flash atomization and combustion instabilities; thus, it is essential to
monitor the fuel temperature during experiments. A 24-inch-long PFA-coated J-type thermocouple
is installed inside the fuel nozzle to measure the fuel temperature prior injection. The diameter of
this thermocouple is 1/16 inch, and it is inserted through the nozzle extension tube into the nozzle
liquid cap, as shown in Figure 3.8. If the fuel temperature reaches close to its boiling point, the
nozzle cooling water will be turned on to start cooling the fuel and keep its temperature around

CHAPTER 4. EXPERIMENTAL METHODOLOGY 31
70°C. The near flame temperature is measured by a 24-inch-long K-type thermocouple through
the port box. It is a Nickel-Chrome based super OMEGACLAD sheathed probe with a grounded
junction that works well at high temperatures (temperatures up to 1335°C) with low thermal drift.
The thermocouple is inserted into the combustion chamber until it reaches one of the flame jets,
as depicted in Figure 4.4.
Figure 4.4. Flame temperature measurement: location of the thermocouple
4.4 Flame Visualization
A 10 megapixel Kodak (EasyShare Z1012 IS) digital camera is put on a tripod and placed in front
of one of the quartz viewports to capture pictures and videos from the flame. Figure 4.5 depicts a
picture taken from the viewport, specifying all the objects seen in the frame.
Figure 4.5. Image of the flame
Thermocouple
tip

CHAPTER 4. EXPERIMENTAL METHODOLOGY 32
4.5 Gas Phase Emission Measurement
Gas phase emissions as well as oxygen percent in the exhaust products are detected by the
measurement instruments using the heated sample lines. The heated sample lines have heating
elements in order to keep the exhaust gases at a high temperature (between 190 to 200°C) and
prevent any condensation in the lines. As it is depicted in Figure 4.2, a heated filter is installed
before the measurement instruments so as to collect all the particulate matter before entering these
instruments.
4.5.1 Unburned Hydrocarbon Emissions
A California Analytical Instruments model 600 flame ionization detector (FID) is used to measure
the amount of unburned hydrocarbons (UHCs) in the exhaust sample. Using a small hydrogen
flame, FID burns the exhaust sample which is passed through it, producing CH and other
hydrocarbon radicals. This results in producing an ionized current, which is dominated by the
oxidation of CH radicals and is indicative of the number of carbon atoms in UHC emissions found
in the exhaust gases. The details about its principle of operation can be found elsewhere [64]. The
FID is manually calibrated before taking measurements by using a mixture of 90.2 ppm methane
in nitrogen as the span gas and compressed air as the zero gas. Finally, the UHC emissions are
reported as ppm of methane. In this study, the measurement range is 0-300 ppm with an uncertainty
of ±3 ppm.
4.5.2 Detailed Exhaust Gas Emissions
It is important to measure and control pollutant emissions such as CO and NOx in combustion
systems. Moreover, using oxygenated fuels can result in aldehyde emissions such as formaldehyde
and acetaldehyde in the exhaust products. Therefore, a Nicolet 380 Fourier transform infrared
spectrometer (FTIR) is used to measure CO2, H2O, CO, NOx, as well as CH4, formaldehyde
(CH2O), and acetaldehyde (C2H4O) emissions. When a chemical species is subjected to an infrared
radiation with a multitude of frequencies, it absorbs the radiation at a unique frequency and with a
certain absorption intensity. FTIR uses this method to identify each species as well as its
concentration, which is determined from the intensity of absorption. The FTIR used in this study
has a gas cell volume of 0.19 L and uses two vacuum pumps to draw the exhaust sample through

CHAPTER 4. EXPERIMENTAL METHODOLOGY 33
the gas cell at an absolute pressure of 86.3 kPa. In order to determine the exhaust gas composition,
the FTIR collects a spectrum, which is the average of 24 scans from the gas cell over 1 minute.
Using particular gas mixtures with known concentrations and applying a partial least
squares model, the FTIR is calibrated and ready for the measurements. In order to define the
accuracy of the calibration model, root mean squared error (RMSE) determines the deviation
between prediction from the calibration method and the actual concentration in a standard gas
mixture. The details about the calibration procedure can be found elsewhere [64]. Table 4.2
outlines the detection limits and RMSE values.
Table 4.2. Detection limits and RSME values of the FTIR
Species unit Detection limit RMSE
CO2 vol. % 2-15 0.19
H2O vol. % 0.5-15 0.12
CO (low) ppm 10-600 15.6
CO (medium) ppm 600-1500 25.5
CO (high) ppm 1500-2800 31.4
NOx ppm 10-300 6.3
CH4 ppm 10-250 3.1
CH2O ppm 10-150 1.7
C2H4O ppm 30-150 5.2
4.5.3 Oxygen Concentration
In order to find the equivalence ratio1 of combustion reaction, it is essential to measure the oxygen
concentration in exhaust. Knowing the chemical composition of the fuel, measuring the oxygen
concentration in the product gases, and assuming a complete combustion reaction, the equivalence
ratio is calculated. Hence, a Zirconia (ZrO2) model OXY6200 oxygen sensor continuously
measures the percent of oxygen presented in exhaust. The accuracy of this sensor is ±0.1 O2 % for
the measurement range of 0 to 21 % O2. A vacuum pump is used to pull exhaust through the oxygen
1 Φ =
(𝐴/𝐹)𝑠𝑡𝑜𝑖𝑐
(𝐴/𝐹)
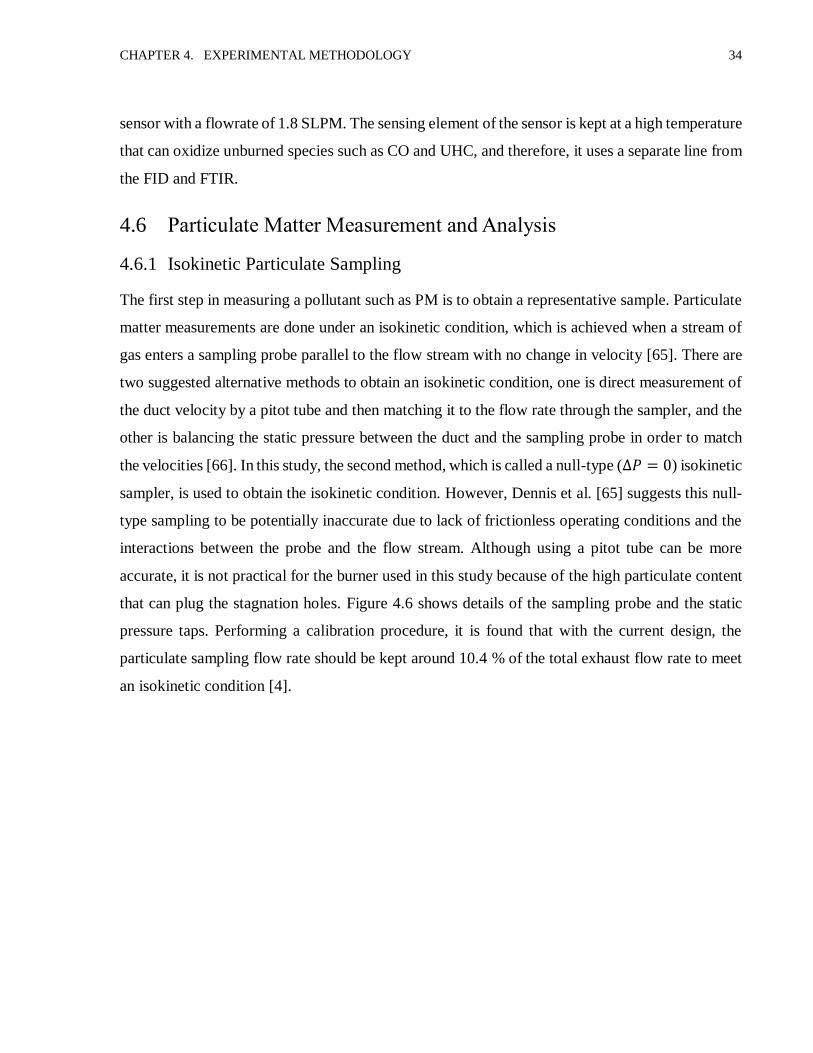
CHAPTER 4. EXPERIMENTAL METHODOLOGY 34
sensor with a flowrate of 1.8 SLPM. The sensing element of the sensor is kept at a high temperature
that can oxidize unburned species such as CO and UHC, and therefore, it uses a separate line from
the FID and FTIR.
4.6 Particulate Matter Measurement and Analysis
4.6.1 Isokinetic Particulate Sampling
The first step in measuring a pollutant such as PM is to obtain a representative sample. Particulate
matter measurements are done under an isokinetic condition, which is achieved when a stream of
gas enters a sampling probe parallel to the flow stream with no change in velocity [65]. There are
two suggested alternative methods to obtain an isokinetic condition, one is direct measurement of
the duct velocity by a pitot tube and then matching it to the flow rate through the sampler, and the
other is balancing the static pressure between the duct and the sampling probe in order to match
the velocities [66]. In this study, the second method, which is called a null-type (∆𝑃 = 0) isokinetic
sampler, is used to obtain the isokinetic condition. However, Dennis et al. [65] suggests this null-
type sampling to be potentially inaccurate due to lack of frictionless operating conditions and the
interactions between the probe and the flow stream. Although using a pitot tube can be more
accurate, it is not practical for the burner used in this study because of the high particulate content
that can plug the stagnation holes. Figure 4.6 shows details of the sampling probe and the static
pressure taps. Performing a calibration procedure, it is found that with the current design, the
particulate sampling flow rate should be kept around 10.4 % of the total exhaust flow rate to meet
an isokinetic condition [4].

CHAPTER 4. EXPERIMENTAL METHODOLOGY 35
Figure 4.6. The isokinetic sampling probe [4]
In order to obtain a uniform PM distribution, a flow straightener constructed from 0.25 mm
thick stainless steel sheet metal is placed inside the exhaust outlet pipe. Although this can improve
the sampling condition, a part of PM is always deposited on the walls of the combustion chamber
because of the high swirling flows and reduction in the cross sectional area of the burner at the
exhaust pipe. Figure 4.7 depicts a schematic of the burner exhaust pipe and the particulate sampling
system.

CHAPTER 4. EXPERIMENTAL METHODOLOGY 36
Figure 4.7. Schematic of the PM sampling system [4]
A stainless steel filter holder body (Model LS47, Part No. 304700, provided by Advantec
MFS Inc.) is placed in line with the sampling flow to hold the filter. Using a 47 mm diameter
Tissuquartz filter (Product No. 7202, provided by Pall Life Sciences), PM is collected for analysis.
A vacuum pump is located at the end of the sampling line to pull the exhaust gases through this
filter. There is a thermocouple located inside the filter holder to measure the gas temperature,
which is kept between 115 to 140°C. A condenser (Part No. 2151414, provided by Seakamp
Engineering Inc.) is placed before the vacuum pump to cool down the sampling flow and remove
water prior reaching the pump. The flow rate of the gas exiting the condenser (dry gas) as well as
its temperature and pressure are measured in order to calculate the actual sampling flow rate
(�̇�𝑠𝑎𝑚𝑝𝑙𝑒𝑑):
�̇�𝑠𝑎𝑚𝑝𝑙𝑒𝑑
�̇�𝑚𝑒𝑎𝑠𝑢𝑟𝑒𝑑=
𝑃𝑠𝑎𝑡 𝑃𝑡𝑜𝑡𝑎𝑙⁄ −1
𝑋𝐻2𝑂−1 (4.1)

CHAPTER 4. EXPERIMENTAL METHODOLOGY 37
Here, �̇�𝑚𝑒𝑎𝑠𝑢𝑟𝑒𝑑 is the flow rate of dry gas measured by a rotameter prior to the vacuum pump,
𝑃𝑠𝑎𝑡 is the saturation pressure at the temperature of dry gas, 𝑃𝑡𝑜𝑡𝑎𝑙 is the absolute pressure in the
line measured by the gauge in the condenser, and 𝑋𝐻2𝑂 is the molar fraction of water in exhaust
gases, calculated form the oxygen sensor and assuming complete combustion.
The sampling time is usually less than 5 minutes to avoid overloading the filter, which can
clog the line. In order to replace the filter with a new one, a valve is used to close the main sampling
line while another valve is opened to pass the flow through a bypass line. Similar to the main
sampling line, the bypass line is also using an in-line filter holder and a filter to collect PM before
reaching the pump. The details on how to collect PM during a burner operation are explained in
the burner instruction (Appendix B).
4.6.2 Gravimetric Analysis and Loss on Ignition
While the burner is running at a steady operating condition, two consecutive filters are used to
collect PM samples. Using Scientech SM-128D Microbalance, these filters are weighed and stored
in petri dishes before and after each test to find the total amount of PM collected. Knowing the
sampling time (∆t), the fuel and exhaust flow rates, and the sampling flow rate, total PM is reported
as mg of PM per kg of fuel:
PM = ∆𝑚𝑓𝑖𝑙𝑡𝑒𝑟
�̇�𝑓𝑢𝑒𝑙 ∆𝑡 (�̇�𝑠𝑎𝑚𝑝𝑙𝑒𝑑
�̇�𝑡𝑜𝑡𝑎𝑙)
(4.2)
Here, ∆𝑚𝑓𝑖𝑙𝑡𝑒𝑟 is mass difference between the blank and loaded filter, �̇�𝑓𝑢𝑒𝑙 is mass flow rate of
fuel, and (�̇�𝑠𝑎𝑚𝑝𝑙𝑒𝑑 �̇�𝑡𝑜𝑡𝑎𝑙⁄ ) is the ratio of the sampling flow rate to total exhaust flow rate. �̇�𝑠𝑎𝑚𝑝𝑙𝑒𝑑
is found from equation 4.1 and �̇�𝑡𝑜𝑡𝑎𝑙 is calculated assuming complete combustion and using
equivalence ratio obtained from the oxygen sensor.
Total PM consists ash and carbonaceous residue (CR). In order to measure the amount of
each fraction, a loss on ignition test, which is an ASTM D4422-03 standard method, is performed
after collecting PM. Prior to a PM sampling test, blank filters are first placed inside a muffle
furnace at 750°C in order to burn out any possible particles accumulated on them. The filters are
then used in the burner to collect PM. After finishing the test, filters are dried at a temperature of

CHAPTER 4. EXPERIMENTAL METHODOLOGY 38
150°C in the muffle furnace for two hours. At this stage, the mass difference indicates the amount
of water collected on the filter, and the mass difference between the dried filter and its blank
condition indicates total PM. Then, the temperature of the muffle furnace is increased to 750°C
for one hour to burn off any possible carbonaceous residue on the filter. The mass difference after
this stage is the amount of CR. Knowing the mass of total PM and CR, the amount of ash collected
on the filter is then calculated as summarized in Table 4.3.
Table 4.3. Calculation method for loss on ignition test
Mass of blank filter (after placing at 750°C for two hours) M1
Mass of loaded filter after burner test M2
Mass of filter after drying at 150°C for two hours M3
Mass of filter after burning at 750°C for one hours M4
Total PM M3- M1
Water M2- M3
CR M3- M4
Ash = Total PM – CR M4- M1
According to equation 4.2, PM is a function of several variables, each of which is
associated with a particular uncertainty. Therefore, the uncertainty of the results (𝑢𝑃𝑀) can be
measured by the following differential equation:
𝑢𝑃𝑀 = ±[(𝜕𝑃𝑀
𝜕∆𝑚𝑢∆𝑚)
2
+ (𝜕𝑃𝑀
𝜕�̇�𝑢�̇�)
2
+ (𝜕𝑃𝑀
𝜕∆𝑡𝑢∆𝑡)
2
+ (𝜕𝑃𝑀
𝜕𝑟𝑢𝑟)2]
1
2 (4.3)
Where 𝑢∆𝑚, 𝑢�̇�, 𝑢∆𝑡, and 𝑢𝑟 are the uncertainties associated with filter weight difference, mass
flow rate of fuel, sampling time, and the ratio of �̇�𝑠𝑎𝑚𝑝𝑙𝑒𝑑 /�̇�𝑡𝑜𝑡𝑎𝑙 , respectively. Considering the
experimental errors, these uncertainty levels are calculated and listed in Table 4.4 [67]:
Table 4.4. Uncertainty levels associated with PM measurements
Variable Uncertainty (𝒖)
∆𝑚 0.184 mg
�̇� 1.6 % of total flow
∆𝑡 0.7 sec
𝑟 0.4 %

CHAPTER 4. EXPERIMENTAL METHODOLOGY 39
4.7 Heat Exchanger Analysis
The total energy input of the burner is derived from the energy of fuel, pilot flame, and air heater.
The output energy is the sum of the heat extracted from burner (�̇�𝑒𝑥𝑡𝑟) and the amount of heat loss.
Following equations show the energy balance of the system:
�̇�𝑖𝑛 = �̇�𝑜𝑢𝑡 (4.4)
�̇�𝑓𝑢𝑒𝑙 + �̇�𝑝𝑖𝑙𝑜𝑡 + �̇�ℎ𝑒𝑎𝑡𝑒𝑟 = �̇�𝑒𝑥𝑡𝑟 + �̇�𝑙𝑜𝑠𝑠 (4.5)
The heat extracted from the burner includes heat released from the exhaust gases (�̇�𝑔𝑎𝑠)
and also heat released from condensation of water vapor (�̇�𝑐𝑜𝑛𝑑) within the exhaust gases. This
energy is extracted by a water-cooled heat exchanger (supplied by Polar Power Inc.), which uses
cold tap water at a temperature of around 7 to 14°C to extract the energy and cool down burner
exhaust gases. The energy extracted by the heat exchanger results in a change in enthalpy of the
cooling water. Therefore, flow rate of the cooling water as well as temperature difference of water
entering and exiting the unit are measured in order to calculate the heat extracted from the burner,
which is shown in the following equation:
�̇�𝑒𝑥𝑡𝑟 = �̇�𝑔𝑎𝑠 + �̇�𝑐𝑜𝑛𝑑 = �̇�𝑤 . Δℎ𝑤 = �̇�𝑤𝐶𝑝Δ𝑇𝑤 (4.6)
Here, �̇�𝑤 is the mass flow rate of cooling water and Δℎ𝑤 is the change in enthalpy of water.
4.8 Burner Test Procedure
Around 1 to 2 hours before each test, all the sample lines are warmed up and the FID is turned on.
Room air is drawn into the burner by the stack fan, the atomizing air flows into the nozzle, the
pilot flame is turned on, and the cooling water for the heat exchanger is also turned on. First, the
burner is warmed up with ethanol (EtOH) for about 30 minutes. Then, the fuel line is switched to
bio-oil at the desired flowrate, which is calculated based on the heating value of the fuel and the
energy input of the burner (10 kW). After reaching a steady state condition, all the measurements
take place. Here, steady state condition is a condition under which the exhaust temperature gradient
is close to zero (below 2°C/min). At the end of each test, the burner is flushed with EtOH to clean

CHAPTER 4. EXPERIMENTAL METHODOLOGY 40
the lines. A detailed instruction for operating the burner is prepared and can be found in Appendix
B.
When using pure bio-oil as the fuel, it is difficult to stabilize the fuel flowrate and
subsequently, the energy input of the burner. The reason is that if bio-oil is not mixed with ethanol,
it separates much easier than a blend of bio-oil/EtOH. The addition of polar solvents such as
ethanol slows down the phase separation process and helps homogenizing pyrolysis liquid biofuels
[68]. The bio-oil of batch 1 could not stay homogenized for the duration of each test and the
viscosity of the fuel being pumped differs at different time points during the test. It becomes
increasingly viscous over time due to phase separation. The peristaltic pumps that are used to
deliver the fuel to the nozzle are extremely sensitive to viscosity, meaning that at a fixed RPM,
fuel flowrate decreases as viscosity increases. Therefore, an electric stirrer (model 1750, provided
by Arrow Engineering Co. Inc.) is used to continuously stir the fuel in a beaker while it is pumped
to the system in order to homogenize the fuel and keep the flowrate constant.
4.9 The Facility Maintenance Guide
Cleaning and maintenance after each individual test take a significant amount of time and effort.
Bio-oil is corrosive and viscous, and it can corrode and clog the fuel nozzle if it stays in the fuel
line for a while. Therefore, burner is flushed with ethanol after each test and once the burner is
cooled down, the combustor door is opened, the nozzle is moved down the burner throat, and the
nozzle cap is removed and cleaned with water and acetone. Furthermore, bio-oil has ash content
and therefore, a significant amount of ash is deposited inside the combustor after burning bio-oil.
The viewports also get covered by ash after each test due to the existence of swirling flows inside
the burner. The sample lines are purged by passing compressed air through them every couple of
tests to make sure they are clean and ready for the future measurements.
One of the products of combustion is water and the fuel also contains water content, making
it necessary to remove water from the water traps and the vacuum pumps to avoid causing damage
to the pumps. It is important to preserve the burner, the sample lines, and all the instruments in
order to obtain reliable results and avoid time-consuming repairs. The maintenance procedures are
summarized below:

CHAPTER 4. EXPERIMENTAL METHODOLOGY 41
1. Calibration of all the flow meters and rotameters by a digital Definer 220H (Bios
International Co.) prior to the beginning of the experiments,
2. Cleaning of the nozzle with water and acetone after each test,
3. Cleaning of the viewports and the combustion chamber after each test,
4. Cleaning of the sample lines by passing compressed air through the lines (every couple of
tests),
5. Removing water from the water traps and the vacuum pumps after each test,
6. Cleaning of the media bottles and utensils after each test,
7. Changing of the filter element for the heated filter every few tests (if necessary),
8. Changing or repairing the sealants of the combustor door (if necessary),
9. Changing or repairing the electric igniter wire (if necessary).

42
C h a pt e r 5
Results and Discussion
5.1 Research Plan
The previous burner lacked refractory linings and it had a small combustion chamber, causing
some of the fuel droplets to hit the walls before they can burn. Therefore, the amount of heat loss
was significant and pollutant emissions were relatively high. Furthermore, it was not possible to
stabilize flames of pure bio-oil and ethanol was added to the fuel to get a stable flame. Using the
upgraded setup, combustion of pure bio-oil was studied to investigate the effects of burner design
on combustion characteristics of bio-oil.
The first step after analyzing fuel properties was to find an optimized burner configuration
to get stable flames of bio-oil. After achieving stable flames, two common problems associated
with bio-oil flames, namely, flash-atomization instabilities and nozzle coking, were studied. Four
different nozzle designs were used alternatively to address the coking problem and to find the best
design for pure bio-oil combustion. After finalizing the nozzle design, pollutant emissions were
measured at a base operating condition. In the final step, a parametric study was conducted to
determine the relationship between the operating condition and pollutant emissions of bio-oil.
Furthermore, the total energy extracted from the burner exhaust was measured and compared to
the results related to the previous burner.
5.2 Fuel Analysis
Before starting the experiments, bio-oil should be analyzed to determine its properties. Table 5.1
summarizes the properties of three bio-oil batches used in this study with their typical ranges

CHAPTER 5. RESULTS AND DISCUSSION 43
suggested in the literature. The bio-oils used in this study are all made of waste white-wood rather
than bark and branches, and for that reason, they contain very low amount of fuel bound nitrogen
that could not be measured in the elemental analysis of fuels (N < 0.01 wt %).
Table 5.1. Properties of bio-oil [69, 32, 70, 30, 48]
Parameter Unit Bio-oil
batch 1
Bio-oil
batch 2
Bio-oil
batch 3 Literature
C-H-O-N wt % 43.68-6.75-
49.57-0.00
45.80-7.38-
46.82-0.00
45.62-7.30-
47.08-0.00 55-6-38-0.15
Water wt % 23.36 22.7 21.8 15 to 30
Solids wt % 0.21 0.14 0.07 0.2 to 1
Ash wt % 0.12 0.13 0.09 0 to 0.3
Density (20°C) kg/m3 1180 1125 1171 1100 to 1300
Gross Heat of Combustion
(HHV) MJ/kg 17.99 18.31 18.42 16 to 23
LHV MJ/kg 16.56 16.74 16.87 15.6 to 21.6
Kinematic Viscosity (40°C) cSt 42.2 N/A 35.4 10 to 100
The gross heat of combustion (HHV) was directly measured for batch 2; however, it was
not possible to determine the HHV of batch 1 using the calorimeter. Hence, different mixtures of
ethanol and bio-oil were used to estimate its HHV. This method is explained in details in Appendix
D. The HHV of batch 3 was calculated by equation 5.1, which has the same accuracy as direct
measurements with the calorimeter. This had to be done due to unavailability of the calorimeter at
the time. The following equation is suggested by Demirbas et al. [71] for wood-derived biofuels
such as bio-oil.
HHV = (33.5 × [𝐶] + 142.3 × [𝐻] − 15.4 × [𝑂] − 14.5 × [𝑁]) (𝑀𝐽
𝑘𝑔) (5.1)
Here, [𝐶], [𝐻], [𝑂], and [𝑁] are concentrations of carbon, hydrogen, oxygen and nitrogen in the
fuel. This correlation was previously used to calculate HHVs for 11 similar bio-oil batches from
the same producer [67]. The comparison between the calculated HHVs and the measured values
for those 11 bio-oil batches indicated an average error of 2.5 % with a standard deviation of 1.38
%, which confirms the reliability of this equation.

CHAPTER 5. RESULTS AND DISCUSSION 44
The viscosity and LHV of bio-oil are compared to those of ethanol in Table 5.2. As it is
shown, bio-oil has a lower LHV and a higher viscosity than ethanol. Therefore, ethanol addition
to bio-oil can increase the heating value of the fuel and also decrease its viscosity, which are
important for fuel atomization and ignition quality. Mixing bio-oil with ethanol significantly
improves ignition characteristics of fuel and flame stability. Therefore, bio-oil/EtOH blends were
used at the beginning of the experiments to address instability problems of the flames and modify
the burner configuration in order to get stable flames.
Table 5.2. Comparison of bio-oil properties and ethanol
Fuel LHV
(MJ/L)
Viscosity at
40°C (cSt)
Bio-oil (batch 1) 16.56 42.2
Ethanol 26.89 0.794
As discussed earlier in section 2.4, preheating bio-oil reduces its viscosity and enhances
atomization and ignition qualities. Therefore, an air heater is used to preheat the primary air and
hence, preheat bio-oil inside the fuel nozzle prior to injection. Viscosity of batch 3 was measured
at different temperatures and plotted in Figure 5.1, indicating that viscosity is inversely
proportional to temperature.
Figure 5.1. Viscosity of bio-oil batch 3 vs temperature
0
20
40
60
80
100
120
0 20 40 60 80 100
Vis
cosi
ty (
cS
t)
Temperature (ºC)
Viscosity of batch 3

CHAPTER 5. RESULTS AND DISCUSSION 45
Each fuel batch contains about 40 liters of bio-oil. Batch 1 was used to address initial flame
instabilities within the new burner and find the best burner configuration in order to get stable
flames of pure bio-oil. Batch 2 was used to address flash-atomization instabilities, nozzle fuel
coking, sensitivity analysis of primary air flow rate and swirl number, and the heat exchanger
analysis. Finally, batch 3 was used to study gas phase emissions during transient base point
operation, to complete the parametric sensitivity analysis (for atomizing air flow rate, pilot flame
energy, primary air and fuel preheat temperature), and to study particulate matter emissions.
5.3 Flame Stability
Flame stability is important to be able to study bio-oil combustion. Flame instabilities cause
significant smoke and soot formation as well as substantial fluctuations in the air streams inside
the burner, making its operation almost impossible. At the beginning of the experiments, there
were some difficulties with flame stability, especially with higher bio-oil content in the fuel.
Despite achieving stable flames of 50/50 bio-oil/EtOH (by vol.) and 60/40 bio-oil/EtOH in the
original burner configuration (Figure 5.2), the flame of 80/20 bio-oil/EtOH was unstable. Low
degree of primary air swirl was the likely source of flame instabilities. Therefore, four different
approaches were used to address the instabilities and to find the best burner configuration.
Figure 5.2. Schematic of the original burner configuration and the swirl outlet pipe
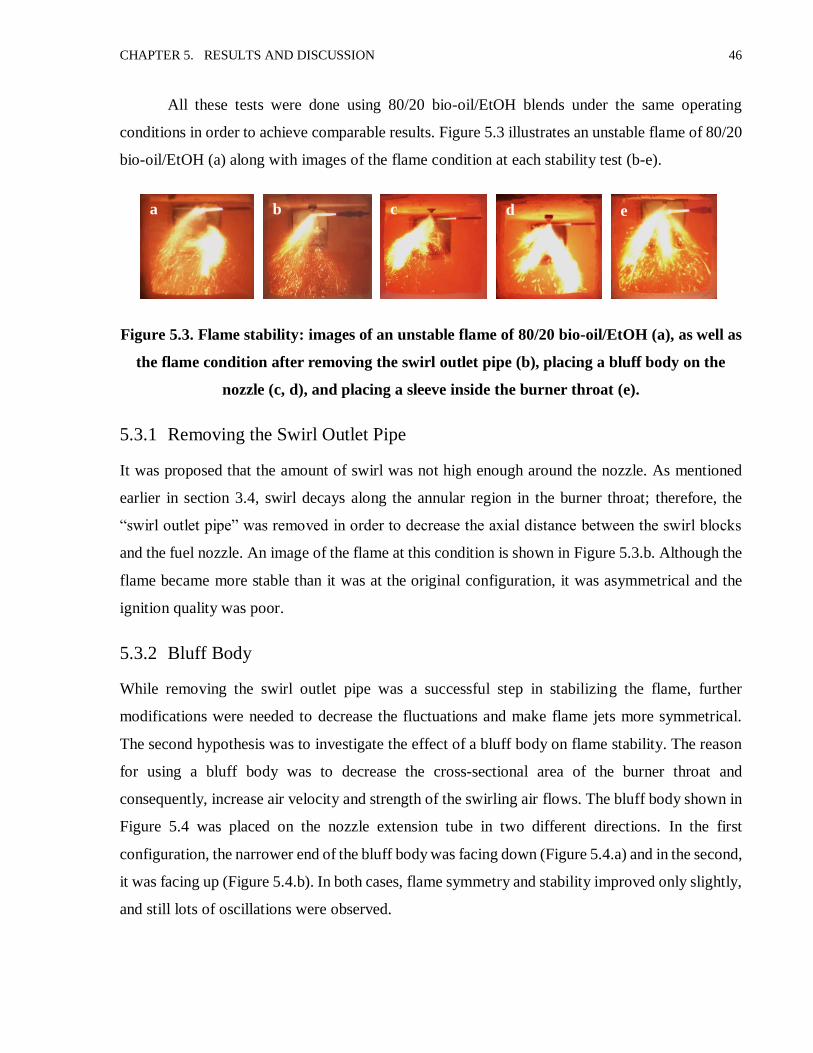
CHAPTER 5. RESULTS AND DISCUSSION 46
All these tests were done using 80/20 bio-oil/EtOH blends under the same operating
conditions in order to achieve comparable results. Figure 5.3 illustrates an unstable flame of 80/20
bio-oil/EtOH (a) along with images of the flame condition at each stability test (b-e).
Figure 5.3. Flame stability: images of an unstable flame of 80/20 bio-oil/EtOH (a), as well as
the flame condition after removing the swirl outlet pipe (b), placing a bluff body on the
nozzle (c, d), and placing a sleeve inside the burner throat (e).
5.3.1 Removing the Swirl Outlet Pipe
It was proposed that the amount of swirl was not high enough around the nozzle. As mentioned
earlier in section 3.4, swirl decays along the annular region in the burner throat; therefore, the
“swirl outlet pipe” was removed in order to decrease the axial distance between the swirl blocks
and the fuel nozzle. An image of the flame at this condition is shown in Figure 5.3.b. Although the
flame became more stable than it was at the original configuration, it was asymmetrical and the
ignition quality was poor.
5.3.2 Bluff Body
While removing the swirl outlet pipe was a successful step in stabilizing the flame, further
modifications were needed to decrease the fluctuations and make flame jets more symmetrical.
The second hypothesis was to investigate the effect of a bluff body on flame stability. The reason
for using a bluff body was to decrease the cross-sectional area of the burner throat and
consequently, increase air velocity and strength of the swirling air flows. The bluff body shown in
Figure 5.4 was placed on the nozzle extension tube in two different directions. In the first
configuration, the narrower end of the bluff body was facing down (Figure 5.4.a) and in the second,
it was facing up (Figure 5.4.b). In both cases, flame symmetry and stability improved only slightly,
and still lots of oscillations were observed.
a b c d e

CHAPTER 5. RESULTS AND DISCUSSION 47
(a) (b)
Figure 5.4. Schematic of the bluff body placed on the nozzle in two different directions
(sectional view of the burner throat)
5.3.3 Placing a Sleeve Inside the Burner Throat
As shown in Figure 5.5 and Figure 5.6, a duct reducer was installed inside the burner throat in
order to reduce its the cross-sectional area. The difference between this approach and the previous
one - bluff body - is that by using a sleeve, the burner throat is shrunk from the outside, but a bluff
body shrinks the throat by increasing the area around the nozzle. The sleeve also creates a circular
area inside the burner throat which was not perfectly circular previously due to the insulation
linings inside the throat. As the result, the air flow around the nozzle and hence, the flame jets
became more symmetrical than before (Figure 5.3.e).
Figure 5.5. The sleeve in the sectional
view of the burner throat
Figure 5.6. The sleeve inside the burner
throat (view from the top of the swirl box)
After studying different configurations, it was found that removing the swirl outlet pipe
and placing a sleeve inside the burner throat work best for flame stability and the symmetry of the
fuel jets.

CHAPTER 5. RESULTS AND DISCUSSION 48
5.4 Burning Pure Bio-Oil
With the previous burner, it was necessary to mix bio-oil with at least 20 % ethanol (by volume)
in order to get stable flames. Although the previous burner was capable to operate at 90/10 bio-
oil/ethanol and pure bio-oil, flame stability was poor, the flame was subjected to blow-out, and
UHC emissions exceeded 150 ppm at these concentrations [4]. However, the new combustion
chamber has made it possible to burn pure bio-oil because of the stronger recirculation zones
around the nozzle and higher temperatures within the burner as compared to the previous one.
Different flames of bio-oil/EtOH blends are compared in Figure 5.7. As explained in section 2.3,
bio-oil flame has a char burning characteristic, which is most evident in the flame of pure bio-oil
(d).
(a) Pure Ethanol (b) 80/20 bio-oil/EtOH (c) 90/10 bio-oil/EtOH (d) Pure Bio-oil
Figure 5.7. Flame images of pure ethanol, 80/20 bio-oil/EtOH, 90/10 bio-oil/EtOH, and pure
bio-oil
5.5 Fuel Boiling in Nozzle
After achieving stable flames of bio-oil, the burner temperature continues to go up until it reaches
close to a steady state condition. However, the fuel temperature also increases and after a few
minutes only, it starts to boil inside the nozzle cap, causing flash atomization. Although increasing
the fuel temperature reduces viscosity and significantly improves atomization and ignition
qualities, a temperature higher than the boiling point of fuel can cause severe instabilities and cause
the flame to blow out, as explained in section 3.6.2. Figure 5.8 illustrates this phenomenon by
showing images of a flashing bio-oil flame with a time interval of 0.1 s between images. Hence, it
is important to control fuel temperature inside the nozzle and cool down the fuel line when its
temperature starts going above 70-80°C. The cooling system which is described in section 3.6.2 is
the only means to cool down fuel in the fuel line. Although it can decrease the fuel temperature in

CHAPTER 5. RESULTS AND DISCUSSION 49
the nozzle extension tube, it was found that this cooling system cannot prevent fuel from boiling
inside the nozzle cap. This problem was first addressed by changing operating parameters such as
atomizing air flow rate, swirl number, primary air preheat temperature, pilot flame energy and
positioning, primary air flow rate, and fuel flow rate, as explained in the following section.
Figure 5.8. Flash-atomization instabilities: from (a) to (l), images of the flame with a time
interval of 0.1s between images.
5.5.1 Operating Condition Adjustments
Atomizing Air Flow Rate
If the flame slightly lifts off the nozzle, it could prevent hot gases from heating the nozzle cap.
This can be simply done by increasing the atomizing air flow rate. However, there is a limited
range for the atomizing air flow rate when using pure bio-oil. In general, the range of the atomizing
air flow rate in which the flame is still stable is narrower for a less volatile fuel such as PLB [72].
Originally, nozzle no.1 was used in this study (nozzle schematic and specifications can be found
in Figure 3.7 and Table 3.2, respectively). For this nozzle, the range of the atomizing air flow rate
a b c d
e
i j k l
f g h

CHAPTER 5. RESULTS AND DISCUSSION 50
includes a minimum flow rate of 7 SLPM, below which bio-oil is not atomized properly and starts
to dribble out of the nozzle, and a maximum flow rate of 15.5 SLPM, above which the flame jets
become detached and the flame eventually blows out. The recirculation zones are very strong
around the nozzle and the flame is well seated on the nozzle cap within the aforementioned
atomizing air flow rates; therefore, the atomizing air could not solve the fuel boiling problem.
Swirl Number
The strong recirculation zones and the high degree of the swirling flow around the nozzle heat up
the nozzle cap and hence, increase the fuel temperature inside the nozzle. Therefore, in the next
step, the swirl number was decreased to weaken the recirculation zones. The swirl number is
changed by rotating the movable blocks and decreasing the swirl block angle (𝜉). It was found that
the swirl block angle can decrease only down to 80 % of the maximum block angle (𝜉𝑚) and
further reduction in the swirl degree extinguishes the flame. The swirl number corresponds to this
degree of swirl (𝜉 𝜉𝑚⁄ = 0.8) is calculated by equation 3.4 and equals 𝑆 = 3.38. However, this
method also failed to resolve the boiling problem and the parameter studies continued.
Primary Air Preheat Temperature
Another approach was to turn off the air heater which preheats the primary air and fuel. Even
though the burner is warmed up by ethanol before switching to bio-oil, it was found that bio-oil
could not ignite while the air heater is off. Therefore, in order to investigate the effect of air preheat
temperature on flash atomization, the air heater was first turned on before switching to bio-oil and
once the bio-oil flame got stable, it was turned off to decrease the primary air temperature.
Although this method managed to delay boiling of the fuel, it could not prevent it.
Other Parameters
Some other operating parameters were also altered to further address flash-atomization
instabilities. Decreasing the pilot flame energy from 0.3 kW to 0.2 kW and moving it farther away
from the nozzle, moving the nozzle further up inside the burner throat, increasing the primary air
flow rate, and increasing the fuel energy input from 10 kW up to 13 kW were the other changes
that were made to address this problem. Unfortunately, none of the aforementioned alterations
worked to enhance the operation.

CHAPTER 5. RESULTS AND DISCUSSION 51
5.5.2 Insulating the Nozzle
Altering the operating parameters revealed that these techniques were not completely useful and
another method should be employed to resolve the boiling problem. Therefore, a ceramic
insulation sheet was wrapped around the nozzle cap to insulate it against intense heat, as shown in
Figure 5.9. It is a 1/4" thick flexible insulation sheet that can withstand ultra-high temperature
conditions, up to 1100°C. With this technique, the boiling problem is solved and the nozzle cooling
system (Figure 3.8) is then used effectively to control the fuel temperature.
Figure 5.9. Nozzle insulation (the nozzle was moved down the throat to take this picture)
5.6 Nozzle Fuel Coking and Clogging
After achieving stable bio-oil flames in the burner, it was found that a large amount of
carbonaceous material, also known as coke, starts to build up on the nozzle cap (nozzle no.1)
during the test period. A trend was found for this phenomenon: when the exhaust temperature
(measured by the exhaust thermocouple shown in Figure 4.3) exceeds 400°C, coke formation on
the external surface of the nozzle is observed. The reason is that bio-oil has a great coking tendency
and is polymerized at high temperatures, resulting in nozzle coking and clogging [35, 37, 54].
Figure 5.10 depicts the external surface of the nozzle cap (nozzle no.1) after a typical burner test.
As explained in section 4.8, the burner is flushed with ethanol after each test and some of the coke
residues are eventually burned off by the flame before shut-down. Therefore, the fuel coking

CHAPTER 5. RESULTS AND DISCUSSION 52
observed in this figure is in fact the remaining of the original coke formed during bio-oil
combustion.
Figure 5.10. Carbonaceous material (coke) formed on the external surface of nozzle no.1
Bio-oil can get polymerized either inside the nozzle and clog the fuel line, or on the external
surface of the nozzle cap and form large carbonaceous residues, resulting in poor atomization and
high UHC emissions. Considering the orifice size of liquid and air caps of nozzle no.1, this nozzle
did not get clogged from inside in any of the tests. However, large amount of coking was observed
on the nozzle cap during all of the tests, after almost 30 minutes of running on bio-oil. The bio-oil
spraying out of the nozzle can get polymerized immediately on the hot external surface of the
nozzle cap before it evaporates and burns out. Similar to the previous section, several techniques
were employed to decrease the degree of coking on the nozzle surface.
5.6.1 Operating Condition Adjustments
Atomizing Air Flow Rate
One method for diminishing the coking behavior of the fuel nozzle is to decrease the droplet size,
because smaller droplets require a shorter residence time and they can burn out faster [72].
According to equation 3.5, the droplet size of an atomized liquid depends on various parameters,
including the atomizing air flow rate. Low atomizing air flow rates result in large droplet size, poor
ignition qualities, and more coking tendency. Therefore, a high atomizing air flow rate is desirable
to enhance ignition and reduce the formation of carbonaceous material on the nozzle surface.
However, as discussed in the previous section, the atomizing air flow rate cannot exceed a certain

CHAPTER 5. RESULTS AND DISCUSSION 53
range because the flame will blow out. Considering this limitation, the coking tendency only
slightly improved for nozzle no.1, and it was not possible to control the coking problem when the
burner exhaust temperature exceeded 400°C.
Swirl Number
The extremely hot surface of the nozzle is one of the major reasons for the fuel to form coke, and
this is mainly because of hot recirculation zones around the nozzle. One way to control the coking
tendency of nozzle is to decrease the swirl number; however, as it is mentioned in the previous
section, the swirl block angle can only decrease down to 80 % of the maximum block angle in
order to get stable flames. It was found that a reduction in the swirl number slightly decreases the
coking tendency of nozzle and hence, the swirl number was kept at 𝑆 = 3.38 for the remainder of
the experiments. However, this reduction in coke formation was not sufficient, and it was not
feasible to run the burner for more than one hour without having major coking problems.
Nozzle Position
Another way to keep the nozzle cap away from this intense heat is to move the nozzle further up
into the burner throat, so it is no longer located at the center of the recirculation zones. However,
the nozzle should be kept relatively close to the pilot flame in order to get ignition and therefore,
it was only moved ½ inch higher inside the burner throat. Although this method decreased the
amount of coke for the flames of 80/20 bio-oil/EtOH and 90/10 bio-oil/EtOH, it was not fully
effective for pure bio-oil.
5.6.2 Nozzle Design
Testing different operating conditions revealed that the current nozzle had a high coking tendency.
Consequently, in the next step, different nozzle designs were studied to address this problem. The
orifice size of the atomizing nozzle is one of the parameters that has a direct impact on the droplet
size and SMD value. Therefore, three smaller nozzles were used to study the coking tendency of
nozzles, with nozzle no.2 being the smallest. The schematic of air-blast atomizing nozzles and the
dimensions of their discharge orifices can be found in Figure 3.7 and Table 3.2, respectively.

CHAPTER 5. RESULTS AND DISCUSSION 54
Nozzle no.2
Nozzle no.2, which uses the smallest liquid cap and air cap, was the first nozzle to replace nozzle
no.1. Using this nozzle, there was no coke formation on the external surface of the nozzle cap.
Smaller orifices of nozzle no.2 account for smaller droplet size, improved ignition qualities, and
less coking tendencies. Moreover, based on empirical evidence, the geometry of the air cap also
plays a role in this outcome. As illustrated in Figure 5.11, the spacing between the six discharge
orifices on the air cap of nozzle no.2 is much smaller than that of nozzle no.1. Therefore, there is
not enough space for carbonaceous material to accumulate between the holes, and they are pushed
away and burned off by the jets discharging to the burner.
Figure 5.11. Image of nozzle no.2 and nozzle no.1
Although the coking problem on the external surface of the nozzle seemed to be solved,
the nozzle clogged from inside the nozzle cap after 40 minutes of running on bio-oil and terminated
the test. The reason is that the nozzle cap has extremely small orifices, which significantly
increases the chance of clogging due to fuel polymerization inside the cap where fuel is not yet
atomized. The discharge orifice of nozzle no.1, on the other hand, is large enough to avoid
clogging. Consequently, it was decided to design new nozzles with orifice sizes bigger than nozzle
no.2 and smaller than nozzle no.1.
Nozzle no.3 & no.4
Two additional nozzles were designed and machined to continue searching for the best nozzle
design for an optimum burner operation. Using custom-machined nozzles for bio-oil combustion

CHAPTER 5. RESULTS AND DISCUSSION 55
is also suggested in literature [54, 55]. Considering the clogging problem observed in nozzle no.2,
both nozzle no.3 and nozzle no.4 use the same liquid cap as nozzle no.1 (JL40100) and also have
the similar air cap design to nozzle no.1 (JPG60), but with different discharge orifice diameters on
the air caps. Each of these two nozzles were tested in the burner three times in order to reach a
reasonable conclusion and find the best design. These tests revealed that none of the nozzles get
clogged from inside, and nozzle no.3 was found to have less coking tendency than nozzle no.4
does. Therefore, nozzle no.3 was chosen as the ultimate nozzle design to pursue the experimental
studies.
5.7 Comparative Visualization of Flame
Nozzle studies revealed that flame length and luminosity vary by changing the nozzle design.
Figure 5.12 illustrates the differences observed in flames of bio-oil when changing the nozzle and
hence, the SMD of bio-oil spray. All these tests were done under the same operating conditions
and nozzle cap was the only parameter that was changed; therefore, the results are comparable. As
it is depicted, when the droplet size decreases, the flame becomes shorter and whiter in color. The
dark-yellow color of flame is in fact the black-body radiation of unburned particles, which are
mostly soot particles, at hot regions of the flame. Soot particles are byproducts of incomplete
combustion and emit radiation in dark yellow when heated to high temperatures. Smaller droplets
have shorter residence times and undergo a faster and more thorough burnout, resulting in shorter
flame lengths with less tendency to soot.
(a) Nozzle no.1 (b) Nozzle no.2 (c) Nozzle no.3 (d) Nozzle no.4
Figure 5.12. Images of flame for different nozzle designs
Nozzle no.2 has a different design from the other atomizing nozzles, creating a different
spray pattern and flame geometry (Figure 5.12.b). It also has the smallest discharge orifices, which
is responsible for the flame being shorter and also whiter due to its lower soot tendency. Flames

CHAPTER 5. RESULTS AND DISCUSSION 56
of the other three nozzles (a, c, d) have similar patterns, because they use the same liquid cap and
similar air cap designs with only different orifice sizes. Nozzle no.1 has the largest discharge
orifices and is expected to have a higher tendency to soot than the other nozzles do, which is
responsible for its dark-yellow flame (a).
Furthermore, the bright streaks in the images are indicative of char particles burning in the
second stage of bio-oil droplet combustion [53, 73]. These char particles are formed from
polymerization of non-volatile content in the fuel spray; therefore, the extent of char burning
increases as SMD of bio-oil spray increases (Figure 5.12.a).
5.8 Gas Phase Emissions
5.8.1 Base Point Operation
The studies of flame instabilities and nozzle coking indicate that the bio-oil burner should operate
under a narrow range of conditions in order to get stable flames and avoid major coke formation
on the nozzle surface. Based on a great number of tests done using the new facility, a base operating
condition for each fuel batch is determined, under which the exhaust pollutant emissions are
minimal and flame is stable. Table 5.3 summarizes the operating parameters as well as their values
at the base point condition for bio-oil batch 2 and batch 3.
Table 5.3. Base point operating condition
Parameter Batch 2 Batch 3
Power input from bio-oil 10 kW 10 kW
Pilot flame power input 0.3 kW 0.3 kW
Swirl number 3.38 3.38
Atomizing air flow rate 8 SLPM 14.4 SLPM
Primary air preheat temperature 165°C 165°C
Primary air flow rate 294 SLPM 280 SLPM
Equivalence ratio 0.57 0.58
During each test and after warming up the burner by ethanol combustion, the burner is run
on bio-oil at the base point operating condition for 30 minutes and once the exhaust flange
temperature reaches above 450°C, gaseous emissions are measured to confirm the base point
repeatability. Table 5.4 shows CO, NOx, and UHC emissions for both batches at their respective

CHAPTER 5. RESULTS AND DISCUSSION 57
base point conditions. CO and UHC are both below their respective detection limits (10 ppm and
3 ppm, respectively) at the base point condition. Preliminary measurements for batch 1 have also
shown similar results.
Table 5.4. Base point emissions and repeatability
Emission* Batch 2
Average (ppm)
Batch 2
Std dev1 (ppm)
Batch 3
Average (ppm)
Batch 3
Std dev (ppm)
CO < 10 - < 10 -
NOx 106 4.65 124 6.33
UHC < 3 - < 3 -
*At 330 SLPM exhaust flowrate
Subsequently, operating parameters are changed and emissions are measured at a new
parametric condition to investigate the relationship between the operating condition and exhaust
emissions of bio-oil.
5.8.2 Transient Base Point Operation
At the beginning of each test, the burner is warmed up by ethanol combustion for about 25 to 30
minutes, and then the fuel is switched to bio-oil. Figure 5.13 shows the exhaust flange, primary
air, and fuel temperatures during transient warm-up stage and bio-oil combustion at the base point
operating condition. The air heater is turned on before starting ethanol to preheat the primary air,
warm up the nozzle, and enhance fuel ignition when burner is still cold. When the fuel is switching
from ethanol to bio-oil, minor instabilities occur in the flame for few seconds and the atomizing
air is adjusted to maintain a stable combustion. Hence, the fuel temperature drops for few minutes
at the time of switching until the heat coming from the bio-oil flame increases and stabilizes this
temperature again. The temperatures become relatively steady after about 60 minutes, as shown in
the figure.
1 Standard deviation

CHAPTER 5. RESULTS AND DISCUSSION 58
Figure 5.13. Burner temperatures during transient base point operation
Figure 5.14 depicts CO emissions during the same transient combustion described above.
Right after the beginning of ethanol combustion, large CO levels are observed. However, these
emissions start to decrease until a minimum value of about 110 ppm at the 16-minute mark is
reached. This is because the burner temperatures are increased and the flame becomes more stable.
After switching the fuel to bio-oil, CO levels increase initially due to changes in flame dynamics
and combustion characteristics, and then reduce gradually until they reach the base point value,
which is below the detection limit of the FTIR (below 10 ppm). Therefore, the burner temperature
and flame stability play important roles in CO emissions, and these emissions are minimized after
the combustion becomes steady.
0
50
100
150
200
250
300
350
400
450
500
0 20 40 60 80
Tem
pera
ture (
°C)
Time (min)
Ethanol Bio-oil (transient)
Steady combustionFuel switchNo combustion
Bio-oil
(steady)
Fuel
Primary Air
Exhaust Flange

CHAPTER 5. RESULTS AND DISCUSSION 59
Figure 5.14. CO emissions during transient base point operation
NOx emissions were also measured during the same transient combustion and are shown
in Figure 5.15. NOx emissions are dominated by thermal NOx formation during ethanol combustion
and they gradually rise as the burner temperature goes up. After the fuel is switched to bio-oil, an
abrupt rise in NOx levels is observed. However, these emissions remain relatively stable during
bio-oil combustion, indicating that NOx production is dominated by conversion of fuel-bound
nitrogen. Measuring NOx levels in the exhaust of ethanol combustion under the same operating
condition (same energy input) as bio-oil revealed that around 50 ppm of the total NOx is attributed
to thermal NOx production.
Figure 5.15. NOx emissions during transient base point operation
0
100
200
300
400
500
600
0 20 40 60 80
CO
(p
pm
)
Time (min)
Ethanol Bio-oil (transient)
Steady combustionFuel switchNo combustion
Bio-oil
(steady)
0
20
40
60
80
100
120
140
0 20 40 60 80
NO
x (
pp
m)
Time (min)
Ethanol Bio-oil (transient)
Steady combustionFuel switchNo combustion
Bio-oil
(steady)

CHAPTER 5. RESULTS AND DISCUSSION 60
5.8.3 Primary Air Flow Rate (Equivalence Ratio)
The equivalence ratio (Φ) is calculated from the oxygen concentration within the exhaust products,
which is measured by the oxygen sensor, and assuming complete combustion. In complete
combustion, fuel is completely oxidized and all the fuel-bound carbon is converted into carbon
dioxide. Table 5.5 shows the relationship between primary air flow rate, O2 % in exhaust, and
equivalence ratio for batch 1 at different operating points.
Table 5.5. Equivalence ratio of bio-oil combustion at different operating points
Primary air flow
rate (SLPM)
O2 vol. %
in exhaust
Corresponding
equivalence ratio
231 5.9 0.7
247 6.5 0.66
263 7.1 0.63
278 7.8 0.6
294 (base) 8.2 0.57
320 9.0 0.53
340 9.9 0.5
Figure 5.16 shows that CO emissions are below the detection limit of the FTIR (10 ppm)
at the base point condition, which corresponds to an equivalence ratio of 0.57. Increasing the
equivalence ratio above the base point results in an increase in CO emissions, which is due to a
reduction in oxygen availability for CO oxidation. Moreover, turbulence and mixing quality
reduces as the air flow rate decreases, resulting in incomplete combustion byproducts such as CO.
Figure 5.17 illustrates how the flame shape changes with equivalence ratio. Increasing the air flow
rate (reducing the equivalence ratio) results in an improved mixing quality and shorter flame
lengths. This is shown in Figure 5.17, where flame (c: Φ = 0.5) has the shortest flame length and
flame (a: Φ = 0.7) has the longest.

CHAPTER 5. RESULTS AND DISCUSSION 61
Figure 5.16. CO emissions vs equivalence ratio
When the equivalence ratio decreases below the base point, CO levels start to rise again.
In this case, the air flow rates are higher than the base point, promoting mixing and oxidation.
However, the observed increase in CO levels indicates that there is another parameter affecting the
emissions. Increasing the air flow rate above a certain point induces severe shear in the flame
region, which can cause localized quenching of the flame, resulting in CO emissions. Moreover,
flame temperature (as measured at the location shown in Figure 4.4) decreases when increasing
the air flow rate, as shown in Figure 5.18, which is another explanation for the observed increase
in CO emissions.
(a) 𝚽 = 𝟎. 𝟕 (b) 𝚽 = 𝟎. 𝟓𝟕 (base) (c) 𝚽 = 𝟎. 𝟓
Figure 5.17. Images of bio-oil flame vs equivalence ratio
0
50
100
150
200
250
0.45 0.50 0.55 0.60 0.65 0.70 0.75
CO
(p
pm
)
Equivalence ratio

CHAPTER 5. RESULTS AND DISCUSSION 62
Figure 5.18. Flame temperature vs equivalence ratio
In all the cases, UHC levels were below the detection limit of the FID (3 ppm), suggesting
that the burner has an excellent combustion efficiency due to high mixing quality and extremely
hot regions existing inside the combustion chamber.
As shown in Figure 5.19, NOx emissions remain relatively stable throughout the range of
equivalence ratio, suggesting that these emissions are most likely dominated by conversion of fuel-
bound nitrogen. However, total NOx levels observed in the exhaust of this batch of bio-oil is
relatively low due to low nitrogen content of the fuel (below 0.01 wt %). Decreasing the
equivalence ratio down to 0.57 slightly promotes NOx production due to an improved mixing
condition and high oxygen availability to convert fuel-bound nitrogen into NOx. However, similar
to the behavior observed for CO levels, further reduction in equivalence ratio results in lower flame
temperature and also localized quenching of the flame, decreasing the NOx emissions.
830
840
850
860
870
880
890
0.45 0.5 0.55 0.6 0.65 0.7
Fla
me t
em
pera
ture (
°C)
Equivalence ratio

CHAPTER 5. RESULTS AND DISCUSSION 63
Figure 5.19. NOx emissions vs equivalence ratio
5.8.4 Swirl Number
As mentioned in section 5.6, high degrees of swirl can result in major coke formation on the
external surface of the nozzle. Moreover, as displayed in Figure 5.20, the burner should use a swirl
number no less than 𝑆 = 3.38 in order to get stable flames and hence, the swirl number remained
constant at 3.38 for all the tests.
Figure 5.20. Flame stability vs swirl number for bio-oil
Figure 5.21 shows that CO levels are at a minimum at an equivalence ratio of 0.62 when
using the maximum swirl number (𝑆 = 5.41), whereas they become minimum at a reduced
equivalence ratio of 0.57 when using a lower swirl number (𝑆 = 3.38). The reason is that
turbulence and mixing quality decrease with decrease of the swirl number and in order to neutralize
this effect, higher air flow rates are needed to improve mixing and decrease CO emissions.
Moreover, the observed trends of CO emissions against equivalence ratio in both cases follow
similar pattern as explained in the previous section.
0
20
40
60
80
100
120
0.45 0.50 0.55 0.60 0.65 0.70 0.75
NO
x (
pp
m)
Equivalence ratio

CHAPTER 5. RESULTS AND DISCUSSION 64
Figure 5.21. The effect of swirl number on the trend of CO emissions vs equivalence ratio
5.8.5 Atomizing Air Flow Rate
The fuel is injected by an air-blast atomizing nozzle, which uses compressed air to atomize and
spray the fuel for ignition. The flow rate of atomizing air plays an important role in droplet size
and ignition quality of bio-oil, as mentioned in the previous sections. In order to find a base
operating condition, the atomizing air flow rate is increased up to the point at which the flame is
still anchored close to the nozzle cap. Figure 5.22 compares the flame condition at different
atomizing air flow rate. A further increase in the flow rate from the base point value lifts the flame
off the nozzle and cause instabilities (c), and if the flow rate increases even more, the flame
eventually blows out (d). Decreasing the flow rate below the base condition results in formation
of larger droplet size and increases sooting tendencies (a). It was found that below a flow rate of
2.3 SLPM, bio-oil was not atomized properly and fuel droplets started to dripple out of the nozzle
without getting ignited.
(a) 4.5 SLPM (b) 14.4 SLPM (base) (c) 20 SLPM (d) 21.6 SLPM
Figure 5.22. Images of bio-oil flame vs atomizing air flow rate
0
50
100
150
200
250
0.45 0.5 0.55 0.6 0.65 0.7 0.75
CO
(p
pm
)
Equivalence ratio
S=5.41S=3.38

CHAPTER 5. RESULTS AND DISCUSSION 65
In order to investigate the relationship between the atomizing air flow rate and gaseous
emissions of bio-oil, a dimensionless number is defined as below:
Dimensionless atomizing air flow (Α) =Atomizing air flow rate (SLPM)
Fuel flow rate (SLPM) (5.2)
In the above equation, fuel flow rate remains constant at 0.0305 SLPM which corresponds to 10
kW energy input from bio-oil, and only the atomizing air flow rate is changed in each case. Table
5.6 outlines values of “Α” at different operating points.
Table 5.6: Values of dimensionless atomizing air flow (Α) at different operating points
Atomizing air flow rate (SLPM) 𝚨
2.3 75.4
3 98.4
3.3 110
4.5 146
6.7 219
10 328
14.4 (base) 472
19 618.5
20 655
21.6 709.3
22.8 747.5
Figure 5.23 shows how CO levels in exhaust of bio-oil change with the atomizing air flow
rate. The Y axis is showing CO emissions and the X axis is showing the air flow rates. There is an
inverse relationship between CO and the atomizing air flow rate up to 20 SLPM (Α = 655) after
which there seems to be a positive relationship, that is related to the blowout. The SMD of the
droplets decreases by increasing the air flow rate and therefore, the droplets undergo a faster and
more thorough burnout, resulting in lower CO emissions. Increasing the flow rate above 14.4
SLPM (Α = 472), which corresponds to the base point condition, results in flame becoming
detached and getting anchored further downstream of the nozzle (Figure 5.22.c). Although this
causes some flame instabilities, no CO was detected. This is because the droplets are very small
in size and they eventually burn out in the hot regions of the combustor. However, a further rise in
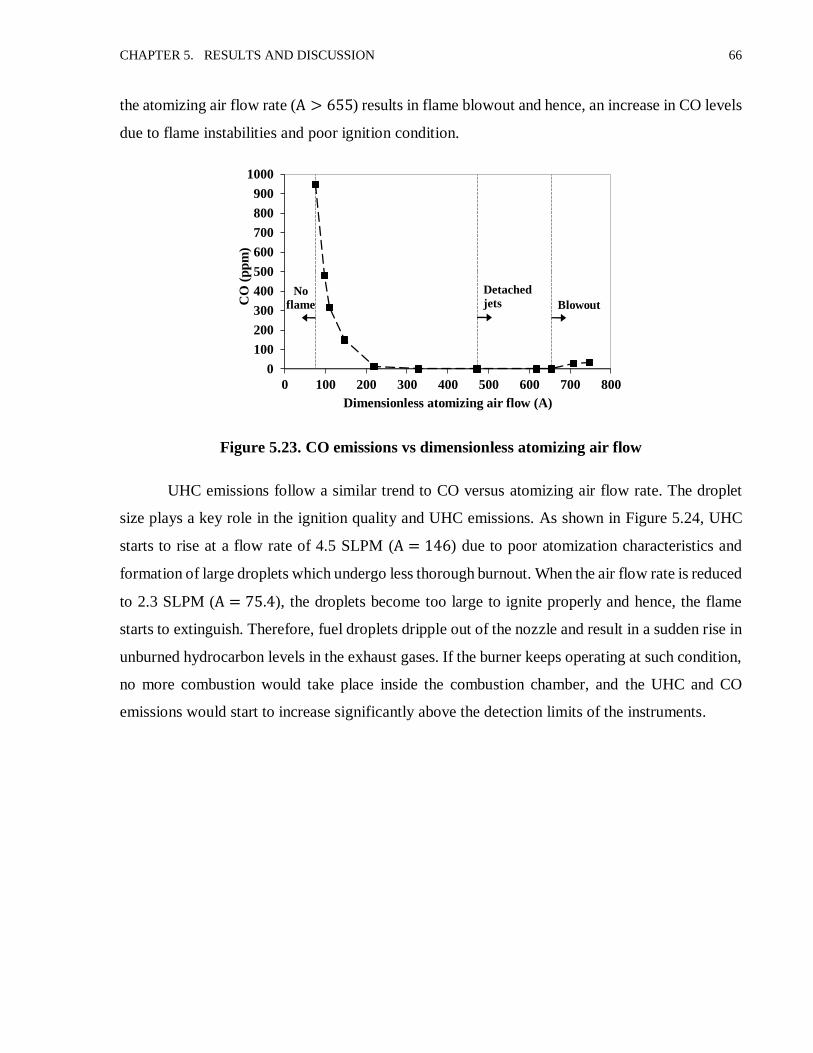
CHAPTER 5. RESULTS AND DISCUSSION 66
the atomizing air flow rate (Α > 655) results in flame blowout and hence, an increase in CO levels
due to flame instabilities and poor ignition condition.
Figure 5.23. CO emissions vs dimensionless atomizing air flow
UHC emissions follow a similar trend to CO versus atomizing air flow rate. The droplet
size plays a key role in the ignition quality and UHC emissions. As shown in Figure 5.24, UHC
starts to rise at a flow rate of 4.5 SLPM (Α = 146) due to poor atomization characteristics and
formation of large droplets which undergo less thorough burnout. When the air flow rate is reduced
to 2.3 SLPM (Α = 75.4), the droplets become too large to ignite properly and hence, the flame
starts to extinguish. Therefore, fuel droplets dripple out of the nozzle and result in a sudden rise in
unburned hydrocarbon levels in the exhaust gases. If the burner keeps operating at such condition,
no more combustion would take place inside the combustion chamber, and the UHC and CO
emissions would start to increase significantly above the detection limits of the instruments.
0
100
200
300
400
500
600
700
800
900
1000
0 100 200 300 400 500 600 700 800
CO
(p
pm
)
Dimensionless atomizing air flow (A)
Detached
jets Blowout
No
flame

CHAPTER 5. RESULTS AND DISCUSSION 67
Figure 5.24. UHC emissions vs dimensionless atomizing air flow
As opposed to the behavior observed in CO emissions at higher atomizing air flow rates,
UHC emissions remain below the detection limit even in complete blowout conditions. Under
these conditions, the fuel spray has a very small SMD and the volatile content of the fuel is
expected to evaporate rapidly and convert into CO rather than resulting in detectable UHC
emissions.
Figure 5.25 shows that there is an increase in NOx levels when increasing the atomizing air
flow rate from 2.3 SLPM (Α = 75.4) up to the base point condition, where the flame is still stable
and anchored close to the nozzle cap. The reason is more thorough burnout of the fuel droplets and
improved mixing qualities at higher air flow rates, which favors oxidation of fuel-bound nitrogen
into NOx emissions. However, the flame becomes lifted and gets anchored further downstream of
the nozzle or even blows out when the air flow rate increases above the base point. This slightly
deteriorates the ignition qualities and reduces NOx production, as shown in the plot. As explained
before, NOx emissions are mostly controlled by conversion of fuel-bound nitrogen and hence, they
remain relatively stable throughout most of the atomizing air flow range. The sudden rise in NOx
at 21.6 SLPM (Α = 709.3) is probably due to the fluctuations observed in the flame at this
condition, which can affect the measurements.
0
50
100
150
200
250
300
350
0 100 200 300 400 500 600 700 800
UH
C (
pp
m)
Dimensionless atomizing air flow (A)
Detached
jets Blowout
No
flame

CHAPTER 5. RESULTS AND DISCUSSION 68
Figure 5.25. NOx emissions vs dimensionless atomizing air flow
5.8.6 Pilot Flame Energy
A pilot flame energy of 0.3 kW is used at the base operating point to ignite and stabilize the bio-
oil flame. Figure 5.26 compares the flame condition at three different pilot energy inputs. After
reaching a steady combustion at the base point condition in the burner, five other pilot energy
conditions were tested to investigate the effects of pilot flame energy on flame stability and
pollutant emissions. The flame was found to be stable and anchored to the nozzle between 0.3 kW
to 0.15 kW energy input. However, it became less stable at an energy input of 0.1 kW (Figure
5.26.b) and completely unstable when the pilot was off (Figure 5.26.c). Flame (a) is more desirable
for the purpose of this study than flame (b) and flame (c), because it manifests greater stability and
is seated on the nozzle.
(a) 0.3 kW (base) (b) 0.1 kW (c) Pilot off
Figure 5.26. Images of bio-oil flame vs pilot flame energy
0
20
40
60
80
100
120
140
0 100 200 300 400 500 600 700 800
NO
x (
pp
m)
Dimensionless atomizing air flow (A)
Detached
jets Blowout
No
flame

CHAPTER 5. RESULTS AND DISCUSSION 69
The pilot flame provides a high temperature and stoichiometric CH4/O2 flame, which helps
bio-oil to ignite and get anchored close to the nozzle. For pilot energy inputs lower than 0.15 kW,
the bio-oil flame was not stabilized close to the nozzle and hence, it moved further downstream
and burned in hot regions of the combustor. In terms of CO and UHC emissions, no emission was
detected in all the cases, even when the pilot flame was turned off for about 30 minutes. This
indicates that bio-oil flame becomes self-sustaining even without using the pilot flame, meaning
that combustion persists over time and the flame continues to exist inside the combustion chamber.
Although bio-oil flame is found to become self-sustaining at a steady state condition, a pilot energy
of 0.3 kW is necessary for primary ignition of bio-oil to occur and for the burner to heat up.
As plotted in Figure 5.27, there is a positive relationship between NOx emissions and the
pilot flame energy. The total energy input of the burner and hence, the burner temperature increases
with pilot energy, resulting in higher NOx levels in exhaust of bio-oil. However, the plot has a
small slope because these emissions are dominated by conversion of fuel-bound nitrogen, as
previously mentioned.
Figure 5.27. NOx emissions vs pilot flame energy
5.8.7 Primary Air and Fuel Preheat Temperature
The air heater is turned on prior to bio-oil combustion to preheat the primary combustion air and
therefore, preheat the fuel inside the nozzle. Through several trials, it was found that having the
air heater turned on to maximum (i.e. 1 kW) is necessary for the primary ignition to occur. When
the flame reached a steady base point condition, the air heater was turned down to various points
0
20
40
60
80
100
120
140
0 0.05 0.1 0.15 0.2 0.25 0.3 0.35
NO
x (
pp
m)
Pilot flame energy (kW)
Minor
instabilities

CHAPTER 5. RESULTS AND DISCUSSION 70
in order to investigate the effect of primary air temperature on bio-oil combustion. CO and UHC
emissions remained below their respective detection limits throughout all temperature points. The
near complete oxidation of CO and UHCs indicates the efficiency of refractory linings in reducing
heat loss. Therefore, with the temperature obtained from the bio-oil flame, it seems that there is no
need for an alternative heating source.
Figure 5.28 plots fuel temperature at various primary air preheat temperatures. There is an
inverse relationship between fuel temperature and its viscosity, as fuel temperature decreases,
viscosity increases. Moreover, according to equation 3.5, there is a positive relationship between
fuel viscosity and SMD of the spray. As mentioned in section 5.6, spray droplet size has a
significant impact on coking tendency of the nozzle and therefore, using low preheat temperatures
increases the chance of nozzle coking. It was found that the fuel nozzle starts coking at primary
air temperatures below 88°C, and the extent of coke formation on the nozzle surface became even
more significant at lower preheat temperatures (below 70°C). Although the observed coking did
not affect CO and UHC emissions during the course of the experiment, it can potentially deteriorate
bio-oil atomization and ignition quality over time. Therefore, it is suggested to maintain the air
preheat temperature at above 88°C to avoid coking.
Figure 5.28. Fuel preheat temperature vs primary air preheat temperature
NOx emissions slightly decrease when the preheat temperature is reduced, as shown in
Figure 5.29. As previously stated, conversion of fuel-bound nitrogen is the dominant mechanism
40
45
50
55
60
65
70
75
80
25 75 125 175
Fu
el t
emp
eratu
re (
°C)
Primary air temperature (°C)
Starts
coking

CHAPTER 5. RESULTS AND DISCUSSION 71
for producing NOx. However, the slight decrease observed in NOx emissions at lower preheat
temperatures is the contribution of thermal NOx reduction in the system.
Figure 5.29. NOx emissions vs primary air preheat temperature
5.8.8 Formaldehyde, Acetaldehyde, and Methane Emissions
Aldehyde emissions are intermediate products formed during oxidation and combustion of
oxygenated biofuels such as PLBs. Aldehyde and methane emissions have negative impacts on
human health and substantially contribute to global warming. Therefore, formaldehyde (CH2O),
acetaldehyde (C2H4O), and methane (CH4) emissions in exhaust of bio-oil combustion are
measured by the FTIR to monitor these pollutants. These emissions were found to be below their
respective detection limits (10 ppm, 30 ppm, and 10 ppm, respectively) in most cases, indicating
proper oxidation of such intermediate combustion products. However, methane and formaldehyde
emissions of about 30 ppm and 85 ppm, respectively, were found in the lowest atomizing air flow
rate case (2.3 SLPM), because of large SMD of the spray and poor ignition quality of bio-oil in
this operating condition. Furthermore, formaldehyde emissions of around 12 ppm were found in
the case in which an atomizing air flow rate of 3 SLPM was used.
5.9 Particulate Matter Emissions
In addition to the gaseous emissions, particulate matter emissions in exhaust of bio-oil were
measured at the base operating point. The amount of carbonaceous residues and ash in PM
emissions were measured by the gravimetric analysis of the filters, as explained in section 4.6.2.
0
20
40
60
80
100
120
140
25 50 75 100 125 150 175
NO
x (
pp
m)
Primary air temperature (°C)
Starts
coking

CHAPTER 5. RESULTS AND DISCUSSION 72
Table 5.7 shows the average values of PM, CR, and ash from filter deposition measurements.
About 90 % of the total PM deposited on the filters is constituted of ash, and the CR contribution
is about 10 %. Figure 5.30 shows images of a quartz filter before and after its placement inside the
muffle furnace at 750°C for one hour to burn out CR deposited on the filter.
Table 5.7. Base point particulate matter emissions
Emission* Average value
(mg/kgfuel)
Standard deviation
(mg/kgfuel)
Total PM 504 ± 46 14
CR 50 5
Ash 454 12
*At 330 SLPM exhaust flowrate
(a) Loaded filter as collected
from the burner
(b) Filter after CR are burned
out at 750°C for one hour
Figure 5.30. Loaded quartz filter before and after CR burnout
Table 5.8 summarizes CR emissions of bio-oil combustion in this study and those of 80/20
bio-oil/EtOH combustion in the previous burner at their respective base operating conditions. It
reveals that the new burner provides adequate temperature to burn out most of the char particles
formed during the second stage of bio-oil combustion. As a result, the final solid phase product in
this study is mostly ash from the fuel.
Table 5.8. Comparison of CR emissions between the new burner and the previous one
Burner setup Fuel Exhaust
temperature (°C)
CR emissions
(mg/kgfuel)
As a wt %
of total PM
Upgraded burner Bio-oil 450-500 50 10
Previous burner [4] 80/20 Bio-oil/EtOH 250-300 225 30

CHAPTER 5. RESULTS AND DISCUSSION 73
5.9.1 Wall Deposition Effects
Although PM sampling is performed under an isokinetic condition to obtain representative results,
a portion of total PM is deposited on the internal surfaces of the burner, which cannot be collected
during sampling. Knowing the ash content of fuel, the percentage of PM loss in the combustor is
estimated by calculating the amount of ash deposited on filters as a wt % of fuel mass input. The
fuel has 0.09 wt % ash content and about 0.0454 wt % of fuel mass input is collected on the filters.
Therefore, about 50 % of the total ash from the fuel is deposited on the internal surfaces and does
not reach the filters. This can be explained through the geometry of the combustion chamber, the
presence of high-degree swirling flow inside the burner, the spray pattern, reduction in cross
sections of the exhaust pipes before reaching the PM sampling line, and also the presence of U-
joints in the exhaust pipes.
5.10 Heat Exchanger Analysis
The total power input of the burner is provided by three main sources: fuel input (10 kW), pilot
flame (0.3 kW), and air heater (1 kW). Using equation 4.6, the total heat extracted by the exhaust
heat exchanger is calculated and the amount of heat loss is then calculated from equation 4.5.
Figure 5.31 plots the input power of the burner as well as the amounts of the extracted heat and
heat loss at different equivalence ratios. Heat is lost from the swirl box, combustion chamber,
exhaust pipes, and the heat exchanger unit, with the heat from the exhaust pipes being the greatest.
Figure 5.31. Energy (heat) analysis of the new burner at different equivalence ratios
0
2
4
6
8
10
12
0.45 0.50 0.55 0.60 0.65 0.70 0.75
Pow
er (
kW
)
Equivalence ratio
Extracted heat
Total power input
Heat loss

CHAPTER 5. RESULTS AND DISCUSSION 74
As shown in Figure 5.31, the amount of heat loss increases when the equivalence ratio is
increased. Lower primary air flow rates result in higher equivalence ratios and higher exhaust gas
temperatures. Given a steady state condition, the burner wall temperature can be assumed to remain
constant. Therefore, the higher the gas temperature is, the greater the temperature gradients and
heat losses become.
Figure 5.32 compares the amount of heat extracted from the new burner and the previous
one [4] at different equivalence ratios. The power input for both the new and previous burners is
similar. However, the new burner is found to have a higher extracted energy compared to the
previous one; thus, the new burner has significantly lower heat loss than the previous one.
Figure 5.32. The amount of heat extracted by the heat exchanger for both the previous and
new burners
0
1
2
3
4
5
6
7
8
9
10
0.40 0.50 0.60 0.70 0.80
Extr
acte
d h
ea
t (k
W)
Equivalence ratio
New burner (this study)
Previous burner

75
C h a pt e r 6
Conclusions and Recommendations
6.1 Conclusions
A new refractory lined combustion chamber was designed to replace the previous one and upgrade
the burner for bio-oil combustion. The first step for studying bio-oil combustion was to find a
burner configuration in which the flame is stable and fluctuations in the system are minimal. It
was found that the burner throat had to be modified in order to get stable flames of bio-oil. Placing
a sleeve inside the throat to shrink the area around the nozzle and increase the primary air velocity
was the ultimate solution. Therefore, while it was not feasible to stabilize bio-oil flames in the
previous burner, the new burner has made it possible to study stable flames of pure PLB.
At the beginning of the bio-oil tests, it was found that the fuel nozzle became extremely
hot, causing the fuel to boil inside the nozzle cap and resulting in flash-atomization instabilities.
Although varying the operating parameters could improve the situation, the nozzle needed to be
insulated by a ceramic insulation sheet in order to keep the fuel temperature below its boiling point.
Bio-oil can polymerize at high temperatures, which can result in nozzle coking and
clogging. The original nozzle design - nozzle no.1 - showed a high coking tendency, and it was
not possible to continue running the burner after a large amount of coke was formed on the external
surface of the nozzle. Adjusting the operating parameters could not prevent the nozzle from coking.
Therefore, different nozzle designs were used to address the problem by decreasing the droplet
size of the spray. There is a compromise between internal clogging and external coking of nozzle
when changing the size of the discharge orifices. Nozzle no.2 had the smallest discharge orifices
and showed no external coking. However, it internally clogged due to bio-oil polymerizing inside

CHAPTER 6. CONCLUSIONS AND RECOMMENDATIONS 76
the liquid cap. Four different nozzle designs were tested, revealing that nozzle no.3 was the most
effective one in order to reduce the extent of external coking without getting internally clogged.
Once the setup and the fuel nozzle design were finalized and a base point operating
condition was found for bio-oil combustion, a parametric sensitivity analysis was performed to
investigate the effects of operating parameters on exhaust pollutant emissions. Studies conducted
by other students using the previous burner showed relatively high CO and UHC emissions even
for flames of 80/20 bio-oil/EtOH. However, CO and UHC levels are both below the detection
limits of the measurement instruments at the base point operating condition in the new burner.
This emphasizes that the new burner has significantly reduced these pollutant emissions and
increased combustion efficiency of bio-oil. The refractory-lined combustion chamber significantly
reduces heat loss, causing the flame regions to reach higher temperatures in comparison to the
previous burner. Therefore, almost all the CO and UHCs are oxidized before exiting the
combustion chamber. Moreover, the new setup is able to stabilize bio-oil flames using lower swirl
number and primary air preheat temperature as compared to the previous one. Table 6.1
summarizes the levels of CO and UHC in the exhaust gases as well as flame stability for both the
upgraded and previous burners at their respective base operating conditions.
Table 6.1. Comparison of CO emissions, UHC emissions, and flame stabilty condition
between the new burner and the previous one
Burner setup Fuel CO* (ppm) UHC* (ppm) Stability
Upgraded burner Bio-oil < 10 < 3 Stable
Previous burner [7] Bio-oil 2284 > 300 Unstable
Upgraded burner 80/20 Bio-oil/EtOH < 10 < 3 Stable
Previous burner [7] 80/20 Bio-oil/EtOH 650 25 Stable
*At 310 SLPM exhaust flowrate
The transient operation of the burner showed that oxidation of CO and UHC emissions
strongly depends on temperature. When the burner temperature goes up, these emissions tend to
decrease until a steady combustion is achieved within the burner, such that no more CO and UHCs
are detected in exhaust of bio-oil. Moreover, the transient burner operation revealed that NOx
emissions are dominated by conversion of fuel-bound nitrogen. NOx jumps from about 50 ppm to
above 110 ppm immediately after switching the fuel from ethanol to bio-oil. This indicates that
the thermal NOx contribution to total NOx emissions is about 50 ppm in this burner.

CHAPTER 6. CONCLUSIONS AND RECOMMENDATIONS 77
The parametric sensitivity studies revealed that the operating condition of the burner plays
an important role in combustion efficiency of PLB and its pollutant emissions. For instance, an
equivalence ratio of around 0.57 is necessary in order to improve mixing between fuel and air, and
to minimize the amount of CO emissions. However, if the primary air flow rate exceeds the base
point value, a severe shear is induced in the flame regions and the flame temperature decreases,
resulting in an increase in CO emissions. If the swirl number is increased, CO emissions can be
minimized at a higher equivalence ratio due to an improved mixing condition between air and fuel.
However, coking tendency of the nozzle increases when using higher degrees of swirl.
The atomizing air flow rate has a strong influence on ignition quality and pollutant
emissions of bio-oil. Using low atomizing air flow rates results in a large droplet size and poor
ignition quality of the fuel; hence, increasing UHC and CO emissions. Increasing the air flow rate
above the base point value causes the flame to detach from the nozzle and induces flame
instabilities. Therefore, it is important to find an optimum flow rate at which the flame is anchored
to the nozzle and the fuel is properly atomized.
The pilot flame creates a high-temperature region close to the fuel nozzle and helps the
bio-oil spray ignite and anchor close to the nozzle cap. The presence of the pilot flame is necessary
in order to start ignition and stabilize the bio-oil flame close to nozzle. In the previous burner, the
pilot flame had to be turned on all the time, and turning off the pilot resulted in flame blowout.
However, in the new burner, the bio-oil flame becomes self-sustaining once the burner reaches a
steady state condition, and even if the pilot flame is turned off at this stage, CO and UHC emissions
do not tend to increase.
The viscosity of PLB has an important effect on bio-oil atomization and ignition
characteristics. It was found that bio-oil should be preheated in order to initiate its ignition.
Therefore, an air heater is used to preheat the primary air and the fuel prior to injection. After bio-
oil is ignited and the flame is stabilized, the gas temperature around the nozzle reaches a value
high enough to maintain the flame even without using the air heater. However, the fuel temperature
decreases as the primary air temperature is reduced, which causes SMD of the spray to become
larger and coking tendency of the nozzle to increase. Therefore, with the current nozzle design,
the air and the fuel should be preheated to avoid major coke formation on the nozzle surface.

CHAPTER 6. CONCLUSIONS AND RECOMMENDATIONS 78
Bio-oil has solid content that results in inevitable particulate matter emissions. PM
emissions of bio-oil at the base operating condition was measured, showing that about 90 % of the
total PM is constituted of ash and the remainder is carbonaceous residue (CR). The new burner
achieves a higher temperature and has a better combustion efficiency than the previous one; hence,
less CR is detected in exhaust of bio-oil as compared to that of 80/20 bio-oil/ethanol in the previous
burner. However, the PM collection efficiency is about 50 % of the total PM produced in the
burner, which is due to the wall deposition effects and the geometry of the burner.
In the end, the heat exchanger analysis revealed that the new burner has a significantly
lower amount of heat loss than the previous one. This observation reinforces the improvement in
flame stability and combustion efficiency of PLB in the new burner. Considering the design factors
suggested for industrial bio-oil burners, the upgraded design shares more common characteristics
with the industrial burners compared to the previous design. Therefore, the new burner can be
easily adapted and scaled for use in industry. Furthermore, since bio-oil burns well in the new
burner, there is a reasonable possibility of using this biofuel in small-scale applications.
6.2 Recommendations and Future Work
The studies of bio-oil combustion in the current refractory lined burner can be further developed
and improved by the following research ideas:
1. A laser instrument can be used to measure droplet size distribution and find an accurate
SMD correlation for internally-mixed air-blast atomizing nozzles. This lab already
possesses a Malvern Spraytec instrument which uses the technique of laser diffraction to
measure droplet size distribution.
2. As found in this study, nozzle design has an important role in combustion efficiency of
bio-oil. However, it was not feasible to thoroughly investigate the effects of various nozzle
designs on bio-oil combustion due to the limited time of this project, and only four different
designs were studied. Although no major coke formation was observed when using nozzle
no.3 over the course of a test, it eventually started to coke on the nozzle surface after an
hour of running on bio-oil. Therefore, these studies can be expanded to find an optimal
nozzle design with minimum coking and clogging tendencies.
CHAPTER 6. CONCLUSIONS AND RECOMMENDATIONS 79
3. Conducting an experimental study reflecting on spray patternation and its effects on flame
stability and emissions.
4. Bio-oil properties strongly depend on the feedstock. Combustion behavior of various bio-
oils from different types of feedstock can be studied using this burner in order to find an
average trend for pollutant emissions and other combustion characteristics of pyrolysis
liquid biofuels.
5. Actual industrial burners usually use gear-type pumps for fuel delivery. The peristaltic
pumps can be replaced by a gear pump to investigate the effect of fuel pump on coke
formation. Peristaltic pumps generate a non-continuous flow, which can favor coke
deposition on the external surface of the fuel nozzle.
6. Being able to do cold startup (without ethanol warm-up) on pure bio-oil is an advantage
for operations. This could be done with an appropriate nozzle design and proper atomizing
conditions. However, it is rather challenging to quantify such conditions in industrial bio-
oil facilities and hence, the current burner can be used to investigate the possibility of a
cold startup on PLB.
7. It was found that bio-oil flames become self-sustaining after reaching a steady state
condition, and even after the pilot flame is turned off, no CO and UHC are detected.
However, the flame is not anchored to the fuel nozzle when the pilot flame is off. Changing
the nozzle design or the operating parameters (i.e. atomizing air flow rate, primary air flow
rate, swirl number, etc.) can be used to study the feasibility of stabilizing the flame close
to the nozzle.
8. Due to the restricted time of this study, PM measurements were done only under the base
operating condition. Analogous to the gas phase emissions, a parametric sensitivity
analysis can be performed to investigate the effect of burner operating condition on PM
emissions of bio-oil.
9. Water traps get overloaded during the course of a test and the excessive water flows into
the exhaust line, which can affect the primary air flow rate provided by the stack fan.
Therefore, a larger water trap can be designed to replace the current one.
80
References
[1] P. Steele, M. E. Puettmann, V. K. Penmetsa and J. E. Cooper, "Life-Cycle Assessment of
Pyrolysis Bio-Oil Production," Forest Products Journal, vol. 62, no. 4, pp. 326-334, 2012.
[2] S. Karagoz, "Energy production from the pyrolysis of waste biomasses," International
Journal of Energy Research, vol. 33, pp. 576-581, 2009.
[3] L. Qiang, Y. Xu-lai and Z. Xi-feng, "Analysis on chemical and physical properties of bio-oil
pyrolyzed from rice husk," Journal of Analytical and Applied Pyrolysis, vol. 82, p. 191–198,
2008.
[4] T. Tzanetakis, "Spray combustion characteristics and emissions of a wood derived fast
pyrolysis liquid-ethanol blend in a pilot stabilized swirl burner," Mechanical and Industrial
Engineering, The University of Toronto, PhD Thesis, 2011.
[5] T. Tzanetakis, N. Farra, S. Moloodi, W. Lamont, A. McGrath and M. J. Thomson, "Spray
combustion characteristics and gaseous emissions of a wood derived fast pyrolysis liquid-
ethanol blend in a pilot stabilized swirl burner," Energy & Fuels, vol. 24, pp. 5331-5348,
2010.
[6] T. Tzanetakis, S. Moloodi, N. Farra, B. Nguyen, A. McGrath and M. J. Thomson,
"Comparison of the Spray Combustion Characteristics and Emissions of a Wood-Derived
Fast Pyrolysis Liquid-Ethanol Blend with Number 2 and Number 4 Fuel Oils in a Pilot-
Stabilized Swirl Burner," Energy & Fuels, vol. 25, pp. 4305-4321, 2011.
[7] S. Moloodi, T. Tzanetakis, B. Nguyen, M. Zarghami-Tehran, U. Khan and M. J. Thomson,
"Fuel Property Effects on the Combustion Performance and Emissions of Hardwood-
Derived Fast Pyrolysis Liquid-Ethanol Blends in a Swirl Burner," Energy & Fuels, vol. 26,
pp. 5452-5461, 2012.

REFERENCES 81
[8] A. Khodier, P. Kilgallon, N. Legrave, N. Simms, J. Oakey and T. Bridgwater, "Pilot-Scale
Combustion of Fast-Pyrolysis Bio-Oil: Ash Deposition and Gaseous Emissions,"
Environmental Progress & Sustainable Energy, vol. 28, no. 9, pp. 397-403, 2009.
[9] P. McKendry, "Energy production from biomass (part 1): overview of biomass," Bioresource
Technology, vol. 83, pp. 37-46, 2002.
[10] S. N. Naik, V. V. Goud, P. K. Rout and A. K. Dalai, "Production of first and second
generation biofuels: A comprehensive review," Renewable and Sustainable Energy Reviews,
vol. 14, p. 578–597, 2010.
[11] D. Carpenter, T. L. Westover, S. Czernik and W. Jablonski, "Biomass feedstocks for
renewable fuel production: a review of the impacts of feedstock and pretreatment on the yield
and product distribution of fast pyrolysis bio-oils and vapors," Green Chemistry, vol. 16, pp.
384-406, 2014.
[12] L. Caspeta, N. A. A. Buijs and J. Nielsen, "The role of biofuels in the future energy supply,"
Energy & Environmental Science, vol. 6, pp. 1077-1082, 2013.
[13] A. Bridgwater and G. Peacocke, "Fast pyrolysis processes for biomass," Renewable and
Sustainable Energy Reviews, vol. 4, pp. 1-73, 2000.
[14] A. Demirbas, "Yields of Oil Products From Thermochemical Biomass Conversion
Processes," Energy Conversion Management, vol. 39, no. 7, pp. 685-690, 1998.
[15] S.-Y. No, "Application of bio-oils from lignocellulosic biomass to transportation, heat and
power generation—A review," Renewable and Sustainable Energy Reviews, vol. 40, pp.
1108-1125, 2014.
[16] F. Abnisa, A. Arami-Niya, W. M. A. W. Daud and J. N. Sahu, "Characterization of Bio-oil
and Bio-char from Pyrolysis of Palm Oil Wastes," BioEnergy Research, vol. 6, pp. 830-840,
2013.

REFERENCES 82
[17] Z. Ji-Lu and K. Yong-Ping, "Spray combustion properties of fast pyrolysis bio-oil produced
from rice husk," Energy Conversion and Management, vol. 51, no. 1, pp. 182-188, 2010.
[18] A. Pattiya, "Bio-oil production via fast pyrolysis of biomass residues from cassava plants in
a fluidised-bed reactor," Bioresource Technology, vol. 102, pp. 1959-1967, 2011.
[19] Z.-Y. Hseu, S.-H. Jien, W.-H. Chien and R.-C. Liou, "Impacts of Biochar on Physical
Properties and Erosion Potential of a Mudstone Slopeland Soil," The Scientific World
Journal, vol. 2014, pp. 1-10, 2014.
[20] A. Bridgwater, "Renewable fuels and chemicals by thermal processing of biomass,"
Chemical Engineering Journal, vol. 91, pp. 87-102, 2003.
[21] D. Mohan, C. U. Pittman Jr. and P. H. Steele, "Pyrolysis of Wood/Biomass for Bio-oil: A
Critical Review," Energy & Fuels, vol. 20, pp. 848-889, 2006.
[22] J. P. Diebold, "A Review of the Chemical and Physical Mechanisms of the Storage Stability
of Fast Pyrolysis Bio-Oils," National Renewable Energy Laboratory, Lakewood, Colorado,
2002.
[23] T. Ba, A. Chaala, M. Garcia-Perez, D. Rodrigue and C. Roy, "Colloidal properties of bio-
oils obtained by vacuum pyrolysis of softwood bark: characterization of water-soluble and
water-insoluble fractions," Energy and Fuels, vol. 18, no. 3, pp. 704-712, 2004.
[24] L. Qiang, L. Wen-Zhi and Z. Xi-Feng, "Overview of fuel properties of biomass fast pyrolysis
oils," Energy Conversion and Management, vol. 50, pp. 1376-1383, 2009.
[25] A. Oasmaa, E. Kuoppala, S. Gust and Y. Solantausta, "Fast Pyrolysis of Forestry Residue.
1. Effect of Extractives on Phase Separation of Pyrolysis Liquids," Energy & Fuels, vol. 17,
no. 1, pp. 1-12, 2003.

REFERENCES 83
[26] C. R. Shaddix and P. J. Tennison, "Effects of char content and simple additives on biomass
pyrolysis oil droplet combustion," Twenty-Seventh Symposium (International) on
Combustion, pp. 1907-1914, 1998.
[27] A. Shihadeh and S. Hochgreb, "Impact of biomass pyrolysis oil process conditions on
ignition delay in compression ignition engines," Energy & Fuels, vol. 16, pp. 552-561, 2002.
[28] V. Minkova et al., "Effect of water vapour and biomass nature on the yield and quality of the
pyrolysis products from biomass," Fuel Processing Technology, vol. 70, pp. 53-61, 2001.
[29] F. A. Agblevor and S. Besler, "Inorganic compounds in biomass feedstocks. 1. effect on the
quality of fast pyrolysis oils," Energy & Fuels, vol. 10, pp. 293-298, 1996.
[30] A. Oasmaa and S. Czernik, "Fuel oil quality of biomass pyrolysis oils - state of the art for
end users," Energy and Fuels, vol. 13, no. 4, pp. 914-921, 1999.
[31] D. C. Elliott, "Water, Alkali and Char in Flasg Pyrolysis Oils," Biomass and Bioenergy, vol.
7, pp. 179-185, 1994.
[32] S. Czernik and A. V. Bridgwater, "Overview of applications of biomass fast pyrolysis oil,"
Energy and Fuels, vol. 18, no. 2, pp. 590-598, 2004.
[33] M. J. Wornat, B. G. Porter and N. Y. C. Yang, "Single Droplet Combustion of Biomass
Pyrolysis Oils," Energy & Fuels, vol. 8, pp. 1131-1142, 1994.
[34] A. Oasmaa and D. Meier, "Norms and standards for fast pyrolysis liquids: 1. Round robin
test," Journal of Analytical and Applied Pyrolysis, vol. 73, p. 323–334, 2005.
[35] S. Gust, "Combustion Experiences of Flash Pyrolysis Fuel in Intermediate Size Boilers," in
Developments in Thermochemical Biomass Conversion, Blackie Academic & Professional,
1997, pp. 481-488.
[36] M. Kyto, P. Martin and S. Gust, "Development of Combustors for Pyrolysis Liquids," in
Pyrolysis and Gasification of Biomass and Waste, CPL Press, 2003, pp. 187-190.
REFERENCES 84
[37] D. Wissmiller, "Pyrolysis oil combustion characteristics and exhaust emissions in a swirl-
stabilized combustor," Iowa State University, PhD Thesis, 2010.
[38] G. Lopez Juste and J. J. S. Monfort, "Preliminary test on combustion of wood derived fast
pyrolysis oils in a gas turbine combustor," Biomass and Bioenergy, vol. 19, pp. 119-128,
2000.
[39] R. Andrews et al., "Firing Fast Pyrolysis Oil in Turbines," in Biomass Pyrolysis Oil
Properties and Combustion Meeting, Estes Park, CO, 1994.
[40] A. Shihadeh and S. Hochgreb, "Diesel Engine Combustion of Biomass Pyrolysis Oils,"
Energy and Fuels, vol. 14, pp. 260-274, 2000.
[41] W. L. VanDeKamp and J. P. Smart, "Atomisation and Combustion of Slow Pyrolysis Oils,"
in Advances In Thermochemical Conversion, Blackie Academic & Professional, 1994, pp.
1265-1274.
[42] B. A. Freel, R. G. Graham and D. R. Huffman, "Commercial aspects of Rapid Thermal
Processing (RTM)," in Bio-oil Production and Utilization, Newbury, UK, CPL Press, 1996,
pp. 86-95.
[43] R. E. Maggi and D. C. Elliot, "Upgrading Overview," in Developments in Thermochemical
Biomass Conversion, vol. 1, A. V. Bridgwater and D. G. B. Boocock, Eds., Springer
Netherlands, 1997, pp. 575-588.
[44] R. Agrawal and N. R. Singh, "Synergistic routes to liquid fuel for a petroleum-deprived
future," AIChE Journal , vol. 55, no. 7, p. 1898–1905, 2009.
[45] J. P. Diebold and S. Czernik, "Additives to lower and stabilize the viscosity of pyrolysis oils
during storage," Energy and Fuels, vol. 11, no. 5, p. 1081–1091, 1997.

REFERENCES 85
[46] J. Scahill, J. P. Diebold and C. Feik, "Removal of residual char fines from pyrolysis vapors
by hot gas filtration," in Developments in Thermochemical Biomass, vol. 1, A.V. Bridgwater
and D.G.B. Boocock, Ed., Eds., Blackie Academic and Professional, 1997, p. 253–267.
[47] A. Oasmaa, K. Sipila, Y. Solantausta and E. Kuoppala, "Quality improvement of pyrolysis
liquid: effect of light volatiles on the stability of pyrolysis liquids," Energy and Fuels, vol.
19, no. 6, p. 2556–2561, 2005.
[48] C. R. Shaddix and D. R. Hardesty, "Combustion properties of biomass flash pyrolysis oils:
Final project report," Sandia National Laboratories, Tech. Rep. SAND99-8238, Porvoo,
Finland, 1999.
[49] R. Strenziok, U. Hansen and H. Kunstner, "Combustion of Bio-Oil in a Gas Turbine," in
Progress in Thermochemical Biomass Conversion, Blackwell Science Ltd., 2001, pp. 1452-
1458.
[50] D. Chiaramonti, A. Oasmaa and Y. Solantausta, "Power generation using fast pyrolysis
liquids from biomass," Renewable and Sustainable Energy Reviews, vol. 11, p. 1056–1086,
2007.
[51] B. M. Wagenaar, R. H. Venderbosch, W. Prins and F. W. M. Penninks, "Bio-oil as a coal
substitute in a 600 MW Power Station," in 12th European conference and technology
exhibition on biomass for energy, Industry and Climate Protection, Amsterdam, The
Netherlands, 2002.
[52] B. M. Wagenaar, E. Gansekoele, J. Florijn, R. H. Venderbosch, F. W. M. Penninks and A.
Stellingwerf, "Bio-oil as natural gas substitute in a 350 MW power station," in Second world
conference on biomass for energy, Industry and Climate Protection, Rome, Italy, 2004.
[53] S. P. Krumdieck and J. W. Daily, "Evaluating the Feasibility of Biomass Pyrolysis Oil for
Spray Combustion Applications," Combustion Science and Technology, vol. 134, pp. 351-
365, 1998.
REFERENCES 86
[54] F. Preto, P. E. G. Gogolek and J. K. L. Wong, "Nozzle Testing and Development for Bio-
Oil Combustion," in Science in Thermal and Chemical Biomass Conversion, CPL Press,
2006, pp. 1480-1490.
[55] D. R. Huffman, A. J. Vogiatzis and D. A. Clarke, "Combustion of Bio-Oil," in Bio-Oil
Production and Utilization, CPL Press, 1996, pp. 227-235.
[56] D. Sequera, A. K. Agrawal, S. K. Spear and D. T. Daly, "Combustion Performance of Liquid
Biofuels in a Swirl-Stabilized Burner," Journal of Engineering for Gas Turbines and Power,
vol. 130, no. 3, pp. 1-9, 2008.
[57] Y. Solantausta et al., "Preliminary Tests with Wood-Derived Pyrolysis Liquid as Fuel in a
Stationary Diesel Engine," in Biomass Pyrolysis Liquid Properties and Combustion Meeting,
Estes Park, CO, 1994.
[58] Form C-1421, Fiberfrax Blanket and Mat Products, Unifrax I LLC, Tonawanda, NY, 2014.
[59] A. K. Gupta, D. G. Lilley and N. Syred, Swirl Flows, Gordon and Breach Science Publishers,
1984.
[60] J. M. Be´er and N. A. Chigier, Combustion Aerodynamics, Applied Science Publishers,
1972.
[61] T. J. Fudihara, L. Goldstein Jr. and M. Mori, "The three-dimensional numerical
aerodynamics of a movable block burner," Brazilian Journal of Chemical Engineering, vol.
20, no. 04, pp. 391-401, 2003.
[62] Catalog No. JPL99C, JPL Series Air Atomizing Nozzles, BEX Engineering Ltd.,
Mississauga, ON, Canada.
[63] A. H. Lefebvre, Atomization and sprays, Bristol, PA: Taylor & Francis, 1989.

REFERENCES 87
[64] N. Farra, "Efficiency and Emissions Study of a Residential Micro–Cogeneration System
Based on a Stirling Engine and Fuelled by Diesel and Ethanol," Mechanical and Industrial
Engineering, The University of Toronto, MASc Thesis, 2010.
[65] R. Dennis, W. R. Samples, D. M. Anderson and L. Silverman, "Isokinetic sampling probes,"
Industrial and Engineering Chemistry, vol. 49, no. 2, p. 294–302, 1957.
[66] Y. Huang and V. Yang, "Dynamics and stability of lean-premixed swirl-stabilized
combustion," Progress in Energy and Combustion Science, vol. 35, p. 293–364, 2009.
[67] S. Moloodi, "Experimental Investigation of The Effects of Fuel Properties on Combustion
Performance and Emissions of Biomass Fast Pyrolysis Liquid-Ethanol Blends in a Swirl
Burner," Mechanical and Industrial Engineering, The University of Toronto, MASc Thesis,
2012.
[68] A. Oasmaa, E. Kuoppala, J.-F. Selin, S. Gust and Y. Solantausta, "Fast Pyrolysis of Forestry
Residue and Pine. 4. Improvement of the Product Quality by Solvent Addition," Energy &
Fuels, vol. 18, pp. 1578-1583, 2004.
[69] M. E. Boucher, A. Chaala and C. Roy, "Bio-oils obtained by vacuum pyrolysis of softwood
bark as a liquid fuel for gas turbines. part i: properties of bio-oil and its blends with methanol
and a pyrolytic aqueous phase," Biomass and Bioenergy, vol. 19, pp. 337-350, 2000.
[70] E. A.V. Bridgwater, Fast pyrolysis of biomass: a Handbook volume 3., Newbury: CPL Press,
2005.
[71] A. Demirbas, D. Gullu, A. Caglar and F. Akdeniz, "Determination of calorific values of fuel
from lignocellulosics," Energy Sources, vol. 19, pp. 765-770, 1997.
[72] C. Moses, "Fuel specification considerations for biomass liquids," in Biomass Pyrolysis Oil
Properties and Combustion Meeting, 1994.

REFERENCES 88
[73] D. Nguyen and D. Honnery, "Combustion of bio-oil ethanol blends at elevated pressure,"
Fuel, vol. 87, p. 232–243, 2008.

89
Appendix A
Upgraded Burner Drawings

APPENDIX A. UPGRADED BURNER DRAWINGS 90
Figure A. 1. Overall burner assembly

APPENDIX A. UPGRADED BURNER DRAWINGS 91
Figure A. 2. Overall burner assembly (swirl outlet pipe is removed)

APPENDIX A. UPGRADED BURNER DRAWINGS 92
Figure A. 3. Combustion chamber assembly
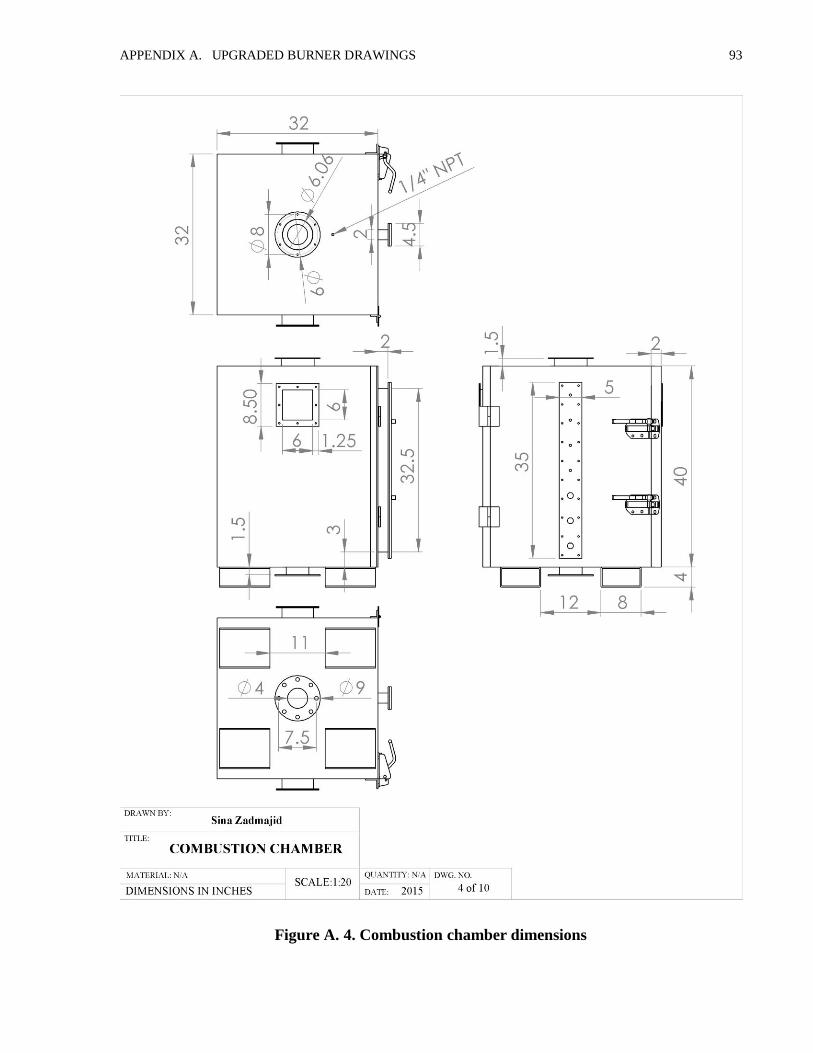
APPENDIX A. UPGRADED BURNER DRAWINGS 93
Figure A. 4. Combustion chamber dimensions

APPENDIX A. UPGRADED BURNER DRAWINGS 94
Figure A. 5. Refractory linings

APPENDIX A. UPGRADED BURNER DRAWINGS 95
Figure A. 6. Swirl outlet flange

APPENDIX A. UPGRADED BURNER DRAWINGS 96
Figure A. 7. Viewport flange

APPENDIX A. UPGRADED BURNER DRAWINGS 97
Figure A. 8. Port box assembly

APPENDIX A. UPGRADED BURNER DRAWINGS 98
Figure A. 9. Exhaust outlet flange
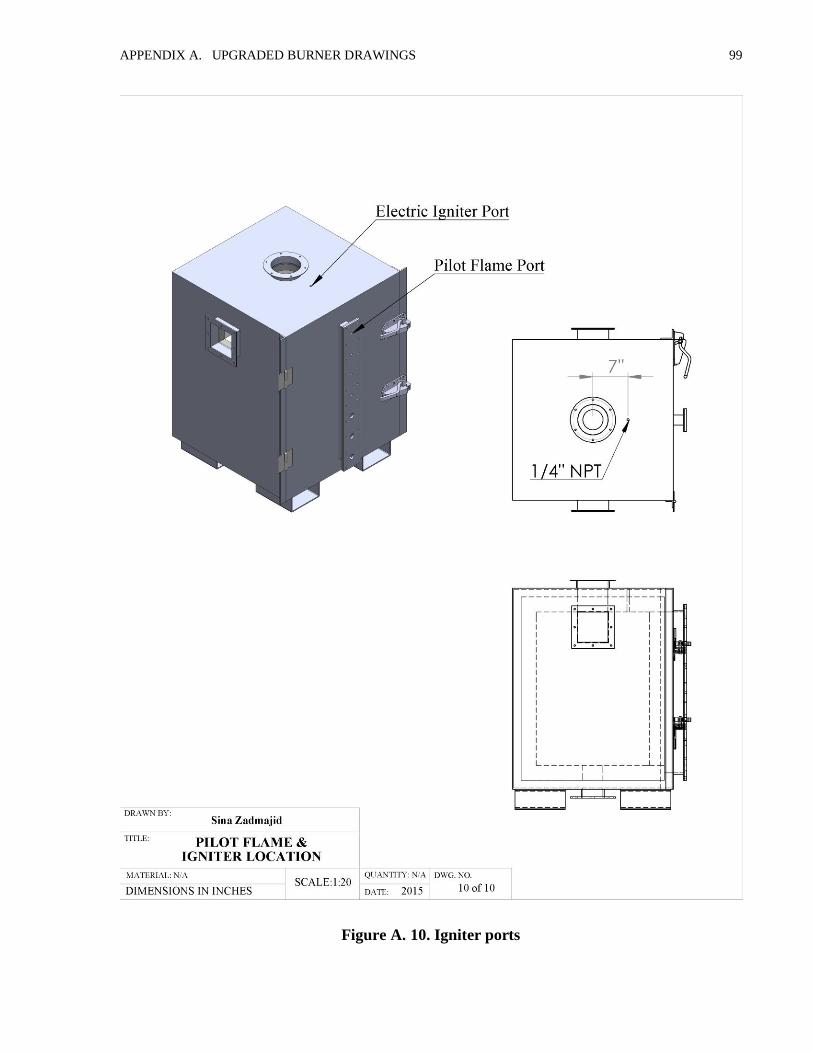
APPENDIX A. UPGRADED BURNER DRAWINGS 99
Figure A. 10. Igniter ports

100
Appendix B
Bio-Oil Burner Instruction

APPENDIX B. BIO-OIL BURNER INSTRUCTION 101
Bio-Oil Burner Instruction
Test Pr eparat io n
1. Remove PLB (bio-oil) from the refrigerator and place it in the fume hood (the night before)
2. Close the combustor door and make sure it is properly sealed
3. Using a Scientech SM-128D Microbalance, measure the mass of the three PM filters you will use (do this
just prior to a combustion test)
FTI R and Heat ing Dev ices Pr epar at io n (1 -2 hours before running on fuel)
4. Turn on the power bar behind the temperature controllers
5. Turn on the temperature controllers for the filter and the transfer line: 408°F (209°C) and 378°F (192°C)
respectively
6. Make sure the exhaust sample line is closed to the FID (the right-hand valve on the back of the FID should
point to the right)
7. Turn on the vacuum pump and the UHV pump for the FTIR
8. Turn on the FTIR Cell Heating Jacket
9. Turn on the heating tapes and move the knobs to the levels indicated on each of them
10. Open the gas cell to the vacuum pumps and draw vacuum to roughly -100 kPa
FI D Pr eparat io n (1- 2 hours before taking samples )
11. Turn the FID on and wait for 20-30 minutes
12. Press “F3” (Diagnostic) on the FID to see the temperatures
13. Once the “burner temperature” is above 160°C:
a. Open the H2/He and the Compressed Air cylinders
outside the room (make sure the cylinder output
pressures are at 20-25 PSIG)
b. Press “Main” → “F8” to ignite the flame in the FID
(the burner temperature reaches ≥ 220°C)

APPENDIX B. BIO-OIL BURNER INSTRUCTION 102
A ir I nt ake and E xhaust Prepar at io n
14. Open the faucet to start the cooling water for the main Heat Exchanger and set it to 1.8 GPM
15. Turn on the air intake flowmeter power supply
16. Turn on the stack fan in the other room and set the primary air to the desired flowrate (≈ 200 SLPM)
17. Turn on the O2 pump and maintain the exhaust flowrate at around R=10 (i.e. 1.8 SLPM)
18. Open the atomizing air valve and set the rotameter to the desired flowrate (≈ R = 20)
19. Turn on the air heater on the right countertop and set it to 100 % load
P i lo t Fla me Prepar at io n
20. Open the Methane and O2 cylinders outside the room
21. Move the pilot tip close to the electric igniter inside the combustor and ignite the
flame:
a. Open the Methane rotameter valve slightly and ignite methane with the
electric igniter
b. Open the O2 rotameter valve to obtain a blue flame
22. Move the pilot flame to the desired position.
23. Increase methane and O2 on the rotameter valves to obtain the desired pilot energy
24. Allow 10-15 minutes for air to flow through and heat up
Exper iment Record ing (LabVIE W)
25. Wake up the computer on the right countertop and open the LabVIEW software
26. Click Run to start the measurements

APPENDIX B. BIO-OIL BURNER INSTRUCTION 103
E thano l War m up
27. Take roughly 500 mL of ethanol from the container and pour into the beaker
28. Set the peristaltic pumps to 29 RPM (≈ 28 mL/min) and start
29. Allow ethanol to warm up the combustor for 20-30 minutes
PLB Fue l T est ing
30. Pour PLB into the plastic beaker and turn on the electric mixer in order to stir the fuel
31. When ethanol warm-up is complete, switch the fuel line to PLB and change to the calibrated RPM in order
to get the desired fuel flowrate:
a. Using a digital scale and a stop watch, measure the fuel mass pumped at a certain RPM on the pumps
to determine the fuel mass flowrate and accordingly the input energy of the burner
b. Set the RPM of the pumps to get 10 kW energy input
32. Allow 30 minutes for warming up and reaching a steady state condition
FTI R Purg ing
33. Open the N2 cylinder outside the room while making sure the nitrogen valve is closed on the manifold
Needle
valve
175-200°C
PM-Sampling Temperature
115-140°C Click Run

APPENDIX B. BIO-OIL BURNER INSTRUCTION 104
34. While the burner is warming up, purge the FTIR gas cell to get it ready for the measurements:
a. Close the needle valve on the manifold
b. Close the vacuum pump valve on the manifold and open the nitrogen valve
c. Slowly open the needle valve and fill the gas cell to -15 kPa with nitrogen (quickly)
d. Close the nitrogen valve and open the gas cell to the vacuum pumps on the manifold
e. Pull vacuum from the gas cell to roughly -100 kPa
f. Repeat steps (a)-(e) for a total of 4 times
FTI R Background & Sa mpling
35. Collecting a Background:
a. Open the OMNIC software
b. Go to the Experimental Setup and select “collect background before every sample”
c. Click on “Collect Background”
d. After collecting the background, name and save the file in a secure file location
e. Go back to the Experimental Setup and select “Use specified background file” and choose the path
of the saved background
f. Now the FTIR is ready to take samples
36. When the combustor has reached a steady state temperature, take FTIR samples:
a. Open the exhaust sample line to the gas cell and stabilize for 5 minutes while maintaining a pressure
of roughly -15 kPa in the gas cell by using the needle valve on the manifold
b. Make sure the exhaust sample temperature is above 120°C
c. Click “Collect Sample” and wait for the sample to be taken
d. After the sample is complete, save the data
e. Close the exhaust sample line to the gas cell and purge the gas cell (step 34)
f. Take a new background for the next sample (step 35)
g. Repeat steps (a)-(f) for the next samples with roughly 3 minute intervals
37. Analyze the results:
a. Open the TQ Analyst software and open the desired calibration file (December 2009 Corrected CO
PLS4.qnt)
b. Press “Quantify” and select your sample file
Collect
Background
Collect Sample
[Ctrl+S]
Experimental
Setup

APPENDIX B. BIO-OIL BURNER INSTRUCTION 105
FI D Sa mpling
38. Calibrate the FID after the warm-up stage when Tburner ≈ 315-330°C → [see Appendix I]
39. Turn the right-hand valve to point to the left so that the exhaust sample is running through the FID (at this
point, the FID burner temperature rises to approximately 370–380°C)
40. Measure the THC level: press “Main” and then “F1”
PM Samp ling
41. Place 2 dummy filters in the main and the bypass lines and make sure you have enough filters ready to replace
those during the experiment
42. Turn on the water for the PM Sampling Condenser and set it to approximately 0.25 GPM
43. Turn on the PM sampling pump on the floor
44. Run the first dummy filter in the main line for 5 minutes before significant pressure drop is observed across
the filter:
c. Open the main line while the bypass line is closed and let the exhaust flow through the PM line
d. Warm up the PM sampling line and wait for the “Wet Gas” temperature to reach 115-140°C
e. Maintain a null pressure difference on the manometer using the brass knob on the PM rotameter to
find the isokinetic condition, which corresponds to 10.4 % of the total exhaust flowrate

APPENDIX B. BIO-OIL BURNER INSTRUCTION 106
45. Close the main line and open the bypass line. Run flow through the bypass line while placing a new dummy
filter in the main line
46. Repeat steps 44-45 one more time with new dummy filters in the main and bypass lines, and find the
isokinetic condition
47. Start collecting PM samples using the official filters:
a. Place PM1 filter in the main line while exhaust is running through the bypass line
b. Rapidly switch back to the main line and start the timer
c. Adjust the PM flowrate and null pressure, and make sure the temperature is within the 115-140°C
d. Record these parameters: Rotameter value, “Dry Gas” temperature and pressure (at the PM
condenser exit), O2 sensor value, H2O mole fraction (from FTIR or complete combustion equation)
e. Collect PM for 3-5 minutes. During this time, place a new dummy filter in the bypass line if
necessary
f. When PM1 collection is complete, rapidly switch to the bypass line and place the PM1 filter in its
petri dish
g. Repeat steps (a)-(f) 2 more times for PM2 and PM3 filters
48. After PM sampling is complete, clean the system by shooting compressed air backwards through the
sampling line
49. Turn off the PM sampling pump so the lines do not get clogged
50. Turn off the cooling water for the PM condenser
51. Weigh the loaded filters after storing them at ambient conditions for about 24 hours
F la me Te mperatur e Pro f i le Measur eme nt s
52. Take the K-type thermocouple and measure temperature at different locations:
a. Hold the thermocouple in place and record the temperature once it is steady
b. Let the thermocouple cool to below 300°C before moving to the next location
c. Repeat the procedure for each location for 2-3 times and record each iteration for accuracy
Borescope IR, P ictur es & V ideos
53. Connect the borescope to the IR adapter and the laptop
54. Open the borescope port on the port box, place it in its port, hook the cooling air to scope, and begin taking
spectra (must do this rapidly because the cooling air can change conditions in chamber)
55. After taking IR, remove the IR adapter, connect the camera adapter, and take pictures and videos
Brass knob

APPENDIX B. BIO-OIL BURNER INSTRUCTION 107
Shutdown Procedures
56. Switch to ethanol for flushing the lines:
a. Turn off the air heater
b. Purge the gas cell with nitrogen and maintain vacuum afterwards
c. Run ethanol for about 20 minutes
57. After flushing with ethanol:
a. Turn off the peristaltic pumps
b. Turn off the pilot flame
c. Turn off all the heating tapes
d. Turn off the FTIR vacuum pumps and the gas cell heater
e. Increase the atomizing air flowrate to 40 SLPM, and increase the primary air flow
f. Turn off the FID:
i. Turn off all supply gas cylinders (H2/He and Compressed Air)
ii. Allow the analyzer to draw in room air for approximately 5 minutes
iii. Press “Main” → “F2” (Purging)
iv. Wait for 20-30 minutes and turn off the FID
g. Close the exhaust sample line to the FID
h. Turn off the O2 pump and the power bar
58. Close all the cylinders outside the room
59. Once the exhaust flange is around 70°C, turn off the atomization air, the stack fan, and the cooling water
60. Put the unused fuel in the fridge
61. Empty the water traps
62. Clean the media bottles, glassware, and utensils
63. Clean the nozzle:
a. Remove the nozzle caps and place the parts in an ultrasonic bath with a solution of water and acetone
until all deposits are dissolved
64. Clean the combustor viewports from the inside

APPENDIX B. BIO-OIL BURNER INSTRUCTION 108
APPENDIX I : FID Cal ibrat io n
1. Turn the left-hand valve (on the back of the FID) to point left
2. Turn the right-Hand valve to point right (close the gas sampling to the FID)
3. Press “Main” → “F4” → “F2” → “F1”
4. Open the brass valve to around 1-2 psi*
5. Once the value is stable, press “F1” and close the brass valve
6. Press “Back” → “F2”
7. Open the CH4-90ppm cylinder (on the floor) to around 1-2 psi
8. Once the value is stable, press “F1” and close the cylinder
9. Turn the left-hand valve to point right
10. Make sure that the measurement range is set to 0-300ppm. The uncertainty is ±3ppm
APPENDIX II : Te mperatur e Limit s
FID sample gas: 185 ≤ 𝑇𝑔𝑎𝑠 < 196℃
FTIR sample gas: 120 ≤ 𝑇𝑔𝑎𝑠 < 180℃
* Any pressure exceeding 2.0 psi can damage the FID pump

109
Appendix C
Nozzle Drawings
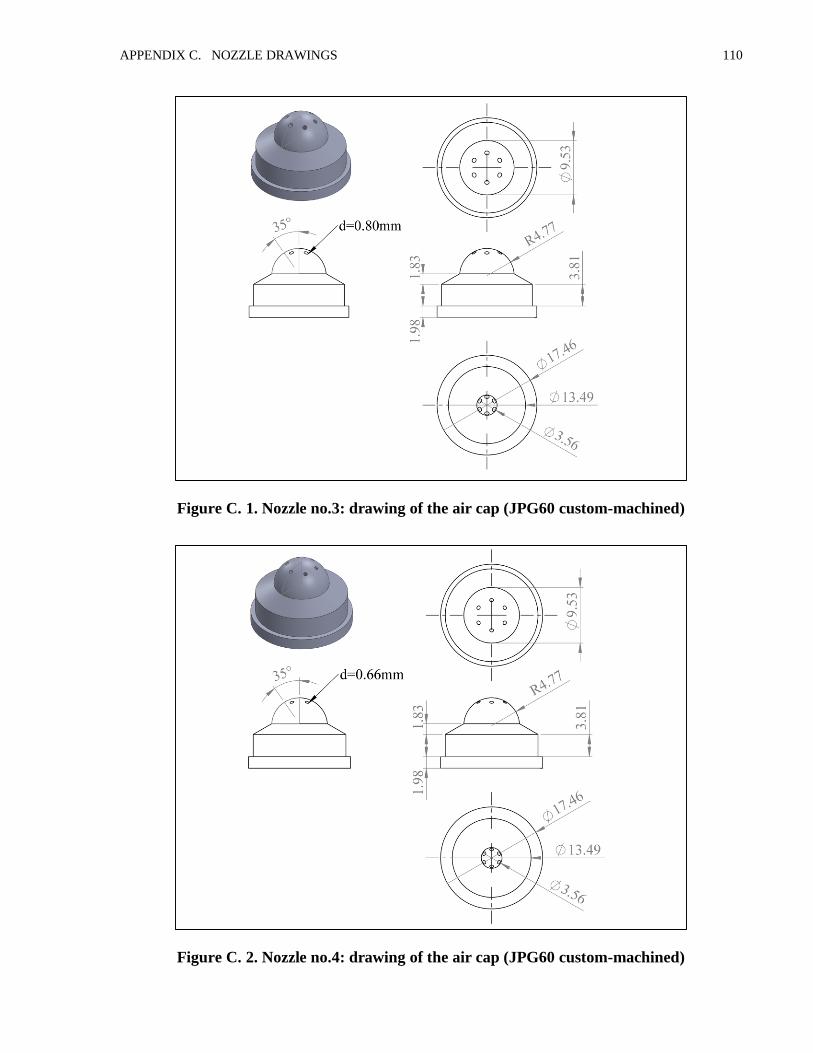
APPENDIX C. NOZZLE DRAWINGS 110
Figure C. 1. Nozzle no.3: drawing of the air cap (JPG60 custom-machined)
Figure C. 2. Nozzle no.4: drawing of the air cap (JPG60 custom-machined)

111
Appendix D
Gross Heat of Combustion

APPENDIX D. GROSS HEAT OF COMBUSTION 112
The gross heat of combustion (HHV) of batch 1 and batch 2 was measured using a Parr 6300
calorimeter as explained in the methodology. However, the calorimeter was not able to ignite bio-
oil of batch 1 in order to measure its heating value. Hence, different mixtures of bio-oil/EtOH were
used to calculate HHV of this bio-oil. As shown in Figure D. 1, the HHV values measured by the
calorimeter are plotted versus the corresponding bio-oil content (wt %) of the mixture. The HHV
of 100 wt % bio-oil is then estimated using a linear approximation and equals 17.99 MJ/kg.
Figure D. 1. HHV measurement for mixtures of bio-oil (batch 1) and ethanol
The calorimeter was able to directly measure HHV of bio-oil of this batch 2. In order to
verify whether or not the estimation used for batch 1 is accurate, the same procedure was
performed for batch 2. and the estimated HHV is compared to the measured value. Figure D. 2
depicts the plot of HHV versus bio-oil content as well as the HHV of pure bio-oil measured directly
by the calorimeter. The estimated value and the measured HHV for pure bio-oil are 18.2 and 18.31
MJ/kg, respectively, showing that the linear estimation is reasonably accurate.
Figure D. 2. HHV measurement for mixtures of bio-oil (batch 2) and ethanol
y = -1.092E-01x + 2.891E+01
R² = 9.998E-01
0
5
10
15
20
25
30
0 20 40 60 80 100
HH
V (
MJ
/kg
)
Bio-oil (wt %)
Bio-oil/EtOH mixtures
Linear (Bio-oil/EtOH mixtures)
y = -1.086E-01x + 2.898E+01
R² = 9.998E-01
0
5
10
15
20
25
30
0 20 40 60 80 100
HH
V (
MJ/k
g)
Bio-oil (wt %)
Bio-oil/EtOH mixturesPure Bio-oil (measured)Linear (Bio-oil/EtOH mixtures)