the development of a reduced glycemic load/high fiber
TRANSCRIPT

Louisiana State UniversityLSU Digital Commons
LSU Master's Theses Graduate School
2016
The Development of a Reduced Glycemic Load/High Fiber Pasta Using PulsesChristopher RinguetteLouisiana State University and Agricultural and Mechanical College, [email protected]
Follow this and additional works at: https://digitalcommons.lsu.edu/gradschool_theses
Part of the Life Sciences Commons
This Thesis is brought to you for free and open access by the Graduate School at LSU Digital Commons. It has been accepted for inclusion in LSUMaster's Theses by an authorized graduate school editor of LSU Digital Commons. For more information, please contact [email protected].
Recommended CitationRinguette, Christopher, "The Development of a Reduced Glycemic Load/High Fiber Pasta Using Pulses" (2016). LSU Master's Theses.2707.https://digitalcommons.lsu.edu/gradschool_theses/2707

THE DEVELOPMENT OF A REDUCED GLYCEMIC LOAD/HIGH FIBER PASTA USING
PULSES
A Thesis
Submitted to the Graduate Faculty of the
Louisiana State University and
Agricultural and Mechanical College
in partial fulfillment of the
requirements for the degree of
Master of Science
in
The School of Nutrition and Food Sciences
by
Christopher David Ringuette
B.S., Nicholls State University, 2013
August 2016

ii
This work is dedicated to my Lord Jesus Christ for giving me the enduring strength throughout this
journey. I would also like dedicate this research to my beautiful wife, for her love and support while
perusing this Master’s Degree. Without her help, guidance, and dedication, I would not be as advanced
in science as I am today.
iii
ACKNOWLEDGEMENTS
I would like to thank my thesis committee for their dedication and guidance throughout this process;
namely Dr. John Finley, Dr. Joan King, and Dr. Witoon Prinyawiwatukul. I would also like to thank my
wife, Dr. Ringuette, for her support. My thanks also goes to Ms. Jennifer Evanico, the LSU AgCenter
Food Incubator, Angelica Manufacturing, Dr. Witoon’s students, and the students from the School of
Nutrition and Food Sciences for their assistance in this research.

iv
TABLE OF CONTENTS
ACKNOWLEDGEMENTS……………………………………………………..………………………..iii
LIST OF TABLES……………………………………………………….……….………………………vi
LIST OF FIGURES…………………………………………………..…………….……………………vii
ABSTRACT…………………………………………………….………………………………………..xi
CHAPTER 1: INTRODUCTION AND JUSTIFICATION………………...…………………………….1
1.1: INTRODUCTION……………………………………………………………………………1
1.2: JUSTIFICATION…………………………………………………………………………….2
CHAPTER 2: LITERATURE REVIEW………………………………………………………………….9
2.1: NUTRITIONAL ASPECTS OF HEALTHY FOODS FOR THE OLDER GENERATION..9
2.1.1 Overview…………………………………………………………………………….9
2.1.2 Recommended Dietary Intakes for the Older Generation…………………………...9
2.1.3 Nutritional Aspects of Healthy Foods……………………………………………...12
2.2: BENEFITS OF HIGH FIBER AND LOW GLYCEMIC LOAD FOODS…………………15
2.2.1 Dietary Fiber……………………………………………………………………….15
2.2.2 Glycemic Load and Other Nutrients……………………………………………….16
2.2.3 Nutritional Properties of Beans and Legumes……………………………………..19
2.3: PASTA DEVELOPMENT………………………………………………………………….20
2.3.1 Improving the Nutritional Value of Pasta………………………………………….20
2.3.2 Legume-Based Pasta Development………………………………………………..20
CHAPTER 3: MATERIAL AND METHODS ………………………………………………………….24
3.1: RESEARCH PHASES………………………………………………………………………24
3.2: PHASE I – SURVEYS……………………………………………………………………...24
3.2.1 Two Market Surveys……………………………….………………………………24
3.2.2 Market Survey……………………………………………………………………...25
3.2.3 Market Survey of Pasta Items……………………………………………………...26
3.3: PHASE II – TESTING AND FORMULATION……………………………………………27
3.3.1 Testing and Formulation Variables………………………………………………...27
3.3.2 Rapid Moisture Analysis…………………………………………………………...28
3.3.3 Rapid Visco Analysis………………………………………………………………29
3.3.4 Ravioli Formulation………………………………………………………………..32
3.4: PHASE III – LARGE-SCALE DEVELOPMENT, SENSORY TEST, AND A BLIND
CONSUMER SURVEY ………………………………………………………………………...36
3.4.1 Large Scale Development………………………………………………………….36
3.4.2 Sensory Test………………………………………………………………………..37
3.4.3 Blind Consumer Survey……………………………………………………………41
CHAPTER 4: RESULTS AND DISCUSSION………………………………………………………….45
4.1: OVERVIEW AND SURVEY RESULTS…………………………………………………..45
4.1.1 Market Survey Results……………………………………………………………..45
4.1.2 Frozen Pasta Market Survey Results………………………………………………47

v
4.2: PRODUCT ANALYSIS AND TESTING…………………………………………………..48
4.2.1 Rapid Visco Analysis Results……………………………………………………...48
4.2.2 Calculated Proximate Analysis of Formulations….……………………………….54
4.2.3 The Protein Digestibility – Corrected Amino Acid Score…………………………61
4.3 SENSORY AND BLIND STUDIES………………………………………………………...64
4.3.1 Consumer Sensory Study Results………………………………………………….64
4.3.2 Blind Consumer Survey Results…………………………………………………...68
4.4: SUMMARY AND FURTHER RESEARCH……………………………………………….73
4.4.1 Summary…………………………………………………………………………...73
4.4.2 Further Research…………………………………………………………………...75
REFERENCES…………………………………………………………………………………………..78
APPENDICES…………………………………………………………………………………………..85
APPENDIX A: NUTRITION PROFILES OF BEANS…………………………………………85
APPENDIX B: MARKET SURVEY DATA……………………………………………………89
APPENDIX C: INSTITUTIONAL REVIEW BOARD APPROVAL…………………………106
APPENDIX D: AMYLOGRAPHS…………………………………………………………….110
APPENDIX E: NUTRITIONAL ANALYSIS……………..…………………………………..146
VITA……………………………………………………………………………………………………167
vi
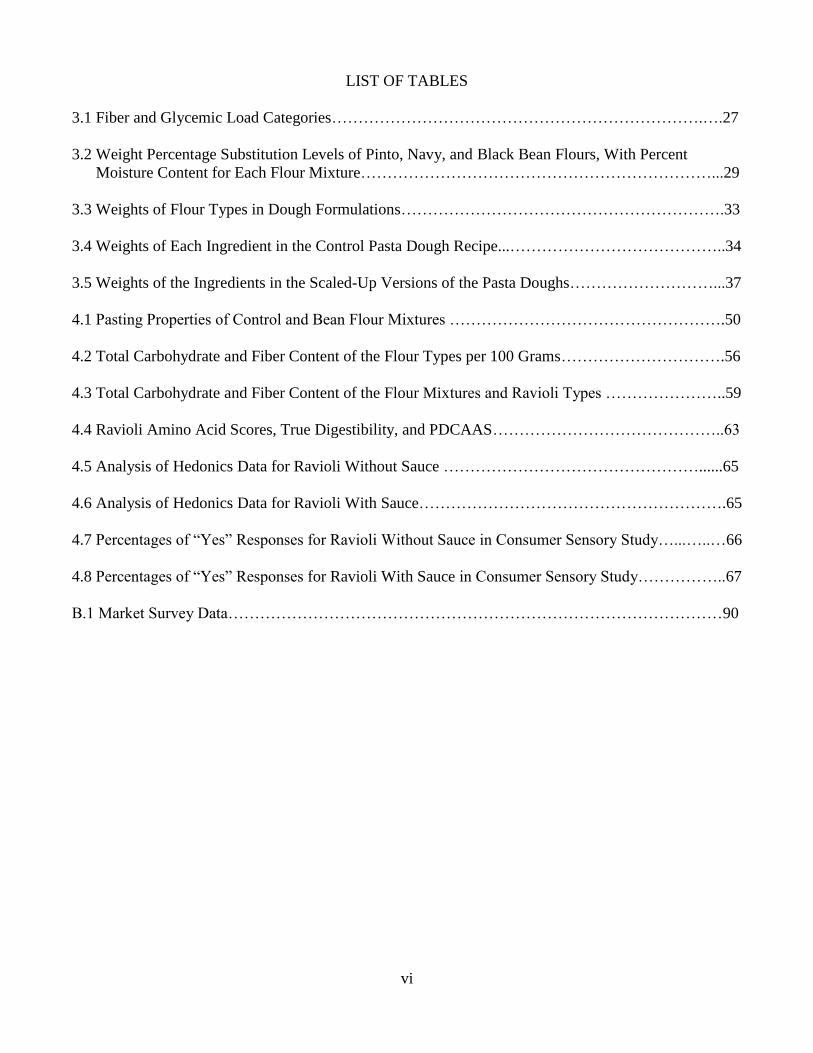
LIST OF TABLES
3.1 Fiber and Glycemic Load Categories…………………………………………………………….….27
3.2 Weight Percentage Substitution Levels of Pinto, Navy, and Black Bean Flours, With Percent
Moisture Content for Each Flour Mixture…………………………………………………………...29
3.3 Weights of Flour Types in Dough Formulations…………………………………………………….33
3.4 Weights of Each Ingredient in the Control Pasta Dough Recipe...…………………………………..34
3.5 Weights of the Ingredients in the Scaled-Up Versions of the Pasta Doughs………………………...37
4.1 Pasting Properties of Control and Bean Flour Mixtures …………………………………………….50
4.2 Total Carbohydrate and Fiber Content of the Flour Types per 100 Grams………………………….56
4.3 Total Carbohydrate and Fiber Content of the Flour Mixtures and Ravioli Types …………………..59
4.4 Ravioli Amino Acid Scores, True Digestibility, and PDCAAS……………………………………..63
4.5 Analysis of Hedonics Data for Ravioli Without Sauce …………………………………………......65
4.6 Analysis of Hedonics Data for Ravioli With Sauce………………………………………………….65
4.7 Percentages of “Yes” Responses for Ravioli Without Sauce in Consumer Sensory Study…...…..…66
4.8 Percentages of “Yes” Responses for Ravioli With Sauce in Consumer Sensory Study……………..67
B.1 Market Survey Data…………………………………………………………………………………90

vii
LIST OF FIGURES
2.1 Examples of Nutritional Graphics…………………………………………………………………...14
3.1 Correction Formula for 14% Moisture Content………………………………………………..…….30
3.2 Amylograph of the Control Flour Mixture……………………………………………………..……31
3.3 Pasta Dough Variations………………………………………………………………………………35
3.4 Sensory Evaluation Form……………………………………………………………………….……38
3.5 Blind Consumer Survey Form……………………………….…………………………………..…..43
4.1 Market Survey of the Total Number of Items in Each of the Nine Fiber and Glycemic Load
Categories………………………………………………………………………………………………..46
4.2 Frozen Pasta Market Survey of the Total Number of Items in Each of the Nine Fiber and Glycemic
Load Categories……………………………………………………………………………………….…48
4.3 Amylograph Comparison for Control and 50/50 Navy Bean Flours………………………………...51
4.4 Pasting Trends of Control and Bean Flour Mixtures………………………………………………...52
4.5 Nutrition Facts Panels for Raw Flour Mixtures……………………………………………………...57
4.6 Nutrition Facts Panels for Raw Raviolis……………………………………………………………..58
4.7 Total Voting Statistics For Blind Consumer Survey………………………………………………...69
4.8 Attribute Voting Statistics For Blind Consumer Survey……….……………………………………71
A.1 Nutritional Profile for Navy Bean Flour…………………………………………………………….86
A.2 Nutritional Profile for Pinto Bean Flour…………………………………………………………….87
A.3 Nutritional Profile for Black Bean Flour……………………………………………………………88
C.1 Approved Application for Exemption from Institutional Oversight………… ……………………107
C.2 Experimental Protocol……………………………………………………………………………...109
D.1 Amylograph for the Control Flour Mixture A…………………………………..…………………111
D.2 Amylograph for the Control Flour Mixture B………………………………………..……………112
D.3 Amylograph for the 20/80 Pinto Bean Flour Mixture A……………………...……………………113

viii
D.4 Amylograph for the 20/80 Pinto Bean Flour Mixture B………………………...…………………114
D.5 Amylograph for the 25/75 Pinto Bean Flour Mixture A…………………………...………………115
D.6 Amylograph for the 25/75 Pinto Bean Flour Mixture B ……………………………..……………116
D.7 Amylograph for the 30/70 Pinto Bean Flour Mixture A………………………………...…………117
D.8 Amylograph for the 30/70 Pinto Bean Flour Mixture B…………………………………...………118
D.9 Amylograph for the 50/50 Pinto Bean Flour Mixture A……………………………………...……119
D.10 Amylograph for the 50/50 Pinto Bean Flour Mixture B…………………………………….……120
D.11 Amylograph for the 75/25 Pinto Bean Flour Mixture A…………………………………….……121
D.12 Amylograph for the 75/25 Pinto Bean Flour Mixture B…………………………………….……122
D.13 Amylograph for the 100/0 Pinto Bean Flour Mixture……………………………………….……123
D.14 Amylograph for the 20/80 Navy Bean Flour Mixture A…………………………………………124
D.15 Amylograph for the 20/80 Navy Bean Flour Mixture B…………………………………….……125
D.16 Amylograph for the 25/75 Navy Bean Flour Mixture A…………………………………………126
D.17 Amylograph for the 25/75 Navy Bean Flour Mixture B…………………………………….……127
D.18 Amylograph for the 30/70 Navy Bean Flour Mixture A…………………………………………128
D.19 Amylograph for the 30/70 Navy Bean Flour Mixture B…………………………………….……129
D.20 Amylograph for the 50/50 Navy Bean Flour Mixture A…………………………………………130
D.21 Amylograph for the 50/50 Navy Bean Flour Mixture B…………………………………………131
D.22 Amylograph for the 75/25 Navy Bean Flour Mixture A…………………………………………132
D.23 Amylograph for the 75/25 Navy Bean Flour Mixture B…………………………….……………133
D.24 Amylograph for the 100/0 Navy Bean Flour Mixture……………………………………………134
D.25 Amylograph for the 20/80 Black Bean Flour Mixture A…………………………………………135
D.26 Amylograph for the 20/80 Black Bean Flour Mixture B…………………………………………136
D.27 Amylograph for the 25/75 Black Bean Flour Mixture A…………………………………………137

ix
D.28 Amylograph for the 25/75 Black Bean Flour Mixture B…………………………………………138
D.29 Amylograph for the 30/70 Black Bean Flour Mixture A…………………………………………139
D.30 Amylograph for the 30/70 Black Bean Flour Mixture B…………………………………………140
D.31 Amylograph for the 50/50 Black Bean Flour Mixture A…………………………………………141
D.32 Amylograph for the 50/50 Black Bean Flour Mixture B…………………………………………142
D.33 Amylograph for the 75/25 Black Bean Flour Mixture A…………………………………………143
D.34 Amylograph for the 75/25 Black Bean Flour Mixture B…………………………………………144
D.35 Amylograph for the 100/0 Black Bean Flour Mixture……………………………………………145
E.1 ‘00’ Flour Nutrient Analysis……………………………………………………….………………147
E.2 Navy Bean Flour Nutrient Analysis……………………………………………………..…………148
E.3 Control Flour Nutrient Facts Report……………………………………………………….………149
E.4 Control Flour Recipe Nutrition Summary…………………………………….……………………150
E.5 Control Flour Recipe Report……………………………………………………….………………151
E.6 50% Navy Bean/50% Control Flour Nutrient Facts Report……………….………………………152
E.7 50% Navy Bean/50% Control Flour Recipe Nutrition Summary………….………………………153
E.8 50% Navy Bean/50% Control Flour Recipe Report……………………………….………………154
E.9 75% Navy Bean/25% Control Flour Nutrient Facts Report…………………….…………………155
E.10 75% Navy Bean/25% Control Flour Recipe Nutrition Summary……………………………..…156
E.11 75% Navy Bean/25% Control Flour Recipe Report…………………………..…………………157
E.12 Control Ravioli Nutrient Facts Report……………………………………………………………158
E.13 Control Ravioli Recipe Nutrition Summary………………………………………………………159
E.14 Control Ravioli Recipe Report……………………………………………………………………160
E.15 50% Navy Bean/50% Control Ravioli Nutrient Facts Report…………………….………………161
E.16 50% Navy Bean/50% Control Ravioli Recipe Nutrition Summary………………………………162

x
E.17 50% Navy Bean/50% Control Ravioli Recipe Report……………………………………………163
E.18 75% Navy Bean/25% Control Ravioli Nutrient Facts Report……………………………………164
E.19 75% Navy Bean/25% Control Ravioli Recipe Nutrition Summary………………………………165
E.20 75% Navy Bean/25% Control Ravioli Recipe Report……………………………………………166

xi
ABSTRACT
The use of beans in the human diet provides an excellent source of dietary fiber and has potential
for lowering glycemic load. Prepared meals with high levels of dietary fiber and low glycemic loads
were found to be rare in a market survey of nine stores with various price points in the greater Baton
Rouge area. The majority of the prepared meals found fell into low or medium fiber categories with
medium to high glycemic loads. This indicates a need to increase the fiber level and decrease the
glycemic load in popular foods. The purpose of this research is to accomplish these changes in prepared
meals by substituting a portion of the standard pasta flour with bean flour.
Various mixtures of pinto bean, navy bean, black bean, enriched semolina, and “00” flours (a
high-gluten red spring wheat flour) were tested using a standard Rapid Visco Analysis method and the
visco-elastic properties were compared with the control flour. The addition of navy bean four to the
control flour was found to produce a composite flour with a similar texture at 25%, 30%, and 50%
substitution levels. A calculated proximate analysis was performed on three ravioli produced: a control,
a 50%, and a 75% navy bean ravioli. A 14% DV and a 21% DV increase in dietary fiber were predicted
for the 50% and 75% navy bean ravioli, respectively. A seven and a ten gram decrease in glycemic load
were predicted for the 50% and the 75% navy bean ravioli.
The three ravioli types were also subjected to a sensory study with 103 participants. It was found
that the color, texture, aroma, appearance, and liking preferences were not significantly changed by the
substitution of navy bean flour at a 50% substitution level (α = 0.05). These characteristics of
commercially available frozen pasta meals were also measured with a blind consumer survey of
consumers ages 65 and older. The predominant unsatisfactory characteristics found were texture and
color. In comparison, the texture and color were not significantly altered by the 50% substitution of navy
bean flour in the ravioli sensory study.

1
CHAPTER 1: INTRODUCTION AND JUSTIFICATION
1.1: INTRODUCTION
The purpose of this research is to increase the fiber content of frozen pasta meals by
replacing a portion of the standard pasta flour with bean flour. Chapter 1 is an introduction to the
structure of the document and justifies the importance of the given purpose. Chapter 2 presents a
review of the literature available concerning the health benefits of a diet high in dietary fiber and
glycemic load. The third chapter describes the methodology of the experimental process, while
the analysis of the data collected is discussed in Chapter 4. A summary of the research and
suggestions for further research are also included in the last chapter.
This first chapter presents a brief description of the research and its justification. The
topics of each chapter are summarized, providing an introduction to the overall field. A specific
range of options were chosen to test. Justification for these choices is provided in the second
section of this chapter. A basic background of the pertinent topics is also included in the
discussion of these choices.
The second chapter discusses various aspects of using beans to fortify foods. The
nutritional structure of beans provides a balance of soluble and insoluble dietary fiber, resulting
in a food that is high in fiber and low in glycemic load (Appendix A). Combining beans with
whole grains also improves the protein quality of the food (Pulse Canada, 2011). The benefits of
a diet that is high in dietary fiber, high in protein, and low in glycemic load are also discussed,
with a focus on the diets of consumers ages 65 and older. A few examples are given of
experiments done to fortify pasta with various bean flours. The various analysis methods used in
this experiment are also discussed in Chapter Two.

2
In the third chapter of this thesis, the materials and methods used in the experiment are
described in detail. The experiment was performed in three stages. The first stage consisted of
two market surveys and a blind consumer survey. Next, various mixtures of enriched semolina
flour, “00” flour, navy bean flour, black bean flour, and pinto bean flour were tested for
compatibility. Based on the results of these tests, three mixtures were chosen for formulation into
cheese-stuffed ravioli in the final stage of the research. A consumer sensory study was then
executed with these ravioli blends, thus concluding the research.
In Chapter Four, the results of the various tests are presented and discussed. The structure
of the analysis of the market surveys is given and discussed. The results of the blind consumer
survey and flour mixture testing are also presented. The results of a calculated proximate
analysis of the three ravioli blends chosen for the sensory study are outlined, and the statistical
analysis of the results from the sensory study is discussed. In conclusion, implications of the
results presented are explained and suggestions for further research are given.
Based on the research in the following pages, it is recommended that further research use
beans and legume flour in the development of new pastas. The superior nutritional profile of
milled bean flour presents an opportunity to improve the nutritional content of the pasta products
currently available in the market. The benefits of a diet high in fiber and low in glycemic load
also justify the modification of these products. The development of high fiber low glycemic load
foods will raise the standard of tomorrow’s recipes.
1.2: JUSTIFICATION
The creation of new healthy types of food as well as the improvement of existing foods
has been become a popular trend over the past years. One of the questions that is asked when

3
looking at food options is, “What are some ways to make food healthier?” When the consumer is
looking for a healthier alternative in a food product, one of the variables that is often considered
is the amount of dietary fiber that is contained in the food. In various societies today, there are
diets that emphasize foods that are higher in fiber or lower in glycemic load (GL). One particular
diet that focuses on higher fiber levels is the beans-only diet. Beans-only diets, such as the baked
bean diet, pair vegetables and grains like whole grain breads, brown rice or barley with a number
of different legume types. Beans are now thought to help both improve nutrition, such as
increase the protein and dietary fiber, while encouraging healthy weight loss (Kerns, 2015).
Another question that is asked is, “How is one particular food product of choice lower in
glycemic load or higher in fiber than the alternative?” As theses terms are defined, this question
will be explained. Glycemic load is interpreted as the product of the average glycemic index (GI)
of carbohydrate foods consumed and the total carbohydrate intake over a specified time period
(Monro and Shaw, 2008). In conjunction with this definition, glycemic index can be defined as a
numeric value based on the blood sugar response caused by the carbohydrate consumed
(Mendosa, 2008).
According to the Food and Drug Administration (FDA), nutrients are classified as either
high or low based on percent daily value of the prescribed consumption. If the percent daily
value (%DV) is greater than or equal to twenty percent of the total prescribed consumption
(%DV ≥ 20), the amount of the nutrient is considered to be “high” in that product (FDA 2015).
In comparison, it is defined that a value less than or equal to five percent of the DV (%DV ≤ 5),
the product would be considered “low” in value (FDA.gov). In accordance with these
definitions, fiber levels have high (%DV ≥ 20) and low (%DV ≤ 5) values. For the purpose of
this research, we define a medium fiber level to be between 6 - 19 %DV.

4
Current literature defines a low glycemic load to be below 11 grams per serving and a
high glycemic load as greater than 20 grams per serving. This research is concerned with
increasing the fiber content of pasta products while decreasing the glycemic load by substituting
beans for a portion of the pasta flour. Although the fiber content of a product is used to calculate
the glycemic load of the same product, these two characteristics are considered independently in
the data analysis reported in Chapter 4.
With the advancement of different diets, both low glycemic load and high fiber content
have shown to help manage the risk of diseases. According to the World Health Organization,
more than half the deaths in the world are due to non-communicable disease (NCD). Diseases
such as cardiovascular disease, type 1 and type 2 diabetes, Hypercholesterolemia, and increased
body weight have fallen into the category of NCDs (Siddiq and Uebersax, 2012). With a rise in
deaths due to NCDs, human nutrition plays a critical role the health of individuals. The use of
dry beans in the diet can help individuals manage blood glucose levels, assist with fiber
deficiencies, and present an individual with a good source of protein.
The target demographic for this thesis is centered on consumers ages 65 and older. It also
included “baby boomers”, one of the largest population segments who are susceptible to age
related conditions. The reason for this range is the significant increase in NCDs in the population
suffering from high cholesterol, type two diabetes, and obesity. Research also shows decreased
risks of cardiovascular disease, obesity, and other non-communicable diseases in individuals
who followed a low glycemic and or high fiber diet. Demographics show that individuals 65
years of age and older are the fastest-growing segment of the population and contribute for the
majority of cardiovascular disease (CVD), morbidity, mortality, and health care expenditures
(Mozaffarian, 2003). Although the youth of today will be the next individuals who need to

5
maintain a balanced diet, the focus for this research is directed to seniors because of the risk of
diabetes, CVD, cancer, and the lack of necessary fiber in their diets.
Beans and legumes in the human diet have been shown to be an excellent source of
dietary fiber and a factor in lowering glycemic load (Messina, 1999). Beans, correctly referred to
as Phaseolous vulgaris L., are the major type of ingredient within the heart of this research
(Hangen and Bennink, 2002). There are many different types of beans and legumes that qualify
as low glycemic high fiber ingredient. Lentils have shown to be both a good source of fiber and
have a low glycemic load. Pinto beans, as well as navy beans, have also been shown to be a
good sources of fiber (Geila and Anderson, 2013). Pinto beans in the raw state contain 21.04
%DV fiber and 23.8 %DV of protein per serving. The fiber level of navy beans is higher by
2.56%, totaling approximately 19.1 grams of fiber per serving, with a slightly lower level of
protein (Appendix A).
In this research, the focus is on higher levels of fiber, not protein, although protein in the
diet is also important to seniors (Health.gov, 2010). The focus of this work is partially justified
based on a study completed with two groups of subjects with type two diabetes, where each
group was fed different amounts of fiber. One group ate a diabetic type of diet with a total of 24
grams of fiber/day, while the other group ate a diet consisting of 50 grams of fiber/day. The
group of people who ate the diet higher in fiber had lower levels of both plasma glucose (blood
sugar) and insulin (the hormone that helps blood sugar get into cells). The individuals with the
higher fiber diet also reduced their total cholesterol by nearly 7%, their triglyceride levels by
10.2%, and their Very Low Density Lipoprotein (VLDL – the most dangerous form of
cholesterol) levels by 12.5% (Mateljan, 2008). By simply increasing fiber intake, the
experimental group received several health benefits.

6
The development of a legume based pasta product was chosen based on the large
consumption of pasta products in the U.S and the lack of high fiber pasta choices in the market.
In today’s market there are many different types of dried and frozen pastas on the shelf. Most of
the pasta products that are sold in the market today are made from blends of semolina and durum
wheat flour. Some dried pasta choices include vegetables, including carrots, spinach and beets.
Some specialty products on the store shelf, such as the gluten free section of the market, included
dried bean pasta and rice pasta options. There are virtually no frozen products with beans or
vegetables as shown in the market survey in Chapter 3. There also do not appear to be any pasta
products that are both high in fiber and low in glycemic load. The goal of this research was to
fortify the pasta with a percentage of milled bean flour.
Flour from milled beans provides several advantages over pre-gelatinized bean flour. One
of the benefits of milled bean flour is that there is less loss in micronutrients and fiber levels
because the beans are milled from the raw/dried state. Some nutrients are lost in the cooking
process to produce pre-gelatinized bean flour.
One of the most common forms of pasta in the market is ravioli. Most of the options for
ravioli can be found in the frozen section with some choices in the refrigerator section and one or
two options in a dry form. The market survey illustrates that ravioli pasta only contained a
traditional blend of durum wheat and semolina or a vegetable and wheat blend. Thus, an
alternative type of frozen ravioli offers new product opportunity.
The composition of pasta products in general is not complicated. Most formulas for
ravioli include five basic ingredients; flour, oil, egg as a binder, and salt to taste. An important
factor in pasta production is the formation of an elastic dough from the two proteins within wheat
gluten. When gluten is hydrated and blended in pasta dough, a complex matrix is formed. Studies

7
show that when the gluten proteins interact with the starch in the wheat flour, a continuous
proteinaceous matrix is formed (Shewry et al, 2002) The downside to pasta made from
traditional flours such as enriched semolina flour and unbleached white wheat flour is that the
product is generally high in total carbohydrates and low in dietary fiber. Bob’s Red Mill
Semolina Flour contains 31 grams of total carbohydrates and 2 grams of dietary fiber per ¼ cup
serving (42 grams). In comparison, Antimo Caputo "00" Chef's Flour, a soft wheat flour,
contains 23 grams of total carbohydrates and less than 1 gram of fiber per ¼ cup serving (30
grams). Most pasta on the store shelf that is available for the consumer contains both types of
flour. Traditional pasta is has a medium to high glycemic load and low to medium fiber content.
However, there are companies similar to Best Cooking Pulses that offer flours, produced from
beans and legumes, as an alternative to traditional flour. The reasons that most people remove
traditional wheat flour would either be for personal health choices or the individual might be
faced with an intolerance to gluten. The analysis of the flours used in this work is based on their
total carbohydrates, dietary fiber, protein content, and gelatinization profile.
The types of beans studied in this thesis are pinto beans, navy beans, and black beans. In
each analysis shown, these beans are introduced in the form of milled flour. As described before,
digestible carbohydrates are defined as the difference between the total carbohydrates and the
dietary fiber. Although bean flours are high in fiber, they are also high in fermentable
carbohydrates resulting in a low glycemic load (low digestible carbohydrate) level. The question
posed is how to develop a pasta product with a percentage of the bean flour and a mixture of
gluten flours that delivers a medium to high fiber content and a low glycemic load.
The bean flours tested in this experiment were pinto bean, navy bean and black bean.
Most types of pasta have a yellow to light brown color. Black bean pasta was eliminated in favor

8
of the lighter color pinto and navy bean flours. Various levels of substitution of the bean flours
were tested with standard methods, as described in Chapter 3.
Part of the first phase of this research project took place in a descriptive market setting,
where the products observed are classified by fiber content and glycemic level based solely on
their nutrition labels. Within this first phase, a sample of the target population was also surveyed
based on the availability of frozen pasta meals in the market setting. The second phase of this
research began with testing the moisture and starch properties of different wheat and bean flour
mixtures. The testing of these different flour mixtures lead to the formulation of various pasta
doughs, each containing a substitution with these flours. In the third and final phase of the
project, the final formulations were produced. A consumer sensory test was then conducted using
college students and faculty representing a sample of the population. In order to determine the
best pasta dough to use in the construction of the bean ravioli product, the results of the
consumer survey were analyzed. This process completes phase III and is discussed in Chapter 4.
In summary, it is common among this new generation to try various types of diets to
obtain the goal of a healthy living. Through research, it has been shown that a diet with low
glycemic load and medium to high fiber levels reduces the risk of different types of diseases. It
has also been shown that beans like navy beans and other legumes can be used in different ways
to facilitate more fiber in the diet. When an individual incorporates more fiber into their diet
from beans, the glycemic load will also decrease due to the fermentable carbohydrates that are
provided by the bean itself. Knowing that beans provide such a benefit, the challenge will be to
develop a food product that is both familiar and appealing to individuals, but will also help with
the health concerns. This proposed research will demonstrate the development of bean ravioli
using navy bean flour.

9
CHAPTER 2: LITERATURE REVIEW
2.1: NUTRITIONAL ASPECTS OF HEALTHY FOODS FOR THE OLDER GENERATION
2.1.1 Overview
Individuals ages 65 years and older may consume a lower calorie diet due to limited
mobility and decreased appetite; however, they require adjusted levels of essential nutrients.
Higher quality meal choices become important for this population as they age. This need is in
line with recent trends in food research emphasizing the production and availability of healthier
foods in the market, as evidenced by the increasing variety of alternative food choices. Pasta is
one of the food types in the market that is consumed in the most varied locations. Pasta is
considered unhealthy due to its generally high carbohydrate, low fiber, and low protein content.
This nutritional profile can be improved by fortifying the pasta with pulses such as chickpea,
pinto bean, and navy bean flours.
2.1.2 Recommended Dietary Intakes for the Senior Citizens
The older generation is diverse, ranging in activity levels, health condition, and lifestyle
coming from all walks of life. One overall trend observed with this group is the desire to live an
enjoyable life without unmanageable health issues. Seniors increasingly see the importance of
food choices and the effects on their quality of life (Costa and Jongen, 2010). However, seniors
also face increasing nutritional challenges. As these individuals pass the age of 50, the
recommended dietary intakes change for several food categories, making it more difficult to get
the correct balance of nutrition described below. Consequently, the gap between these
recommended consumptions and the actual intakes is large (Blumberg, 1997).

10
Many older individuals also note a decrease in appetite due to medications, a change in
taste or smell, or problems with dentures (National Institute on Aging, 2016). Others may simply
note a decrease in appetite with no apparent medical reason. In addition, they face the challenge
of maintaining a healthy level of exercise and daily activity with possibly decreasing ranges of
motion, which is necessary to maintain a healthy lifestyle (Lichtenstein et al, 2006). Another
complication is a decrease in expendable income. In light of these issues, the older generation
faces the challenge of eating higher quality food on restricted budgets and with increasing health
issues.
The recommended calorie intake for seniors decreases by 200 calories between the ages
of 51 and 61, depending on the activity level and the gender (USDA, 2016b). This decrease
corresponds to excluding three medium eggs, 16 ounces of coca-cola, or one ounce of butter per
day. This change is not large, but additional decreases in calorie intake are recommended for
individuals who would benefit from weight loss. Moderate weight loss due to low calorie intake
levels has been shown to improve hyperinsulinemia, cardiovascular risk factors, and a myriad of
other improvements (Numata et al, 1993; Wing et al, 2011; Wadden and Stunkard, 1986).
Many older individuals are considered at risk for cardiovascular disease. Another way to
decrease this risk is to decrease the intake of dietary cholesterol to less than 200 milligrams per
day, instead of the normal limit of 300 milligrams. This decrease of 100 milligrams is
approximately equivalent to three medium blueberry muffins, two-fifths of a stick of butter, or
one piece of fried chicken. Not only is the amount of cholesterol intake a factor in heart health,
but also the source. Whole grains are the recommended source of dietary cholesterol to protect
against coronary heart disease, the leading cause of mortality in America (Hu and Willett, 2002).

11
As individuals pass the age of 50, the recommended fiber intake decreases from 38
grams of fiber to 30 grams of fiber per day (USDA, 2016a). The amount of dietary fiber
consumed is closely associated with the glycemic load of the food product and the rate of
digestion. Research has shown that a diet high in dietary glycemic load is associated with an
increased risk of cardiovascular disease (Linus Pauling Institute, 2016). Similarly, a diet low in
dietary fiber has been positively correlated with an increase in coronary heart disease (Pereira et
al, 2004). This leads to the recommendation to follow a diet with a decreased glycemic load and
increased dietary fiber content for the older population.
However, it does not follow that foods should be considered simply by their glycemic
load. Other factors, such as the individual’s insulin resistance, total carbohydrate content, fiber,
and other nutrients should also be considered when selecting foods for a healthy diet (Hu and
Willett, 2002; Committee on Diet and Health, 1989). For example, it is also recommended that
individuals ages 50 and older increase their intake of vitamin B12 (Health.gov, 2010). Also, older
individuals have the same recommended dietary fat intake as younger adults, but are
recommended to receive this dietary fat in the non-hydrogenated unsaturated form to decrease
risk of coronary heart disease (Hu and Willet, 2002). The recommended protein intake for older
individuals remains an unsettled issue.
As a population at increased risk for cardiovascular diseases, the older generation faces a
myriad of recommendations and limitations on their diets. These include decreasing calorie,
sodium, and dietary cholesterol intake, decreasing glycemic load, and choosing non-
hydrogenated unsaturated fats. Combined with possible pre-existing medical conditions, these
dietary changes can make a healthy lifestyle seem difficult at best. In an effort to educate the

12
industrialized population in these areas, several new visual methods have been studied to portray
the health of various types of foods.
2.1.3 Nutritional Aspects of Healthy Foods
Several nutritional metrics have been developed in an effort to help the industrialized
population choose healthy foods to include in their diets (Food and Drug Administration, 2008).
The nutrition facts label, nutritional target map, caloric ratio pyramid, nutrient balance indicator,
and other nutritional aids portray different aspects of the nutritional quality of that item. There
has also been an effort in research to further identify unhealthy components of foods and unsafe
preparation practices. These informational metrics and research efforts can increase the quality
of life for older individuals.
The Food and Drug Administration (FDA) maintains the standardization of the Nutrition
Facts Label required on all processed foods in the market (Figure 2.1a). This label gives the
serving size and the nutritional profile for each serving. This profile includes the calorie, total fat,
fat components, cholesterol, sodium, total carbohydrate, dietary fiber, sugars, protein, and
vitamin content as required by the FDA. Percent daily values of each nutritional component are
calculated based on a 2000 calorie diet (Health.gov, 2010). Although this label is the standard of
nutrition labels in the market, it can be difficult for consumer to make decisions based on the
information it provides. Spatial representations of this information tend to increase the ease of
decision-making processes.
The Nutritional Target Map was developed and copyrighted by nutritiondata.self.com to
provide additional nutritional indices to consumers in a spatial context (Figure 2.1b). One of
these indices gives a numerical value representing the overall nutrient density of the food. A

13
higher value for this indicator implies a more nutritious food product. Such nutrient-dense foods
include vegetables, fruits, nuts and seeds. The second index given in the nutritional target map
gives a numerical expression for the caloric density of the food. A higher index of caloric density
means a more filling food, such as vegetables, fruits, tea and water. The nutritional target map
gives a spatial representation of these indices, thus aiding the consumer in choosing the proper
types of foods for proper weight management, gain, or loss as desired (Johnson, 2005).
The Caloric Ratio Pyramid also gives a spatial representation of various components of
the food’s nutritional profile (Figure 2.1c). This metric shows how the calorie sources of the food
are related. The top portion of the pyramid correlates to foods where the calories are completely
sourced from fats. The bottom right corner of the pyramid is where protein contributes all of the
calories of the food. Carbohydrates provide all of the calories in foods found in the bottom left-
hand corner of the caloric food pyramid. This graphic is yet another aid for assisting the older
generation in choosing foods aligned with their nutritional needs.
The nutrition data website, nutritiondata.self.com (2016), uses another type of graphic to
represent the density of each nutrient component analyzed (Figure 2.1d). The Nutrient Balance
Indicator includes the levels of protein, dietary fiber, twelve vitamins, nine minerals, saturated
fat, cholesterol, and sodium. These nutrient types are represented as color-coded spokes on a
radial diagram. The density of each nutrient is represented by a filled portion of the spoke for
that nutrient. A score based on these densities is also given in the graphic to help the consumer
rank foods based on the composite nutrient profile. It is recommended to use this graphic to
compile recipes resulting in a balanced nutritional profile (Nutritiondata.self.com, 2016).
The distribution of protein types is shown by a similar graphic copyrighted by
nutritiondata.self.com (2016). The Protein Quality graphic also uses radial spokes to show the

14
density of each type of protein in the food item (Figure 2.1e). These proteins include tryptophan,
threonine, isoleucine, leucine, lysine, methionine, cystine, phenylalaline, tyrosine, valine, and
histidine. Methionine and cystine share a spoke on the radial diagram, as do phenylalaline and
tyrosine. The maximum value for each spoke is based on the “amino acid profile recommended
by the Institute of Medicine’s Food and Nutrition Board” (nutritionself.data.com, 2016). The
amino acid score for the food item is also presented at the bottom of the graphic, but has not been
adjusted for the digestibility of the item since the digestibility not only depends on the food
itself, but also on the method of preparation.
Figure 2.1 Examples of Nutritional Graphics. Nutrition Facts panel (a), Nutritional Target Map
(b), Caloric Ratio Pyramid (c), Nutrient Balance Indicator (d), and Protein Quality (e) for a
serving of raw apple slices. All graphics copyrighted by www.nutritiondata.com.
The variety of nutritional graphics discussed above provides an intricate view of the
nutritional profile of foods on the market. These aids, and others, can be used to assess the
a b c
d
e

15
nutritional adequacy and quality of the foods in question. However, these aids do not account for
unexpected ingredients or unsafe food practices. As the body of knowledge on these topics
increases, these variables are increasingly monitored in literature. These efforts include surveys
on the presence of plastics, inorganic compounds, and heavy metals in foods, as well as an
emphasis on safe food practices (Fankhauser-Noti et al, 2006; Radwan and Salama, 2006;
Shogren et al, 1999; Schoof et al, 1999). Altogether, the current body of research thoroughly
emphasizes ease of use of the nutritional profile of the available foods and their safety.
2.2: BENEFITS OF HIGH FIBER AND LOW GLYCEMIC LOAD FOODS
2.2.1 Dietary Fiber
The demographic most vulnerable to diseases (other than young children) are individuals
ages 65 and older. Adults in this category commonly deal with osteoporosis, arthritis, heart
disease, cancer, respiratory diseases, diabetes, and many other health issues (Vann, 2015). A diet
high in fiber, low in glycemic load, and high in quality protein can help improve several of these
health issues and increase the quality of life. The benefits of these components in a diet are
described in this chapter. A review of the standard methods used to develop foods with these
properties is given, along with a discussion of a sample of products described in literature.
Dietary fiber is found in varying levels in different types of legumes. In general, most
legumes are a good source of total dietary fiber. Total fiber is the combination of soluble and
insoluble fibers. The soluble fiber is found in foods including fruit, nuts, oats, and legumes.
Insoluble fiber comes from the part of the plant that does not dissolve in water, including cell
walls. Legumes as a whole contained a greater proportion of water insoluble to soluble fiber
(Khan, 2007). These two types of dietary fiber assume different roles during digestion. Soluble

16
fiber tends to slow digestion by turning into a gel as it absorbs water. Insoluble fiber tends to aid
the digestion process. From these two main categories of fiber, researchers have shown that the
soluble portion of fiber “can reduce the risk of coronary artery and stroke.” The insoluble portion
of the fiber is used “to treat digestive problems such as constipation, hemorrhoids, chronic
diarrhea, and fecal incontinence” (Wald et al, 2013). The presence of soluble fiber in appreciable
amounts also tends to stabilize blood sugar levels in the consumer.
In edible beans, the dietary fiber is made up of 70 percent insoluble dietary fiber (IDF)
and 30 percent soluble dietary fiber (SDF). One can conclude that since beans and legumes are
higher in insoluble dietary fiber than wheat flours and other simple carbohydrates, there is a
better chance for individuals to not experience digestive problems. The use of beans in the
human diet is important and becomes more diverse when edible beans are milled into flours. One
study was completed on bean pasta with the use of milled green pea, yellow pea, chickpea and
lentil milled flours. These pasta products were fortified up to 30% using the milled flours to
produce spaghetti pasta (Zhao, 2005).
Of different types of beans grown today, navy beans are described as, small, pea-sized
beans that are creamy white in color. They are mild-flavored beans that are dense and smooth.
Like other common beans, navy beans are one of 13,000 species of the family of legumes, or
plants that produce edible pods. Combined with whole grains such as rice, navy beans provide
virtually fat-free high quality protein (Mateljan, 2008).
2.2.2 Glycemic Load and Other Nutrients
The presence of a balance of dietary fiber is important in a healthy diet, but is not enough
alone. A healthy diet also includes foods with a low glycemic load. The glycemic load of foods

17
can be calculated using the glycemic index. It is “the glycemic index divided by 100 and
multiplied by its available carbohydrate content (i.e. carbohydrates minus fiber) in grams”
(Mendosa, 2008). Glycemic index is defined as the bodies blood sugar response to the food
consumed. If this information is not available, the glycemic load of a food can be approximated
by finding the amount of digestible carbohydrates, which is the difference of the total
carbohydrates and the dietary fiber expressed in grams (Liese, 2005).
The digestible carbohydrates calculated using this method may also include resistant
starch, which would decrease the amount of digestible carbohydrates in the food. Resistant starch
is “the fraction of dietary starch which escapes digestion in the small intestine” (Sajilata et al,
2006). Although normally categorized as dietary fiber, it is possible that remnants of resistant
starch are included as digestible carbohydrates due to the difficulty of the approved classification
tests (Nielson, 2010). Legumes typically include type I resistant starch, but the resistance is
minimized when the legumes are milled. Since the amylose in the flour becomes retrograded in
the pasta production process, fortified flours also contain type 3 resistant starch. Resistant
starches have been shown to decrease risk of colonic cancer, improve metabolic control in type II
diabetes, reduce the incidence of gallstones, improve cardiovascular health, and could also
improve absorption of calcium and iron in the intestines (Morita et al, 1999; Raben et al, 1994;
Reader et al, 1997; Malhotra, 1968; Martinez et al, 2004; Morias et al, 1996).
As emphasized in the previous chapter, both glycemic load and glycemic index are
important when selecting the diet of individuals. A study conducted at Oregon State University
suggests that the management of glycemic load and the consumption of foods with lower
carbohydrate levels can lead to disease prevention. High glycemic load diets have been
associated with an increase in type 2 diabetes mellitus and are also likely contributors of

18
cardiovascular disease, gallbladder disease, and some types of cancer. In contrast, a diet low in
glycemic load has contributed to a greater weight loss in obese individuals (see Higdon, 2005,
and references therein). In addition to a high level of insoluble dietary fiber and a low glycemic
load, it is also recommended that a healthy diet for adults include 0.8 grams of protein per
kilogram of human body weight per day.
As adults age, the protein requirement increases to almost 1.3 grams (Kammer, accessed
3/12/2016). Proteins are made up of various types of amino acids. Amino acids are classified as
either essential (required from food) or non-essential amino acids (those synthesized in the
body). The quality of the protein in the food is based on the composition of amino acids in the
food and the digestibility of the protein. The Protein Digestibility – Corrected Amino Acid Score
(PDCAAS) method is the standard used to estimate the protein quality (Nielson, 2010). A study
on protein quality substituted navy bean flour for sesame seeds to investigate the effect on the
amino acid profile and the amount of protein (Boloorforooshan and Markakis, 1979). This
information, combined with the true digestibility of the food, can be used to calculate PDCAAS.
A diet high in fiber, low in glycemic load, and high quality protein has numerous
benefits, especially to the older demographic. High levels of dietary fiber, especially insoluble
dietary fiber, aid digestion and tend to stabilize blood sugar levels. The consumption of foods
low in glycemic load has been associated with weight loss and disease prevention. It is also
recommended that the calorie intake for all adults be composed of 10% to 35% protein, or 0.8
grams of protein per kilogram of human body weight per day (Health.gov, 2010; Godman,
2014). Due to these benefits, foods high in dietary fiber, low in glycemic load, and high in
protein are considered healthy food choices. Therefore, the goal of this research was to increase
the nutritional value of prepared meals that the older generation finds appealing. One way to

19
lower the overall glycemic load of a diet is to increase the consumption of legumes in place of
other carbohydrates (see Higdon, 2005, and references therein). This method also increases the
fiber and protein levels in the diet.
2.2.3 Nutritional Properties of Beans and Legumes
Dry beans, which are members of the legume family, have been shown to be a good
source of protein with high levels of fiber. The increased consumption of beans in the diet has
also been shown to decrease the risk of cardio vascular disease (CVD), diabetes, heart disease,
and stroke (Siddiq, 2013). In knowing that the increased amounts of beans can help decrease the
risk of CVD, the quantity of intake is also important. A study conducted with 10,000 adults
showed that when eating beans 4 or more times a week they had a lower risk of developing
diseases than people who did ate less often (Bazzano, 2001)
The legume family, as a whole, has been shown to contain a larger amount of insoluble
fiber than soluble fiber, making legumes an easily digestible food (Khan, 2007). A recent study
showed that 69 to 70% of the fiber in the edible part of beans was insoluble dietary fiber with the
remaining 30 to 31% as soluble fiber (Kleintop, 2013). For example, navy beans are described as
small, pea-sized beans that are creamy white in color, mild-flavored, dense and smooth.
Combined with whole grains such as rice, navy beans provide virtually fat-free high quality
protein (Mateljan, 2008). The inclusion of beans in the diet has several benefits, but when
legumes are ground into flours, the potential application of the edible bean becomes more
diverse. Namely, it becomes possible to use bean flours to fortify the standard flours in pasta
products.

20
2.3: PASTA DEVELOPMENT
2.3.1 Improving the Nutritional Value of Pasta
In this day and age, pasta has been looked at as unhealthy and a food rich in
carbohydrates. According to researchers, not all carbohydrates that are used in the formulation of
pasta dough are unhealthy. One common trend in product development is to replace the rapidly
digested carbohydrates in pasta, such as those from sugars, with healthier carbohydrate sources,
such as protein and fiber, to obtain a higher nutritional value in pasta (Shogren, 2006). In some
cases, this substitution also has other beneficial effects, such as lowering cholesterol and sodium.
These improvements can help offset pasta’s ‘bad reputation’ as a high carbohydrate food
(Ipatenco, 2015). Whole grains, oat, and barley meal pasta varieties are only a few of the
substitution choices that are already available on the market (Haris, 2015). Research concerning
the formulation of pasta shows the substitution of traditional wheat flour with an alternative flour
to have a beneficial change on the nutritional values of the final product.
2.3.2 Legume-Based Pasta Development
The effects of substitution of bean flour in place of other flours have been tested in
several instances. The cases discussed here involve the fortification of pasta products. In one
such project, a group of researchers from the University of Saskatchewan fortified wheat flour
with white pea flour to create dried spaghetti noodles. After rehydration, an increase of 22% in
protein levels in the pasta was observed when compared to 100% wheat flour pastas (Nielson et
al, 1980). This study shows that when fortifying pasta with other flours, like beans and legumes,
the final product will have higher levels of protein due to the larger protein content of beans and
legumes. The protein quality of legumes can be further improved by combining legume flours

21
with complimentary ingredients, such as sesame and wheat flour, although these effects depend
on the processing the ingredients are subjected to (Boloorforooshan and Markakis, 2006;
Gimenez et al, 2013; Azlan et al, 2011; Kavitha and Parimalavalli, 2014).
Another product experiment performed at North Dakota State University examined the
fortification of spaghetti using different legume flours. Four different legume flours were
substituted into 100% semolina flour at various substitution levels. The varieties of legume flour
used were green pea, yellow pea, lentil and chickpea flours at substitution levels of 5%, 10%,
15%, 20%, and 30% of each type of legume flour. In this study, commercial post processing
equipment was used for the extrusion of the pasta dough to form the dried spaghetti. The pasta
was then cooked and tested for chemical composition, texture, and color. An increase in the level
of legume substitution was found to cause an increase in firmness, pulse flavor, and color
intensity of the pasta. However, the elasticity and overall quality of the product decreased at
higher substitution levels. Results from a consumer sensory study showed that consumers
preferred the spaghetti with 100% semolina flour, but also found the 15% lentil, 20% chickpea,
and 20% yellow pea flour blends to be acceptable (Zhao et al, 2005). Other sensory studies also
showed low substitution levels of legume flours to be acceptable (Gimenez et al, 2012; Sabanis
et al, 2006).
The fortification of durum flour with chickpea flour was studied at the University of
Thessaloniki in Greece. Various effects of this fortification of lasagna made with durum flour
were studied at substitution levels of 5%, 10%, 20%, 30% and 50% chickpea flour. Each version
of the cooked pasta was analyzed for nutritional content using a proximate chemical analysis. A
sensory evaluation of these pastas was also performed to judge consumer opinion of taste,
texture, and general appeal. Although the mixture of chickpea flour with durum flour results in a

22
stronger pasta dough, the consumer opinion decreases with higher substitution levels. The
expected increase in total protein with substitution level was observed, but the texture, handling,
cooking characteristics, processing behavior, and color deteriorated with high levels of
substitution, making those pasta blends undesirable (Sabanis et al, 2006). Similar effects on the
quality of the pasta were also observed in other studies (Neilson, 1980; Arab et al, 2010;
Gimenez et al, 2012). The amount of the effect observed depended on the type of legume flour
used, generally deteriorating various properties of the pasta with higher substitution levels.
A similar study looked at the effects of the addition of bean flour on the digestibility of
spaghetti. Common bean flour was substituted at various levels in semolina spaghetti to measure
the protein level, cooking time, cooking loss and nutritional profile. Total starches, available
starches, indigestible fractions, and many other factors of digestibility were measured via an in
vitro starch hydrolysis kinetic study. Spaghetti made with higher substitution levels of common
bean flour was observed to decrease the digestibility of the food, thus decreasing the glycemic
load (Gallegos-Infante et al, 2010). The substitution of chickpea flour was also observed to have
a similar effect on the glycemic load (Goni and Valentı́n-Gamazo, 2003).
In general, these studies show a decrease in pasta quality, starch availability, and
consumer acceptance as legume flour substitution levels were increased. The protein content,
protein quality, and fiber content increased with higher percentages of bean flours, lending
additional nutritional value to the final product. It is proposed that increasing levels of bean flour
should also increase fiber content and decrease glycemic load in the pasta product. These
changes should result in a product that can contribute to a healthy diet, especially for consumers
ages 65 and older. The goal of this research is to develop a fortified ravioli product that is
appealing to this older demographic, yet has an improved nutritional profile. The process chosen

23
to produce and analyze these bean-based ravioli is modeled on the papers discussed above and
on Bentley (2013).

24
CHAPTER 3: MATERIALS AND METHODS
3.1: RESEARCH PHASES
The main goal of this research is to produce a healthy alternative pasta product using
bean flour. The product is to be attractive to consumer 65 years and older. In general, the
recommended diet for consumers in this age group consists of foods with high fiber, to decrease
digestion problems, low glycemic loads, to decrease variability of glucose levels, and high
protein, to achieve the recommended daily intake (Karter et al, 2001; Health.gov, 2010; Godman,
2014). Foods with these properties are thus considered to be healthy food choices.
The various steps of this research were conducted in the greater Baton Rouge area, but
the results can apply to the older generation in any locale. This research was completed in three
phases. Phase I consisted of a market survey to collect data about consumers’ food choices in the
Greater Baton Rouge area. In Phase II, a variety of flours and pasta doughs were tested for
compatibility and visual appeal. The third phase entailed production of the final product and a
consumer sensory test of that product. A blind consumer survey of the older generation was also
conducted in the third phase to compare how the acceptance ratings of the commercially
available products compared to the results of the sensory test of the fortified pasta product
developed during this research. Analysis of this data will be discussed in Chapter 4.
3.2: PHASE 1 – SURVEYS
3.2.1 Two Market Surveys
In order to conduct of survey of the target population, several steps were required. First, a
market survey was conducted to understand the availability of healthy alternative products on the
market in the Greater Baton Rouge area. A more focused market survey was then conducted to

25
gather data on the availability of frozen pasta products. The classification of these items into
various fiber and glycemic load categories is discussed in the next chapter. The categories
themselves are introduced here.
3.2.2 Market Survey
A survey of approximately 400 products in nine stores was conducted to analyze the
choices consumers have at a variety of grocery stores in the Greater Baton Rouge area. The store
survey method described here is modeled on the market survey done in Bentley (2013). The nine
grocery stores chosen were selected based on local popularity, location, and price point. The
stores were required to be in the Greater Baton Rouge area, must have more than one location in
that area, and be part of a local or national chain of grocery stores. Three stores with a high price
point, three stores with a mid-range price point and three stores with a low price point were
chosen. These requirements assured the diversity of the products in the survey.
After permission and confidentiality were granted by the stores, the survey was
conducted in each of the nine stores. The items chosen were either frozen meals, snack items, or
shelf-stable meals. On average, fifty products from each store were surveyed for a total of 398
products. For each product surveyed, the data collected consists of a picture of the front of the
product and a picture of the nutrition facts label of that product. The pictures were taken using a
Samsung Rugby Pro smart phone with a 1.3 megapixel camera. Each picture was automatically
assigned an identification number by the smart phone. The items surveyed included frozen meal
products, boxed ambient/dry meals, and snack items.
After the survey was conducted, a variety of information from each image was entered
into a spreadsheet for analysis. Specifically, the product’s two identification numbers, the

26
product name, and the store where the product was found. A selection of information from each
product’s nutrition facts label was also included in the spreadsheet: total calories, total
cholesterol, total sodium, total fat, total carbohydrates, total sugars, total fiber content, and total
protein per serving. As done by Liese et al, 2005, the total digestible carbohydrates per serving
were calculated by subtracting the total fiber levels from the total carbohydrates. This data is
included in Appendix B. For confidentiality reasons, the names of the stores have been replaced
with numbers.
The products were classified into several groups based on the fiber level and the amount
of digestible carbohydrate per serving. As per U. S. Food and Drug Administration (FDA)
definitions, low fiber was defined to have a value of less than or equal to 6 percent of the
prescribed daily value (%DV), medium fiber between 6 and 20 %, and high fiber greater than or
equal to 20 %DV (21CFR101.54). Digestible carbohydrate, which is a representation of
glycemic load (GL), was then classified into three levels: low glycemic load (LGL) with values
of less than or equal to 10 grams, medium glycemic load (MGL) between 10 and 20, and high
glycemic load (HGL) with values of greater than or equal to 20 g/serving (Mendosa, 2008). The
products were then subjected to a frequency test to determine the number of products in each
category and in each of the combination categories shown in Table 3.1 below. Further results
from this study are discussed in Chapter 4.
3.2.3 Market Survey of Pasta Items
Based on the industry experience of the author in Italian cuisine, the variety of products
in the market survey was narrowed by choosing to focus on a pasta product. Based on this
decision, a second survey was performed on all market survey items that could be classified as

27
frozen and contained pasta. In a data set of 398 items, 60 items satisfied these criteria. These
products were then analyzed in an identical fashion into the nine categories described in Table
3.1. None of these products were found to have high fiber and low glycemic loads (HF/LGL).
The lack of products in the desired category further justifies the development of a frozen pasta
product with high fiber content and low glycemic load.
Table 3.1 Fiber and Glycemic Load Categories
Low Fiber
(LF) (x ≤ 6%)
Medium Fiber
(MF) (6% < x < 20%)
High Fiber
(HF) (x ≥ 20%)
Low Glycemic Load
(LGL) (y ≤ 10 g) LF/LGL MF/LGL HF/LGL
Medium Glycemic Load
(MGL) (10 g < y < 20 g) LF/MGL MF/MGL HF/MGL
High Glycemic Load
(HGL) (y ≥ 20 g) LF/HGL MF/HGL HF/HGL
Fiber and Glycemic Load categories used to analyze the products in the market survey. Fiber
value (x) is measured in percent daily value of the total recommended intake. Glycemic load (y)
is measured in grams.
3.3: PHASE II – TESTING AND FORMULATION
3.3.1 Testing and Formulation Variables
The goal of the research was to produce a frozen pasta product with high fiber content
and a low glycemic load. The proposed method was to substitute a portion of the wheat flour
with bean flour to increase fiber content and decreased glycemic load. However, this substitution
changed several basic properties of the pasta dough, including viscosity, appearance, and dough
behavior. In order to test how these variables change as the substitution levels increase, various
mixtures of pasta dough were tested using Rapid Moisture Analysis, Rapid Visco Analysis, and

28
visual methods. The method used was based on the analysis method used by Bentley (2013) and
proposed by Batey (2000).
3.3.2 Rapid Moisture Analysis
A Rapid Moisture Analysis (RMA) was done on each variation of pasta dough to
calculate the moisture content of the dough. Three different types of bean flours were tested at
six substitution levels, namely navy bean, black bean, and pinto bean flours. The six substitution
levels chosen were 20%, 25%, 30%, 50%, 75%, and 100% bean flour by weight. The bean flours
used in this research were provided by Best Cooking Pulses, Inc. (Manitoba, Canada). The
control flour used in each substitution mixture was a 50/50 blend of “00” and semolina flour.
Type “00” flour is a high-gluten flour made from red spring wheat. In addition to these
combinations, the control mixture was also analyzed for a total of 19 flour combinations (Table
3.2).
The RMA process described below was used to determine the moisture content of each flour
sample. This process was performed by placing the 3.5 grams of the chosen sample of flour
mixture in a 15 mL centrifuge test tube. The flour sample was then poured onto the foil tray
which was then placed in the Ohaus MB45 Rapid Moisture Analyzer (Ohaus Corporation,
Parsippany, NJ). The Analyzer temperature and duration were then set to 110 °C for a maximum
duration of 13 minutes. The moisture content of each sample was then documented and the
sample discarded (Table 3.2). These values were used to determine the amount of deionized
water and flour mixture needed to make a sample of each flour mixture with a moisture content
of 14% (see RVA Durum Method 11.06 in Perten Instruments, 2007, and below). Each of these
samples was then analyzed with the Rapid Visco Analysis (RVA) to understand the visco-elastic
properties of each type of flour mixture as described in the next section.

29
Table 3.2 Weight Percentage Substitution Levels of Pinto, Navy, and Black Bean Flours, With
Percent Moisture Content for Each Flour Mixture
% Bean
Flour
% Control
Blend
Bean
Flour
% Moisture
Content
0 100 N/A 10.90
20 80 Pinto 12.33
25 75 Pinto 13.10
30 70 Pinto 12.43
50 50 Pinto 12.45
75 25 Pinto 13.51
100 0 Pinto 13.55
20 80 Navy 10.95
25 75 Navy 10.51
30 70 Navy 11.34
50 50 Navy 10.24
75 25 Navy 9.90
100 0 Navy 9.23
20 80 Black 11.08
25 75 Black 10.58
30 70 Black 11.63
50 50 Black 10.45
75 25 Black 10.28
100 0 Black 9.92
3.3.3 Rapid Visco Analysis
A Rapid Visco Analysis (RVA) was performed on each flour blend in duplicate (Table
3.2 and RVA Durum Method 11.06 in Perten Instruments, 2007). The RVA tests for the 100%
bean flours were not performed in duplicates since the tests on these flours were only performed
to acquire reference values, not for use in the pasta doughs. Water was added as needed to each
flour blend to yield a final moisture of 14% using the results in Table 3.2. The amount of water
needed to obtain the required moisture content was calculated by the RVA software
accompanying the machine (described below) using the equation shown in Figure 3.1, where M1
is the standard flour mass of 3.5 g, M2 is the corrected mass of the flour sample, W1 is the
percentage moisture content of the flour sample, and W2 is the amount of added water required

30
to obtain a 14% moisture content. The appropriate amounts of flour mixture (M2) and deionized
water (W2) for each sample were combined using the RVA sample paddle in the RVA aluminum
cup until thoroughly mixed. Once the sample was completely mixed, the RVA aluminum cup
and sample paddle were attached to the tower of the RVA machine.
𝑊2 = 25.0 + (𝑀1 − 𝑀2), 𝑤ℎ𝑒𝑟𝑒 𝑀2 = (100−14)𝑀1
100− 𝑊1
Figure 3.1 Correction Formula for 14% Moisture Content. M1 is the standard flour mass of 3.5 g,
M2 is the corrected mass of the flour sample, W1 is the percentage moisture content of the flour
sample, and W2 is the amount of added water required to obtain a 14% moisture content.
The RVA was then completed using a Newport scientific RVA-4 (Newport Scientific
Pty. Ltd., Warriewood NSW, Australia) instrument and a Neslab RTE 7 water bath (Thermo
Fisher Scientific, Newington, NH). The RVA software accompanying the machine was then set
to run each sample for a 13 minute cycle adjusting temperature and speed at the different times
as defined in the RVA Durum Method 11.06 (Perten Instruments, 2007). At the start of each run,
the temperature was set to 50 °C with a rotation rate of 960 rpm. At ten seconds (0:10), the
machine was set to decrease the speed to 160 rpm while maintaining the temperature. At run
time 4:42, the machine temperature was increased to 95 °C while maintaining the rotation rate.
At eleven minutes (11:00), the temperature was decreased to 50 °C until the completion of the
run. The RVA software reported various properties of each flour mixture, including the viscosity
of each sample.
Figure 3.2 shows the amylograph of the control flour mixture (50/50 blend enriched
semolina and “00” flours) as an example of the typical behavior of the viscosity of a flour
mixture throughout the 13-minute testing process. The trapezoidal line in the plot refers to the
temperature inside the Rapid Visco Analyzer during the testing process. The flat line towards the

31
bottom of the plot gives the rotation rate of the paddle in revolutions per minute. The curve
represents the viscosity of the flour mixture sample in the standard centiPoise units. The shape of
this curve is typical of the curves of all the flour mixtures tested. The viscosity of the flour
mixture is typically marginally high while the rotation rate is high at the beginning of the test,
then falls once the rotation rate decreases to the standard value. As the temperature inside the
Analyzer increases, the viscosity of the flour mixture begins to increase. The temperature at
which this occurs, called the pasting temperature, is associated with the minimum energy
required to cook the flour mixture. The viscosity of the flour mixture continues to gradually
increase until a peak viscosity is reached. This peak viscosity indicates that the starch molecules
have swelled to their maximum capacity and have begun to paste.
Figure 3.2 Amylograph of the Control Flour Mixture

32
The viscosity then decreases by varying amounts for each flour mixture to a new
minimum viscosity. The difference between the peak viscosity and this new minimum value, the
breakdown value, is an indicator of the stability of the starch paste during the cooking process.
The viscosity again increases for the remainder of the test, reaching a final maximum value. As
explained in Jacobs et al. (1995), this final viscosity can be used to measure the total setback or
retrogradation tendency of the proteins in the starch. The greater the difference between the final
and minimum viscosity, the more likely it is that the starch will form a gel as it cools. The results
of the RVA tests are reported and discussed in Chapter 4.
3.3.4 Ravioli Formulation
In addition to the final viscosity of the flour, the flour blends used in the final ravioli
product were selected based on the visual appearance and the behavior of the doughs. Six types
of flours were used to test dough properties, including a 50/50 blend of “00” and semolina flour
mixture as a control, three navy bean flour mixtures, and one each of pinto bean and black bean
flour blends as shown in Table 3.3. These mixtures were chosen to determine how the dough
color and behavior changed with bean flour type and with increasing navy bean flour substitution
compared to the control dough. The first number next to each bean flour type in the table
indicates the percentage by weight of the navy bean flour in the flour blend. The second number
indicates the percent by weight of the 50/50 “00” and semolina flour mixture (the control flour).
The weights of each type of flour are also indicated in Table 3.3. In some dough formulations, it
was necessary to add water to the pasta dough to balance the lack of moisture in those flour
mixtures as shown in the last column.

33
Table 3.3 Weights of Flour Types in Dough Formulations
Pasta Dough Type Bean
Flour (g)
50/50 Control
Blend (g)
Added
Water* (g)
Control (50/50 “00” and
Semolina Blend) 0.0 120.9 0.0
Navy Bean (25/75) 30.23 90.60 2.0
Navy Bean (50/50) 60.45 60.45 2.0
Navy Bean (75/25) 90.68 30.23 5.2
Pinto Bean (30/70) 36.30 84.60 0.0
Black Bean (30/70) 36.30 84.60 0.0
*In some dough types, it was necessary to add water for proper dough behavior. The amounts of
water are shown in grams in the last column.
The dough prepared from the flour mixtures were then used to prepare cheese-stuffed
ravioli. The recipe used for the pasta dough formulation was based on a recipe acquired from
Food.com and is described in detail below. The ingredient amounts in this formula are indicated
in Table 3.4.
The standardized dough formulation process is as follows. The first step in the
formulation of the pasta dough was to sift the prescribed amount of flour mixture and salt
together into a medium sized bowl. Two eggs were whipped together in a separate bowl using a
fork for approximately 30 seconds or until the egg yolk and egg white were combined. The
required amount of whipped eggs was then weighed and extra material removed from the bowl.
The extra virgin olive oil was then added to the egg mixture. The flour mixture was then
transferred to a 5 quart Globe kitchen mixer with a dough hook attachment. The mixer was set to
a medium speed and the egg and olive oil mixture was slowly added to the flour mixture. The
mixer was allowed to run at medium speed until the dough formed into a ball (approximately two
minutes).

34
Table 3.4 Weights of Each Ingredient in the Control Pasta Dough Recipe.
Ingredients Weights (g) Weights (%)
Flour Mixture 120.9 60.24
Table Salt 0.70 0.35
Eggs 72.7 36.22
Olive Oil 6.40 3.19
When the dough mixture came together, the dough was removed from the mixer and
placed on a floured surface. The dough was kneaded by hand for two minutes or until the dough
slowly retracted when pressed with a finger. The dough was then wrapped up in plastic wrap and
placed in the refrigerator until the dough completely chilled (about twenty-five to thirty minutes).
The filling for the ravioli was prepared. In a 10 inch stainless steel mixing bowl, 425 grams of
whole milk ricotta cheese from Albertson’s was thoroughly mixed with 170 grams of finely
shredded parmesan cheese from Albertson’s. The cheese mixture was covered with Glad plastic
wrap and placed in the cooler. The chilled dough ball was placed onto a floured surface and cut
into two equal portions. Pictures were taken for each dough formulation to document dough
color, internal structure, and apparent texture. The cheese filling was also removed from the
cooler and allowed to come to room temperature at this time. Based on the appearance of the
black bean pasta dough, this dough variation was not prepared into ravioli. Only the control
dough, the pinto bean dough, and the three variations of navy bean pasta dough were prepared
beyond this point (Figure 3.3).
For each type of pasta dough, the two portions of the pasta dough were each kneaded and
flattened out, then run through a Kitchen Aid pasta roller attachment on the mixer. The mixer
was turned to speed setting 4 (medium speed) and the roller attachment was set to setting 0 (the

35
thickest setting). One section of pasta dough was then flattened and sent through the roller
attachment. The dough was run through the attachment twice, folded into three layers, and then
rolled through again at the same setting for a total of three runs at the same setting. The roller
was then turned to setting 2 and the process repeated for each incremental setting up to setting
five on the roller attachment.
Figure 3.3 Pasta Dough Variations. Colors and internal textures of the six pasta dough variations
prepared. From the left: Control dough (50/50 “00” and semolina blend), 25/75 Navy Bean
dough, 50/50 Navy Bean dough, 75/25 Navy Bean dough, 30/70 Pinto Bean dough, and 30/70
Black Bean dough. As in the text, the first number refers to the percentage by weight of the bean
flour while the second number refers to the percentage by weight of the control flour used.
After rolling both portions of pasta dough through the roller on setting five, each dough
portion was then cut into two equal sections. A one ounce portion of cheese mixture was placed
onto the two section of the dough with 1.5 inch spacing. The remaining exposed pasta on these
sections was brushed with water. The other sections of dough that contained no cheese were then
placed on the sections of dough containing cheese. Each pair of dough sheets were then crimped
together by pressing firmly on the top layer of pasta dough between the portions of cheese. The
ten ravioli produced were then cut from the pasta sheets and placed on an 18” x 26” restaurant
sheet pan that had been lined with one 18” x 26” sheet of parchment paper.

36
The ravioli were then parboiled with the following process. Six quarts of water were
brought to a rolling boil in an eight-quart pot. Five quarts of ice water were also prepared in a
large bowl and set aside. Ten ravioli were dropped into the boiling water and boiled for one
minute. The ravioli were then removed from the boiling water with a strainer and placed in the
ice water for approximately 1.5 minutes. The parboiled ravioli were then removed from the ice
water and placed back on the sheet pan. The sheet pan of parboiled ravioli was then placed in a
freezer at -5 °F for fifteen minutes. The sheet pan was removed from the freezer and five ravioli
were placed into each of two freezer safe microwaveable plastic bowls (donated from the LSU
AgCenter Food Incubator stock). The bowls were placed back into the freezer overnight and then
removed for testing. The ravioli were then microwaved in the loosely covered bowls on high for
2.5 minutes each and submitted for sensory evaluation. Based on the preliminary appearance and
taste as judged by the author, Dr. Joan King and Dr. Witoon Prinyawiwatkul of the LSU School
of Nutrition and Food Science, the 50/50 navy bean, 75/25 navy bean, and the control ravioli
doughs were chosen for a consumer sensory test.
3.4: PHASE III – LARGE-SCALE DEVELOPMENT, SENSORY TEST, AND A BLIND
CONSUMER SURVEY
3.4.1 Large-Scale Development
Phase III of the research involved large-scale production of the chosen ravioli doughs to
prepare for a large sensory test. A consumer sensory test of approximately 100 participants was
done to gather data concerning consumer preferences. The three ravioli types chosen for the
sensory test were the control ravioli, the 50/50 navy bean ravioli, and the 75/25 navy bean ravioli
(bean/wheat). In order to prepare for this sensory test, 100 ravioli of each type had to be
prepared. The original recipe weights were multiplied by 15 to compensate for possible cooking

37
mistakes. The cheese stuffing for the ravioli was prepared by thoroughly mixing 90 ounces of
finely shredded parmesan cheese with 225 ounces of ricotta with a Hobart 20-quart mixer. The
scaled-up ingredient amounts for each type of ravioli are listed in Table 3.5. The process
followed to make the ravioli was identical to the process described in Section 3.3.4, except it was
necessary to add additional water to the 75/25 navy bean pasta dough to achieve the proper
moisture level in the pasta dough.
Table 3.5 Weights of the Ingredients in the Scaled-Up Versions of the Pasta Doughs
Ingredients Control Ravioli
50/50 Navy Bean
Ravioli
75/25 Navy Bean
Ravioli
g % g % g %
50/50 Flour Blend 1813.5 60.24 906.75 29.82 453.37 14.68
Navy Bean Flour 0.0 0.0 906.75 29.82 1360.13 44.04
Whole Eggs 1090.5 36.22 1090.5 35.87 1090.5 35.31
Olive Oil 96.0 3.19 96.0 3.16 96.0 3.11
Table Salt 10.5 0.349 10.5 0.345 10.5 0.340
Water 0.0 0.0 30.0 0.987 78.0 2.53
3.4.2 Sensory Test
Once the large-scale ravioli production was completed, the sensory test was then
executed at the Sensory Lab of the School of Nutrition and Food Science at LSU. To preserve
the anonymity of the ravioli types, the ravioli types were assigned identification numbers. The
control ravioli was assigned “341” as the identification number, the 50/50 navy bean ravioli was
assigned “842”, and the 75/25 navy bean ravioli was assigned “643” as the identification
number. Electronic consent forms and sensory evaluation forms were used to obtain responses
from the general population (Appendix C, and Figure 3.4 below). These forms were created and

38
Sample # ____________ Gender: [ ] Male [ ] Female
Please evaluate the following attributes of this product.
Please evaluate the sample by tasting it. After tasting the sample, set aside and save a portion to taste with the
serving of tomato sauce.
1. How would you rate the overall appearance of this product?
Dislike Dislike Dislike Dislike Neither Like Like Like Like Like
Extremely Very much Moderately Slightly nor Dislike Slightly Moderately Very much Extremely
[ ] [ ] [ ] [ ] [ ] [ ] [ ] [ ] [ ]
1 2 3 4 5 6 7 8 9
2. How would you rate the odor/aroma of this product?
Dislike Dislike Dislike Dislike Neither Like Like Like Like Like
Extremely Very much Moderately Slightly nor Dislike Slightly Moderately Very much Extremely
[ ] [ ] [ ] [ ] [ ] [ ] [ ] [ ] [ ]
1 2 3 4 5 6 7 8 9
3. How would you rate the taste of this product?
Dislike Dislike Dislike Dislike Neither Like Like Like Like Like
Extremely Very much Moderately Slightly nor Dislike Slightly Moderately Very much Extremely
[ ] [ ] [ ] [ ] [ ] [ ] [ ] [ ] [ ]
1 2 3 4 5 6 7 8 9
4. How would you rate the texture of this product?
Dislike Dislike Dislike Dislike Neither Like Like Like Like Like
Extremely Very much Moderately Slightly nor Dislike Slightly Moderately Very much Extremely
[ ] [ ] [ ] [ ] [ ] [ ] [ ] [ ] [ ]
1 2 3 4 5 6 7 8 9
5. Do you detect a bean flavor of this product?
YES [ ] NO [ ]
6. How would you rate the overall liking of this product?
Dislike Dislike Dislike Dislike Neither Like Like Like Like Like
Extremely Very much Moderately Slightly nor Dislike Slightly Moderately Very much Extremely
[ ] [ ] [ ] [ ] [ ] [ ] [ ] [ ] [ ]
1 2 3 4 5 6 7 8 9
7. Is this product ACCEPTABLE? YES [ ] NO [ ]
8. Would you BUY this product if it were commercially available? YES [ ] NO [ ]
Figure 3.4 Sensory Evaluation Form. The form was electronically distributed in triplicates to
each participant in the sensory test.

39
Now please evaluate the following attributes of this product with the sauce that is provided.
1. How would you rate the overall appearance of this product?
Dislike Dislike Dislike Dislike Neither Like Like Like Like Like
Extremely Very much Moderately Slightly nor Dislike Slightly Moderately Very much Extremely
[ ] [ ] [ ] [ ] [ ] [ ] [ ] [ ] [ ]
1 2 3 4 5 6 7 8 9
2. How would you rate the odor/aroma of this product?
Dislike Dislike Dislike Dislike Neither Like Like Like Like Like
Extremely Very much Moderately Slightly nor Dislike Slightly Moderately Very much Extremely
[ ] [ ] [ ] [ ] [ ] [ ] [ ] [ ] [ ]
1 2 3 4 5 6 7 8 9
3. How would you rate the taste of this product?
Dislike Dislike Dislike Dislike Neither Like Like Like Like Like
Extremely Very much Moderately Slightly nor Dislike Slightly Moderately Very much Extremely
[ ] [ ] [ ] [ ] [ ] [ ] [ ] [ ] [ ]
1 2 3 4 5 6 7 8 9
4. How would you rate the texture of this product?
Dislike Dislike Dislike Dislike Neither Like Like Like Like Like
Extremely Very much Moderately Slightly nor Dislike Slightly Moderately Very much Extremely
[ ] [ ] [ ] [ ] [ ] [ ] [ ] [ ] [ ]
1 2 3 4 5 6 7 8 9
5. Do you detect a bean flavor of this product?
YES [ ] NO [ ]
6. How would you rate the overall liking of this product?
Dislike Dislike Dislike Dislike Neither Like Like Like Like Like
Extremely Very much Moderately Slightly nor Dislike Slightly Moderately Very much Extremely
[ ] [ ] [ ] [ ] [ ] [ ] [ ] [ ] [ ]
1 2 3 4 5 6 7 8 9
7. Is this product ACCEPTABLE? YES [ ] NO [ ]
8. Would you BUY this product if it were commercially available? YES [ ] NO [ ]
(Figure 3.4 Continued)
40
accessed using Compusense software provided by the School of Nutrition and Food Sciences at
LSU.
To prepare the ravioli for the sensory test, the ravioli were removed from the freezer and
heated as described in Section 3.3.4 for 2 minutes. Once the ravioli were heated, a single ravioli
of each type was then served in a 400 PC translucent 4 ounce plastic portion cup with each
sample cup labeled with the proper identification number. The three samples were place on a
white five compartment foam school lunch tray. One heated two ounce portion of Ragu’s Old
World Style Traditional tomato sauce was served in an identical portion cup alongside of the
three samples. Other items that were provided for each participant were a 2 ounce plastic cup of
water, 2 unsalted tops-premium saltine crackers, one napkin and one plastic fork.
Each participant in the sensory test had to first complete an electronic consent form (see
Appendix C). The participant was then given a sampling tray and completed three sensory
evaluation forms. The sensory evaluation gathered information regarding the consumer
acceptance on the appearance, aroma, taste, texture, and bean flavor. The participant rated these
attributes of each ravioli sample using a nine-point hedonics scale (Figure 3.4). This form also
included instructions for the participant on how to properly execute the sensory test. Each
participant was instructed to complete one sensory evaluation form per ravioli sample for a total
of three samples. The sensory test was completed by 103 participants, ranging from college
freshman to faculty of both genders. This sensory test was approved by the LSU IRB committee
as per state regulation requirements (see Appendix C for supporting documentation).
The responses on the survey form included 5 hedonics scale questions (1 = dislike
extremely to 9 = like extremely) concerning appearance, aroma, taste, texture, and overall liking.
The remaining three questions were yes/no questions concerning the detectability of bean flavor,

41
acceptability of the product, and purchase intent. The bean flavor question was phrased so that a
yes answer indicated that a bean flavor was detectable, resulting in a yes answer that was
negative. The remaining two yes/no questions were phrased so that a yes answer indicated a
positive review of the product. These questions were repeated for each type of ravioli with and
without sauce, resulting in three complete survey forms for each participant. The data collected
was analyzed and is discussed in Chapter 4.
The data acquired with the sensory survey were analyzed to compare the distributions of
the data sets. An Analysis of Variance (ANOVA) test was performed comparing the three ravioli
types for each question type without sauce. An identical test was performed comparing the
ravioli types with sauce. Since the ANOVA tests only showed whether one (or more) of the three
ravioli types were different for that question type, the Tukey method was used to determine
which of the ravioli types were significantly different for each question type. This method was
only applied if the ANOVA test reported a difference in the data set. The yes/no questions were
each compared by calculating the percent of ‘yes’ answers compared to the total number of
answers for each question. The results of these analyses are reported in the next chapter.
3.4.3 Blind Consumer Survey
A blind consumer survey was conducted on individuals ages 65 and older to record their
preferences regarding frozen pasta meals. The majority of the 60 frozen pasta products found in
the market survey were categorized as medium fiber and high glycemic load (MF/HGL). As a
result, this category was chosen to select products from for a blind consumer survey. A blind
consumer survey is a survey in which consumer preference data is collected, but no identifying
information about the consumers taking the survey is gathered or disclosed. The MF/HGL

42
category was also chosen because the substitution of bean flour in pasta products increases the
fiber level and decreases glycemic load in the final product, resulting in a healthier product.
Out of the 46 MF/HGL pasta products found in the market survey, two products from
each of nine stores were chosen for the survey. This restriction was chosen to assure a level
distribution of price point among the products. The products were chosen for the survey in a way
to maximize the variety of product types in the total sample. For example, if a lasagna product
was chosen from one store, a different type of pasta product (such as spaghetti) was chosen from
another store. The brand name of the products was also chosen to be as varied as possible within
these restrictions.
This survey was done to collect information about consumer preferences concerning the
currently available pasta products. For each pasta product chosen, consumers were asked a
variety of questions concerning purchase history and product appeal (see Figure 3.5). If the
consumer purchased and consumed the product in question, data concerning the taste, texture,
aroma, and color were collected. Approximately 75 responses were collected from consumers
aged 65 and older. Out of these responses, 38 participants indicated past consumption of the food
items chosen. The analysis of these data is discussed in the next chapter. The results were also
compared to those of the sensory study to determine if the substitution of bean flour resolved any
of the issues recorded in the blind consumer survey. This consumer survey was approved by the
Louisiana State University (LSU) Institutional Review Board (IRB) committee as per state
regulation requirements (see Appendix C for supporting documentation).

43
This survey is being done as part of a Master Program research project by Christopher Ringuette, a graduate student at Louisiana State
University. This information is for research purposes only. This study will be a blind study, so that no information about the individuals who
completed the form can or will be disclosed. If you are age 65 or older, your participation in this study is greatly appreciated. Please circle
yes (Y) or no (N) to each question. Again, your participation is greatly appreciated. Please circle or check the categories below.
Gender: Male____ Female_____ Age: 65 to 70 _____ 71 to 75_____ 76 to 80_____ 81 to 85_____ 86 or older_____
Ethnicity: Caucasian African American Asian Hispanic Other Decline
Frozen Pasta
Products
Have you purchased this
product? If no, state reason
(Brand, availability, price,
etc) and go to next product:
Have you
eaten this
product?
Acceptable
Taste?
Acceptable
Texture?
Acceptable
Aroma?
Acceptable
Color?
If any other
issue? (Please
specify.)
Any frozen pasta
products Y N Y N Y N Y N Y N Y N
Spaghetti w/ Meat
Sauce #1 Y N Y N Y N Y N Y N Y N
Vegetable
Chicken with
Spaghetti
Y N Y N Y N Y N Y N Y N
Blackened
Chicken Alfredo Y N Y N Y N Y N Y N Y N
Grilled Chicken
Primavera Y N Y N Y N Y N Y N Y N
Crawfish
Fettuccine Y N Y N Y N Y N Y N Y N
Lasagna with
Meat & Sauce Y N Y N Y N Y N Y N Y N
Rich and Creamy
Penne and Cheese Y N Y N Y N Y N Y N Y N
Figure 3.5 Blind Consumer Survey Form

44
Frozen Pasta
Products
Have you purchased this
product? If no, state reason
and go to next product:
(Brand, availability, price,
etc)
Have you
eaten this
product?
Acceptable
Taste?
Acceptable
Texture?
Acceptable
Smell?
Acceptable
Color?
If any other
issue? (Please
specify.)
Five Cheese Ravioli Y N Y N Y N Y N Y N Y N
Tricolor Cheese
Tortelloni Y N Y N Y N Y N Y N Y N
Spinach & Ricotta
Ravioli Y N Y N Y N Y N Y N Y N
Four Cheese
Cannelloni Y N Y N Y N Y N Y N Y N
Swedish Meatballs
with Pasta Y N Y N Y N Y N Y N Y N
Garden Vegetable
Lasagna Y N Y N Y N Y N Y N Y N
Spaghetti with Meat
Sauce #2 Y N Y N Y N Y N Y N Y N
Seafood Fettuccine Y N Y N Y N Y N Y N Y N
Shrimp Rotini w/
Applewood Bacon Y N Y N Y N Y N Y N Y N
Ravioli 3-cheese
tortellini Y N Y N Y N Y N Y N Y N
Chicken Florentine
with Pasta Y N Y N Y N Y N Y N Y N
(Figure 3.5 Continued)

45
CHAPTER 4: RESULTS AND DISCUSSION
4.1: OVERVIEW AND SURVEY RESULTS
4.1.1 Market Survey Results
Of the 398 items selected in the market survey, 233 were frozen meals, 120 were shelf-
stable meals, and 45 were boxed snack items. These items were categorized by their nutrition
data into the nine categories shown in Figure 3.1. The total numbers of items in each category
are presented in Figure 4.1 below. The two items in the HF/LGL category are shown at the top of
the pie chart, with the remaining categories presented in a clockwise order. The categories are
arranged so that the three categories in the top right section are considered healthier and the three
categories in the top left to bottom left sections are considered less healthy. Out of 398 items
documented in the market survey, 65.08% of the items are considered unhealthy while 5.28% of
the items are considered healthy, with the remaining 29.65% of the items falling into categories
in between. The lack of items in healthy categories justifies research to modify existing foods to
shift them into these categories. The vast majority of the items found will benefit from the
proposed modifications to increase fiber content and decrease glycemic load.
The general distribution of the number of items in each fiber and glycemic load category
shows a plethora of items in the medium fiber high glycemic load category, but only two items in
the high fiber low glycemic load category. The neighboring categories of high fiber medium
glycemic load and medium fiber low glycemic load were also found to have a low total item
count – twelve and seven items respectively across all store types. The low item count in these
categories shows the lack of healthy choices available in the markets and serves to justify this
research.

46
Figure 4.1 Market Survey of the Total Number of Items in Each of the Nine Fiber and Glycemic
Load Categories. HF is high fiber content, MF is medium fiber content, LF is low fiber content,
HGL is high glycemic load, MGL is medium glycemic load, and LGL is low glycemic load. See
Table 3.1 for more details.
Other similar studies have also found a lack of gluten-free and high quality food choices
in the market. Bentley (2013) performed a market survey of stores across two Louisiana parishes
and reported 555 gluten-free items. These items are required for autistic individuals and those
with Celiac disease. These alternative food choices were noted to be costlier than their standard
counterparts and less appealing in taste. Kezis et al (1998) also performed a market survey of
individuals attending a farmer’s market in Maine. These individuals were willing to pay more for
produce at the farmers market than elsewhere because of the quality of the products and to
support local farmers. A Worldwatch Paper also presents the arguments for the emphasis of local
food in the context of farmer’s markets, including the effect of large-chain supermarkets
(Warweil, 2002). Additional reputable, detailed market analyses are generally performed by
corporations and are thus inaccessible to the researcher. However, the emphasis on healthier food
2 12
7
53
36
29
160
22
77 HF/LGL
HF/MGL
MF/LGL
HF/HGL
MF/MGL
LF/LGL
MF/HGL
LF/MGL
LF/HGL

47
items is recent research is undeniable, ranging from studies concerning the presence of various
plastics, heavy metals, and inorganic arsenic in food to food safety practices (Schoof et al, 1999;
Fankhauser-Noti et al, 2006; Shogren et al, 1999; and Radwan and Salama, 2006). The overall
lack of items with high dietary fiber, low glycemic load and high protein content in the market
compared with the abundance of foods with low dietary fiber, high glycemic load and low
protein content justifies an effort to create an alternative healthy meal choice. The effort is
further justified by the increasing trend in the demand for healthier food choices, especially in
low end stores (MarketResearch.com, 2016).
4.1.2 Frozen Pasta Market Survey Results
A market analysis was also done based on a subset of the full market survey that
consisted of only frozen prepared meals with pasta, resulting in 60 frozen pasta items. This focus
was chosen based on the generally unhealthy nutritional profile of pasta products and the
experience of the researcher with Italian cuisine. These items were categorized by their nutrition
data into the nine categories shown in Figure 3.1 and are presented in Figure 4.2 below. The
majority of these items were found to be categorized as MF/HGL, an unhealthy food category.
Two of the remaining items fell into healthy categories (both in MF/LGL), two others into
unhealthy categories (both in LF/HGL), and the remaining ten items into reasonably healthy
categories (eight in HF/HGL and two in MF/MGL). With the large majority of items in
unhealthy categories, it is a justified endeavor to find a way to make the items in the MF/HGL,
LF/MGL, and LF/HGL categories healthier by increasing the fiber content and decreasing the
glycemic load.

48
Figure 4.2 Frozen Pasta Market Survey of the Total Number of Items in Each of the Nine Fiber
and Glycemic Load Categories. HF is high fiber content, MF is medium fiber content, LF is low
fiber content, HGL is high glycemic load, MGL is medium glycemic load, and LGL is low
glycemic load. See Table 3.1 for more details.
In general, the selection in all of the stores favored unhealthy frozen pasta meals, mostly
in the MF/HGL category. Since this trend is the same across all price points, any change made to
the items in the MF/HGL category that moves those items to a healthier category, such as
HF/HGL, would vastly increase the number of healthy or reasonably healthy frozen pasta meal
choices across the market. It is the goal of this research to achieve this increase in fiber content
by substituting bean flour for a portion of the semolina flour generally found in frozen pasta
products.
4.2: PRODUCT ANALYSIS AND TESTING
4.2.1 Rapid Visco Analysis Results
The RVA procedure was done in duplicate for all the flour mixtures except for the 100%
bean flour since the results from those three flours were only used as a maximum reference
0 0 2
8
2 0
46
0
2 HF/LGL
HF/MGL
MF/LGL
HF/HGL
MF/MGL
LF/LGL
MF/HGL
LF/MGL
LF/HGL

49
point. The amylograph for each RVA are shown in Appendix D. The average peak viscosity,
minimum viscosity, breakdown value, final viscosity, total setback, and pasting temperature for
each flour mixture are reported with their uncertainties in Table 4.1. The single values for the
100% bean flours are also reported in Table 4.1. Again, the first number indicates the percentage
by weight of the bean flour. In general, the peak viscosity decreased as more bean flour was
substituted for the control flour, regardless of the type of bean flour substituted.
The control flour mixture was used as a standard of comparison for the remaining flour
mixtures’ pasting properties. Figure 4.3 shows the amylographs for the control flour and the
50/50 navy bean flour viscosities during their RVA tests. This side-by-side comparison shows a
lower peak viscosity and a lower minimum viscosity for the 50/50 navy bean flour as compared
to the control flour. Slight changes can also be seen in the final viscosity and the pasting
temperature for the composite flour.
Instead of comparing each flour blend to the control in this manner, it is easier to plot
how each visco-elastic property changes with increasing substitutions. Figure 4.4a shows the
peak viscosities of each of the flour mixtures, where the black, navy, and red lines indicate the
peak viscosities of the black bean, navy bean, and pinto bean flour mixtures. The data point on
the far left of the graph indicates the peak viscosity for the control flour. This graphing method
allows for the peak viscosities of each flour blend to be easily compared to the control. Similar
graphs for the other visco-elastic properties are shown in the remaining parts of Figure 4.4.
The control flour mixture yielded the highest values for peak viscosity, minimum
viscosity, and breakdown viscosity. The final viscosity of the control flour was the second
highest of all the flour mixtures tested and its pasting temperature was the lowest. As bean flour

50
Table 4.1 Pasting Properties of Control and Bean Flour Mixtures
Flour Mixture Peak Viscosity
(cP)
Minimum
Viscosity (cP)
Breakdown
(cP)
Final Viscosity
(cP)
Total Setback
(cP)
Pasting Temp
(°C)
100% Control 2045.0 ± 265.9 1255.5 ± 235.5 789.5 ± 30.4 2802.5 ± 388.2 1547.0 ± 152.7 81.58 ± 0.04
20% Pinto/80% Control 1254.0 ± 104.7 890.5 ± 62.9 363.5 ± 41.7 2019.0 ± 121.6 1128.5 ± 58.7 83.68 ± 0.53
25% Pinto/75% Control 1209.0 ± 4.2 911.0 ± 1.4 298.0 ± 5.7 2038.0 ± 9.9 1127.0 ± 8.5 82.90 ± 0.71
30% Pinto/70% Control 981.5 ± 31.8 793.0 ± 14.1 188.5 ± 17.7 1816.0 ± 45.3 1023.0 ± 31.1 83.28 ± 0.11
50% Pinto/50% Control 543.5 ± 13.4 527.0 ± 9.9 16.5 ± 3.5 1340.0 ± 41.0 813.0 ± 31.1 84.43 ± 0.60
75% Pinto/25% Control 331.5 ± 3.5 305.0 ± 7.1 26.5 ± 3.5 888.0 ± 2.8 583.0 ± 9.9 85.70 ± 1.13
100% Pinto*,** 25.0 20.0 5.0 186.0 166.0 error
20% Navy/80% Control 1513.5 ± 31.8 1012.5 ± 33.2 501.0 ± 1.4 2575.0 ± 48.1 1562.5 ± 14.9 83.28 ± 0.04
25% Navy/75% Control 1132.0 ± 4.2 909.0 ± 15.6 223.0 ± 11.3 2886.0 ± 18.4 1977.0 ± 2.8 82.88 ± 0.67
30% Navy/70% Control 1456.0 ± 22.6 1024.0 ± 24.0 432.0 ± 1.4 2735.0 ± 32.5 1711.0 ± 8.5 82.88 ± 0.53
50% Navy/50% Control 1039.5 ± 31.8 828.5 ± 30.4 211.0 ± 1.4 2704.0 ± 50.9 1875.5 ± 20.5 82.38 ± 0.04
75% Navy/25% Control 639.5 ± 140.7 610.0 ± 128.7 29.5 ± 12.0 2164.0 ± 292.7 1554.0 ± 164.1 84.13 ± 1.24
100% Navy* 411.0 361.0 50.0 1202.0 841.0 85.65
20% Black/80% Control 1451.0 ± 62.2 954.5 ± 34.7 496.5 ± 27.6 2271.5 ± 58.7 1317.0 ± 24.0 83.35 ± 0.07
25% Black/75% Control 1367.5 ± 9.2 953.5 ± 6.4 414.0 ± 2.8 2244.5 ± 5.0 1291.0 ± 1.4 82.45 ± 0.07
30% Black/70% Control 1441.0 ± 29.7 1020.5 ± 20.5 420.5 ± 9.2 2387.0 ± 46.7 1366.5 ± 26.2 82.88 ± 0.53
50% Black/50% Control 895.0 ± 111.7 755.0 ± 72.1 140.0 ± 39.6 1974.0 ± 147.1 1219.0 ± 75.0 84.10 ± 1.13
75% Black/25% Control 673.5 ± 19.1 648.0 ± 18.4 25.5 ± 0.7 1869.5 ± 37.5 1221.5 ± 19.1 83.30 ± 0.00
100% Black* 301.0 247.0 54.0 855.0 608.0 89.75
The control flour was a 50/50 blend of enriched semolina flour and “00” flour. The amylograph for each flour mixture test is presented
in Appendix D.
*The original values are reported for these flours since a duplicate RVA was not performed.
**The RVA apparatus was not able to calculate the pasting temperature of this flour.
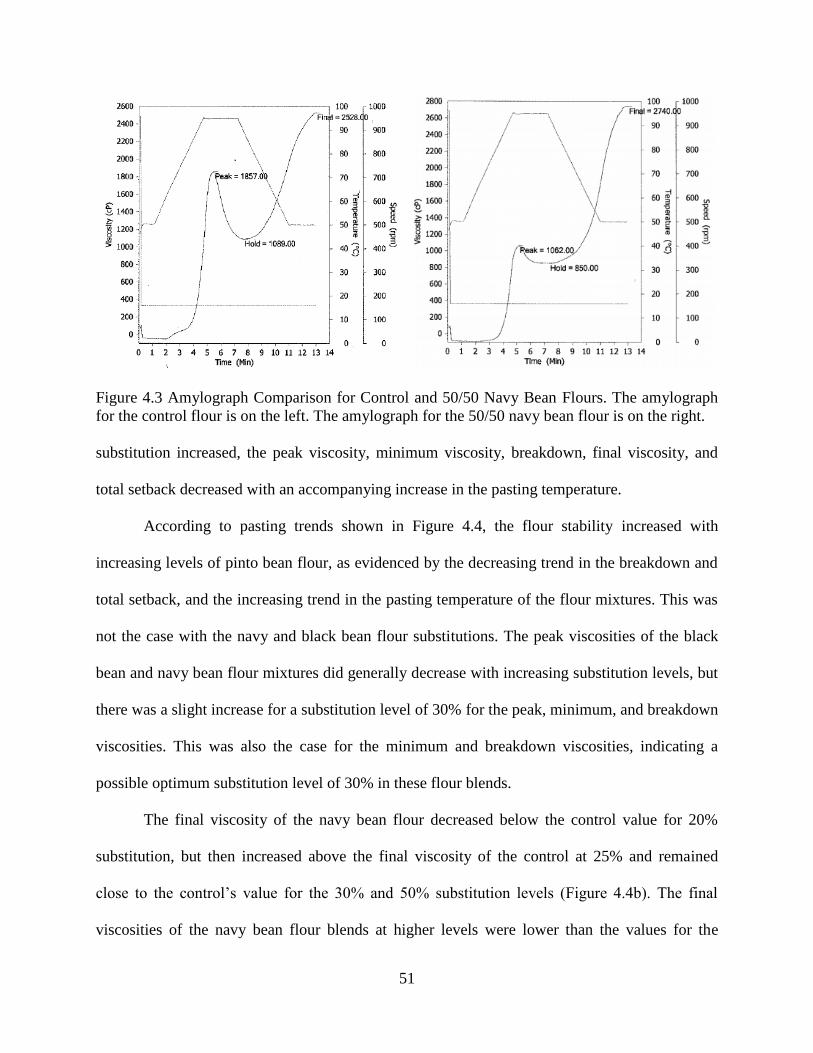
51
Figure 4.3 Amylograph Comparison for Control and 50/50 Navy Bean Flours. The amylograph
for the control flour is on the left. The amylograph for the 50/50 navy bean flour is on the right.
substitution increased, the peak viscosity, minimum viscosity, breakdown, final viscosity, and
total setback decreased with an accompanying increase in the pasting temperature.
According to pasting trends shown in Figure 4.4, the flour stability increased with
increasing levels of pinto bean flour, as evidenced by the decreasing trend in the breakdown and
total setback, and the increasing trend in the pasting temperature of the flour mixtures. This was
not the case with the navy and black bean flour substitutions. The peak viscosities of the black
bean and navy bean flour mixtures did generally decrease with increasing substitution levels, but
there was a slight increase for a substitution level of 30% for the peak, minimum, and breakdown
viscosities. This was also the case for the minimum and breakdown viscosities, indicating a
possible optimum substitution level of 30% in these flour blends.
The final viscosity of the navy bean flour decreased below the control value for 20%
substitution, but then increased above the final viscosity of the control at 25% and remained
close to the control’s value for the 30% and 50% substitution levels (Figure 4.4b). The final
viscosities of the navy bean flour blends at higher levels were lower than the values for the

52
Figure 4.4 Pasting Trends of Control and Bean Flour Mixtures. The red, blue, and black lines
indicate the trends for the pinto, navy, and black bean flour mixtures, respectively. Parts a-f show
the trends in the peak viscosity, final viscosity, minimum viscosity, total setback, breakdown
viscosity, and pasting temperature.
0
500
1000
1500
2000
0 20 25 30 50 75 100
Vis
co
sity
(cP
)
% Bean Flour Substitution
0
400
800
1200
0 20 25 30 50 75 100
Vis
cosi
ty (
cP)
% Bean Flour Substitution
0
200
400
600
800
0 20 25 30 50 75 100
Vis
cosi
ty (
cP)
% Bean Flour Substitution
0
1000
2000
3000
0 20 25 30 50 75 100
Vis
co
sity
(cP
)
% Bean Flour Substitution
0
500
1000
1500
2000
0 20 25 30 50 75 100
Vis
cosi
ty (
cP)
% Bean Flour Substitution
80
82
84
86
88
90
0 20 25 30 50 75 100
Tem
per
atu
re (°C
)
% Bean Flour Substitution
a b
c d
e f

53
control, indicating a less firm texture than the control. The final viscosity of the black bean flour
blends also initially decreased with substitution level, slightly increased at 30%, then decreased
at higher substitution levels. All of the black bean flour blends demonstrated a lower final
viscosity than the control blend. The final viscosities of the pinto bean mixtures were all lower
than those of the navy and black bean mixtures at the same substitution levels. The navy bean
blends of 25%, 30% and 50% substitution levels yield flours with textures similar to the control.
The minimum viscosity of each flour blend was well below the control (Figure 4.4c). The
flours closest to the control were the navy bean and black bean blends at 30%. The trends
observed in the total setback of each flour were similar to the trends described of the final
viscosities of the flours (Figure 4.4d). The pinto bean trend line was again well below the trend
lines of the navy bean and black bean blends, with the black bean results also lower than the total
setbacks of the navy bean blends. The total setback of the navy bean flours were larger than the
control for substitution levels of 25%, 30%, 50%, and 75%, which may indicate a less stable
flour product during storage.
The breakdown viscosity of the flour blends were all well below the control, exhibiting
greater flour stability during the mixing process (Figure 4.4e). The pasting temperatures of the
flour mixtures were all greater than the control, although most of the pasting temperatures were
within two degrees Celsius of the control’s value (Figure 4.4f). Similar pasting temperatures
imply similar cooking temperatures during production.
Based on final viscosity, these comparisons indicated pinto bean flour as the poorest
choice of the three flour types to be added to the control flour mixture. The result suggests that
the best bean flour choice was navy bean flour at substitution levels ranging from 25% to 50%.
In addition, the results showed that black bean flour substitution resulted in lower flour mixture

54
final viscosities than the navy bean flour, but still yielded a better quality flour than the pinto
bean flour mixtures. Based on these trends and the final viscosities of the flours, the 25/75 navy
bean, 50/50 navy bean, and the 75/25 navy bean flour mixtures were chosen to produce pasta
dough as described in Chapter 3 (Figure 3.3). The 30/70 pinto bean and the 30/70 black bean
flour mixtures were also chosen to sample the colors of the dough. Based on the visual
appearance and general behavior of the pasta doughs, and for the reasons discussed in Section
4.2.2, the 50/50 navy bean and the 75/25 navy bean pasta doughs, along with the control, were
chosen for the consumer sensory study.
Previously reported studies performed on legume-fortified pasta report lower pasta
quality, such as color, cooking time, and firmness, as bean flour addition increased (Zhao et al,
2005; Sabanis et al, 2006; Nielson et al, 1980). These studies were performed using green pea,
yellow pea, lentil, and chickpea flours. In comparison, this research observed similar results with
pinto bean flour, but significantly different results for navy bean flour and, to a lesser extent,
black bean flour. The substitution of navy bean flour instead slightly increased the final viscosity
of the pasta dough above the original values reported for the control pasta dough. This increase
implies a finer texture, and thus a better quality, of the pasta with the addition of navy bean flour
at a substitution level of 25%.
4.2.2 Calculated Proximate Analysis of Formulations
The fiber content of the ravioli was expected to increase and the glycemic load to
decrease when substituting navy bean flour for the 50/50 blend of semolina and “00” flour. Type
“00” flour is a high-gluten flour made from red spring wheat. This was tested by comparing the
total carbohydrates and the fiber content of each flour type used. A calculated proximate analysis

55
of the three formulations produced was performed on raw flour mixtures and the raw and cooked
ravioli (without sauce) using Nutritionist Pro™ food labeling software by Axxya Systems. This
software calculates the nutritional profile of the desired product using the weights of each
ingredient and the cooking process selected. Ingredients are chosen from a database of over
26,000 foods, each with their own nutritional profiles, to ensure accurate representation of the
product in compliance with FDA and USDA standards (Grosevenor and Smolin, 2010).
The nutrition facts panels per 100 grams were obtained for the enriched semolina flour
and the “00” flour from the flour packaging. The nutrition data for the navy bean flour was
obtained from www.nutritiondata.self.com for an initial comparison. Since navy bean flour was
not an option, the nutrition facts for raw mature seeded navy beans were used. The total
carbohydrates and dietary fiber per 100 grams for each flour type were recorded (Table 4.2). The
predicted values per 100 grams were also calculated for the control, the 50/50 navy bean, and the
75/25 navy bean flour mixtures using weighted averages of the values for the component flours
and are included in the table below. By comparing the nutrition facts panels of uncooked flours,
it was concluded that substituting navy bean flour in the 50/50 blend of semolina and “00” flours
will result in a slight decrease in total carbohydrates, a large increase in the dietary fiber, and an
increase in the total protein as shown in Figure 4.5. The change in dietary fiber is large enough to
increase the fiber category of the product from medium fiber to high fiber. The combined change
also decreases the glycemic load, thus converting the ravioli pasta into a healthier choice.
A calculated proximate analysis was performed on the three raw flour blends to be used
to prepare three ravioli types for the sensory study. This analysis was done using Nutritionist
Pro, provided by Axxya System, which also produced the nutrition fact panels. The three
nutrition labels are shown in Figure 4.5 below. The details of the full analysis are included in

56
Appendix E. The nutrition information for the navy bean flour used to create the nutrition panels
was provided by Best Cooking Pulses, Inc. (Manitoba, Canada), the provider of the navy bean
flour, and is included in Figure 4.5 on the top right (see Appendix A). Each nutrition panel
provides the calories, total fat, cholesterol, sodium, total carbohydrates, dietary fiber, protein
content, and other nutritional information per 100 gram serving. The predicted dietary fiber and
total carbohydrates in these nutrition labels match the values predicted in Table 4.2 within
rounding errors. As the substitution level of navy bean flour increased, the fiber increased and
the total carbohydrates decreased. The predicted protein content of the flour also increased with
increasing substitution levels. It is also worth noting that the flour mixtures were predicted to
have approximately the same calorie content despite the differences in total carbohydrate and
protein values.
Table 4.2 Total Carbohydrate and Fiber Content of the Flour Types per 100 Grams
Total
Carbohydrate (g)
Dietary Fiber
(g)
Dietary Fiber
(%DV)
Glycemic
Load (g)
“00” Flour 77 3 13 74
Semolina Flour 74 5 19 69
Navy Bean Flour* 61 24 98 37
Control Flour** 76 4 16 72
50% Navy/50%
Control** 69 14 57 55
75% Navy/25%
Control** 65 19 78 46
*Nutritional data courtesy of www.NutritionData.com.
** Predicted values per 100 grams of flour mixture. The control flour was a 50/50 blend of
enriched semolina flour and “00” flour, a high-gluten flour made from red spring wheat.

57
Figure 4.5 Nutrition Facts Panels for Raw Flour Mixtures. The control, 50% navy bean/50%
control, 75% navy bean/25% control, and 100% navy bean flour mixture panels are shown in
parts a, b, c, and d.
A calculated proximate analysis was also performed for the raw and cooked ravioli
product (without sauce) used in the sensory study. The amount of sauce used for consumer
tasting was not controlled in the sensory study and so is not included in the nutrition labels.
Nutrition fact panels were produced for the raw control ravioli, the raw 50/50 navy bean ravioli,
and the raw 75/25 navy bean ravioli with a standard serving size of 100 grams (Figure 4.6). The
software calculated the nutritional values contributed by each ingredient using the weights of the
a b
c
= d

58
ingredients for each formulation and the nutritional profiles (Table 3.5). Each nutrition panel
provides the calories, total fat, cholesterol, sodium, total carbohydrates, dietary fiber, and protein
content per 100 gram serving. The full analysis is included in Appendix E.
The Nutritionist Pro software does not account for the proper moisture content change
and starch loss for each ravioli type during cooking as observed in Cabello and Uebersax (1990)
and in other literature (Arab et al, 2010; David et al, 2015). However, the practice of using
nutrition labels for raw products is a reasonable one (see Kaur et al, 2011; Kaur et al, 2013;
David et al, 2015; and Mahmoud et al, 2012).
Figure 4.6 Nutrition Facts Panels for Raw Raviolis. From left: control, 50% navy bean/50%
control, and 75% navy bean/25% control raviolis.
The substitution of navy bean flour for the control flour had several effects on the
nutritional profile of the ravioli. The total carbohydrate in the ravioli decreased with increasing
amounts of navy bean flour. The dietary fiber and the protein content increased for higher
substitution levels. The calories, calories from fat, total fat, saturated fat, trans fat, sodium, and
sugars for each ravioli type were either equal or approximately so. The amounts of vitamin A,
vitamin C, and calcium remained unchanged, while the iron level increased.

59
As with the products in the market survey, the fiber level and glycemic load were
calculated from the nutrition label for each ravioli type (see Table 4.3 and Section 4.1.2). The
calculation of the glycemic load assumed that all the resistant starch in the fortified flours was
correctly classified as dietary fiber, which may not be entirely accurate (Nielson, 2010; Sajilata
et al, 2006). The total carbohydrates, calories, and protein content are also included in Table 4.3.
Based on these calculations, the control ravioli was categorized into the LF/HGL food group, and
the 50/50 and 75/25 navy bean ravioli types into the HF/HGL group.
Table 4.3 Total Carbohydrate and Fiber Content of the Flour Mixtures and Ravioli Types
Total
Carbs (g)
Dietary
Fiber (g)
Dietary
Fiber
(%DV)
Glycemic
Load (g) Calories
Protein
(g)
Predicted
Category
Control Ravioli 31 1 5 30 270 14 LF/HGL
50% Navy/50%
Control Ravioli 28 5 21 23 270 17 HF/HGL
75% Navy/25%
Control Ravioli 27 7 29 20 270 18 HF/HGL
*Values predicted by theoretical proximate analysis per 100 grams. HF is high fiber content, MF
is medium fiber content, LF is low fiber content, HGL is high glycemic load, MGL is medium
glycemic load, and LGL is low glycemic load. See Table 3.1 for more details.
A calculated analysis of a 50% fortification of the control ravioli with navy bean flour
resulted in a moderate decrease of glycemic load, a large increase in fiber content, and a slight
increase in protein compared to the control. A 75% substitution saw similar results with larger
differences. These changes increased the fiber classification of the fortified ravioli by two
categories for both fortified ravioli types, but failed to change the glycemic load category for
either one. These predicted changes do not take into account the cooking process used to prepare
the ravioli.

60
Several studies have been performed on the fortification of pasta with various legume
flours. In general, these fortifications resulted in an increase of dietary fiber and protein levels,
depending on the type of legume used, the cooking method used, and the type of processing used
on the flour (Nielson et al, 1980; Sabanis et al, 2006; Arab et al, 2010; David et al, 2015; Kavitha
and Parimalavalli, 2014; Azlan et al, 2011; Gallegos-Infante et al, 2010). In these studies,
proximate analyses were performed either on the raw flours alone or the dried spaghetti produced
with the flours.
A selection of these studies also investigated changes in the pasta during cooking with
various legume substitution levels (see Arab et al, 2010; Gallegos-Infante et al, 2010). One
particular study investigated these effects for a 15% navy bean/85% semolina flour mixture
(Cabello and Uebersax, 1990). This mixture was prepared with a method similar to the one used
in the present research. A proximate analysis was performed on the individual flours, raw pasta,
partially precooked pasta, and fully precooked pasta. The navy bean flour was shown to have a
lower moisture and carbohydrate content and a higher protein, fat and ash content than the
semolina flour used in the study. The lower moisture content reported for 100% navy bean flour
versus 100% semolina flour matches the results presented in Chapter 3 for the Rapid Moisture
Analysis (RMA) of various substitution levels of navy bean flour with the control, although the
moisture levels vary over intermediate substitution levels.
The effect of legume substitution in pasta products in literature varies with the choice of
legume. Petitot et al (2010a, 2010b) substituted 35% of their durum wheat flour with split pea
flour, but did not observe any significant impact on the glycemic load of the product. Gularte et
al (2012) did a similar study using chickpea, pea, lentil and common bean flours, observing a
decrease in glycemic load for all flours except the chickpea combinations. A related study

61
investigated the effects of the substitution of chickpea and pea flours into wheat breads and also
reported a decrease in glycemic load (Angioloni and Collar, 2012). In general, the trend in
literature is a decrease in glycemic load when bean flours are substituted into pasta products,
which is also observed in the current research.
4.2.3 The Protein Digestibility – Corrected Amino Acid Score
The Protein Digestibility – Corrected Amino Acid Score (PDCAAS) for each ravioli type
was calculated using values gathered from literature to estimate the nutritional quality of each
ravioli (Nielson, 2010; Torres et al, 2006; WHO, 2007; Pulse Canada, 2011). The PDCAAS for
any food type is a product of the amino acid score with the percent true digestibility. The amino
acid score is defined as the milligrams of amino acid in one gram of test protein divided the by
number of milligrams of amino acid in one gram of reference protein, where the reference values
used were standards published by the World Health Organization (WHO) (2007). The reference
protein is the protein with the lowest amino acid score. True digestibility “is calculated based on
nitrogen ingested and feed intake, corrected for metabolic losses in the feces” of male weanling
rats (Nielsen, 2010). It can also be calculated based on values given in the literature, although
this does not take into account changes in the true digestibility due to the cooking method (Khan
and Gafoor, 1978).
The amino acid score of each ravioli type was calculated using the food database of the
United States Department of Agriculture (USDA). The amino acid profiles of each ravioli
ingredient were combined using the weights of the ingredients in each recipe. The amino acid
profile of unenriched, bleached, 10% protein industrial white wheat flour was used since type
‘00’ flour was not in the USDA database. This ingredient was chosen due to the similarity of its

62
nutrition facts label to that of the ‘00’ flour used in the ravioli. The amino acid profile of navy
bean flour was also not provided by the Best Cooking Pulses, so raw mature navy bean seeds
were used instead (includes USDA commodity food A918, A924). Using these ingredients in a
comparable calculated proximate analysis resulted in smaller protein contents per 100 gram
serving for each type of ravioli as compared to the original analysis presented in Section 4.2.2.
These replacements resulted in protein contents of 13.8, 15.9, and 16.9 grams for the control,
50/50 navy bean blend, and 75/25 navy bean blend raviolis. The lower protein contents in this
analysis will result in slightly differing PDCAAS values.
The score for each amino acid in the three ravioli types is shown in Table 4.4. The sulfur
amino acids, methionine and cystine, and the aromatic amino acids, phenylalanine and tyrosine,
are combined as done in Neilson (2010). Tryptophan was the limiting amino acid in all three
ravioli types and determines the amino acid score of the product. The amino acid scores of
isoleucine, histidine, and methionine and cystine were also lower than 1, indicating a deficiency
of these amino acids in the ravioli. The amount of each amino acid per serving increased with the
addition of navy bean flour with the exception of the sulfur amino acids. However, the
tryptophan amino acid score slightly decreased due to the increased overall protein content,
decreasing the overall amino acid score of the product.
The true digestibility of each ingredient in the raviolis were gathered from literature and
used to calculate the true digestibility and the PDCAAS of each product (Torres et al, 2007;
WHO, 2007) (Table 4.4). The true digestibility decreased with increasing amounts of navy bean
flour due to the lower availability of the milled navy bean flour compared to the control. The
PDCAAS of the ravioli products thus decreased due to the increase in protein content per
serving, lowering the amino acid score, and the decrease in true digestibility (Table 4.4).
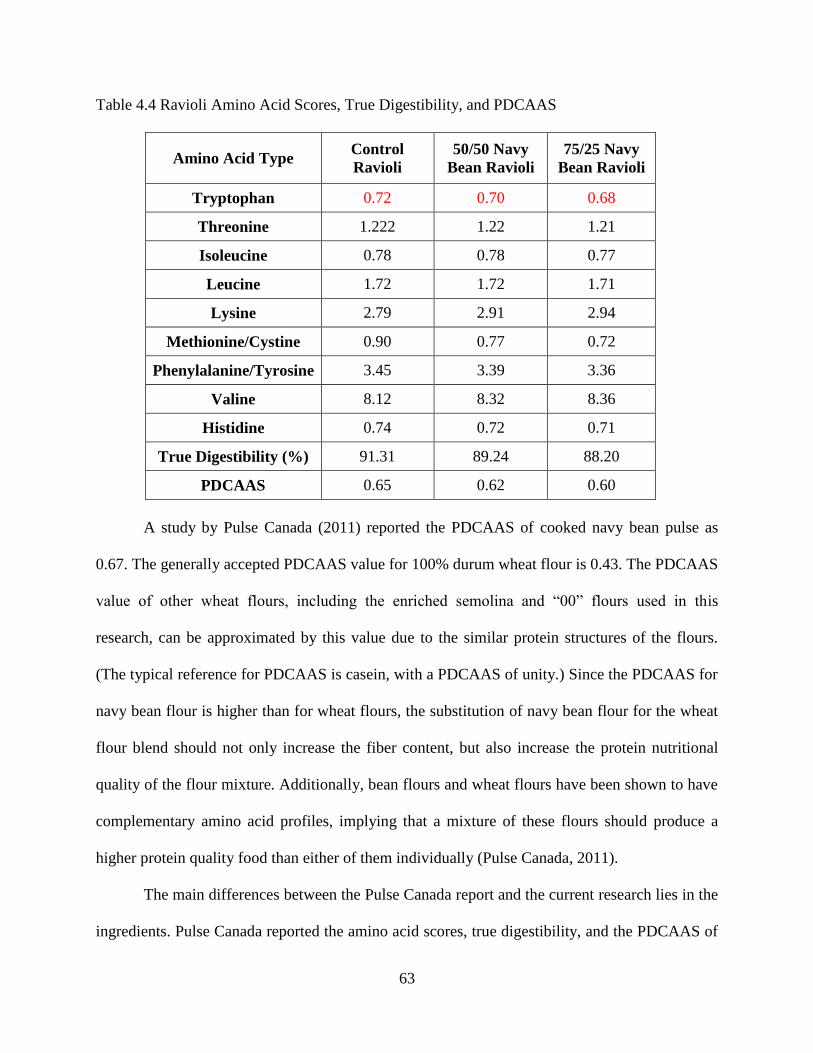
63
Table 4.4 Ravioli Amino Acid Scores, True Digestibility, and PDCAAS
Amino Acid Type Control
Ravioli
50/50 Navy
Bean Ravioli
75/25 Navy
Bean Ravioli
Tryptophan 0.72 0.70 0.68
Threonine 1.222 1.22 1.21
Isoleucine 0.78 0.78 0.77
Leucine 1.72 1.72 1.71
Lysine 2.79 2.91 2.94
Methionine/Cystine 0.90 0.77 0.72
Phenylalanine/Tyrosine 3.45 3.39 3.36
Valine 8.12 8.32 8.36
Histidine 0.74 0.72 0.71
True Digestibility (%) 91.31 89.24 88.20
PDCAAS 0.65 0.62 0.60
A study by Pulse Canada (2011) reported the PDCAAS of cooked navy bean pulse as
0.67. The generally accepted PDCAAS value for 100% durum wheat flour is 0.43. The PDCAAS
value of other wheat flours, including the enriched semolina and “00” flours used in this
research, can be approximated by this value due to the similar protein structures of the flours.
(The typical reference for PDCAAS is casein, with a PDCAAS of unity.) Since the PDCAAS for
navy bean flour is higher than for wheat flours, the substitution of navy bean flour for the wheat
flour blend should not only increase the fiber content, but also increase the protein nutritional
quality of the flour mixture. Additionally, bean flours and wheat flours have been shown to have
complementary amino acid profiles, implying that a mixture of these flours should produce a
higher protein quality food than either of them individually (Pulse Canada, 2011).
The main differences between the Pulse Canada report and the current research lies in the
ingredients. Pulse Canada reported the amino acid scores, true digestibility, and the PDCAAS of

64
a cooked navy bean pulse in comparison to autoclaved wheat flour. The amino acid score and the
true digestibility of the navy bean pulse were assessed in the study. The values for the wheat
flour were calculated based on the 1989 report on protein quality (Pulse Canada, 2011). In the
current research, the amino acid profile of the navy bean flour was approximated using the
USDA database ingredient raw mature navy bean seeds (includes USDA commodity food A918,
A924). The amino acid score of the navy bean pulse could not be used in the calculation of the
amino acid score of the ravioli since the identity of the limiting amino acid was not reported. The
approximation of the amino acid profile of the navy bean pulse is considered the source of error
in the calculation reported in the present research.
4.3: SENSORY AND BLIND STUDIES
4.3.1 Consumer Sensory Study Results
The results of the sensory evaluation of the three ravioli types (with and without sauce)
were analyzed as follows. The average values, standard deviations, and analysis results of each
hedonics question are reported in Tables 4.5 and 4.6. The average percentage of ‘yes’ answers
for the three yes/no questions of each type are given in Tables 4.7 and 4.8.
The ANOVA test reported no differences between the distributions in the aroma of the
ravioli types with and without sauce, so the tukey method was not applied for those entries. The
results of the tukey method are indicated by the subscripts in Tables 4.5 and 4.6. The overall
trend in the tables above is a decreasing approval rate with increasing levels of navy bean flour
substitution, but an overall higher approval rate when the ravioli types were sampled with sauce.
The subscripts indicate that the consumers detected a difference between the 75/25 ravioli blend,

65
with or without sauce, but could not record a significant difference between the control ravioli
and the 50/50 navy bean ravioli.
Table 4.5 Analysis of Hedonics Data for Ravioli Without Sauce
Samples Appearance Aroma Taste Texture Liking
Control 5.9 ± 1.7a 5.5 ± 1.6a 6.1 ± 1.5a 5.7 ± 1.8a 6.0 ± 1.6a
50% Blend 5.5 ± 1.7ab 5.7 ± 1.5a 5.8 ± 1.8ab 5.5 ± 1.8a 5.9 ± 1.9a
75% Blend 5.1 ± 1.9b 5.7 ± 1.5a 5.4 ±1.7b 4.9 ±1.8b 5.3 ± 1.8b
*The average and standard error associated with each hedonic question. Matching subscripts
indicate that the means of those two ravioli were not found to be significantly different at α =
0.05.
Table 4.6 Analysis of Hedonics Data for Ravioli With Sauce
Samples Appearance Aroma Taste Texture Liking
Control 6.8 ± 1.3a 6.7 ± 1.4a 6.7 ± 1.7a 6.3 ± 1.8a 6.4 ± 1.8a
50% Blend 6.4 ± 1.5ab 6.4 ± 1.5a 6.3 ± 1.7ab 5.9 ± 1.8ab 6.2 ± 1.8a
75% Blend 6.1 ± 1.6b 6.3 ± 1.5a 6.1 ± 1.8b 5.5 ± 1.9b 5.3 ± 1.8b
*The average and standard error associated with each hedonic question. Matching subscripts
indicate that the means of those two ravioli were not found to be significantly different at α =
0.05.
The average percentage of yes answers for the three yes/no questions are reported in the
two tables below. Table 4.7 gives the percentages for each question for the ravioli types without
sauce. Table 4.8 gives the percentages for the ravioli sampled with sauce. The bean flavor
question was phrased so that a ‘yes’ answer was a negative review. The remaining two questions
were phrased in a way that a ‘yes’ answer indicated a positive review.

66
A portion of the consumers reported a detectable bean flavor in the control ravioli,
indicating a false positive detection rate of 16.5% without sauce and 7.8% with sauce. A
substantially larger portion of the consumers detected a bean flavor with the bean ravioli types,
although this number was smaller for the ravioli types sampled with sauce. The majority of the
consumer base found all of the ravioli types acceptable, with or without sauce. The acceptability
percentages of the control and the 50/50 navy bean ravioli were within 2% of each other
regardless of the presence of sauce, but the acceptability of the 75/25 navy bean ravioli was
substantially lower than the other two in both cases. In general, the acceptability of the ravioli
types increased when sampled with sauce. This trend also held for the consumer’s purchase
intent of the ravioli types. The percentage of consumers who indicated a positive purchase intent
for the ravioli types decreased with increasing navy bean flour substitution level regardless of the
presence of sauce, but were overall larger when the ravioli were sampled with sauce.
Table 4.7 Percentages of “Yes” Responses for Ravioli Without Sauce in Consumer Sensory
Study
Samples Detectable
Beany Flavor Acceptability
Purchase
Intent
Control 16.5% 80.6% 52.4%
50% Blend 35.0% 78.6% 46.6%
75% Blend 37.9% 64.1% 31.3%
The percentages reported in Tables 4.7 and 4.8 also show a preference for the 50/50 navy
bean ravioli over the 75/25 navy bean ravioli. Based on these results, a 50/50 navy bean ravioli
with sauce is recommended. Lower substitution levels of navy bean flour should also be
considered given the pasting properties and nutritional components of those substitution levels
discussed in previous sections.

67
Table 4.8 Percentages of “Yes” Responses for Ravioli With Sauce in Consumer Sensory Study
Samples Detectable
Beany Flavor Acceptability
Purchase
Intent
Control 7.8% 84.5% 63.1%
50% Blend 22.3% 82.5% 54.4%
75% Blend 19.4% 71.8% 43.7%
An early study of a similar substitution method in pasta indicates favorable consumer
reports in terms of color, texture, and flavor of the pasta, but deteriorated the noodle dough
handling characteristics of the pasta dough (Nielson et al, 1980). The favored pasta in this study
was red spring wheat spaghetti with 33% of the wheat flour replaced with pea flour. This
substitution level was chosen to obtain an optimum composition of protein (an early version of
the PDCAAS). A later study also found a 30% substitution of broad bean flour in place of wheat
bread flour to give a favorable change in the nutritional content of the flour (Gimenez et al,
2012). The study also reports no detectable change in the texture, flavor, or physical-chemical
properties of the spaghetti produced with a 30% substitution of broad bean flour.
The results in these two studies are similar to those presented here, but with certain
differences. While the studies discussed above investigated the basic physical-chemical
properties of pasta flour at low bean flour substitution levels, the results here investigate the
effects of bean flour substitution at discrete intervals up to 100%. A variety of studies have
shown legume-fortified pasta to be acceptable to consumers at low substitution levels, generally
for 30% substitution level and below (Nielson et al, 1980; Gimenez et al, 2012; Zhao et al, 2005;
Sabanis et al, 2006). In general, these papers also report a decreasing consumer acceptance with
increasing substitution levels, which is also the general trend here.

68
4.3.2 Blind Consumer Survey Results
The analysis presented below is based on the 38 participants age 65 years and older who
consumed frozen pasta meals as of the date of the survey. The participants in the survey were
asked six ‘yes or no’ questions concerning specific characteristics of each product: purchase
history, consumption, taste, texture, aroma, and color (see Fig. 3.4 for more details). Each
question was phrased in a way that a ‘yes’ choice resulted in a favorable answer about the
product in question. An additional entry field for each product allowed the participant to
comment on the products as desired.
The total number of votes for each product in the four attribute categories (taste, texture,
aroma, and color) are shown by the grey line in Figure 4.7 below. The product numbers shown
on the horizontal axis are the same as the order used in the blind consumer survey form. (The
first product referenced in the survey form is indicated here as product 1, the second as product
2, and so on.) Only the votes of the participants that indicated consumption of that product were
used in that product’s total. A total vote count of zero means there were no participants that
indicated consumption of the product, as was the case for product numbers 7, 17, and 18.
The percentage of total “no” votes for each product was calculated using the total number
of “no” votes, again only using the attribute categories, compared with the total number of votes
as described above. These percentages are shown by the height of the black columns in Figure
4.7. The percentage of “no” votes for product numbers 2, 5, 9, 10, 11, 13, 15, and 16 were all
zero, meaning the participants that consumed those products did not find anything wrong with
the taste, texture, aroma, or color of those products. Since the purpose of this analysis is to find
what is wrong with the products selected, the responses concerning these products were not
analyzed further.

69
Figure 4.7 Total Voting Statistics For Blind Consumer Survey. The black bars indicate the total
percentage of “no” votes recorded for each product for the taste, texture, aroma, and color
categories. The grey line indicates the number of total votes recorded per product in the same
categories.
However, this satisfactory trend did not hold for the remaining products. Product
numbers 1, 3, 4, 6, 8, 12, and 14 all had a nonzero value for the total number of votes and for the
percentage of “no” votes, indicating the participants that consumed those products found
something wrong with them. Figure 4.8 shows a more detailed comparison for these products.
This figure shows the percentage of “no” votes calculated individually for the four attribute
categories (taste, texture, aroma, and color) for each product. For ease of comparison, the same
range was chosen for the vertical axis in each of the graphs. This calculation was performed by
dividing the number of “no” votes by the total number of votes for each attribute category of
each product and then converting the number to a percent. Again, only the votes cast by the
0
20
40
60
80
0
10
20
30
40
1 2 3 4 5 6 7 8 9 10 11 12 13 14 15 16 17 18
Nu
mb
er o
f To
tal V
ote
s
Per
cen
tage
of
"No
" V
ote
s
Product Number

70
participants indicating consumption of the product were used in these calculations. It should be
noted that the total number of votes in each category were not equal for the categories of the
same product.
In this figure, a high percentage of “no” votes in a particular category means a large
percentage of the participants indicating consumption of the product had a problem with the
indicated attribute category for that product. The data for product 1 indicates the texture and
color of the product were not attractive for a substantial percentage of the consumer of that
product, with the remaining two categories showing a low percentage of dissatisfaction. The only
problematic category for product 3 was the texture attribute, with one-third of the consumers
rating this category as unsatisfactory. For product 4, the attribute categories with the highest
percentage of “no” votes were the taste and texture categories. The percentage of consumers that
found the remaining two categories (aroma and color) unappealing was less than 6% per
category. Although the percentages reported for product 6 were all near 10% or lower, more of
consumers disliked the taste and texture more than the aroma and color.
The percentage of “no” votes for product 8 were recorded only for the texture and color
attribute categories for the product, resulting in relatively high percentages in those categories.
This indicates the taste and aroma of the product were satisfactory, but the texture and color need
improvement. Three of the four attribute categories for product 12 were rated as unsatisfactory
with more than 30% in those categories. The color of this product was generally acceptable since
the disapproval rate was near 10%. Product 14 received highly unfavorable ratings in the texture
and taste categories, but no problems were recorded with the color. The aroma of the product
was reasonably acceptable with about 15% of the consumers rating the aroma as unattractive.

71
Figure 4.8 Attribute Voting Statistics For Blind Consumer Survey. The black bars indicate the
percentage of “no” votes recorded for each product for the taste, texture, aroma, and color
categories. Parts a-g show the data for products 1, 3, 4, 6, 8, 12, and 14, respectively.
0
10
20
30
40
50
Taste Texture Aroma Color
% o
f "
No"
Vote
s
0
10
20
30
40
50
Taste Texture Aroma Color
% o
f "
No"
Vote
s 0
10
20
30
40
50
Taste Texture Aroma Color
% o
f "
No"
Vote
s
0
10
20
30
40
50
Taste Texture Aroma Color
% o
f "
No"
Vote
s
0
10
20
30
40
50
Taste Texture Aroma Color
% o
f "
No"
Vote
s
0
10
20
30
40
50
Taste Texture Aroma Color
% o
f "
No"
Vote
s
a
d
e
0
10
20
30
40
50
Taste Texture Aroma Color
% o
f "
No"
Vote
s
b
c
f
g

72
Based on these graphs, products 1, 12 and 14 were found to have the highest overall
disapproval ratings. The majority of these rating were mostly recorded in the texture category,
although the other categories provided a significant contribution as well. Products 4 and 6 were
found to be acceptable, with disapproval ratings in each attribute category generally below 20%.
The remaining products (1, 3, 8, 12, and 14) all received more than a 30% disapproval rating in
at least one of the attribute categories, indicating improvement is needed for these attributes of
these products.
Participants in the survey who did not consume any of the products generally indicated a
preference for fresh pasta meals or other fresh foods. One such participant indicated
dissatisfaction with the generally high sodium content of frozen pasta. Other participants cited
lack of availability or appeal as reasons for not purchasing some of the products. A smaller
number of participants found the number of calories and fat too high in some of the products, and
so did not purchase them. Still others mentioned a lack or abundance of spice or a lack of flavor
as one of the reasons for their dissatisfaction with the frozen pasta meals that were consumed. In
general, the participants that did not purchase one or more of the frozen pasta meals did so
because of the low appeal compared to fresh foods or because that product was not available at
the store where they shop. Others found the nutritional value of the product unsatisfactory due to
high sodium, fat, and calorie levels and did not purchase the item.
The appeal of these products may be increased by encouraging the manufacturer’s to use
fresh ingredients in their products, preferably from local farmers. Indicating this on the front of
the product packaging may increase the appeal of the product due to the observed favorability of
some consumers towards local farmers (Halweil, 2002). The substitution of navy bean flour for a
portion of the pasta flour in these products is not predicted to change the sodium, fat, or calorie

73
levels by a significant amount, and so does not address the issues consumers mentioned in the
blind consumer survey (see Section 4.2.2). However, this substitution is predicted to increase the
fiber and protein content of the product and decrease the glycemic load, thus making these
products healthier choices. These changes will help older individuals consume the recommended
levels of fiber and protein without adding additional calories to their diets.
The use of navy bean flour in ravioli was observed to generally decrease the approval
ratings in the appearance, aroma, taste, and texture categories in the sensory study reported in the
previous section (see Section 4.3.1). These decreases were not significant at a 50% substitution
level when compared to a control, but became significant in most categories at a 75%
substitution level. Consequently, the substitution of navy bean flour at a 50% level or lower into
the frozen pasta products discussed above is not predicted to change the approval (or
disapproval) ratings of that product, but is predicted to increase their nutritional value. Some
studies have reported an increase in the approval of the flavor of their durum wheat pasta when
bean flour was added (Sabanis et al, 2006). Although that effect was not investigated here, it
would address some of the comments given by the participants in the blind consumer survey.
4.4: SUMMARY AND FURTHER RESEARCH
4.4.1 Summary
In the research presented here, a market survey was performed to analyze the types of
prepared meals available across the various price categories in the greater Baton Rouge area. The
majority of these products were categorized into unhealthy fiber and glycemic load categories. A
more focused market survey revealed 80% of the frozen pasta meals available were classified as
unhealthy options with medium or low fiber contents. If the fiber content of these products could

74
be increased and the glycemic load decreased, then these unhealthy food choices would become
reasonably healthy choices.
The proposed way to increase the fiber content of pasta products was to substitute part of
the flour used to produce the pasta with navy bean flour. This bean flour choice was made by
comparing the RVA testing results of various mixtures of pinto, black, and navy bean flours with
a control blend of enriched semolina flour and “00” flour. A 50 percent substitution ratio of navy
bean flour is predicted to decrease the glycemic load by seven grams and to increase in fiber
content by 16% DV. These increases resulted in no change to the glycemic load category of the
product and a double category shift (LF to HF) in the fiber content category. This partial
substitution also resulted in a predicted increase in the protein level. The PDCAAS of the ravioli
decreased with the addition of navy bean flour due to the decreasing amount of tryptophan in the
flour blend and the decrease in the calculated true digestibility of the product.
The sensory characteristics of the control and navy bean raviolis were also compared in a
consumer sensory study. An ANOVA test was performed on these results, showing a detectable
preference for the 50/50 navy bean ravioli over the 75/25 version. Thus, the 50/50 navy bean
ravioli and similar substitution levels are recommended for further development. When selecting
other possible substitution levels of navy bean flour, the quality differences reported in the RVA
results should be considered in balance with the predicted nutritional profile and protein quality
of those flour mixtures. These products should be tested in a manner similar to that presented
here.
A blind consumer study was conducted using frozen pasta meals selected from the frozen
pasta market survey on seniors 65 years and older to assess their preferences. Several of the
products were found to have high disapproval ratings in one or more of the four attribute

75
categories (taste, texture, aroma, and color). The substitution of navy bean flour into these
products at a 50% substitution level or lower is not predicted to decrease (or increase) the
acceptability of these products, but is predicted to increase their nutritional value. This change
will help older individuals consume the recommended nutritional spectrum without adversely
affecting their diet.
4.4.2 Further Research
Although the nutritional value of the control ravioli was increased by the substitution of
navy bean flour, a few of the nutritional values bear further consideration. A large portion of the
sodium content of the product came from the parmesan cheese and the table salt added to the
dough. The sodium level can be reduced by approximately 50% by simply replacing the
parmesan cheese with whole milk ricotta cheese. Removing the salt from the recipe would
decrease the sodium content by an additional 30%, although the effect on taste remains to be
tested. The combined decrease in sodium resulting from these two changes would make the
product more attractive to seniors with restricted sodium diets.
The calculated proximate analysis of the three ravioli produced predicted an increase in
fiber with increasing bean flour substitution as expected. The protein level was also predicted to
increase with larger amounts of bean flour while the glycemic load (digestible carbohydrates)
was predicted to decrease. It is recommended that a proximate chemical analysis of the three
ravioli produced by performed to measure changes in total carbohydrates, insoluble fiber, soluble
fiber, dietary fiber, protein levels, amino acid profiles, glycemic load, and protein quality. The
results of these tests can be used to track the changes in the nutritional profile of the ravioli as
bean flour substitution levels increase.

76
Even though the nutrition facts panel on the finished product may portray healthy
contents, the consumer will not purchase the item more than once if the flavor profile of the
product is not satisfactory. Since the ANOVA tests revealed a preference for each ravioli type
with sauce compared to the same ravioli without sauce, it would be wise to add a thoughtfully
prepared sauce to the ravioli before commercialization. The flavor profile of the sauce should be
appealing, but the added nutritional value should not substantially increase the glycemic load of
the finished product. The cheeses for the ravioli filling should also be chosen by the same
standards. Mild cheeses are recommended based on a generally low sodium content and a low
glycemic index due to its low carbohydrate level.
Other options for future research include creating composed frozen meals based on the
bean pasta produced, possibly including meat, vegetables, fruit, and other various items to
complement the amino acid profile of the ravioli. These meals may also provide more appealing
options than the basic pasta presented in this thesis. It would also be interesting to consider an
additional substitution of the remaining control flour with various vegetable flours to further
increase the nutritional value of the meal. Sensory surveys of these options should be conducted
in a manner to address the issues recorded in the blind consumer survey.
In conclusion, this thesis reports an increase in nutritional value of a frozen pasta product
by substituting a portion of the standard pasta flours for navy bean flour. The substitution
resulted in a predicted large increase in fiber content, a moderate decrease in glycemic load, an
increase in protein content, and a decrease in protein quality, thereby increasing the overall
predicted nutritional value of the pasta product. A consumer sensory test indicated little
difference in preference between the 50/50 navy bean pasta product and a semolina/”00” flour
blend. However, a preference was indicated when the 75/25 navy bean ravioli product was much
77
less preferred compared to the same standard product. It is recommended that the 50/50 navy
bean ravioli be further researched to optimize the navy bean flour substitution level, to reduce its
sodium content, and to improve its flavor profile by the various methods discussed.

78
REFERENCES
Angioloni, Alessandro, and Concha Collar. "High legume-wheat matrices: an alternative to
promote bread nutritional value meeting dough viscoelastic restrictions." European Food
Research and Technology 234.2 (2012): 273-284.
Arab, EA Abou, I. M. F. Helmy, and G. F. Bareh. "Nutritional evaluation and functional
properties of chickpea (Cicer arietinum L.) flour and the improvement of spaghetti produced
from its." Journal of American Science 6.10 (2010): 1055-1072.
Azlan, Azrina and Amom, Zulkhairi and Megat Radzi, Megat Rusydi and C. W., Noraliza.
"Nutritional changes in germinated legumes and rice varieties." International Food Research
Journal 18.2 (2011): 705-713.
Batey, Ian L., and Barbara Curtin. "Effects on Pasting Viscosity of Starch and Flour from
Different Operating Conditions for the Rapid Visco Analyser." 77.6 (2000): 754-60.
Bazzano, Lydia A., Jiang He, Lorraine G. Ogden, Catherine Loria, Suma Vupputuri, Leann
Myers, and Paul K. Whelton. "Legume consumption and risk of coronary heart disease in US
men and women: NHANES I Epidemiologic Follow-up Study." Archives of Internal Medicine
161.21 (2001): 2573-2578.
Blumberg, Jeffrey. "Nutritional needs of seniors." Journal of the American College of Nutrition
16.6 (1997): 517-523.
Boloorforooshan, M., and P. Markakis. "Protein supplementation of navy beans with sesame."
Journal of Food Science 44.2 (1979): 390-391.
Cabello, C. S., M. A. Uebersax. “Formulation of Bean Flour Pasta Suitable foor Microwave
Cooking.” Bean Improvement Cooperative 33 (1990):139-140.
Committee on Diet and Health, Food and Nutrition Board, Commission on Life Sciences,
National Research Council. “Diet and Health, Implications for Reducing Chronic Disease Risk.”
Washington D. C.: National Academy Press, 1989.
"Consumer Behavior Market Research Reports & Industry Analysis." Consumer Behavior
Market Research Reports & Consumer Behavior Industry Analysis. Web. 09 April 2016.
Costa, Ana I.A., and Wim M.F. Jongen. "Designing new meals for an ageing population."
Critical reviews in food science and nutrition 50.6 (2010): 489-502.
David, Oppong, Eric Arthur, Samuel Osei Kwadwo, Eric Badu, Patrick Sakyi. “Proximate
Composition and Some Functional Properties of Soft Wheat Flour.” Intl J of Innovative Res in
Sci, Eng, and Technol 4.2 (2015).

79
Fankhauser-Notl, Anja, Sandra Biedermann-Brem, Koni Grob. “PVC Plasticizers/Additives
Migrating from the Gaskets of Metal Closures into Oily Food: Swiss Market Survey June 2005.”
Eur ¬Food Res Technol, 233 (2006): 447-453.
Food and Drug Administration, Department of Health and Human Services. “21 CFR 101.54
Code of Federal Regulations: Food Labeling.” Title 21, Volume 2, Part 101, Subpart D, Section
101.54, (2015).
Food and Drug Adminstration. "FDA Food Label Helps Consumers Make Healthier Choices
Search the Consumer Updates Section." 27 Mar 2008. Web.
Gallegos-Infante, J.A., L. A. Bello-Perez, N. E. Rocha-Guzman, R. F. Gonzalez-Laredo, and M.
Avila-Ontiveros. “Effect of the Addition of Common Bean (Phaseolus Vulgaris L.) Flour on the
In Vitro Digestibility of Starch and Undigestible Carbohydrates in Spaghetti.” J Food Sci. 75.5
(2010).
Geila, P. B., and J. W. Anderson. "And Health Implications of Dry Beans: A Review." Jol of the
American College of Nutrition 13.6 (1994): 549-58.
Giménez, M. A., R.J. González, J. Wagnerc, R. Torresb, M.O. Loboa, and N.C. Sammana.
"Effect of extrusion conditions on physicochemical and sensorial properties of corn-broad beans
(Vicia faba) spaghetti type pasta." Food chemistry 136.2 (2013): 538-545.
Giménez, M. A., S. R. Drago, De D. Greef, R. J. Gonzalez, M. O. Lobo, and N. C. Samman.
"Rheological, Functional and Nutritional Properties of Wheat/broad Bean (Vicia Faba) Flour
Blends for Pasta Formulation." Food Chem 134.1 (2012): 200-06.
Goñi, Isabel, and Carmen Valentı́n-Gamazo. "Chickpea flour ingredient slows glycemic response
to pasta in healthy volunteers." Food Chemistry 81.4 (2003): 511-515.
Grosvenor, Mary B., and Lori A. Smolin. Nutrient Composition of Foods. John Wiley &Sons,
2010.
Gularte, Márcia Arocha, Manuel Gómez, and Cristina M. Rosell. "Impact of legume flours on
quality and in vitro digestibility of starch and protein from gluten-free cakes." Food and
Bioprocess Technology 5.8 (2012): 3142-3150.
Halweil, Brian. “Home Grown: The Case for Local Food in a Global Market.” Worldwatch
Paper 163 (2002).
Hangen, L., and M. R. Bennink. "Consumption of Black Beans and Navy Beans (Phaseolus
Vulgaris) Reduced Azoxymethane-Induced Colon Cancer in Rats." Nutrition and Cancer – An
International Journal 44.1 (2002): 60-65.

80
Higdon, J. "Glycemic index and glycemic load." Linus Pauling Institute, Corvallis, OR (2005).
Hu, Frank B., and Walter C. Willett. "Optimal diets for prevention of coronary heart disease."
Jama 288.20 (2002): 2569-2578.
Jacobs, H., Eerlingen R. C., Clauwert W., and Delcour J. A. "Influence of annealing on the
pasting properties of starches from varying botanical sources." Cereal chemistry 72.5 (1995):
480-487.
Johnson, R. B. Method for Determining and Representing Food Products Based on Nutrient
Density Rating and Predicted Satiating Effect. Condenet, Inc., assignee. Patent 7,620,531. 17
Nov. 2009. Print.
Kammer, Lynne. "Dietary Considerations of Protein Quality." The University of Texas at Austin.
Web. 12 Mar. 2016.
Karter, Andrew J., Lynn M. Ackerson, Jeanne A. Darbinian, Ralph B. D’Agostino, Assiamira
Ferrara, Jennifer Liu, and Joe Selby. "Self-monitoring of Blood Glucose Levels and Glycemic
Control: The Northern California Kaiser Permanente Diabetes Registry." The American Jol of
Medicine 111.1 (2001): 1-9. Web.
Kaur, Gurpreet, Savita Sharma , H. P. S. Nagi, and P. S. Ranote. “Enrichment of Pasta with
Different Plant Proteins.” J of Food Sci and Technol 50.5 (2013): 1000-1005.
Kaur, Gurpreet, Savita Sharma, H. P. S. Nagi, and P. S. Ranote. “Functional Properties of Pasta
Enriched with Variable Cereal Brans.” J Food Sci Technol. 49.4 (2012): 467–474.
Kavitha, S., and R. Parimalavalli. “Effect of Processing Methods on Proximate Composition of
Cereal and Legume Flours.” J of Human Nutrition and Food Sci 2.4 (2014): 1051.
Kerns, Michelle. "The Beans-Only Diet." Live Strong. Mar.-Apr. 2016. Web.
Kezis, Alan, Thula Gwebu, Stephanie Peavey and Hsiang-tai Cheng. “A Study of Consumers at a
Small Farmers' Market in Maine: Results from a 1995 Survey.” J of Food Distribution Res
(1998): 91-99.
Khan, Arbab Riaz; Sahib Alam, Sajid Ali, Saiqa Bibi, Iqtidar A. Khalil. “Dietary Fiber Profile of
Food Legumes.” Sarhad J. Agric. 23.3 (2007).
Khan, Mohammed Akmal, and Abdul Ghafoor. "The effect of soaking, germination and cooking
on the protein quality of mash beans (Phaseolus mungo)." Journal of the Science of Food and
Agriculture 29.5 (1978): 461-464.
Kleintop, Adrienne. “Adaptation of the AOAC 2011.25 Integrated Total Dietary Fiber Assay to
Determine Fiber and Oligosaccharide Content of Dry Edible Bean.” J. of Agric. and Food Chem.
61.40 (2013): 9717-9726.

81
Lichtenstein, Alice H., et al. "Diet and lifestyle recommendations revision 2006 A scientific
statement from the American Heart Association nutrition committee." Circulation 114.1 (2006):
82-96.
Liese, Angela D., Mandy Schulz, Fang Fang, Thomas Wolever, Ralph B. Agostino,, Karen C.
Sparks, and Elizabeth J. Mayer-Davis. "Dietary Glycemic Index and Glycemic Load,
Carbohydrate and Fiber Intake, and Measures of Insulin Sensitivity, Secretion, and Adiposity in
the Insulin Resistance Atherosclerosis Study." Diabetes Care 28.12 (2005). Web.
Mahmoud, Eman A. M., Shereen L. Nassef, Amany M.M. Basuny. “Production of High Protein
Quality Noodles using Wheat Flour Fortified with Different Protein Products from Lupine.”
Annals of Agric Sci 57.2 (2012): 105-112.
Malhotra, S.L. “Epidemiological Study of Cholelithiasis Among Rail Road Workers in India.”
Gut 9 (1968):290–5.
Martinez et al, 2004. Martinez-Flores, H.E., Yoon-Kil-Chang, F. Martinez-Bustos, V. Sgarbieri.
“Effect of High Fiber Products on Blood Lipids and Lipoproteins in Hamsters.” Nutr Res 24.1
(2004):85–93.
Mateljan, George. "World's Healthiest Foods." Seattle: GMF, 2007. Print.
Mendosa, David. "International Table of Glycemic Index (GI) and Glycemic Load (GL)
Values—2008." Web. 1 Jan. 2016.
Messina, Mark J. "Legumes and Soybeans: Overview of Their Nutritional Profiles and Health
Effects." Am J Clin Nutr 70.3 (1999): 439s-50s. Web. 1 Sept. 2016.
Monro, J. A., and M. Shaw. "Glycemic Impact, Glycemic Glucose Equivalents, Glycemic Index,
and Glycemic Load: Definitions, Distinctions, and Implications1–5." J Clin Nutr 87.1 (2008):
237S-43S. Web.
Morais, M.B., A. Feste, R. G. Miller, and C. H. Lifichitz. “Effect of Resistant Starch and
Digestible Starch on Intestinal Absorption of Calcium, Iron and Zinc in Infant Pigs. Paediatr Res
39.5 (1996):872–6.
Morita, T., S. Kasaoka, K. Hase, S. Kiriyama S. “Psyllium Shifts the Fermentation Site of High-
Amylose Cornstarch Toward the Distal Colon and Increases Fecal Butyrate Concentration in
Rats.” J Nutr 129 (1999):2081–7.
Mozaffarian, Dariush, Shiriki K. Kumanyika, Rozenn N. Lemaitre, Jean L. Olson, Gregory L.
Burke, and David S. Siscovick. "Cereal, Fruit, and Vegetable Fiber Intake and the Risk of
Cardiovascular Disease in Elderly Individuals." JAMA (2003): 1659-666. Web.
National Research Council, National Academy of Sciences. “Diet and Health Implications for
Reducing Chronic Disease Risk.” Washington D. C.: National Academy Press, 1989.

82
Nielson, M. A., A. K. Sumner, and L. L. Whalley. "Fortification of Pasta with Pea Flour and Air
Classified Pea Protein Concentrate." Cereal Chem 57.3 (1980). Web. 11 Nov. 16.
Nielson, Suzanne, ed. Food Analysis. New York: Springer, 2010. Print.
Numata, K., Tanaka K, Saito M, Shishido T, Inoue S. "Very low calorie diet-induced weight loss
reverses exaggerated insulin secretion in response to glucose, arginine and glucagon in obesity."
International journal of obesity and related metabolic disorders: journal of the International
Association for the Study of Obesity 17.2 (1993): 103-108.
Office of Disease Prevention and Health Promotion, Office of the Assistant Secretary for Health,
Office of the Secretary, U.S. Department of Health and Human Services. “2010 Dietary
Guidelines.” (2010).
Ohaus. “Instruction Manual MB45 Moisture Analyzer.”
Pereira, Mark A., Eilis O'Reilly, Katarina Augustsson, Gary E. Fraser, Uri Goldbourt, Berit L.
Heitmann, Goran Hallmans, Paul Knekt, Simin Liu, Pirjo Pietinen, Donna Spiegelman, June
Stevens, Jarmo Virtamo, Walter C. Willett, and Alberto Ascherio. "Dietary fiber and risk of
coronary heart disease: a pooled analysis of cohort studies." Archives of internal medicine 164.4
(2004): 370-376.
Perten Instruments. “Perten Instruments Method Description RVA Method 11.06, Durum
Method.” (2006).
Petitot, Maud, Cécile Barron, Marie-Hélène Morel, and Valérie Micard. “Impact of Legume
Flour Addition on Pasta Structure: Consequences on Its In Vitro Starch Digestibility.” Food and
Bioprocess Technol 5.8 (2010a): 3142-3150.
Petitot, Maud, Valérie Micard. “Legume-Fortified Pasta. Impact of Drying and Precooking
Treatments on Pasta Structure and Inherent In Vitro Starch Digestibility.” Food Biophysics 5.4
(2010b): 284-299.
Pulse Canada. “Protein Quality of Cooked Pulses (PDCAAS Method).” Winnipeg: Pulse
Canada, 2011.
Raben, A., A. Tagliabue A, N. J. Christensen, J. Madsn, J. J. Holst, and A. Astrup. “Resistant
Starch: The Effect on Postprandial Glycemia, Hormonal Response and Satiety. Am J Clin Nutr
60 (1994):544–51.
Radwan, Mohamed A., and Ahmed K. Salama. “Market Basket Survey for Some Heavy Metals
in Egyptian Fruits and Vegetables.” Food and Chem Toxic 44.8 (2006): 1273–1278.
Reader et al, 1997. Reader, D., M. L. Johnson, P. Hollander, M. Franz. “Response of Resistant
Starch in a Food Bar Vs. Two Commercially Available Bars in Persons with Type II Diabetes
Mellitus.” Diabetes 46.1 (1997):254A.

83
Sabanis, Dimitrios, Eleousa Makri; Georgios Doxastakis. “Effect of Durum Flour Enrichment
with Chickpea Flour on the Characterisatics of Dough and Lasagne.” J Sci Food Agric: 86
(2006): 1938-1944.
Sajilata, M. G., Rekha S. Singhal, and Pushpa R. Kulkarni. “Comprehensice Reviews in Food
Science and Food Safety.” Inst of Food Technol 5 (2006).
Schoofa, R. A., L.J Yosta, J Eickhoffb, E.A Creceliusc, D.W Cragind, D.M Meachere, D.B
Menzele. “A Market Basket Survey of Inorganic Arsenic in Food.” Food and Chem. Toxic. 37.8,
(1999): 839–846.
Shewry, Peter R., Nigel G. Halford, Peter S. Belton, and Arthur S. Tatham. “The Structure and
Properties of Gluten: An Elastic Protein from Wheat Grain.” Lond B Biol Sci. 357.1418 (2002):
133–142. Web.
Shogren, R. L., G.A. Hareland and Y.V. Wu. “Sensory Evaluation and Composition of Spaghetti
Fortified with Soy Flour.” J of Food Sci 71.6 (2006): S428-S432.
Shogren, Jason F., John A. Fox, Dermot J. Hayes and Jutta Roosen. “Observed Choices for Food
Safety in Retail, Survey, and Auction Markets.” Am J of Agric Econ 81.5 (1999): 1192-1199.
Published by: Oxford University Press on behalf of the Agricultural & Applied Economics.
Siddiq, Muhammad, and Mark A. Uebersax. Dry Beans and Pulses Production, Processing and
Nutrition. Somerset: Wiley, 2012. Print.
Thermo Fisher Scientific. “NESLAB RTE Series Refrigerated Bath Thermo Scientific Manual
P/N U00694.” (2007).
Torres, Alexia, Juana Frias, Marisela Granito, and Concepcio ́n Vidal-Valverde. “Germinated
Cajanus Cajan Seeds as Ingredients in Pasta Products: Chemical, Biological and Sensory
Evaluation.” Food Chem 101 (2007): 202–211.
Vann, Madeline R. “The 15 Most Common Health Concerns for Seniors.” (2015).
Wadden, Thomas A., and Albert J. Stunkard. "Controlled trial of very low calorie diet, behavior
therapy, and their combination in the treatment of obesity." Journal of consulting and clinical
psychology 54.4 (1986): 482.
Wald, Arnold. "Patient Information: High-fiber Diet (Beyond the Basics)." High-fiber Diet.
UpToDate, 11 Apr. 2016.
Wing, Rena R., Wei Lang, Thomas A. Wadden, Monika Safford, William C. Knowler, Alain G.
Bertoni, James O. Hill, Frederick L. Brancati, Anne Peters, Lynne Wagenknecht, and the Look
AHEAD Research Group. "Benefits of modest weight loss in improving cardiovascular risk
factors in overweight and obese individuals with type 2 diabetes." Diabetes care 34.7 (2011):
1481-1486.

84
World Health Organization, Food and Agriculture Organization of the United Nations, and
United Nations University. “Protein and Amino Acid Requirements in Human Nutrition.” WHO
Technical Report Series 935 (2007).
Zhao, Yonghuan H., Frank A. Manthey, Sam K. C. Chang, Home-Jer Hou, and Shaohong H>
Yuan. “Quality Characteristics of Spaghetti as Affected by Green and Yellow Pea, Lentil, and
Chickpea Flours” J. of Food Sci. 70.6 (2005).

85
APPENDIX A: NUTRITION PROFILES OF BEANS
Navy bean flour, pinto bean flour, and black bean flour were analyzed as prospective
components of a ravioli product. The nutritional data for these bean flours are presented in the
following pages (Figures A.1, A.2, and A.3). The nutritional profile for the navy bean flour
(Chapter 4, Figure 4.7) was calculated using the data included in this appendix. The bean flours
and their nutritional data included here were provided by Best Cooking Pulses, Inc.
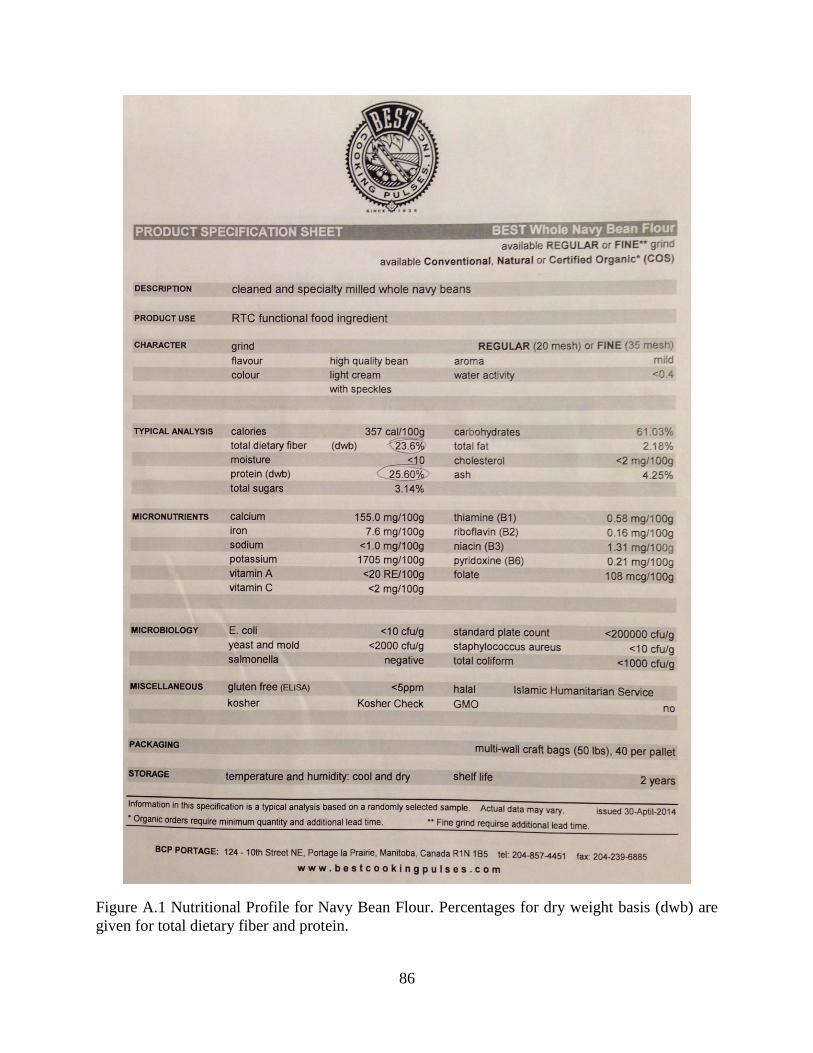
86
Figure A.1 Nutritional Profile for Navy Bean Flour. Percentages for dry weight basis (dwb) are
given for total dietary fiber and protein.

87
Figure A.2 Nutritional Profile for Pinto Bean Flour. Percentages for dry weight basis (dwb) are
given for total dietary fiber and protein.

88
Figure A.3 Nutritional Profile for Black Bean Flour. Percentages for dry weight basis (dwb) are
given for total dietary fiber and protein.

89
APPENDIX B: MARKET SURVEY DATA
The nutritional information for each product in the market survey is included in the
following pages (Table B.1). A selection of information from each product’s nutrition facts label
are included in the spreadsheet: calories, total cholesterol, total fat, sodium, total carbohydrates,
total sugars, total fiber, and total protein per serving. The total fiber is also presented as a percent
daily value for classification into the high fiber, low fiber, and medium fiber groups as per FDA
regulations. The amount of digestible carbohydrates per serving was calculated by subtracting
the total fiber levels from the total carbohydrates as done in Liese et al, 2005. The item type is
indicated by the letters in the item number column, where ‘d’ means the item was a dry item, ‘f’
means frozen item, and ‘s’ means snack item. For confidentiality reasons, the names of the stores
and food items have been replaced with numbers.

Table B.1: Market Survey Data
Item #Item
TypeCalories
Total
Cholesterol
(mg)
Total
Fat (g)
Sodium
(mg)
Total
Carbohydrate
(g)
Total
Sugar
(g)
Total
Fiber
(g)
Total
Protein
(g)
Total
Fiber
(%DV)
Digestible
Carbohydrate
(g)
1 d 160 0 0.5 440 34 0 1 4 4 33
2 d 130 0 1 940 26 2 5 5 20 21
3 d 320 5 3 880 66 18 2 8 6 64
4 f 150 10 4.5 360 20 2 2 5 8 18
5 d 310 30 10 980 45 5 2 16 8 43
6 f 320 30 10 660 41 8 3 16 12 38
7 f 210 65 10 550 23 8 2 9 6 21
8 f 260 30 11 220 32 2 2 7 7 30
9 f 310 15 12 760 39 5 1 10 4 38
10 f 240 10 5 710 38 4 4 11 16 34
11 d 190 0 2 660 38 2 2 7 8 36
12 d 90 0 0 450 21 1 1 2 5 20
13 d 210 0 2.5 420 44 14 2 4 8 42
14 f 350 20 20 540 33 3 2 10 8 31
15 f 420 40 13 810 58 5 7 16 28 51
16 f 180 35 3.5 560 21 3 3 16 12 18
17 f 430 70 14 590 62 6 9 16 35 53
18 f 280 40 13 740 30 4 4 16 16 26
19 f 290 20 13 220 27 2 1 13 6 26
20 d 160 0 0.5 460 34 1 2 4 8 32
21 f 250 65 14 480 9 1 0 21 0 9
22 f 250 55 14 430 13 1 1 18 4 12
23 f 310 40 10 890 37 3 2 17 8 35
24 f 430 20 21 690 45 3 4 16 16 41
25 f 370 20 11 780 54 8 6 13 24 48
26 f 240 30 14 440 18 2 3 9 12 15
90
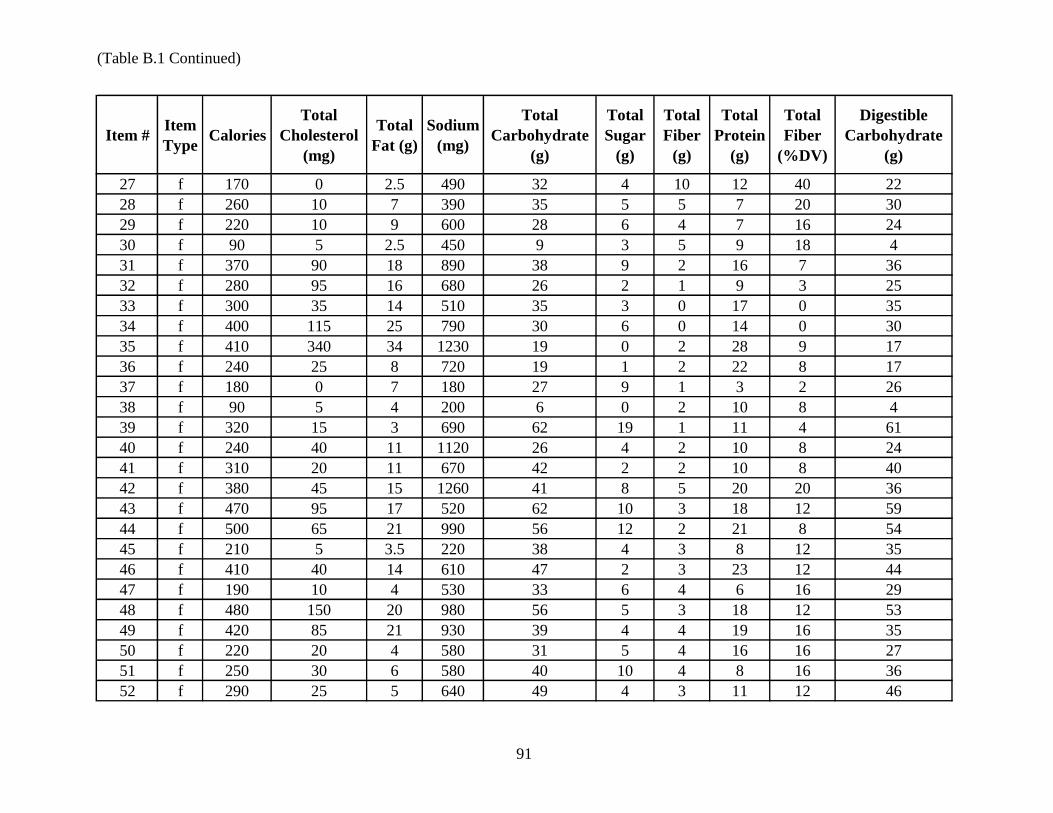
(Table B.1 Continued)
Item #Item
TypeCalories
Total
Cholesterol
(mg)
Total
Fat (g)
Sodium
(mg)
Total
Carbohydrate
(g)
Total
Sugar
(g)
Total
Fiber
(g)
Total
Protein
(g)
Total
Fiber
(%DV)
Digestible
Carbohydrate
(g)
27 f 170 0 2.5 490 32 4 10 12 40 22
28 f 260 10 7 390 35 5 5 7 20 30
29 f 220 10 9 600 28 6 4 7 16 24
30 f 90 5 2.5 450 9 3 5 9 18 4
31 f 370 90 18 890 38 9 2 16 7 36
32 f 280 95 16 680 26 2 1 9 3 25
33 f 300 35 14 510 35 3 0 17 0 35
34 f 400 115 25 790 30 6 0 14 0 30
35 f 410 340 34 1230 19 0 2 28 9 17
36 f 240 25 8 720 19 1 2 22 8 17
37 f 180 0 7 180 27 9 1 3 2 26
38 f 90 5 4 200 6 0 2 10 8 4
39 f 320 15 3 690 62 19 1 11 4 61
40 f 240 40 11 1120 26 4 2 10 8 24
41 f 310 20 11 670 42 2 2 10 8 40
42 f 380 45 15 1260 41 8 5 20 20 36
43 f 470 95 17 520 62 10 3 18 12 59
44 f 500 65 21 990 56 12 2 21 8 54
45 f 210 5 3.5 220 38 4 3 8 12 35
46 f 410 40 14 610 47 2 3 23 12 44
47 f 190 10 4 530 33 6 4 6 16 29
48 f 480 150 20 980 56 5 3 18 12 53
49 f 420 85 21 930 39 4 4 19 16 35
50 f 220 20 4 580 31 5 4 16 16 27
51 f 250 30 6 580 40 10 4 8 16 36
52 f 290 25 5 640 49 4 3 11 12 46
91

(Table B.1 Continued)
Item #Item
TypeCalories
Total
Cholesterol
(mg)
Total
Fat (g)
Sodium
(mg)
Total
Carbohydrate
(g)
Total
Sugar
(g)
Total
Fiber
(g)
Total
Protein
(g)
Total
Fiber
(%DV)
Digestible
Carbohydrate
(g)
53 f 220 65 9 610 13 1 2 21 9 11
54 f 250 10 4.5 460 42 10 8 11 32 34
55 f 300 40 16 340 27 1 1 12 5 26
56 d 80 0 1 500 18 1 2 2 9 16
57 d 30 0 0 730 6 3 1 1 2 5
58 d 40 0 0 530 8 1 1 2 4 7
59 d 280 0 1 900 59 3 1 5 6 58
60 d 260 5 1.5 660 45 1 2 6 8 43
61 d 150 5 1.5 460 32 7 1 4 3 31
62 s 60 0 0 170 12 1 0 2 0 12
63 s 160 0 3 290 29 1 4 7 23 25
64 s 190 0 5 140 32 11 5 8 19 27
65 s 150 5 5 85 26 8 5 2 20 21
66 s 190 0 7 180 24 13 2 10 6 22
67 s 140 0 7 100 17 7 5 6 20 12
68 s 190 0 7 150 29 12 2 4 8 27
69 d 100 0 1.5 460 20 1 1 3 5 19
70 d 100 0 1.5 470 20 1 1 3 5 19
71 f 180 <5 8 320 19 0 1 5 3 18
72 f 190 0 6 380 31 7 3 5 11 28
73 f 190 0 8 180 26 9 1 3 2 25
74 f 210 65 10 550 23 8 2 9 6 21
75 f 170 20 9 440 18 1 2 4 8 16
76 d 160 0 0.5 440 34 0 1 4 4 33
77 f 330 15 16 690 37 3 2 10 8 35
78 f 220 25 7 470 28 1 3 10 12 25
92

(Table B.1 Continued)
Item #Item
TypeCalories
Total
Cholesterol
(mg)
Total
Fat (g)
Sodium
(mg)
Total
Carbohydrate
(g)
Total
Sugar
(g)
Total
Fiber
(g)
Total
Protein
(g)
Total
Fiber
(%DV)
Digestible
Carbohydrate
(g)
79 d 420 35 10 1110 61 13 4 22 16 57
80 f 630 80 18 1060 85 4 5 30 18 80
81 f 700 45 44 1060 61 9 6 21 24 55
82 f 440 75 21 1170 35 3 4 26 16 31
83 f 230 25 8 710 24 6 2 15 8 22
84 f 220 80 6 850 31 12 2 10 8 29
85 f 280 <5 11 820 38 3 1 9 4 37
86 f 470 52 24 765 43 4 2 21 8 41
87 f 350 0 0.5 580 23 1 2 2 2 21
88 d 360 5 7 820 31 5 1 8 4 30
89 d 90 15 3.5 850 10 0 0 4 0 10
90 d 190 0 12 1190 39 2 2 7 8 37
91 d 330 50 18 990 28 0 2 15 8 26
92 d 310 5 8 860 51 6 2 10 7 49
93 d 230 10 7 700 34 5 4 7 16 30
94 d 200 10 7 790 24 2 2 6 8 22
95 d 160 5 7 4 20 4 5 4 20 15
96 s 160 0 2 210 34 7 18 4 40 16
97 s 160 0 2 260 32 12 4 4 12 28
98 s 200 0 5 170 38 16 1 2 3 37
99 d 160 10 3.5 580 25 3 5 9 20 20
100 d 150 10 3.5 640 23 3 3 7 12 20
101 s 120 0 3 125 24 11 3 2 10 21
102 s 170 0 8 200 18 9 7 10 30 11
103 d 250 25 14 770 21 9 2 9 8 19
104 d 210 25 5 790 25 9 4 15 8 21
93

(Table B.1 Continued)
Item #Item
TypeCalories
Total
Cholesterol
(mg)
Total
Fat (g)
Sodium
(mg)
Total
Carbohydrate
(g)
Total
Sugar
(g)
Total
Fiber
(g)
Total
Protein
(g)
Total
Fiber
(%DV)
Digestible
Carbohydrate
(g)
105 d 210 10 8 750 28 4 3 7 12 25
106 d 350 480 25 900 11 1 1 20 4 10
107 d 160 0 4.5 890 27 3 2 2 8 25
108 d 30 0 1 720 5 3 3 1 1 2
109 d 209 0 1 0 44 0 2 5 8 42
110 d 310 <5 2 630 45 4 4 9 12 41
111 f 230 85 13 340 18 4 1 9 3 17
112 f 290 25 7 480 42 5 1 12 4 41
113 d 220 30 9 980 24 5 6 11 24 18
114 f 700 45 44 1060 61 9 6 21 24 55
115 f 230 25 8 710 24 6 2 15 8 22
116 f 320 50 5 390 43 2 2 20 8 41
117 f 360 30 16 480 38 6 5 16 20 33
118 f 400 30 23 780 40 4 4 9 16 36
119 f 200 0 4.5 260 37 23 3 1 12 34
120 f 200 0 6 330 33 1 1 2 4 32
121 f 160 10 4.5 480 21 3 4 11 16 17
122 f 400 15 18 680 40 4 6 20 24 34
123 f 250 25 12 230 32 17 1 3 4 31
124 f 210 0 7 460 34 4 1 1 4 33
125 s 190 0 7 60 28 9 3 3 12 25
126 s 150 0 2 130 29 1 3 4 12 26
127 s 180 0 4 125 32 9 9 11 34 23
128 s 130 0 5 250 19 1 0 3 0 19
129 d 150 0 0.5 760 27 5 7 8 28 20
130 d 100 5 1 480 17 2 2 5 8 15
94

(Table B.1 Continued)
Item #Item
TypeCalories
Total
Cholesterol
(mg)
Total
Fat (g)
Sodium
(mg)
Total
Carbohydrate
(g)
Total
Sugar
(g)
Total
Fiber
(g)
Total
Protein
(g)
Total
Fiber
(%DV)
Digestible
Carbohydrate
(g)
131 d 80 0 1 600 15 4 5 4 20 10
132 d 130 0 0.5 480 23 2 9 8 36 14
133 d 200 50 15 320 9 1 1 7 4 8
134 d 170 0 1 340 31 2 12 9 48 19
135 f 280 20 16 280 22 0 5 10 20 17
136 s 100 10 5 180 9 0 0 5 0 9
137 f 90 0 2 390 9 1 4 10 16 5
138 f 100 0 1.5 390 9 0 5 11 20 4
139 f 240 0 14 200 21 2 4 8 16 17
140 f 320 0 10 750 48 4 4 11 16 44
141 f 430 90 13 480 66 4 3 12 12 63
142 f 270 40 12 650 25 6 5 18 20 20
143 f 460 120 26 780 44 4 3 12 12 41
144 f 350 0 17 490 43 3 7 8 27 36
145 f 260 20 4.5 170 44 1 2 10 8 42
146 f 320 20 8 550 43 2 3 16 12 40
147 d 500 0 12 1000 86 17 3 16 12 83
148 d 140 0 1 380 26 2 9 8 36 17
149 d 200 0 1 0 42 2 5 7 20 37
150 d 70 0 0 310 15 1 1 2 4 14
151 f 410 35 16 520 47 14 3 19 12 44
152 f 230 35 2.5 460 29 5 8 24 32 21
153 f 400 90 21 840 34 3 3 19 11 31
154 f 170 35 9 350 10 0 0 12 0 10
155 d 300 0 0.5 430 41 3 1 2 4 40
156 d 110 0 0 90 25 4 1 1 4 24
95

(Table B.1 Continued)
Item #Item
TypeCalories
Total
Cholesterol
(mg)
Total
Fat (g)
Sodium
(mg)
Total
Carbohydrate
(g)
Total
Sugar
(g)
Total
Fiber
(g)
Total
Protein
(g)
Total
Fiber
(%DV)
Digestible
Carbohydrate
(g)
157 s 130 0 3 135 24 8 1 2 4 23
158 f 250 45 11 930 45 2 3 13 12 42
159 f 420 25 16 550 54 14 7 15 28 47
160 f 230 15 10 510 27 0 3 8 12 24
161 f 410 20 20 590 47 1 4 10 16 43
162 f 270 0 5 620 43 3 2 11 6 41
163 f 230 25 8 710 24 6 2 15 8 22
164 f 320 30 10 660 41 8 3 16 12 38
165 f 450 65 20 1120 41 5 7 25 28 34
166 f 210 20 7 430 25 4 2 11 8 23
167 f 340 20 8 680 52 7 4 16 18 48
168 s 220 30 4 420 38 7 4 7 16 34
169 f 300 25 9 670 43 8 4 12 16 39
170 f 290 30 5 580 44 3 5 16 19 39
171 f 180 5 3 500 27 1 1 12 4 26
172 f 340 20 18 550 35 3 1 10 4 34
173 f 330 20 13 820 44 10 1 9 4 43
174 s 210 20 7 290 29 2 2 8 9 27
175 d 190 5 8 400 27 9 1 3 6 26
176 f 180 0 7 180 27 9 1 3 2 26
177 f 370 145 26 770 22 3 2 12 8 20
178 f 260 90 5 480 32 3 2 16 8 30
179 f 120 70 5 370 10 2 0 8 0 10
180 f 130 55 3 950 15 2 1 10 4 14
181 f 260 80 2 390 42 2 2 17 8 40
182 f 140 10 3 490 20 5 5 9 19 15
96

(Table B.1 Continued)
Item #Item
TypeCalories
Total
Cholesterol
(mg)
Total
Fat (g)
Sodium
(mg)
Total
Carbohydrate
(g)
Total
Sugar
(g)
Total
Fiber
(g)
Total
Protein
(g)
Total
Fiber
(%DV)
Digestible
Carbohydrate
(g)
183 f 360 90 18 780 23 2 1 37 4 22
184 d 150 0 1.5 450 31 6 1 5 4 30
185 s 120 0 3 110 24 12 3 2 10 21
186 d 210 0 2.5 420 44 14 2 4 8 42
187 d 200 10 7 750 28 5 3 6 12 25
188 f 25 0 0 580 6 0 1 1 4 5
189 d 200 0 3 400 36 1 1 4 4 35
190 d 150 0 3.5 870 28 5 1 3 4 27
191 d 140 0 5 680 29 7 6 6 24 23
192 d 150 0 0 690 27 5 5 8 19 22
193 d 90 5 2 630 16 9 2 2 8 14
194 d 70 0 0 750 15 3 2 3 8 13
195 d 250 0 1 660 39 4 1 6 5 38
196 d 380 10 9 910 27 7 1 7 4 26
197 d 270 10 8 590 40 5 2 10 8 38
198 s 200 0 6 360 33 0 2 4 4 31
199 s 200 0 6 360 33 0 2 4 4 31
200 s 280 0 6 120 41 15 4 6 16 37
201 f 190 20 3 360 25 0 2 7 6 23
202 f 190 15 3 330 22 1 1 6 2 21
203 f 260 55 10 620 33 0 2 16 6 31
204 f 190 15 2.5 540 26 0 2 7 6 24
205 f 210 0 8 390 28 3 2 6 7 26
206 f 420 25 20 850 46 13 2 14 9 44
207 f 230 20 10 360 27 2 2 9 6 25
208 f 290 254 9 510 41 5 2 10 7 39
97

(Table B.1 Continued)
Item #Item
TypeCalories
Total
Cholesterol
(mg)
Total
Fat (g)
Sodium
(mg)
Total
Carbohydrate
(g)
Total
Sugar
(g)
Total
Fiber
(g)
Total
Protein
(g)
Total
Fiber
(%DV)
Digestible
Carbohydrate
(g)
209 s 180 15 10 420 14 1 1 8 2 13
210 f 420 25 17 620 49 6 3 17 12 46
211 f 400 35 19 660 41 7 3 16 12 38
212 f 350 35 17 640 34 4 2 10 8 32
213 f 480 120 26 1380 35 4 2 16 8 33
214 f 100 35 5 240 9 0 0 5 0 9
215 f 80 25 3 1040 8 2 0 7 0 8
216 f 290 35 17 470 29 1 0 6 0 29
217 f 190 35 1 650 34 6 2 10 12 32
218 f 140 50 5 190 17 1 2 6 8 15
219 f 490 40 27 1180 48 6 1 14 4 47
220 f 420 110 35 85 0 0 0 25 0 0
221 f 250 80 18 640 4 0 2 20 8 2
222 f 370 30 14 680 45 8 4 17 16 41
223 f 330 0 8 740 53 4 9 9 36 44
224 f 220 10 10 260 25 1 1 7 4 24
225 f 200 10 10 290 26 1 1 8 4 25
226 f 300 15 15 330 33 1 3 9 12 30
227 f 120 15 7 80 9 0 1 6 4 8
228 f 155 15 6 360 19 8 2 5 6 17
229 f 400 95 20 640 38 1 3 15 12 35
230 f 400 35 23 780 36 2 2 10 8 34
231 f 260 10 5 600 42 9 3 12 12 39
232 f 320 10 4 570 10 8 4 15 16 6
233 f 230 30 6 690 33 12 3 11 12 30
234 f 290 25 6 610 44 3 2 14 8 42
98

(Table B.1 Continued)
Item #Item
TypeCalories
Total
Cholesterol
(mg)
Total
Fat (g)
Sodium
(mg)
Total
Carbohydrate
(g)
Total
Sugar
(g)
Total
Fiber
(g)
Total
Protein
(g)
Total
Fiber
(%DV)
Digestible
Carbohydrate
(g)
235 f 210 15 6 470 28 2 7 11 27 21
236 f 300 20 9 530 43 10 6 13 24 37
237 f 300 25 7 650 44 3 5 16 22 39
238 f 190 15 8 360 21 3 3 9 14 18
239 d 290 30 9 800 36 14 3 15 12 33
240 d 270 25 8 950 33 8 8 17 32 25
241 d 220 55 3.5 600 29 4 3 19 28 26
242 d 260 15 9 750 35 9 4 9 16 31
243 s 160 0 4 90 28 16 1 3 4 27
244 s 140 0 4 90 29 10 9 2 35 20
245 s 190 0 6 160 29 12 2 4 8 27
246 d 140 10 1.5 470 27 6 1 3 3 26
247 s 190 0 5 135 38 1 10 7 40 28
248 d 230 0 0.5 900 46 1 6 9 24 40
249 d 240 5 6 660 43 3 1 6 4 42
250 d 130 0 0.5 520 21 1 1 1 5 20
251 s 140 0 4 250 23 0 3 3 12 20
252 s 200 0 1 5 41 3 2 7 8 39
253 d 350 480 26 920 8 2 1 17 4 7
254 d 160 30 9 660 9 2 2 10 8 7
255 f 340 30 11 680 43 8 4 16 16 39
256 f 380 60 10 600 45 8 7 28 27 38
257 f 140 10 3 400 21 4 3 8 10 18
258 f 280 0 7 740 44 4 10 9 40 34
259 f 150 15 5 710 19 4 2 8 10 17
260 f 230 20 10 360 27 3 2 9 6 25
99

(Table B.1 Continued)
Item #Item
TypeCalories
Total
Cholesterol
(mg)
Total
Fat (g)
Sodium
(mg)
Total
Carbohydrate
(g)
Total
Sugar
(g)
Total
Fiber
(g)
Total
Protein
(g)
Total
Fiber
(%DV)
Digestible
Carbohydrate
(g)
261 f 250 10 5 460 39 9 5 13 19 34
262 f 210 15 6 470 28 2 7 11 27 21
263 d 15 3 0 410 3 0 0 0 0 3
264 f 480 50 18 1200 58 6 3 22 12 55
265 f 340 0 16 300 47 17 2 3 8 45
266 d 130 0 0.5 290 23 2 9 8 39 14
267 d 110 10 3.5 510 18 5 4 2 16 14
268 d 150 30 9 750 17 10 2 2 8 15
269 d 150 0 1 480 29 1 6 8 24 23
270 f 380 25 17 690 43 6 2 13 8 41
271 f 270 50 8 700 35 2 2 13 8 33
272 f 320 10 15 610 37 3 1 10 4 36
273 f 240 255 18 770 5 3 0 15 0 5
274 f 340 315 19 810 20 1 2 21 10 18
275 f 320 25 17 370 33 2 1 10 4 32
276 f 240 35 8 520 33 12 1 10 4 32
277 s 210 0 9 240 28 9 2 6 7 26
278 f 270 90 12 670 18 5 2 23 8 16
279 f 180 0 5 370 31 7 3 4 11 28
280 f 230 10 4 380 45 10 1 4 4 44
281 f 200 100 8 730 20 3 3 12 12 17
282 f 290 0 9 490 45 5 3 8 13 42
283 f 330 30 12 560 42 1 3 14 12 39
284 f 340 30 13 530 41 1 2 14 8 39
285 d 320 79 3.5 640 44 3 3 9 12 41
286 d 290 30 9 800 36 14 3 15 12 33
100

(Table B.1 Continued)
Item #Item
TypeCalories
Total
Cholesterol
(mg)
Total
Fat (g)
Sodium
(mg)
Total
Carbohydrate
(g)
Total
Sugar
(g)
Total
Fiber
(g)
Total
Protein
(g)
Total
Fiber
(%DV)
Digestible
Carbohydrate
(g)
287 d 250 45 11 1300 22 3 2 15 8 20
288 d 100 0 0.5 480 21 1 1 4 4 20
289 d 140 5 3.5 750 22 3 1 5 4 21
290 d 220 5 4.5 400 37 2 3 7 12 34
291 d 220 10 8 590 30 3 1 8 4 29
292 d 160 25 6 890 16 2 1 9 4 15
293 d 190 10 7 700 26 4 2 6 8 24
294 d 220 25 6 770 26 4 6 13 24 20
295 d 230 10 7 750 34 6 3 7 12 31
296 d 35 0 0 60 7 1 7 1 4 0
297 d 0 0 0 1060 31 1 1 3 4 30
298 d 190 5 5 520 21 2 1 2 4 20
299 d 180 0 0 15 17 1 1 2 6 16
300 d 170 5 4.5 340 27 7 1 2 3 26
301 d 280 5 2.5 660 47 1 1 6 4 46
302 d 310 10 3.5 660 42 3 2 9 8 40
303 d 100 5 4 890 13 1 1 3 4 12
304 d 140 20 5 790 17 3 3 7 12 14
305 d 70 15 2 870 15 0 1 3 4 14
306 d 90 15 1 390 12 2 1 8 4 11
307 d 70 0 0 310 15 1 1 2 4 14
308 d 160 0 0 590 34 1 0 4 0 34
309 d 240 5 0 660 43 3 1 6 4 42
310 d 260 15 9 750 35 9 4 9 16 31
311 d 160 5 1 690 28 1 7 10 28 21
312 d 190 5 3.5 530 30 1 8 10 32 22
101

(Table B.1 Continued)
Item #Item
TypeCalories
Total
Cholesterol
(mg)
Total
Fat (g)
Sodium
(mg)
Total
Carbohydrate
(g)
Total
Sugar
(g)
Total
Fiber
(g)
Total
Protein
(g)
Total
Fiber
(%DV)
Digestible
Carbohydrate
(g)
313 d 180 10 3.5 670 30 1 7 9 28 23
314 d 140 40 3 670 14 10 1 14 4 13
315 d 290 30 9 800 36 14 3 15 12 33
316 d 250 0 1 660 39 4 1 6 5 38
317 d 210 15 7 600 31 3 1 8 5 30
318 d 360 5 7 820 31 5 1 8 4 30
319 d 280 0 0.5 560 25 1 1 3 3 24
320 s 70 0 8 310 30 20 4 20 16 26
321 s 170 0 4.5 180 26 15 5 10 20 21
322 f 410 130 26 830 26 4 2 12 7 24
323 f 230 20 13 410 23 10 1 6 2 22
324 f 260 70 17 640 5 1 0 20 0 5
325 f 140 50 5 190 17 1 2 6 8 15
326 f 210 41 19 680 1 0 0 10 0 1
327 f 310 50 26 950 6 0 1 13 3 5
328 f 290 30 18 480 29 1 0 6 0 29
329 f 300 120 9 1170 33 7 2 23 8 31
330 f 100 35 5 240 9 0 0 5 0 9
331 f 70 10 2 260 8 2 1 4 4 7
332 f 90 30 4.5 460 7 2 1 5 4 6
333 f 630 80 18 1060 85 4 5 30 18 80
334 f 230 35 9 500 25 2 1 11 4 24
335 f 270 65 17 500 19 2 3 12 10 16
336 f 340 30 14 560 42 27 1 11 4 41
337 f 410 15 12 530 66 34 5 11 20 61
338 s 220 0 0 95 56 51 0 1 0 56
102

(Table B.1 Continued)
Item #Item
TypeCalories
Total
Cholesterol
(mg)
Total
Fat (g)
Sodium
(mg)
Total
Carbohydrate
(g)
Total
Sugar
(g)
Total
Fiber
(g)
Total
Protein
(g)
Total
Fiber
(%DV)
Digestible
Carbohydrate
(g)
339 f 440 100 24 1000 36 2 2 20 9 34
340 f 480 185 28 990 32 2 2 24 8 30
341 d 380 190 16 830 35 1 1 22 4 34
342 d 220 5 1.5 570 31 3 1 5 4 30
343 s 290 0 8 270 53 22 5 6 21 48
344 s 270 0 7 240 49 18 5 6 21 44
345 s 280 0 8 200 49 19 5 7 20 44
346 s 300 0 10 45 37 10 5 6 20 32
347 s 90 0 2.5 80 17 5 5 1 20 12
348 f 320 10 13 740 42 4 2 10 7 40
349 f 180 35 8 490 14 1 0 14 0 14
350 f 310 45 8 720 40 11 1 20 4 39
351 f 270 30 14 660 26 5 1 9 4 25
352 f 350 20 15 910 39 5 3 14 12 36
353 f 400 15 18 650 48 13 1 12 4 47
354 f 210 5 9 350 26 2 1 7 5 25
355 f 260 15 14 630 39 2 2 7 8 37
356 f 30 5 2 135 2 1 1 2 2 1
357 f 260 15 19 460 15 1 1 7 4 14
358 f 220 10 10 260 25 1 1 7 4 24
359 f 220 10 10 290 26 1 1 8 4 25
360 f 290 15 14 300 33 1 3 9 12 30
361 f 290 15 14 340 33 1 3 9 12 30
362 f 310 10 3.5 190 54 3 5 12 8 49
363 f 390 2 6 280 67 6 3 12 12 64
364 f 210 25 4 180 36 2 1 8 5 35
103
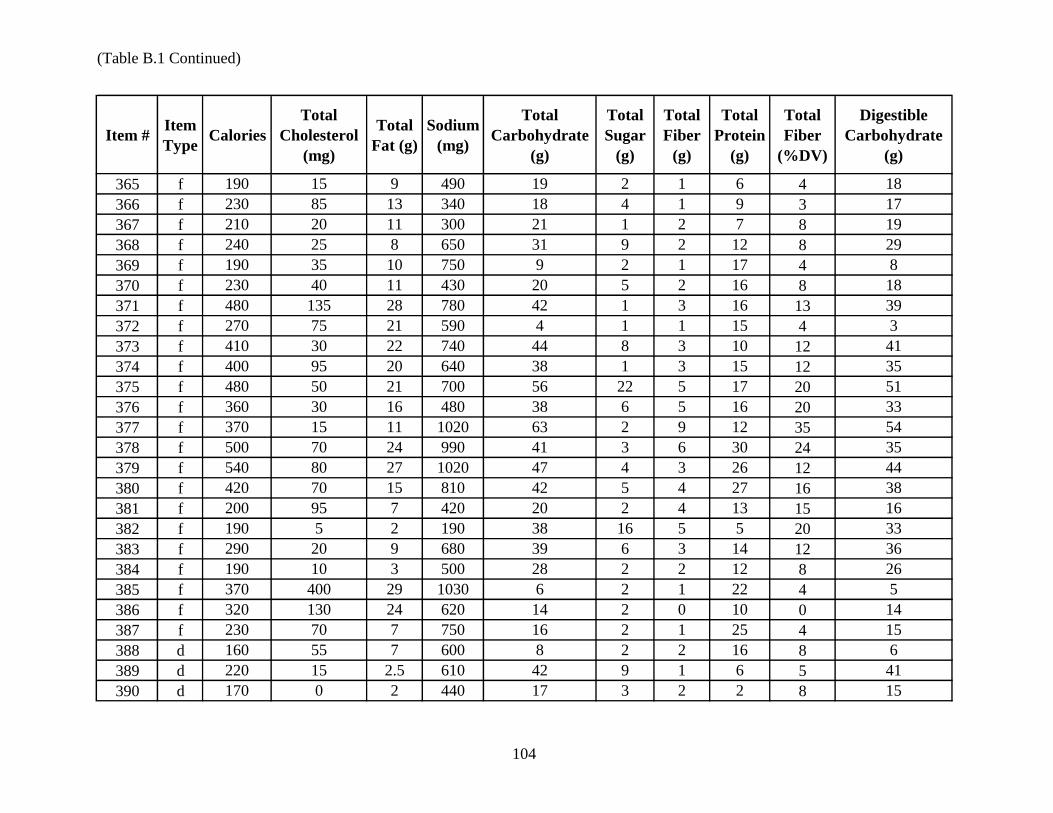
(Table B.1 Continued)
Item #Item
TypeCalories
Total
Cholesterol
(mg)
Total
Fat (g)
Sodium
(mg)
Total
Carbohydrate
(g)
Total
Sugar
(g)
Total
Fiber
(g)
Total
Protein
(g)
Total
Fiber
(%DV)
Digestible
Carbohydrate
(g)
365 f 190 15 9 490 19 2 1 6 4 18
366 f 230 85 13 340 18 4 1 9 3 17
367 f 210 20 11 300 21 1 2 7 8 19
368 f 240 25 8 650 31 9 2 12 8 29
369 f 190 35 10 750 9 2 1 17 4 8
370 f 230 40 11 430 20 5 2 16 8 18
371 f 480 135 28 780 42 1 3 16 13 39
372 f 270 75 21 590 4 1 1 15 4 3
373 f 410 30 22 740 44 8 3 10 12 41
374 f 400 95 20 640 38 1 3 15 12 35
375 f 480 50 21 700 56 22 5 17 20 51
376 f 360 30 16 480 38 6 5 16 20 33
377 f 370 15 11 1020 63 2 9 12 35 54
378 f 500 70 24 990 41 3 6 30 24 35
379 f 540 80 27 1020 47 4 3 26 12 44
380 f 420 70 15 810 42 5 4 27 16 38
381 f 200 95 7 420 20 2 4 13 15 16
382 f 190 5 2 190 38 16 5 5 20 33
383 f 290 20 9 680 39 6 3 14 12 36
384 f 190 10 3 500 28 2 2 12 8 26
385 f 370 400 29 1030 6 2 1 22 4 5
386 f 320 130 24 620 14 2 0 10 0 14
387 f 230 70 7 750 16 2 1 25 4 15
388 d 160 55 7 600 8 2 2 16 8 6
389 d 220 15 2.5 610 42 9 1 6 5 41
390 d 170 0 2 440 17 3 2 2 8 15
104

(Table B.1 Continued)
Item #Item
TypeCalories
Total
Cholesterol
(mg)
Total
Fat (g)
Sodium
(mg)
Total
Carbohydrate
(g)
Total
Sugar
(g)
Total
Fiber
(g)
Total
Protein
(g)
Total
Fiber
(%DV)
Digestible
Carbohydrate
(g)
391 s 110 0 1.5 170 22 6 3 3 12 19
392 s 160 0 1 0 35 0 1 4 4 34
393 s 200 0 7 200 24 12 2 10 8 22
394 s 120 0 3 425 24 11 3 2 10 21
395 s 80 0 2 60 15 7 2 1 8 13
396 d 190 20 2 740 28 7 7 14 28 21
397 d 170 30 10 880 17 8 2 2 8 15
398 d 210 20 7 710 25 5 6 11 24 19
105

106
APPENDIX C: INSTITUTIONAL REVIEW BOARD APPROVAL
The research presented in this document included a blind consumer survey and a
consumer sensory test. Both of these components required prior approval by the Louisiana State
University (LSU) Institutional Review Board (IRB) committee as per state regulation
requirements. The approved application and supporting documentation are included in the
following pages (Figures C.1, C.2, and C.3).

107
Figure C.1 Approved Application for Exemption from Institutional Oversight

108
(Figure C.1 Continued)

109
Experimental Protocol for “The Development of a High Fiber Low Glycemic Bean Pasta” to be
conducted by Christopher Ringuette, Graduate Student under supervision of Witoon
Prinyawiwatkul, Professor, School of Nutrition and Food Sciences, LSU AgCenter
1. Consumers who will be participating in this study consist of faculty, students, and staff from
LSU campus as well as off-campus consumers (Retirement home individuals). Up to 100
consumers will be participating. No vulnerable populations and incarcerated persons will be
recruited for this study.
2. Upon arrival at the testing location,
- if a paper ballot is used, each consumer will be given a set of questionnaire including a consent
form.
- if a computerized ballot is used, a set of questionnaire including a consent form will be
provided on a computer screen.
3. After reading and signing (a paper ballot) or acknowledging (a computer ballot) the consent
form, consumers will be provided with 3-5 samples (either red beans and rice, pasta filata, telita,
demano or cheddar cheeses, angel cake, sponge cake, sweet potato soup, hard-boiled eggs,
mayonnaise, peanuts, kefir, iced tea, BBQ sauces, bagels, vegetable salads, pasta, etc.). These
are either commercial products or lab-prepared samples containing only GRAS ingredients.
Consumers will also be provided with water and unsalted crackers to cleanse the palate between
samples.
4. Consumers will then evaluate the samples according to the questionnaire that corresponds
with each sample. They have to indicate their perception (sensory differences and/or
acceptability) of the products (See the attached questionnaire).
5. After evaluating all samples, consumers will be provided with gratis refreshment (soft drink or
beverages) as an incentive for participating in the study.
6. Data collected will be analyzed and interpretation of the results will be done. The results will
not be released in any individually identifiable form without prior consent from the consumers.
In fact, the consumer names will not be collected on the questionnaire.
Figure C.2 Experimental Protocol

110
APPENDIX D: AMYLOGRAPHS
The amylographs for each flour sample analyzed with the Rapid Visco Analyzer are
included here. The RVA was completed using a Newport scientific RVA-4 (Newport Scientific
Pty. Ltd., Warriewood NSW, Australia) machine and a Neslab RTE 7 water bath (Thermo Fisher
Scientific, Newington, NH). The RVA software accompanying the machine was set to run each
sample for a 13 minute cycle adjusting temperature and speed at the different times as defined in
the RVA Durum Method 11.06 (Perten Instruments, 2007). The amylographs are presented in
the same order of the flour mixtures in Table 3.2. As discussed in Chapter 4, the trapezoidal line
in each plot refers to the temperature (°C) inside the Rapid Visco Analyzer during the testing
process. The flat line towards the bottom of each plot gives the rotation rate of the paddle in
revolutions per minute (rpm). The curve represents the viscosity of each flour mixture sample in
the standard centoPoise units (cP). The value of each quantity is plotted over time (minutes). The
Rapid Visco Analysis (RVA) procedure was done in duplicates for all the flour mixtures except
for the 100% bean flour since the results from those three flours were only used as a maximum
reference point. The percentage weights of the bean and control flours in each flour mixture are
indicated in the figure titles. As in the text, the first number indicates the percentage by weight of
the bean flour specified, and the second number indicates the percentage by weight of the control
flour. The implications of the features of these graphs are discussed in Section 4.2.1. The graphs
begin on the following page.

111
Figure D.1 Amylograph for the Control Flour Mixture A

112
Figure D.2 Amylograph for the Control Flour Mixture B

113
Figure D.3 Amylograph for the 20/80 Pinto Bean Flour Mixture A
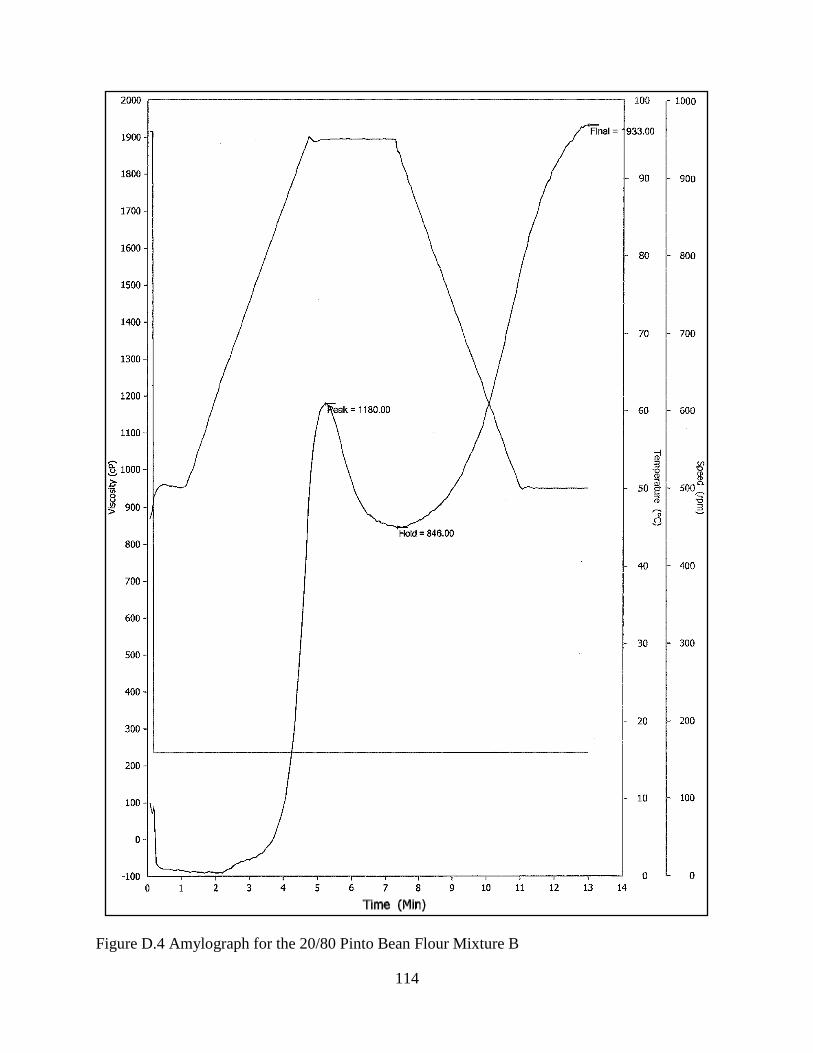
114
Figure D.4 Amylograph for the 20/80 Pinto Bean Flour Mixture B

115
Figure D.5 Amylograph for the 25/75 Pinto Bean Flour Mixture A

116
Figure D.6 Amylograph for the 25/75 Pinto Bean Flour Mixture B

117
Figure D.7 Amylograph for the 30/70 Pinto Bean Flour Mixture A

118
Figure D.8 Amylograph for the 30/70 Pinto Bean Flour Mixture B

119
Figure D.9 Amylograph for the 50/50 Pinto Bean Flour Mixture A
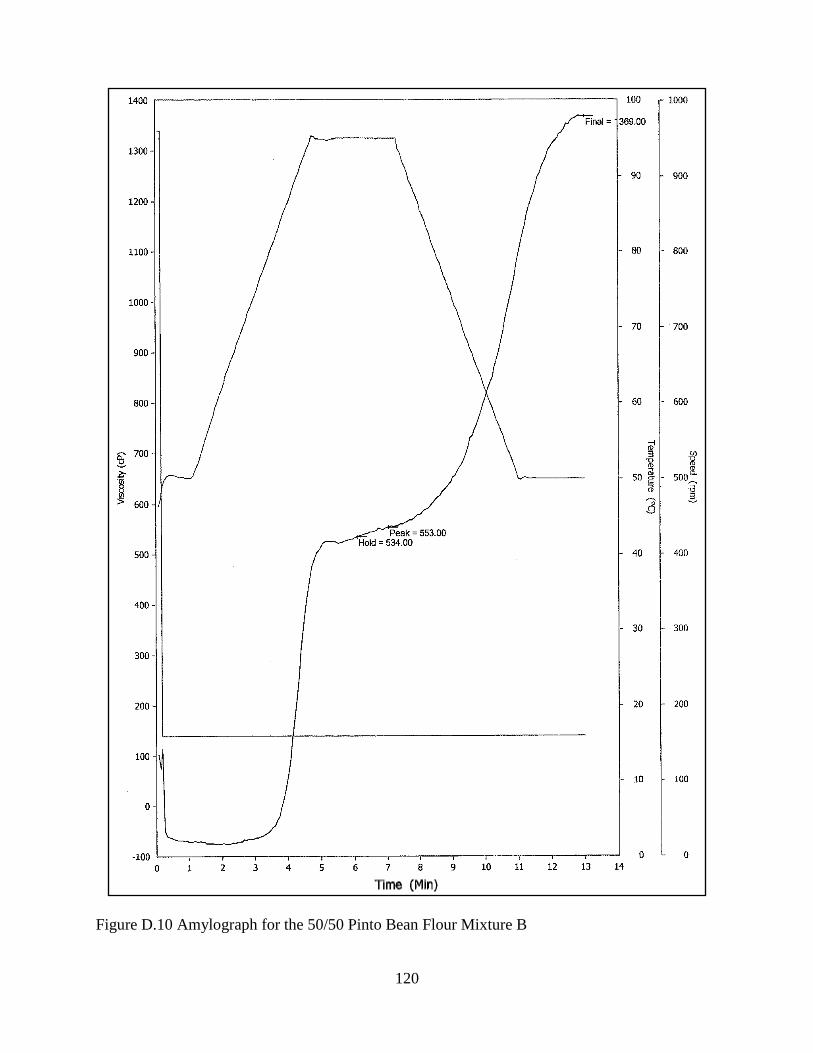
120
Figure D.10 Amylograph for the 50/50 Pinto Bean Flour Mixture B

121
Figure D.11 Amylograph for the 75/25 Pinto Bean Flour Mixture A

122
Figure D.12 Amylograph for the 75/25 Pinto Bean Flour Mixture B

123
Figure D.13 Amylograph for the 100/0 Pinto Bean Flour Mixture

124
Figure D.14 Amylograph for the 20/80 Navy Bean Flour Mixture A

125
Figure D.15 Amylograph for the 20/80 Navy Bean Flour Mixture B

126
Figure D.16 Amylograph for the 25/75 Navy Bean Flour Mixture A

127
Figure D.17 Amylograph for the 25/75 Navy Bean Flour Mixture B

128
Figure D.18 Amylograph for the 30/70 Navy Bean Flour Mixture A

129
Figure D.19 Amylograph for the 30/70 Navy Bean Flour Mixture B

130
Figure D.20 Amylograph for the 50/50 Navy Bean Flour Mixture A

131
Figure D.21 Amylograph for the 50/50 Navy Bean Flour Mixture B

132
Figure D.22 Amylograph for the 75/25 Navy Bean Flour Mixture A

133
Figure D.23 Amylograph for the 75/25 Navy Bean Flour Mixture B

134
Figure D.24 Amylograph for the 100/0 Navy Bean Flour Mixture

135
Figure D.25 Amylograph for the 20/80 Black Bean Flour Mixture A

136
Figure D.26 Amylograph for the 20/80 Black Bean Flour Mixture B

137
Figure D.27 Amylograph for the 25/75 Black Bean Flour Mixture A

138
Figure D.28 Amylograph for the 25/75 Black Bean Flour Mixture B

139
Figure D.29 Amylograph for the 30/70 Black Bean Flour Mixture A

140
Figure D.30 Amylograph for the 30/70 Black Bean Flour Mixture B

141
Figure D.31 Amylograph for the 50/50 Black Bean Flour Mixture A

142
Figure D.32 Amylograph for the 50/50 Black Bean Flour Mixture B

143
Figure D.33 Amylograph for the 75/25 Black Bean Flour Mixture A

144
Figure D.34 Amylograph for the 75/25 Black Bean Flour Mixture B

145
Figure D.35 Amylograph for the 100/0 Black Bean Flour Mixture

146
APPENDIX E: NUTRITIONAL ANALYSIS
A calculated proximate analysis was performed on four flour blends and three ravioli
types as described in Chapter 4. The full details of this analysis are included in the following
pages. Nutrition information for the ‘00’ flour used was entered manually from the nutrition
label on the product. The information for the navy bean flour was acquired from the nutritional
analysis provided by Best Cooking Pulses, Inc. A nutrient analysis showing the nutritional data
for these two ingredients are included in the following pages. A full analysis of the control, 50%
navy bean/50% control, and 75% navy bean/25% control flours and the three ravioli types is also
included in the following pages. Each analysis includes a nutrient facts report, giving unrounded
amounts of each type of nutrient in the product nutrition facts panels. The recipe nutrition
summary shows the amounts of each type of nutrient, vitamin, and mineral in the products. The
recipe report gives the amount of nutrient from each ingredient in the recipe.

147
Figure E.1 ‘00’ Flour Nutrient Analysis

148
E.2 Navy Bean Flour Nutrient Analysis

149
E.3 Control Flour Nutrient Facts Report

150
E.4 Control Flour Recipe Nutrition Summary

151
E.5 Control Flour Recipe Report

152
E.6 50% Navy Bean/50% Control Flour Nutrient Facts Report

153
E.7 50% Navy Bean/50% Control Flour Recipe Nutrition Summary

154
E.8 50% Navy Bean/50% Control Flour Recipe Report

155
E.9 75% Navy Bean/25% Control Flour Nutrient Facts Report

156
E.10 75% Navy Bean/25% Control Flour Recipe Nutrition Summary

157
E.11 75% Navy Bean/25% Control Flour Recipe Report

158
E.12 Control Ravioli Nutrient Facts Report

159
E.13 Control Ravioli Recipe Nutrition Summary

160
E.14 Control Ravioli Recipe Report

161
E.15 50% Navy Bean/50% Control Ravioli Nutrient Facts Report

162
E.16 50% Navy Bean/50% Control Ravioli Recipe Nutrition Summary

163
E.17 50% Navy Bean/50% Control Ravioli Recipe Report

164
E.18 75% Navy Bean/25% Control Ravioli Nutrient Facts Report

165
E.19 75% Navy Bean/25% Control Ravioli Recipe Nutrition Summary

166
E.20 75% Navy Bean/25% Control Ravioli Recipe Report
167
VITA
Christopher D. Ringuette was born in Louisiana to a family dedicated to the Cajun cuisine. He
gained a love for cooking from his late grandfather, Collins A. Liner. Upon graduation from high
school, Christopher began working in the restaurant industry, gaining eight years of experience.
This work continued throughout his undergraduate program until he received his Bachelors of
Science in the Culinary Arts from Nicholls State University in 2014. He then transitioned to food
science, earning his Master’s degree from Louisiana State University in 2016. He also gained
three years of experience in culinary research and development during his time in college.
Christopher Ringuette is currently employed as a research chef in the Baton Rouge area.