the development of zinc borate production process · 2016-12-23 · i abstract the main objective...
TRANSCRIPT
The Development of Zinc Borate Production
Process
By
H.Emre ELTEPE
A Dissertation Submitted to the
Graduate School in Partial Fulfillment of the
Requirement for the Degree of
MASTER OF SCIENCE
Department: Chemical Engineering
Major: Chemical Engineering
ø]PLU�,QVWLWXWH�RI�7HFKQRORJ\
ø]PLU��7XUNH\
November, 2004
A-PDF MERGER DEMO

We approve the thesis of H.Emre ELTEPE
Date of Signature ………………………………………….. 21.12.2004 Prof. Dr. Devrim BALKÖSE Supervisor Department of Chemical Engineering ………………………………………….. 21.12.2004 Prof. Dr. Semra ÜLKÜ Co-Supervisor Department of Chemical Engineering ………………………………………….. 21.12.2004 Prof.Dr. Tamerkan ÖZGEN Department of Chemistry ………………………………………….. 21.12.2004 Assist.Prof.Fehime ÖZKAN Department of Chemical Engineering ………………………………………….. 21.12.2004 Assist.Prof.$\VXQ�62)82ö/8 Department of Chemical Engineering ………………………………………….. 21.12.2004 Prof. Dr. Devrim BALKÖSE Head of Department

ACKNOWLEDGEMENT
I would like to express my deepest gratefullness to my advisors Prof. Devrim
BALKÖSE and Prof. Semra ÜLKÜ for their support, guidance and sharing their valuable
experiences throughout the study and the preparation of the thesis which has been a very
important experience for my future carreer.
I would like to state my special thanks to my friends $\NXW�(5'2ö'8�� Sevdiye
ATAKUL, Mehmet GÖNEN,� gQL]� %ø562< � DQG� <DUNÕQ� g=*$5ø3 for their help,
encouragement and friendship throughout this project. I would also like to thank to Gökhan
(5'2ö$1, Duygu�2÷X]�.,/,d� 0LQH�%$+d(&ø and Evrim YAKUT for their help for
SEM, EDX and X-RAY analyses, Burcu ALP for TGA analyses and Özlem Ça÷lar
DUVARCI and Filiz ÖZMIHÇI for FTIR analysis�� ùHULIH� ùDKLQ� g=$/3� DQG� %HOJLQ�TUNÇEL for their help throughout the experiments.
I also present my deepest thanks to my father Kadri ELTEPE for encouriging me to be
a Chemical Engineer and for teaching me the importance and vitality of science. I feel
previlaged to be the son of a man who beleives in the power of production.
Finally, my thanks go to my mother and all my family members and especially to my
wife for her endless support and my son for his beautifull smile giving me the inspiration to
do more in life.

TABLE OF CONTENTS
Page
ABSTRACT i
ÖZ ii
LIST OF FIGURES iii
LIST OF TABLES vi
CHAPTER 1. INTRODUCTION 1
CHAPTER 2. BORON COMPOUNDS 3
2.1 Boron Compounds (Oxides, Acid, Borates) 3
2.2 Boron In The World 4
2.2.1 Boron Minerals 5
2.2.2 Boron Reserves 6
2.2.3 Boric Acid 7
2.3 Other Metal Borates 8
2.3.1 Barium Metaborate 9
2.3.2 Copper, Manganese, and Cobalt Borates 9
CHAPTER 3. ZINC BORATE 10
3.1 General Properties of Zinc Borate 10
3.2 Applications 12
3.3 Some Manufacturers Around The World 13
3.4 Market Share 14
3.5 Future Market of Zinc Borate 16
3.6 Toxicology 16
3.7 The Production of Zinc Borate 16
3.8 Structural Characterization and Chemistry of Zinc Borate 17

3.8.1 Comparison with Structural Minerals 21
3.9 Zinc Borate 23
3.9.1 US.Patent by Schubert 23
3.9.2 Patent by Igarashi 27
3.10 IR Studies 36
3.10.1 Infrared Spectra of Copolymer Having Zinc Borate 36
3.10.2 IR Spectra of Borate Anions 37
3.11 Kinetics of zinc borate formation by the reaction of boric
acid and zinc oxide 38
3.11.1 Effect of Impeller Type 39
3.11.2 Effect of Speed of Agitation 42
3.11.3 Effect of Mean Initial Particle Size of Zinc Oxide 44
3.11.4 Effect of Temperature Reaction 46
3.11.5 Effect of Concentration of Boric Acid 47
3.11.6 Reaction Kinetics 49
3.11.7 Estimation of Rate Constants 50
CHAPTER 4. EXPERIMENTAL 54
4.1 Materials Used 54
4.2 Methods Used 56
4.2.1 Production of ZB 56
4.3 Characterization 61
CHAPTER 5. RESULTS AND DISCUSSION 62
5.1 Characterization of Commercial Zinc Borate and Raw Materials 62
5.1.1 The Viscosity and pH Change During ZB Production 69
5.2 Characterization of Synthesized Zinc Borate 71
5.2.1 Thermogravimetric Analyses 71
5.2.2 Scanning Electron Microphotographs 73
5.2.3 FTIR Spectra 77
5.2.4 X-Ray Diffraction Analysis 83
5.3 Discussion 88
CHAPTER 6 CONCLUSIONS 90
REFERENCES 91

i
ABSTRACT
The main objective of this study is the production of zinc borate which is used in
large quantities as flame retardent and smoke subpressent material by making use of our
country’s resources which is the largest boron reserves in the world.
The development of commercially acceptable zinc borate production process was
investigated from several different views and the samples obtained were characterized
by using different techniques.
The physico-chemical properties of each sample were characterized by X-Ray
diffraction, Fourier Transform Infrared Spectroscopy (FTIR), Scanning Electron
Microscopy (SEM), Energy Dispersive X-ray (EDX) analysis, thermal gravimetric
analysis (TGA).
Several forms of zinc borate with various dehydration temperatures are possible to
obtain.A popular form of zinc borate which dehydrates above 290 ºC was obtained in
this study.
ii
ÖZ ������������ �������������������������� ��!������"�#������ ��%$�&#��'(�)�!�*��" +��������,#����!-������,��. ������/��!����
01�243�0)5�6�3%798:5�7#24;=<4;?>A@�0)B�7 C:D#E�F4G�EIH�E�J%ELK#D�F�D#M"KIN?OPO�J�Q�J�OSR4TUJ%O�V�EIJXWYG%Z[V�\9DIT�M#J�]^V�Q_MIG`F�EIG%MITUG%O�H�EIH�Ea#bIc�cUd%e[f�c*d%g�d%ahb#gAi`j)k*lLk#m4i�n�i�o-c�i%e#l+kp-j)k�grq
Ticari olarak kabul görebilecek s k�e�aItvu4t�g-d�jxw�g-i%j kylzkUprc�i�l+k {%|A{:}-~)�*|����y�^�U}X�#���#�����}r����I�?�I�����-�#�%���������%���U�%�I�#������y���/���#�������%�)�U�*�%�������#�4�z�4�?���%���� ��9 ��I���*�����¡�#���#�U�r���¢�/�����I�*�4�*����# I���U�%�[£��*�%���%�h�#���-�%���/�%�(��¤��¥���4�����+�U���)���r¦
Numunelerin fiziko-kimyasal özellikleri X- §�¨Y©�ªI©v«X©�¬�©�ªI©�+© , Fourier ®X¯�°�±³²-±�´^µ�±¶¸·�¹Sº+·�»�·_¼¥½)¾�¿rÀXÁ�Â4¾�Ã�½U¹�Ä4¿ÅÃ#Ä?Â[À�Æ ÇÉÈ�ÊAÈ%Ë9È:Ì�ÍÏÎÐÌ*Ñ%Ò�ÓUÊ-Ô�Õ×Ö×Ø�Ò#Ê-Ô#Ù�ÒIÔ?Ú#Û , EnerÜÞÝàßâá�ã#ä�åUä�æ+åUäàç - è�éYä�êIä
analizi, Termal Gravimetrik Analiz ë�Ý�ì#á�í�å�á�î�äyïIåUáÏð4á`î�á%ð�ñ ò%î�Ý�í e ò�ó4Ý�å�æ+ÝUé-ñ Ý�îYô õ÷ö%øAùIú�ûÐüAý?øSþ+ú�ö�ø�ÿ�ö�����ü ö�øSùIúûÉÿ�������ÿ?øAö��4ý � ÿ���ø�������ú���ø��������Åö�������������ù
o borat elde etmek
mümkündür.Bu ��ö�ú�û���þ9ö�ÿ�ö
popular bir form olan 290ºC’nin üzerinde dehidrasyon
derececine sahip ��� ��ùIý"!#ý?ø-ö�#$��ú�ÿ �%��ÿ���ú�þ��&�'#(�*ø*)
iii
LIST OF FIGURES
Page
Figure 2.1 The solubility of boric acid. 8
Figure 3.1 LOI Values (%) of the compositions. 13
Figure 3.2 Flow sheet of a general production system of zinc borate. 17
Figure 3.3 (a) Zn center and (b) B3O4 (OH)3 units in 1. thermal ellipsoids are drawn at 30% probability level.
19
Figure 3.4 A segment of the infinite polytriborate chains in 1 showing zinc interactions.
20
Figure 3.5 X-ray diffraction image of example 1. 32
Figure 3.6 X-ray diffraction image of example 2. 32
Figure 3.7 X-ray diffraction image of example 3. 33
Figure 3.8 X-ray diffraction image of example 4. 33
Figure 3.9 X-ray diffraction image of example 5. 34
Figure 3.10 X-ray diffraction image of example 6. 34
Figure 3.11 X-ray diffraction image of example 7. 35
Figure 3.12 X-ray diffraction image of example 8. 35
Figure 3.13 Changes of dynamic FTIR spectra obtained from the thermo-oxidative degradation of LLDPE/10% EG/20% ZB blends in the condensed phase with different pyrolysis times. (a): 300°C, (b) : 400°C.
36
Figure 3.14 (a) Effect of impeller type on conversion of zinc oxide. Impeller DT, PTD and HF3 (b) Effect of impeller type on mean particle size of zinc borate.
40
Figure 3.15 Plot of the mean particle size against P/m at N/Ns = 1 for three different impellers used.
41
Figure 3.16 (a) Effect of impeller speed on conversion of zinc oxide.(b) Effect of impeller speed on mean particle size of zinc borate for different impellers.
43
Figure 3.17 (a) Effect of mean initial particle size on conversion of zinc oxide. (b) Effect of mean initial particle size of zinc oxide on particle size of zinc borate.
45
iv
Figure 3.18 (a) Effect of temperature of reaction on conversion of zinc oxide. (b) Effect of temperature of reaction on mean particle size of zinc borate.
46
Figure 3.19 (a) Effect of concentration of boric acid on conversion of zinc oxide. (b) Effect of concentration of boric acid on men particle size of zinc borate.
48
Figure 3.20 Plot of ln r vs 1/T for calculation of activation energy. 50
Figure 4.1 (a) The experimental setup for the first two experiments, (b) The experimental setup for the third experiment.
58
Figure 4.2 The water bath system (a) Exterior view, (b) Interior view. 59
Figure 5.1 FTIR spectrum of ZB-2335. 62
Figure 5.2 FTIR spectrum of Chinese ZB. 64
Figure 5.3 FTIR spectrum of Zinc oxide 64
Figure 5.4 FTIR spectrum of boric acid 65
Figure 5.5 TGA curve of commercial ZB. (1:ZB-2335, 2:Chinese ZB). 65
Figure 5.6 SEM microphotographs of commercial ZB and raw materials (a) ZB-2335 (25000x), (b) Chinese ZB (25000x), (c) Boric acid (1000x), (d) Zinc oxide (25000x).
66
Figure 5.7 The X-ray diagram of the raw materials and reference materials(ZB 223 and ZB stands for another commercial ZB).
68
Figure 5.8 TGA curve of Experiment No.1, No.2 and No.3 71
Figure 5.9 TGA curves 1:Experiment No.4 at 60ºC, 1.5h, 2:Experiment No.5 at 60ºC, 1.5h.
72
Figure 5.10 The effect of seed crystal on product formed at 90ºC, 4h. 1:Experiment No.4 at 90ºC, 4h (with seed crystal), 2:Experiment No.5 at 90ºC, 4h. (without seed crystal. They were heated at 60ºC for 90 minutes initially).
72
Figure 5.11 SEM microphotographs of Experiment No.1 (5000x). 75
Figure 5.12 SEM microphotographs of Experiment No.2 (15000x). 75
Figure 5.13 SEM microphotographs of Experiment No.3 (25000x). 75
Figure 5.14 (a) SEM microphotographs of Experiment No.4 at 60C, 90min. (8000x) (b) SEM microphotographs of Experiment No.5 at 60C,90 min.(10000x), (c) SEM microphotographs of Experiment No.4 at 90C, 1.5h (8000x), (d) SEM microphotographs of Experiment No.5 at 90C, 1.5h (15000x).
76
Figure 5.15 FTIR spectrum of Experiment no.1 79
Figure 5.16 FTIR spectrum of Experiment no.2 79

v
Figure 5.17 FTIR spectrum of Experiment no.3 80
Figure 5.18 FTIR spectrum of Experiment no.4 at 60ºC, 90min. 80
Figure 5.19 FTIR spectrum of the Experiment No.5 at 60ºC, 90min 81
Figure 5.20 FTIR spectrum of the Experiment No.4 at 90ºC, 4h. 81
Figure 5.21 FTIR spectrum of the Experiment No.5 at 90ºC, 4h. 82
Figure 5.22 X-ray diffraction image of Experiment No.1, No.2 and No.3. 85
Figure 5.23 X-ray diffraction image of Experiment No.4 at 60ºC, 90 min. 86
Figure 5.24 X-ray diffraction image of Experiment No.5 at 60ºC, 90 min. 86
Figure 5.25 X-ray diffraction image of Experiment No.4 at 90ºC, 4h. 87
Figure 5.26 X-ray diffraction image of Experiment No.5 at 90ºC, 4h. 87
vi
LIST OF TABLES
Page
Table 2.1 Borate Content in Commercial Glass. 3
Table 2.2 World boron reserves. 6
Table 2.3 The general technical specifications of boric acid. 7
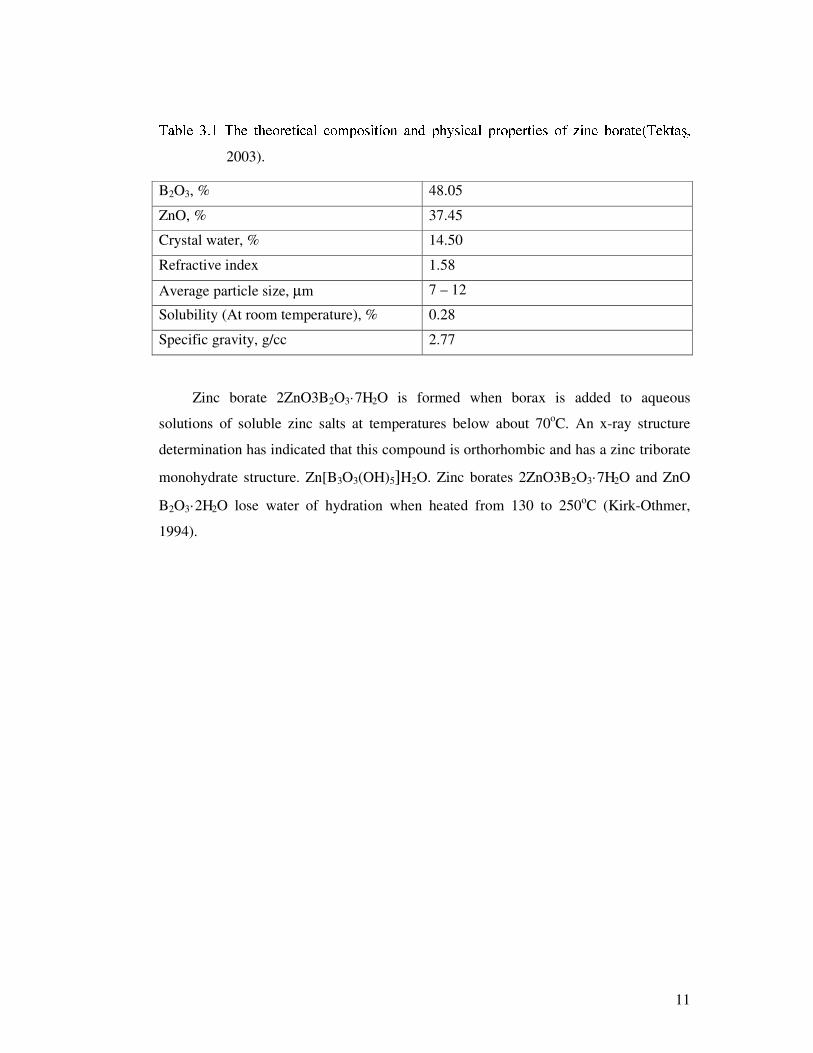
Table 3.1 The theoretical composition and physical properties of zinc
borate. 11
Table 3.2 Main application areas of zinc borate. 12
Table 3.3 Composition of flame-retardant coatings, % by volume on solids. 12
Table 3.4 The general manufacturers and their capacities. 14
Table 3.5 The consumption of flame retardants in 1998 14
Table 3.6 The ratio of other flame retardants used in US and West Europe. 15
Table 3.7 Price index of zinc borates. 15
Table 3.8 The analysis of 4ZnO·B2O3·H2O. 25
Table 3.9 X-ray diffraction of crystals that an intensity peak appears. 28
Table 3.10 The chemical composition and properties of obtained zinc borate samples.
31
Table 3.11 The observed frequencies of FTIR and Raman spectra of MgB6O10·7H2O and its supersaturated aqueous solution.
37
Table 4.1 The general technical specifications of boric acid. 54
Table 4.2 The general technical specifications of zinc oxide. 55
Table 4.3 Commercial zinc borate ZB-2335. 55
Table 4.4 Commercial Chinese zinc borate. 56
Table 4.5 Conditions of experimental runs. 60
Table 5.1 The observed peaks of commercial ZB samples. 63
Table 5.2 Composition by EDX and Dehydration Temperature 67
Table 5.3 pH change of experiment 6 70

vii
Table 5.4 Dehydration results of the experiments 72
Table 5.5 The observed peaks of FTIR spectra of the experiments. 78
Table 5.6 X-ray diffraction values of Experiments 84

1
CHAPTER 1
INTRODUCTION
Turkey has the biggest boron resources in the world 72%. Instead of processing
the ore to produce high value boron compounds, Turkey is selling the material in ore
form with very low values. This unfortunate situation has been the main initiative of this
study. The aim of this thesis is to produce zinc borate which has a much greater
commercial value than the ore. This idea has a great support by the official and
commercial organizations.
Plastic materials are widely used all throughout our lives. Plastic materials release
smoke and toxic gases during heating at high temperatures. Obtaining flame retardant
and smoke suppressed compositions are getting more and more important day by day.
A series of different crystal structures of zinc borate (ZB) have been developed
and are being used. The most widely used one is zinc borate with the formula
3ZnO·2B2O3·3.5H2O, but many zinc borates are used within formulations such as
4ZnO·B2O3·H2O, ZnO·B2O3·1.12H2O, ZnO·B2O3·2H2O, 6ZnO·5B2O3·3H2O,
2ZnO·3B2O3·7H2O, 2ZnO·3B2O3·3H2O, 3ZnO·5B2O3·14H2O and ZnO·5B2O3·4.5H2O.
(Schubert et.al., 2003). Worldwide consumption of these zinc salts is several thousand
metric tons per year.
Zinc borate, 3ZnO·2B2O3, forms a white amorphous powder or triclinic crystals
depending on the method of preparation, specific gravity 3.64 (amorphous), 4.22
(crystalline); and melting point 980ºC. The amorphous form is slightly soluble in water
and hydrochloric acid, the crystalline is insoluble in hydrochloric acid (Kirk-Othmer,
1970). The heat stability of hydration water of zinc borate is between 290 – 300ºC
which enables the polymer processebility.
The increase in the use of synergistic mixture of zinc borate together with
aluminum trihydrate has also increased the consumption of zinc borate. The reason for
this usage is that the synergistic mixture of these two compounds promotes a non-
halogen char formation. All around the world the consumption of halogeneous flame
retardants are decreasing leading its way to compounds which are not halogeneous.
Also this mixture is a smoke suppressant.
Currently, borates have a low demand in world flame retardant market. In North
America, annual demand of flame retardants is 350,000 ton and the borates have a 1%

2
share from this market making 3,500 ton per annum. However, from 1991 onwards the
share of borate compounds as flame retardants is increasing, therefore the major
producer in USA, U.S.Borax has increased its capacity. The market increase of zinc
borate all around the world is expected to be 12 –������������ ��������������������������� "!
In this study two main raw materials have been used for the production of ZB; zinc
oxide and boric acid.
Effects of time and temperature of heating, seed crystals and refluxing on ZB
product obtained were investigated.
The physico-chemical properties of each sample were characterized by X-Ray
diffraction, Fourier Transform Infrared Spectroscopy (FTIR), Scanning Electron
Microscopy (SEM), Energy Dispersive X-ray (EDX) analysis, thermal gravimetric
analysis (TGA).

3
CHAPTER 2
BORON COMPOUNDS
2.1 Boron Compounds (Oxides, Acid, Borates)
A number of reviews have appeared covering the various aspects of borate
glasses. The structure, physical properties, thermochemistry, reactions, phase equilibria,
and electrical properties of alkali borate melts and glasses have been presented. The
application of x-ray diffraction, NMR, Raman scattering, IR-spectroscopy, and ESR to
structural analysis is available. Phase-equilibrium diagrams for a large number of
anhydrous borate systems were included in a compilation, and thermo chemical data on
the anhydrous alkali metal borates have been complied (Kirk-Othmer, 1994).
The largest single commercial use of borates is in fiber glass. There are two basic
types of glass fibers: insulation (soda lime borosilicate glass) and textile (low alkali lime
aluminosilicate glass) grades. Borax pentahydrate is the most common source of B2O3
for making insulation fiber glass. Textile or E-glass fiber requires low sodium
formulations and for this reason boric acid or colemanite is commonly used. Only
borates having low arsenic content are suitable for use in glass making. Smaller
amounts of borates are consumed in heat-resisting (Pyrex or low thermal expansion)
glass, sealing glass, glazes and enamels (frit), optical glass, nuclear waste storage glass,
and in the making of vycor. The typical range of B2O3 content in commercial glasses is
shown in Table 2.1. Borates are not generally used in container or flat glass.
Table 2.1. Borate Content in Commercial Glass (Kirk-Othmer, 1994). Glass type B2O3, wt % Fiber Textile 6 – 13 Insulation 3 – 7 Heat resisting (pyrex) 12 – 15 Sealing glass 8 – 30 Porcelain enamel(frit) 11 – 13 Vycor 20a
a This is the percent B2O3 in glass prior to acid leching to form vycor.
Boron oxide B2O3, can be added to a glass formulation from a variety of boron-
containing compounds, but because the boron is taken into vitreous solution is often

4
immaterial which source of boron is used. The choice of raw material is usually
determined by consideration of the price per contained B2O3 unit uniformity of
composition, purity, hydration state, and compatibility of the cation in the finished
glass. In addition, boron- containing raw materials are usually the only water-containing
constituents in a glass batch and because the water must be removed in the melting
furnace, the dehydration characteristics important.
Boron oxide is added to borosilicate glass formulations to improve properties both
in the finished glass and in the glass-making process. The benefits of B2O3 use in glass
making are (1) creation of a low melting flux to dissolve refractory silica; (2) a lower
liquids temperature and inhibition of devitrification; (3) lower melt viscosity; (4)
enhanced melt rate; and (5) improved draw qualities in fiber production. The benefits of
B2O3 in the finished glass product are (1) improved chemical durability; (2) lower
thermal expansion; (3) increased mechanical strength; (4) decreased devitrification
tendency; (5) improved stretching hardness; and (6) enhanced refraction, color, and
brilliance.
2.2 Boron In The World
Boron was discovered by Joseph Gay-Lussac and Louis Thénard, French
chemists, and independently by Sir Humphry Davy, a British chemist, in 1808
Boron is a hard, brittle semi-metallic element.
Chemical Symbol: B
Atomic number : 5
Atomic weight : 10.81
Melting Point : 2348 K
Boiling Point : 4273 K

5
2.2.1 Boron Minerals
Boron does not occur in nature as free element, crude borax occurs in nature as a
mineral with associated clay and other impurities. There are over 200 naturally
occurring boron containing minerals but the most commercially important and
frequently traded minerals (salts, known as borates) are tincal, colemanite, ulexite and
kernite. These ores can be refined into a pure chemical compounds. The ones that have
the commercial importance are:
Boric acid H3BO3
Anhydrous boric acid B2O3
Anhydrous borax Na2B4O7
Borax pentahydrate Na2B4O7.10H2O
Borax decahydrate Na2B4O7.5H2O
Sodium Perborate Na2B4O7.5H2O
Some commercially important boron minerals are;
Tincal Na2B4O7.10H2O
Kernite Na2B4O7.4H2O
Colemanite Ca2B6O11.5H2O
Ulexite NaCaB5O9.8H2O
Datolite Ca2B2O5.Si2O5.H2O
Hydroboracite CaMgB6O11.6H2O
Turkey is the largest producer of boron ore in the world. Important boron
minerals of Turkey's are tincal, colemanite and ulexite. Boron minerals contain different
amount of B2O3 in their structures. The important factor for industrial application of
boron minerals are B2O3 content, so they can replace each other in use. This means that
one boron mineral can be trade competitor to the other one.
Boron minerals can be used in some sectors in the industry as crude minerals. In
general, their applications after refining and end-products are wider than crude ones.
Borates find use in different sectors, however the principal markets are: Agriculture,

6
detergents and soaps, flame retardants, glass, glazes, frits, enamels and insulation.
2.2.2 Boron Reserves
In the world, Turkey, USA and Russia have the important boron mines. In terms
of total reserve basis, Turkey has a share of 64%, the other important country USA is
9% as seen in Table 2.2.
Total world boron reserves on the basis of B2O3 content are 363 million tons
proven, 522 million tones probable and possible, as a total of 885 million tons. With a
share of 64%, Turkey has a total boron reserve of 563 million tons on the basis of B2O3
content.
Table 2.2 World boron reserves (Million tons)(http://minerals.usgs.gov, 2001)
Country Proven Reserve
Probable Possible Reserve
Total Reserve
Percent in Total (%)
Life Span (Year)
Turkey 224.000 339.000 563.000 64 389 U.S.A. 40.000 40.000 80.000 9 55 Russia 40.000 60.000 100.000 11 69 China 27.000 9.000 36.000 4 25 Chile 8.000 33.000 41.000 5 28 Bolivia 4.000 15.000 19.000 2 13 Peru 4.000 18.000 22.000 2 15 Argentina 2.000 7.000 9.000 1 6 Kazakhstan 14.000 1.000 15.000 2 10
Total 363.000 522.000 885.000 100,0 610
Turkey has the highest boron reserves in the world.
7
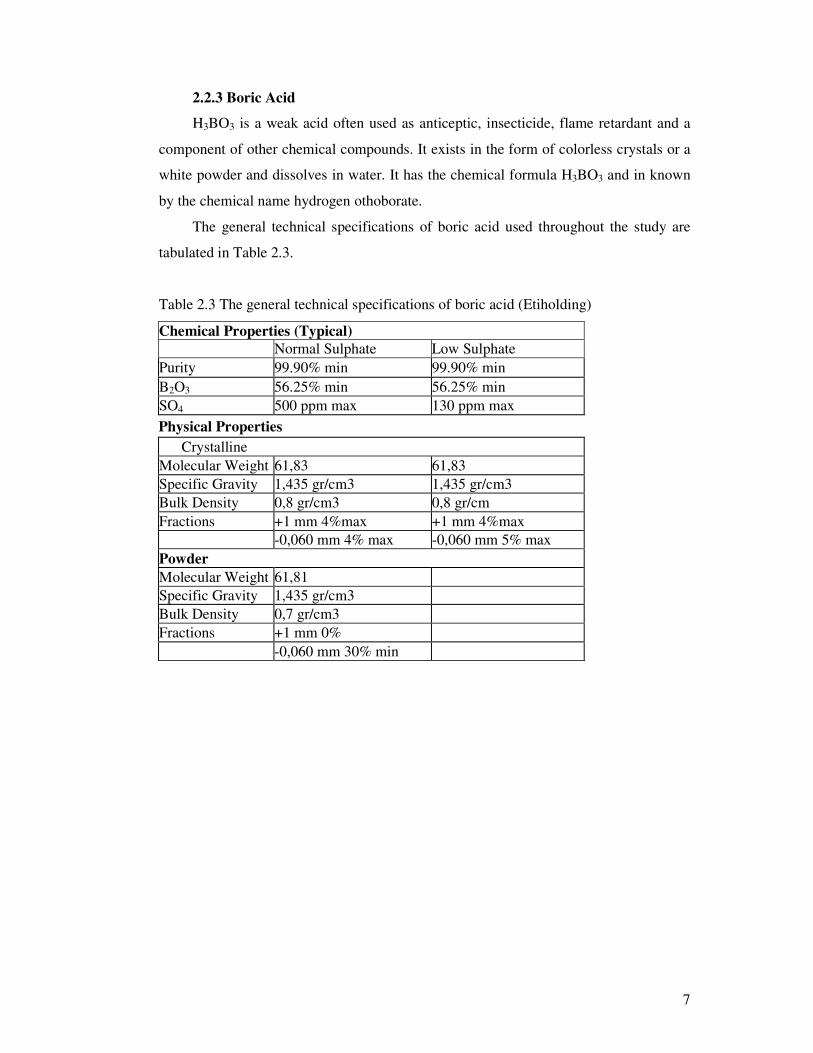
2.2.3 Boric Acid
H3BO3 is a weak acid often used as anticeptic, insecticide, flame retardant and a
component of other chemical compounds. It exists in the form of colorless crystals or a
white powder and dissolves in water. It has the chemical formula H3BO3 and in known
by the chemical name hydrogen othoborate.
The general technical specifications of boric acid used throughout the study are
tabulated in Table 2.3.
Table 2.3 The general technical specifications of boric acid (Etiholding)
Chemical Properties (Typical) Normal Sulphate Low Sulphate Purity 99.90% min 99.90% min B2O3 56.25% min 56.25% min SO4 500 ppm max 130 ppm max Physical Properties Crystalline Molecular Weight 61,83 61,83 Specific Gravity 1,435 gr/cm3 1,435 gr/cm3 Bulk Density 0,8 gr/cm3 0,8 gr/cm Fractions +1 mm 4%max +1 mm 4%max -0,060 mm 4% max -0,060 mm 5% max Powder Molecular Weight 61,81 Specific Gravity 1,435 gr/cm3 Bulk Density 0,7 gr/cm3 Fractions +1 mm 0% -0,060 mm 30% min

8
The solubility of boric acid in water increases with respect to temperature which is
shown in the solubility chart of in Figure 2.1.
�
���
���
���
�
� �
� ��
�� �� �� �� � � � �� � �� ��������������� � � ��!�"
# $% &'( %( ) *$+ ' $,( -.-( /�01.,) 23 4551.,) 26.) 7,
Fig.2.1 The solubility of boric acid (Kirk-Othmer, 1970).
2.3 Other Metal Borates
Borate salts or complexes of virtually every metal have been prepared. For most
metals, a series of hydrated anhydrous compounds may be obtained by varying the
starting materials and/or reaction conditions. Some have achieved commercial
importance.
In general, hydrated borates of heavy metals are prepared by mixing aqueous
solutions or suspensions of the metal oxides, sulfates, or halides and boric acid or alkali
metal borates such as borax. The precipitates formed from basic solutions are often
sparingly-soluble amorphous solids having variable compositions. Crystalline products
are generally obtained from slightly acidic solutions.
Anhydrous metal borates may be prepared by heating the hydrated salts to 300-
500 oC, or by direct fusion of the metal oxide with boric acid or B2O3. Many binary or
tertiary anhydrous systems containing B2O3 form vitreous phases over certain ranges of
composition (Kirk-Othmer, 1994).

9
2.3.1 Barium Metaborate
Three hydrates of barium metaborate, BaOB2O3xH2O, are known. The
tetrahydrate and pentahydrate both contain the B(OH)-4 anion, and are properly
formulated as Ba[B(OH)4]2xH2O where X=0 or 1. These compounds crystallize when
solutions of barium chloride and sodium metaborate are combined at room temperature.
The higher hydrate is favored when excess sodium metaborate is used. Saturated
aqueous solutions contain 13.5 g/L of BaOB2O34H2O at 25 oC. Both forms dehydrate at
temperature above 140oC. Barium metaborate may also be prepared from barium sulfide
formed by prior reduction of barium sulfate. The presence of sulfide impurities in the
product may render it unsuitable for some applications. Crystals of a hydrate, x=1.67
H2O, form from a boiling solution having the B:Ba molar ratio <2. Dehydration of this
hydrate at 300oC gives BaOB2O3 in which boron atoms are both triangularly and
tetrahedrally coordinated.
Barium metaborate is used as an additive to impart fire-retardant and mildew-
resistant properties to latex paints, plastics, textiles, and paper products. Barium
metaborate is marketed by Buckman Labs, Inc., Memphis, Tennessee (Kirk-Othmer,
1994).
2.3.2 Copper, Manganese, and Cobalt Borates
Borate salts of copper, manganese, and cobalt are precipitated when borax is
added to aqueous solutions of the metal (II) sulfates or chlorides. However, these
materials are no longer produced commercially (Kirk-Othmer, 1994).
10
CHAPTER 3
ZINC BORATE
3.1 General Properties of Zinc Borate
Plastic materials are widely used all throughout our lives. The importance of flame
retardancy of plastics and flame retardant materials are also increasing day by day. A
series of hydrated zinc borates have been developed for use as fire-retardant additives in
coatings and polymers. The most widely used one is zinc borate with the formula
2ZnO·3B2O3·3.5H2O, but many zinc borates are used within these formulations such as
4ZnO·B2O3·H2O, ZnO·B2O3·1.12H2O, ZnO·B2O3·2H2O, 6ZnO·5B2O3·3H2O,
2ZnO·3B2O3·7H2O, 2ZnO·3B2O3·3H2O, 3ZnO·5B2O3·14H2O and ZnO·5B2O3·4.5H2O.
Worldwide consumption of these zinc salts is several thousand metric tons per year. A
substantial portion of this total is used in vinyl plastics where zinc borates are added
(Kirk-������������ ������������������������! � #"�$&%
Besides zinc borate, flame retardant materials such as aluminum trihydrate,
magnesium hydroxide, antimony, phosphorus and bromine compounds are also used.
Antimony trioxide and the halogenated compounds of the former have been banned
because of their toxic gases during burning. The ban of halogenated compounds has
increased the usage of synergistic compounds. The usage of zinc borates with aluminum
trihydrate for this purpose has increased.
Zinc borate, 3ZnO·2B2O3, forms a white amorphous powder or triclinic crystals
depending on the method of preparation, specific gravity 3.64 (amorphous), 4.22
(crystalline); and melting point 980ºC. The amorphous form is slightly soluble in water
and hydrochloric acid, the crystalline is insoluble in hydrochloric acid (Kirk-Othmer,
1970). The heat stability of hydration water of zinc borate is between 290 – 300ºC
which enables the polymer processebility. Because the refractive index of zinc borate is
nearly the same to the refractive indices of many polymers, it enables the pigment load
to be low. The theoretical composition and physical properties of zinc borate having 3.5 '�(*)�+�,.-0/21�3546,.-�7�+8,�+97�:#/<;#7=3>/<3@?A,�B!C27ED!F�GIHJ?�7�K�-J,ML&N�O#P�P#D�QRF
11
S�T�UWVYX[Z!\�]^S`_#Xba�_#XMc�deX�aJfYg�TMVhgc�ikj!c#lRfma0fYc�noT�n*pqj�_�rslRfYg�T�Vtj�d�c�j*Xd0a�fYX�lkc#uwv�f<n*gbU*c�d�T.aJXMxJSAX�y�a�T�z&{2003).
B2O3, % 48.05
ZnO, % 37.45
Crystal water, % 14.50
Refractive index 1.58
Average particle size, µm 7 – 12
Solubility (At room temperature), % 0.28
Specific gravity, g/cc 2.77
Zinc borate 2ZnO3B2O3·7H2O is formed when borax is added to aqueous
solutions of soluble zinc salts at temperatures below about 70oC. An x-ray structure
determination has indicated that this compound is orthorhombic and has a zinc triborate
monohydrate structure. Zn[B3O3(OH)5]H2O. Zinc borates 2ZnO3B2O3·7H2O and ZnO
B2O3·2H2O lose water of hydration when heated from 130 to 250oC (Kirk-Othmer,
1994).

12
3.2 Applications
Main application areas of zinc borate are listed in Table 3.2.
Table 3.2 Main application areas of zinc borate
(http://www.samuelbanner.co.uk/storey/home.htm).
1. PVC Smoke suppression,snergy,char formation
2. Halogen Free Cable Compounds Smoke suppression,snergy,afterflame reduction,char formation.
3.Conyeyor Belting Synergy ,after glow suppression
4.Nylon6,6 Snergy,anti-drip,electrical track property improvement
5.Glass Reinforced Polyester Synergy,Smoke levels contained
6.Epoxy Synergy,L.O.I. Improvements
7.Carpet Backing Bond strength improvement,low smoke carpets e.g. Aircrafts
8.General Rubber After glow suppression ,can be used with chlorinated paraffin to improve flame ret.
9.Cotton Fabric Treatment Afterglow suppression , cotton polycotton latex back coating
Giudice and Benitez, [2001]; discussed the influence of ZB with molecular
formulas of 3.5 H2O and 7.5 H2O on flame resistance of paints. Eight different paint
compositions were prepared. LOI, and flame spread index (FSI) tests were carried out to
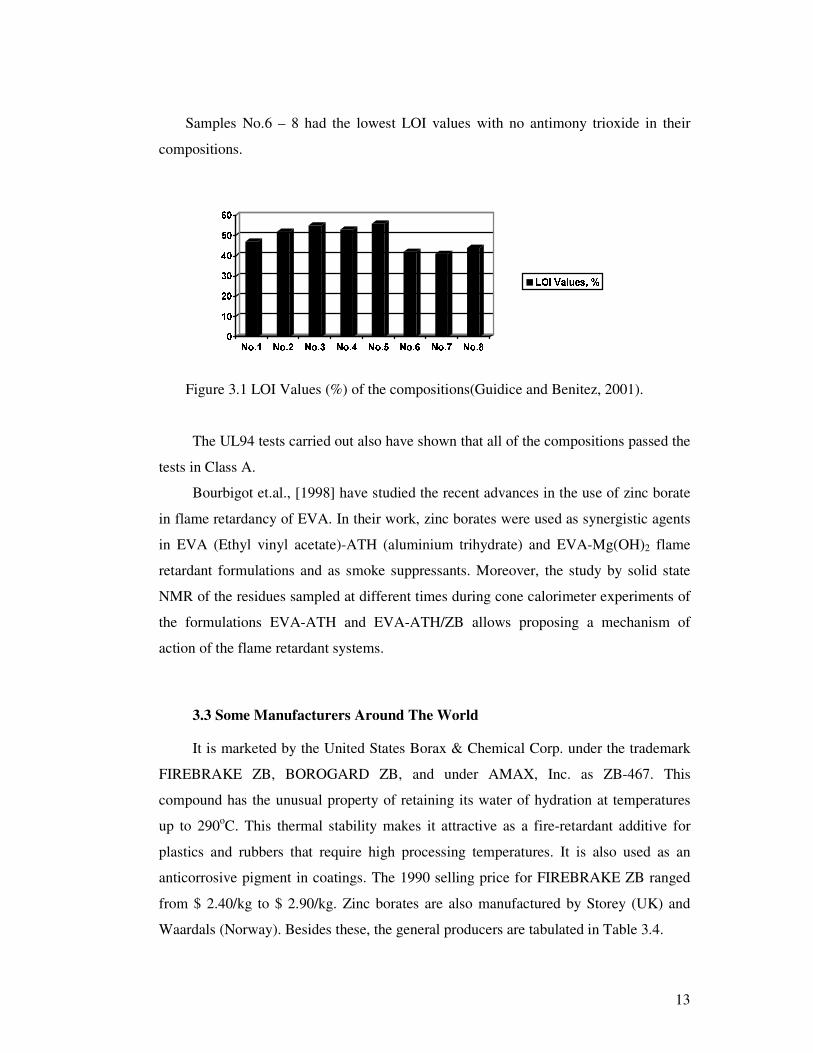
test the flame retardancy. As shown in Figure 3.1, results of LOI tests indicate that the
compositions having both ZB’s (No.5) and having only 7.5 H2O (No.3) with antimony
trioxide have the maximum values. All sample compositions are given in Table 3.3.
Table 3.3. Composition of flame-retardant coatings, % by volume on solidsa(Guidice and Benitez, 2001).
Component 1 2 3 4 5 6 7 8
Titanium dioxide 11.5 11.5 11.5 11.5 11.5 11.5 11.5 11.5 Antimony trioxide 9.0 6.0 6.0 6.0 3.0 - - - Zinc borateb - 3.0 - 1.5 3.0 4.5 9.0 - Zinc boratec - - 3.0 1.5 3.0 4.5 - 9.0 Micronized talc 22.4 22.4 22.4 22.4 22.4 22.4 22.4 22.4 Chlorinated alkyd resin
(solids)d
52.4 52.4 52.4 52.4 52.4 52.4 52.4 52.4 Bentone (gel) 2.8 2.8 2.8 2.8 2.8 2.8 2.8 2.8 Additives 1.9 1.9 1.9 1.9 1.9 1.9 1.9 1.9
a PVC (pigment volume concentration), 42.9% b 2ZnO |~}M� 2O3 ���s����� 2O c
2ZnO �~��� 2O3 ���W�~��� 2O d 24.9% chlorine content.
13
Samples No.6 – 8 had the lowest LOI values with no antimony trioxide in their
compositions.
��������������e����
��.� � ���� � ���.� ���.� ¡ ��.� ¢ ���.� £ ¤�¥.¦ § ¨©.ª «
¬®#¯0°M±R² ³R´eµ&¶�·
Figure 3.1 LOI Values (%) of the compositions(Guidice and Benitez, 2001).
The UL94 tests carried out also have shown that all of the compositions passed the
tests in Class A.
Bourbigot et.al., [1998] have studied the recent advances in the use of zinc borate
in flame retardancy of EVA. In their work, zinc borates were used as synergistic agents
in EVA (Ethyl vinyl acetate)-ATH (aluminium trihydrate) and EVA-Mg(OH)2 flame
retardant formulations and as smoke suppressants. Moreover, the study by solid state
NMR of the residues sampled at different times during cone calorimeter experiments of
the formulations EVA-ATH and EVA-ATH/ZB allows proposing a mechanism of
action of the flame retardant systems.
3.3 Some Manufacturers Around The World
It is marketed by the United States Borax & Chemical Corp. under the trademark
FIREBRAKE ZB, BOROGARD ZB, and under AMAX, Inc. as ZB-467. This
compound has the unusual property of retaining its water of hydration at temperatures
up to 290oC. This thermal stability makes it attractive as a fire-retardant additive for
plastics and rubbers that require high processing temperatures. It is also used as an
anticorrosive pigment in coatings. The 1990 selling price for FIREBRAKE ZB ranged
from $ 2.40/kg to $ 2.90/kg. Zinc borates are also manufactured by Storey (UK) and
Waardals (Norway). Besides these, the general producers are tabulated in Table 3.4.

14
Table 3.4 ¸8¹#ºE»�º�¼!º�½e¾M¿#À>¾�¼#Á!Â0¾=Ã.Ä�Á#½eº½�Åƾ�¼!ÇwÄ�¹*ºMÈ<½`þ�É!¾ÃMÈmÄJÈYº�ÅËÊJ¸8ºÌ�Ä;�Î&Ï�Ð!Ñ�Ñ#Ò�ÓRÔ Country Producer Place Capacity,
ton/annum. Hainan Zhongxin Chemical Haiko 1.000
Shanghai Jinghua Chemical Wujing -
Wuxi Daxhong Chemical - - China
Zhenjiang Sulphuric Acid Plant Zhenjiang city 1.000
India C-Tech Mumbai -
Norway Waardals Skalevik -
Anzon Laredo - USA
US.Borax Wilmington 12.000
3.4 Market Share
The most consuming countries in the world are from US and West Europe. The
consumptions of the flame retardant materials according to regions are given in Table
3.5.
Table 3.5 The consumpÕ0ÖY×�ØÙ×#Ú`Ú�ÛYÜ�ÝkÞIß�Þ�Õ�Ü�ß�à�Ü�Ø�ÕJáËÖâØäã�å�å!æ5çJèAÞ�é�Õ�Ü�ê&ë�ì*í�í#î�ï&ð Regions Per cent consumption North America 45 %
West Europe 32%
Japan 13%
Other Asian Countries 8%
Others 2%
The flame retardants used in US and West Europe ratios are given in Table 3.6.

15
Table 3.6 The ratio of other flame retardants used in US and West Europe ñ0òAóô�õ�ö�÷&ø2003).
Flame Retardants US West Europe
Al(OH)3 39 47
Bromine based 27 13
Phosphorus based 12 23
Chlorine based 11 3
Antimony oxides 8 7
Mg(OH)2 1 2
Others* 2 5
*Zinc borate and other borates are given in Others section.
85% of flame retardants produced all around the world find use mostly in plastics.
For this section, Al(OH)3 is the most important item and find use around 50%. The
borates find a less amount in total world share of flame retardants currently. For
example, of the 350.000 MT/year share of flame retardant industry in North America,
borates find a market of 1%(3.500 MT/year). However, in US the share of zinc borate
increased starting from 1991 and US.Borax company has also increased its capacity.
The increase in world zinc borate market is expected to be between 12 and 15% per
year. The price index of zinc borate is given in Table 3.7.
Table 3.7 ù�ú�ûYü=ýEû<þ!ÿ�ý���� ��� û<þ!ü����ú����ý� ����Aý���������������� �"! Year Price, USD/MT
1980 1100
1988 1700 – 1840
1992 2420
1998 2180
2001 2340
In US, although the price of zinc borate was expected to be around 2300 USD/MT
levels, there were prices between 1250 and 1470 USD/MT in world market.

16
3.5 Future Market of Zinc Borate
The increase in the use of synergistic mixture of zinc borate together with
aluminum trihydrate has also increased the consumption of zinc borate. The reason for
this usage is that the synergistic mixture of these two compounds promotes a non-
halogen char formation. All around the world the consumption of halogeneous flame
retardants are decreasing leading its way to compounds which are not halogeneous.
Also this mixture is a smoke suppressant.
The price of zinc borate is lower than the bromine based flame retardants which
will affect the consumption of zinc borate in favor of this compound.
3.6 Toxicology
Zinc borate 2ZnO3B2O3·3.5H2O has an acute oral toxicity in rats LD50 >10000
mg/kg body weight and acute dermal toxicity in rabbits LD50>10000 mg/kg body
weight. It is not a skin irritant and gives a negative response in the Ames mutagenicity
test (Kirk-Othmer, 1994).
3.7 The Production of Zinc Borate
Zinc borate (2ZnO·3B2O3·3.5H2O) in general is produced with the reaction
between zinc oxide and boric acid. Boric acid is solved in water between temperatures
95ºC and 98ºC and zinc oxide and seed crystal of 2ZnO·3B2O3·3.5H2O is added to this
solution at a certain stoichiometric ratio. The reaction continues for a while by mixing
and the zinc borate formed is filtered, dried and ground. The boric acid solution is fed to
the system as reflux. The general flow sheet is given in Figure 3.2.

17
Fig.3.2 #�$&%('�)+*-,/.0.�12'�35476�.98:.9;�4�%�</;='�>�?@A1�B('�8�*DC:*D1�.�EF'�32G�BH8:@JI'�;=4K1L.NM�OP.AQ 1R4 S-T�UV�V�W�X"# This product has also been crystallized from solutions containing borax, zinc
@A,:%Y' ;DB(>/.�T�4�8>Z*['�>BH?�E\,�C>�;='�]^B(>�.7MLO_.�Q�1�4�S"T�U:V�V�W�X"#
3.8 Structural Characterization and Chemistry of Zinc Borate
Schubert et.al. [2003] have studied the structural characterization and chemistry of
industrially important zinc borate, Zn[B3O4(OH)3]. Several unique crystalline zinc
borates are known. The structure of Zn[B3O4(OH)3] was determined for the first time by
single – crystal X-ray diffraction, revealing it to be a complex network consisting of
infinite polytirborate chains crosslinked by coordination with zinc and further integrated
by hydrogen bonding.
Zinc borate is a complex inoborate (containing a borate structural unit that is an
infinite chain) composed of linked triborate moieties, interconnected by coordination
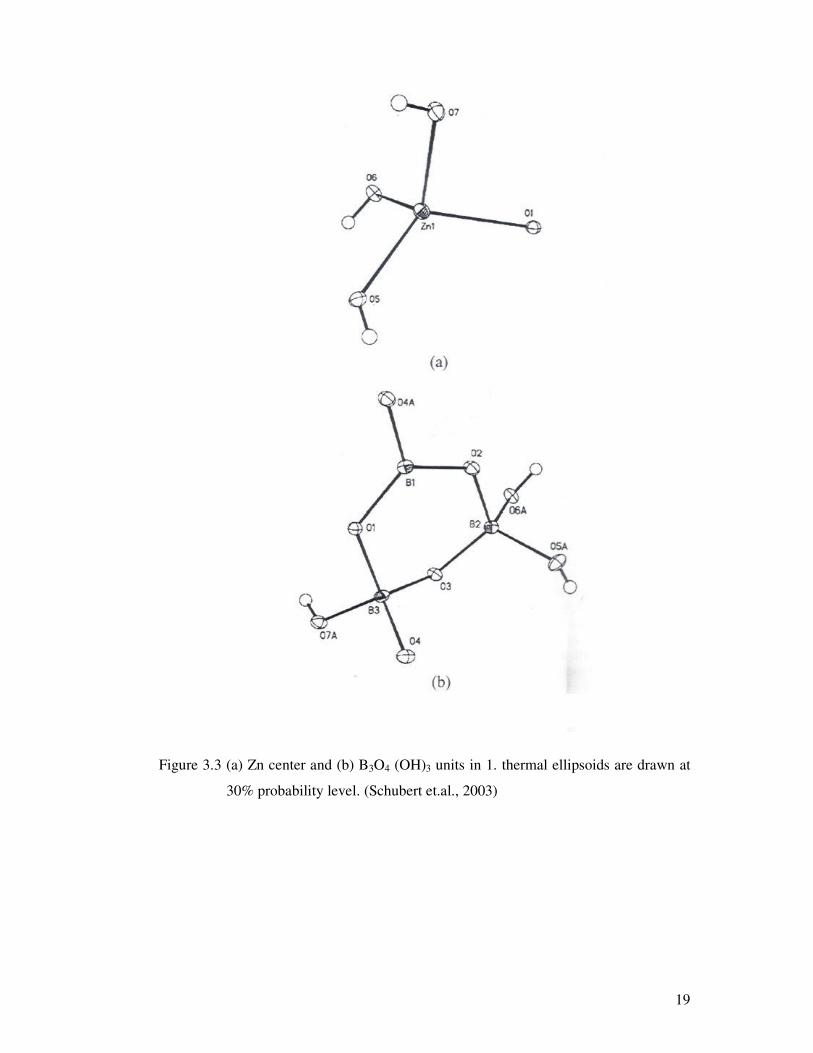
with pseudo-tetrahedral zinc centers and a network of H-bonds. The asymmetric unit in
1 includes one zinc atom (Figure 3.3 (a)) and one triborate moiety(Figure 3.3 (b)). There
are three unique boron sites present as one trigonal BO3 and two tetrahedral BO4
groups. These groups share oxygen vertexes to form a B3O3 boroxyl ring. One BO4
group has one attached OH group and the other has two, producing the B3O4(OH)3
subunit (Figure 3.3 (b)). These triborate moieties link into infinite chains parallel to
[101] by sharing an exocyclic oxygen (O4/O4A) between BO3 and BO4 polyhedra. The
BO2(OH)2 group is not involved in the chain extension. Each zinc atom (Figure 3.3(a))
is pseudotetrahedrally coordinated by oxygens of three different polyborate chains. Two
ZnO

18
zinc coordination positions are satisfied by one endocyclic boroxyl oxygen (O1) and
one hydroxyl oxygen (O7) that is attached to the adjacent triborate moiety in the same
chain, producing the six-membered ZnB2O3 rings, seen in Figure 3.4.
The boroxyl oxygen involved in zinc coordination lies between the BO3 and BO4
polyhedra involved in chain extension. The remaining two zinc coordination sites are
occupied by hydroxyl oxygens of BO2(OH)2 groups in two separate polyborate chains.
In this way, all hydroxyl groups are involved in zinc coordination.
Compound 1 exhibits a complex higher order structure. Not only does each zinc
center link three separate polyborate chains, but also these chains are interconnected by
H-bonds. All there OH hydrogens are involved in H-bonding with oxygen atoms of
adjacent chains. Chains are connected via O5-H5…O3, O6-H6…O4, and O7-H7…O2
hydrogen bonds. Notably all three H-bonds involve B-O-B acceptor oxygen atoms and
not B-O-H oxygens, which may explain the relatively high dehydration onset
temperature of 1. The three hydrogens atoms in 1 are observed in the H MAS NMR
spectrum. Owing to their distinct differences in H-bonding strengths, the three proton
sites yield clearly resolved resonances at 4.6, 7.0, and 8.6 ppm.
19
Figure 3.3 (a) Zn center and (b) B3O4 (OH)3 units in 1. thermal ellipsoids are drawn at
30% probability level. (Schubert et.al., 2003)

20
Figure 3.4. A segment of the infinite polytriborate chains in 1 showing zinc interactions.
Zinc atoms are shown with only two coordination positions occupied for
clarity. Thermal ellipsoids are drawn at 30% probability level. (Schubert
et.al., 2003)
There are regular 4-fold centrosymmetric connections between alternating
complementary pairs of triborate moieties in neighboring chains. These interactions
involve two zinc centers, one in each chain, that link adjacent triborate rings via 2-fold
O6-Zn-O1 coordination (corner sharing of zinc tetrahedral and borate polyhedra). The
same triborate are also linked by pairs of O7-H7…O2 H -bonds. Zinc atoms lie very
roughly in layers positioned between repeating pairs of polyborate chains.
Borate structures can be described in terms of compact, insular groups, referred to
as fundamental building blocks (FBBs), forming the basis of classification schemes for
crystalline borate compounds. These schemes define FBBs according to the number of
boron atoms, the number of trigonal BO3 and tetrahedral BO4 groups, and the mode of
polymerization between the FBBs, to give isolated, modified isolated, chain, modified
chain, sheet, modified sheet, and three-dimensional network structures. Using the
classification scheme devised by Christ and Clark(1977), the borate structural unit of 1
is described as `badc/e ∆ + 2T), indicating a three-boron FBB containing one trigonal and
two tetrahedral boron centre. Using the more recent classification scheme proposed by
Burns and Hawthorne(1995), the structural unit 1 is described as 1∆2 f gdh ∆2 i jlk�mon:pAq=p∆ and r q=p�sLp�qutRvxw�y 3 and BO4 polyhydra, respectively.

21
3.8.1 Comparison with mineral structures
The structure of 1 bears similarities to some borate minerals, notably the
industrially important colemanite, Ca[B3O4(OH)3]•H2O, and the lesser known
studenitsite, Ca[B3O4(OH)3]. The industrial mineral hydroboracite,
CaMg[B3O4(OH)3]2•3H2O z0{}|�~�� so related. These minerals also contain infinite
polytriborate chains of the <∆2 ����������7���:~��l~9���x�9�D�|"| -linked by coordination with metal
cations. However, significant differences exist between the structures of these minerals
and 1 resulting from the different coordination demands of their metal cations.
In colemanite, calcium atoms link together by sharing oxygen to form chains
running parallel to the polytriborate chains (parallel to [100]). These calcium containing
chains share oxygen of the polytriborate chains and thereby interconnect them into
infinite sheets. These sheets are connected by H-bonding and a relatively small number
of Ca-O bonds, resulting in the perfect [101] cleavage characteristic of colemanite. In
contrast, the tetrahedral zinc centres in 1 do not form chains by sharing oxygen between
zinc and instead interconnect the polyborate chains into a three-dimensional network
rather than sheets. Consequently, 1 is a much less friable material than colemanite.
The closest mineral analogue to 1 in composition is studenitsite, Ca[B3O4(OH)3].
In contrast, however, this mineral contains corrugated calcium oxide sheets lying
between and interconnecting parallel polytriborate chains. Some notable differences
between studenitsite and colemanite are the absence of the interstitial water and a
helical rather than translational extension of borate chains in the former, with
B3O4(OH)3 groups within a chain related by a 2-fold screw axis parallel to the b-axis of
the crystal. Although colemanite contains one water in the coordination environment of
calcium, this water uses one hydrogen to H-bond to adjacent water with the result that
the total number of bonds from the interstitial complex, Ca(H2O)]+2, to the borate
structural unit is the same as that for Ca+2 in the studenitsite if each metal centre is
assigned the same coordination number.
Borate and polyborate structural units have associated basicities that are
approximately proportional to the percentage of tetrahedral boron in their FBBs. This is
also a function of the solution pH prevailing during borate crystallization since specific
borate anions are stable only within a given pH range. Empirical methods based on the
analysis of borate mineral structures were developed recently to estimate Lewis
basicities of borate structural units. According to the valence matching principle, to
have a stable structure, the Lewis basicity of the (anionic) borate structural unit must
22
match closely the Lewis acidity of the (cationic) interstitial complex. Correlations of
structural features found in minerals suggest that borate structural units adjust to
varying acid-base conditions, within stability ranges, by changing the average
coordination number of oxygen atoms (O-CN) in the structural unit, counting hydrogen
bonds and bonds to cations. Higher average O-CN values are associated with higher
borate basicities. These correlations depend heavily on the assignment of coordination
number to cations since this largely defines average O-CN.
Colemanite, studenitsite, and 1 have chemically equivalent borate structural units
and thus have the same Lewis basicities. However, Zn+2 has substantially higher Lewis
acidity than Ca+2. The structure of colemanite was analyzed by others with the
conclusion that it has an average O-CN of 3.6. Considering calcium to be 8-coordinated
and examination of the studenitsite structure indicates that it also has an average O-CN
of 3.6. The O-CN value of these minerals correlates well with the overall pattern for
borate mineral structures. Zinc favours four-coordination and the zinc atom in 1 to be
considered to be four. Each structural unit oxygen in 1 is coordinated once by either an
H-bond or zinc, resulting in an O-CN of 3.0. This O-CN value is significantly below the
range reported for borate minerals. Only by considering the coordination number of zinc
to be higher than 4 can the O-CN be higher.
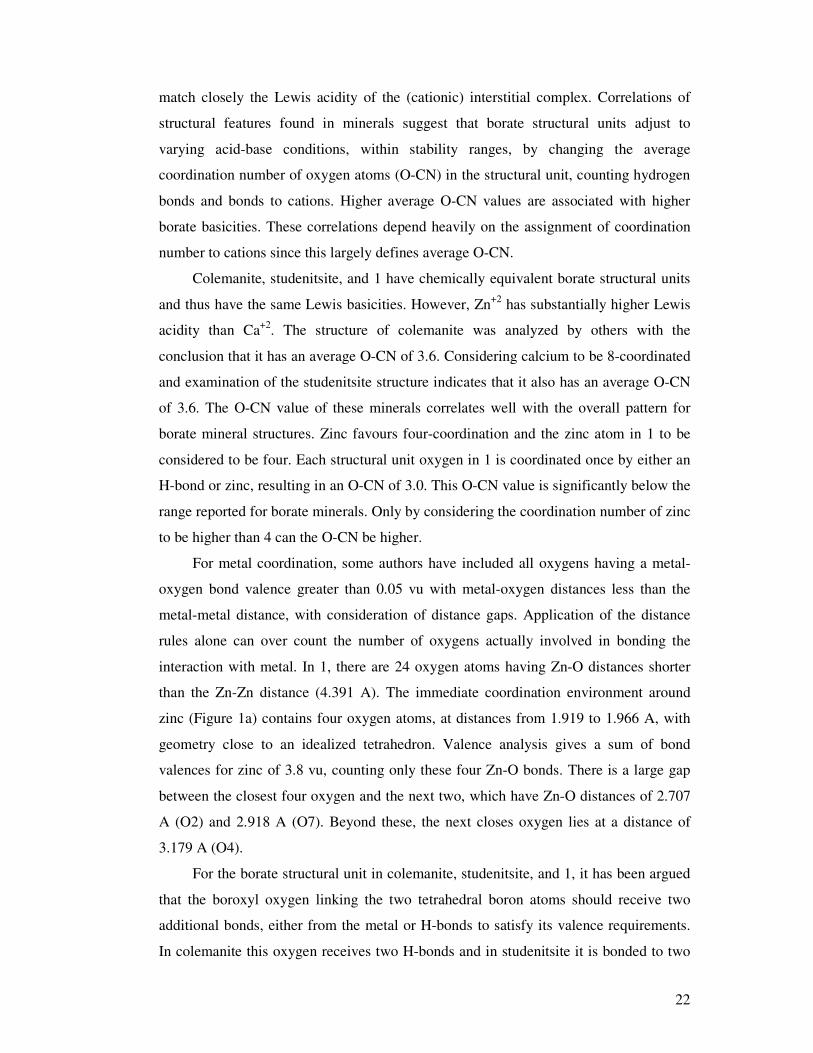
For metal coordination, some authors have included all oxygens having a metal-
oxygen bond valence greater than 0.05 vu with metal-oxygen distances less than the
metal-metal distance, with consideration of distance gaps. Application of the distance
rules alone can over count the number of oxygens actually involved in bonding the
interaction with metal. In 1, there are 24 oxygen atoms having Zn-O distances shorter
than the Zn-Zn distance (4.391 A). The immediate coordination environment around
zinc (Figure 1a) contains four oxygen atoms, at distances from 1.919 to 1.966 A, with
geometry close to an idealized tetrahedron. Valence analysis gives a sum of bond
valences for zinc of 3.8 vu, counting only these four Zn-O bonds. There is a large gap
between the closest four oxygen and the next two, which have Zn-O distances of 2.707
A (O2) and 2.918 A (O7). Beyond these, the next closes oxygen lies at a distance of
3.179 A (O4).
For the borate structural unit in colemanite, studenitsite, and 1, it has been argued
that the boroxyl oxygen linking the two tetrahedral boron atoms should receive two
additional bonds, either from the metal or H-bonds to satisfy its valence requirements.
In colemanite this oxygen receives two H-bonds and in studenitsite it is bonded to two

23
calcium atons. However, the corresponding oxygen in 1, O(3), receives only one H-
bond and is not within the tetrahedral coordination environment of zinc. The shortest
three O(3)-Zn distances are 3.282, 3.771, and 3.885 A. valence analysis, counting one
H-bond and two B-O bonds gives a sum of valences for O(3) of 1.81 vu, somewhat less
than the 1.90 vu calculated for colemanite. The two B-O bonds to these oxygen atoms
are both slightly shorter by 0.021-0.022 A in 1 than in colemanite.
The related synthetic monomeric triborate 6, Zn(H2O)[B3O3(OH)5], is an analogue
of the mineral meyerhofferite, Ca(H2O)[B3O3(OH)5]. Here, tetra-coordination of zinc
also results in a significantly lower average O-CN in the synthetic material compared to
that in the mineral. Explanations offered for why synthetic borates may not match the
patterns observed for borate minerals refer to the greater range of options available in
nature compared with more restricted synthetic systems. Hydrolytic stability under
geologic conditions may also be a factor. Clearly, geological conditions, as well as
those used to crystallize most anhydrous borates, favour more thermodynamically stable
products. Nevertheless, improved understanding of structure-stability relationships is
important to the development of synthetic methodologies for borates having useful
properties.
3.9 Zinc Borate
There are two patents regarding zinc borate production.
3.9.1 Patent by Schubert
In a US.Patent by Schubert [1995], zinc borate compositions having a ZnO:B2O3
ratio of 4:1 and anhydrous zinc borate are examined. The patent relates to improved
zinc borate compositions, and more particularly, provides a new hydrated zinc borate
having a high dehydration temperature which offers significant advantages for
compounding with plastics and rubbers at elevated temperatures. The anhydrous form
of zinc borate was also provided in this study offering advantages for compounding at
even high temperatures.
Many different hydrated zinc borates are known and several find commercial
application as fire retardants and smoke suppressants for various polymers. They are
also used for anticorrosive pigments for coatings and have demonstrated fungistatic and
bacteriostatic properties which find many applications.
24
In this study, a new crystalline, hydrated zinc borate having a relatively high
dehydration temperature which makes it especially useful for use in polymers requiring
processing at high temperatures was studied. The anhydrous form of zinc borate was
also provided with this study.
The hydrated zinc borate of this study had the formula 4ZnO·B2O3·H2O. It is a
crystalline solid having very slight water solubility and having a dehydration
temperature which begins at about 415ºC with a rapid loss occurring above 425ºC. Such
a high dehydration temperature makes this composition especially useful as an additive
for polymers requiring high processing temperatures such as polysulfones, polyamide-
imides, etc.
The studied zinc borate hydrate was comprised by the reaction of zinc oxide with
a near stoichiometric amount of boric acid (2:1 mole ratio) in water at an elevated
temperature, according to the equation
4ZnO+2B(OH)3 � ������b� � 2O3·H2O+2H2O.
The reaction takes place near the boiling point of the mixture and is promoted by
the presence of previously prepared product seed. The concentration of the initial
reaction mixture should be greater than about 5% by weight of starting reagents in order
to provide a reasonably rapid reaction rate. Preferably, reaction mixtures in the 10 –
20% by weight range were employed, since they require only a few hours of refluxing
in water to go to completion. It was also preferred that a slight molar excess
(approximately 5%) of boric acid was used in order to provide complete consumption of
zinc oxide in the reaction. The desired hydrated zinc borate product was readily
separated from the cooled reaction solution by filtration and dried to give the desired
crystalline product. It had also been found that more consistent results boiling water in
at least two separate portions, thereby maintaining the pH of the reaction mixture above
5.5, and the reaction mixture was efficiently stirred or mixed during the reaction period.
Other methods of preparing the hydrated zinc borate of the patent include
hydrolysis of the zinc borate 2ZnO·3B2O3·3.5H2O in a refluxing aqueous slurry. It has
been found that the concentration of the starting material in the aqueous slurry must be
less than about 5% in order to produce a complete reaction. At least five days of
continuous reflux at atmospheric pressure of 5% slurry of starting material was required
to give complete hydrolysis. Reflux of the reaction mixture containing free boric acid

25
for an excessive period of time (such as for one month) will convert the zinc borate to
the compound 6ZnO·5B2O3·3H2O which was previously reported as a product of the
hydrothermal reaction of zinc oxide and boric acid at 165ºC (Lehmann, 1967).
The zinc borate of this patent may also be prepared by reacting
2ZnO·3B2O3·3.5H2O with a stoichiometric amount of zinc oxide in refluxing water.
This reaction was also facilitated by the presence of seed crystals of previously prepared
zinc borate 4ZnO·B2O3·H2O. In some cases, the reaction appears to be catalyzed by the
presence of zinc ion such as supplied by a small amount of zinc chloride or zinc
sulphate.
A fourth method for preparing the 4ZnO·B2O3·H2O of this patent was by reaction
of sodium tetraborate with a zinc salt such as zinc sulphate and zinc oxide in boiling
water according to the equation.
Na2B4O7·5H2O + ZnSO4·7H2O + 7H2O + 7ZnO �
2(4ZnO·B2O3·H2O) + Na2SO4 + 10H2O
The presence of about 5% seed product facilitates the reaction which goes to
completion within a few hours.
The patent by Schubert [1994] written so far has given the following examples
illustrating the preparation and use of the zinc borates.
Example 1
200 grams of 2ZnO·3B2O3·3.5H2O (0.46 mol) was added to 4.5 L of deionized
water (DI) and boiled under reflux for six days. During this time the pH of the reaction
solution gradually decreased from 7.8 to about 4.5. The reaction slurry was then filtered,
washed with DI water and air dried to give 92.2 gr.(97% yield) of product,
4ZnO·B2O3·H2O having the analysis in Table 3.8:
Table 3.8 The analysis of 4ZnO·B2O3·H2O (Schubert, 1995)
Calculated, % Found, %
ZnO 78.79 78.35
B2O3 16.84 17.04
H2O 4.36 4.88

26
Since slight variations in analyses can be expected, a typical composition of the
hydrated zinc borate of this patent can be defined as 3.9-4.1(ZnO)·0.9-1.1(B2O3)·0.8-
1.2(H2O).
A portion of this filtrate was evaporated to dryness to give a crystalline solid
which was identified as boric acid by its XRD pattern.
Example 2
A 5-L flask was charged with 100 gr. (0.23 mol) of the zinc borate
2ZnO·3B2O3·3.5H2O, 74.9 gr (0.92 mol) of ZnO, 7.2 gr.(17 mmol) of previously
prepared seed product, and 2.0 L DI water. To this slurry was added 0.5 gr. Of ZnCl2
(3.7 mmol). The mixture was boiled under reflux for six hours with mechanical stirring.
The reaction was then cooled, filtered, and the product air dried to give 146.4
gr.(98% yield) of 4ZnO·B2O3·H2O, identified by its XRD pattern.
Example 3
A 5-L round bottom flask was charged with 488.4 gr.of ZnO(6 mol) and 3.5 L of
DI water. This slurry was brought to a boil and 28 gr.of previously prepared seed (0.07
mol) and 97.4 gr.of boric acid (1.58 mol) was added. After boiling this mixture under
reflux with stirring for 2.5h, another portion of boric acid (97.4 gr., 1.58 mol) was
added. After refluxing with stirring for another 2.5 h, the reaction mixture was cooled
and filtered. The solid product was washed with DI water and air dried to give 629.2 gr
(97% yield) of 4ZnO·B2O3·H2O.
Example 4
Sodium tetraborate pentahydrate (45.9 gr., 0.158 mol) was dissolved in 1.0 L of
hot DI water in a 5-L flask. To this solution was added 43.1 gr. of ZnSO4·H2O (0.15
mol) dissolved in 250 ml water. A white precipitate formed immediately. This mixture
was brought to a boil and ZnO (85.5 gr., 1.05 mol) and 6.2 gr.of previously prepared
seed (15 mmol) were added. The reaction mixture was boiled under reflux for six hours.
The reaction was cooled, filtered, washed with water and air dried to give 137.2 gr.
(97% yield) of 4ZnO·B2O3·H2O containing some residual zinc oxide.
Zinc borate 4ZnO·B2O3 can be prepared by the dehydration of the hydrate zinc
borate 4ZnO·B2O3·H2O. The dehydration was readily accomplished by heating the

27
hydrated borate at a temperature above 415ºC for a period of time sufficient to remove
essentially all water. Generally heating at a temperature in the range of about 500ºC to
550ºC for about 3 to 5 hours will produce good yields of the desired 4ZnO·B2O3.
The zinc borate 4ZnO·B2O3 is non-hygroscopic and is resistant to rehydration
even under high humidity conditions. This offers a significant advantage over many
other anhydrous metal borate compounds which are often appreciably hygroscopic.
Example 5
A 50 gr.(0.12 mol) sample of the zinc borate hydrate of this patent was heated in a
furnace at 500º - 550ºC for about 4 hours. This resulted in a weight loss of 2.2 gr.,
corresponding to the loss of 0.12 mol of water.
To test for moisture reabsorption, a sample of the resulting anhydrous zinc borate
was placed in an open container in a humidity chamber maintained at 90% relative
humidity and 90ºF for one month. After this time, a sample of this material was
subjected to thermogravimetric analysis (TGA). Less than 0.1% weight loss was
detected upon slowly heating the material over a period of about 2h from room
temperature to 700ºC, indicating that very little moisture was absorbed during
prolonged storage under high humidity conditions. Furthermore, no significant weight
loss was found when this material was heated continuously at 400ºC (Schubert, 1995).
3.9.2 Patent by Igarashi
In a patent by Igarashi et.al. [2001] zinc borate having a particular crystallite size
and containing very little sodium components and a method of preparing the same was
studied. The zinc borate had a particular chemical composition, had a crystallite size of
not smaller than 40 nm as found from diffraction peaks of indexes of planes of (020),
(101), and (200) in the x-ray diffraction image (Cu-kα) and contains sodium
components in amounts of not larger than 100 ppm as measured by the atomic
absorptiometric method.
Example 1
An aqueous solution was prepared by dissolving 72.5 gr.of boric acid (B2O3
content 56%) in 1000 ml of pure water. To the aqueous solution were added 96 gr.of a
zinc flower (ZnO content 99.4%) and 217.5 gr.of boric acid, and were stirred and mixed
28
together such that the molar ratio of B2O3/ZnO was 2.0. Next, the solution was stirred
and reacted at 60ºC for 90 minutes. The solution was further stirred and reacted at 90ºC
for 4 hours. The obtained product was filtered, washed with water and was then dried at
105ºC to obtain a zinc borate. Table 3.10 shows the chemical composition and
properties of the obtained zinc borate. Figure 3.5 shows the x-ray diffraction image of
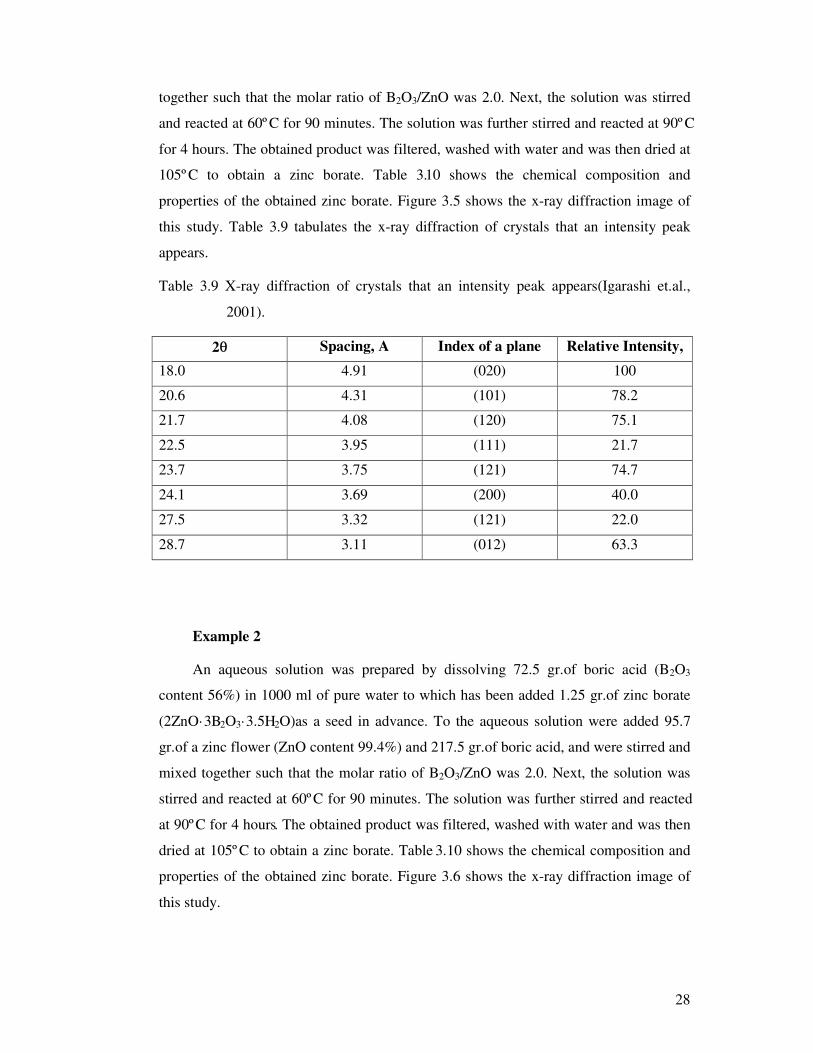
this study. Table 3.9 tabulates the x-ray diffraction of crystals that an intensity peak
appears.
Table 3.9 X-ray diffraction of crystals that an intensity peak appears(Igarashi et.al.,
2001).
2θθ Spacing, A Index of a plane Relative Intensity,
l/l100 18.0 4.91 (020) 100
20.6 4.31 (101) 78.2
21.7 4.08 (120) 75.1
22.5 3.95 (111) 21.7
23.7 3.75 (121) 74.7
24.1 3.69 (200) 40.0
27.5 3.32 (121) 22.0
28.7 3.11 (012) 63.3
Example 2
An aqueous solution was prepared by dissolving 72.5 gr.of boric acid (B2O3
content 56%) in 1000 ml of pure water to which has been added 1.25 gr.of zinc borate
(2ZnO·3B2O3·3.5H2O)as a seed in advance. To the aqueous solution were added 95.7
gr.of a zinc flower (ZnO content 99.4%) and 217.5 gr.of boric acid, and were stirred and
mixed together such that the molar ratio of B2O3/ZnO was 2.0. Next, the solution was
stirred and reacted at 60ºC for 90 minutes. The solution was further stirred and reacted
at 90ºC for 4 hours. The obtained product was filtered, washed with water and was then
dried at 105ºC to obtain a zinc borate. Table 3.10 shows the chemical composition and
properties of the obtained zinc borate. Figure 3.6 shows the x-ray diffraction image of
this study.

29
Example 3
An aqueous solution was prepared by dissolving 72.5 gr.of boric acid (B2O3
content 56%) in 1000 ml of pure water. To the aqueous solution were added 95.7 gr.of a
zinc flower (ZnO content 99.4%) and 217.5 gr.of boric acid, and were stirred and mixed
together such that the molar ratio of B2O3/ZnO was 2.0. Next, the solution was stirred
and reacted at 45ºC for 120 minutes. The solution was further stirred and reacted at
90ºC for 4 hours. The obtained product was filtered, washed with water and was then
dried at 105ºC to obtain a zinc borate. Table 3.10 shows the chemical composition and
properties of the obtained zinc borate. Figure 3.7 shows the x-ray diffraction image of
this study.
Example 4
An aqueous solution was prepared by dissolving 72.5 gr.of boric acid (B2O3
content 56%) in 1000 ml of pure water. To the aqueous solution were added 95.7 gr.of a
zinc flower (ZnO content 99.4%) and 217.5 gr.of boric acid, and were stirred and mixed
together such that the molar ratio of B2O3/ZnO was 2.0. Next, the solution was stirred
and reacted at 60ºC for 120 minutes. The solution was further stirred and reacted at
80ºC for 8 hours. The obtained product was filtered, washed with water and was then
dried at 105ºC to obtain a zinc borate. Table 3.10 shows the chemical composition and
properties of the obtained zinc borate. Figure 3.8 shows the x-ray diffraction image of
this study.
Example 5
An aqueous solution was prepared by dissolving 72.5 gr.of boric acid (B2O3
content 56%) in 1000 ml of pure water. To the aqueous solution were added 95.7 gr.of a
zinc flower (ZnO content 99.4%) and 217.5 gr.of boric acid, and were stirred and mixed
together such that the molar ratio of B2O3/ZnO was 2.0. Next, the solution was stirred
and reacted at 60ºC for 120 minutes. The solution was further stirred and reacted at
85ºC for 6 hours. The obtained product was filtered, washed with water and was then
dried at 105ºC to obtain a zinc borate. Table 3.10 shows the chemical composition and
properties of the obtained zinc borate. Figure 3.9 shows the x-ray diffraction image of
this study.

30
Example 6
An aqueous solution was prepared by dissolving 72.5 gr.of boric acid (B2O3
content 56%) in 1000 ml of pure water to which has been added 1.25 gr.of zinc borate
(2ZnO·3B2O3·3.5H2O). To the aqueous solution were added 95.7 gr.of a zinc flower
(ZnO content 99.4%) and 217.5 gr.of boric acid, and were stirred and mixed together
such that the molar ratio of B2O3/ZnO was 2.0. Next, the solution was stirred and
reacted at 65ºC for 80 minutes. The solution was further stirred and reacted at 90ºC for
4 hours. The obtained product was filtered, washed with water and was then dried at
105ºC to obtain a zinc borate. Table 3.10 shows the chemical composition and
properties of the obtained zinc borate. Figure 3.10 shows the x-ray diffraction image of
this study.
Example 7
An aqueous solution was prepared by dissolving 72.5 gr.of boric acid (B2O3
content 56%) in 1000 ml of pure water. To the aqueous solution were added 95.7 gr.of a
zinc flower (ZnO content 99.4%) and 217.5 gr.of boric acid, and were stirred and mixed
together such that the molar ratio of B2O3/ZnO was 2.0. Next, the solution was stirred
and reacted at 55ºC for 120 minutes. The solution was further stirred and reacted at
75ºC for 7 hours. The obtained product was filtered, washed with water and was then
dried at 105ºC to obtain a zinc borate. Table 3.10 shows the chemical composition and
properties of the obtained zinc borate. Figure 3.11 shows the x-ray diffraction image of
this study.
Example 8
An aqueous solution was prepared by dissolving 72.5 gr.of boric acid (B2O3
content 56%) in 1000 ml of pure water. To the aqueous solution were added 95.7 gr.of a
zinc flower (ZnO content 99.4%) and 217.5 gr.of boric acid, and were stirred and mixed
together such that the molar ratio of B2O3/ZnO was 2.0. Next, the solution was stirred
and reacted at 60ºC for 90 minutes. The solution was further stirred and reacted at
110ºC for 4 hours. The obtained product was filtered, washed with water and was then
dried at 105ºC to obtain a zinc borate. Table 3.10 shows the chemical composition and
properties of the obtained zinc borate. Figure 3.12 shows the x-ray diffraction image of
this study.
31
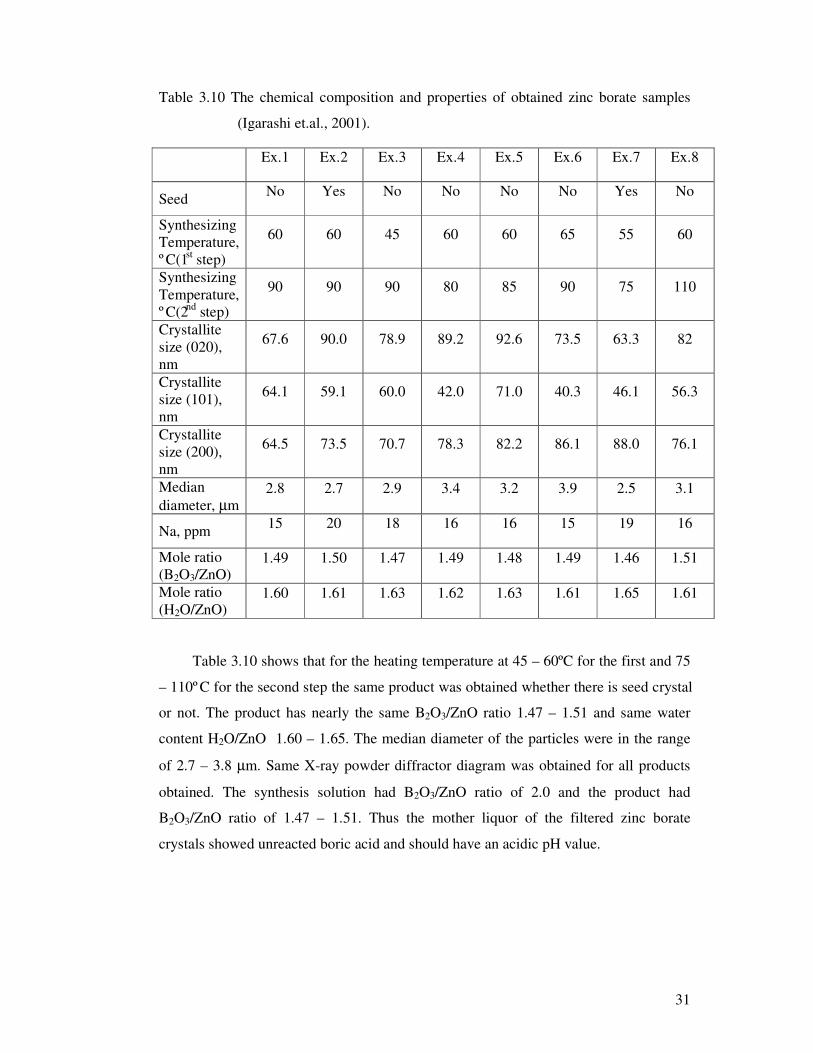
Table 3.10 The chemical composition and properties of obtained zinc borate samples
(Igarashi et.al., 2001).
Ex.1 Ex.2 Ex.3 Ex.4 Ex.5 Ex.6 Ex.7 Ex.8
Seed No Yes No No No No Yes No
Synthesizing Temperature, ºC(1st step)
60 60 45 60 60 65 55 60
Synthesizing Temperature, ºC(2nd step)
90 90 90 80 85 90 75 110
Crystallite size (020), nm
67.6 90.0 78.9 89.2 92.6 73.5 63.3 82
Crystallite size (101), nm
64.1 59.1 60.0 42.0 71.0 40.3 46.1 56.3
Crystallite size (200), nm
64.5 73.5 70.7 78.3 82.2 86.1 88.0 76.1
Median diameter, µm
2.8 2.7 2.9 3.4 3.2 3.9 2.5 3.1
Na, ppm 15 20 18 16 16 15 19 16
Mole ratio (B2O3/ZnO)
1.49 1.50 1.47 1.49 1.48 1.49 1.46 1.51
Mole ratio (H2O/ZnO)
1.60 1.61 1.63 1.62 1.63 1.61 1.65 1.61
Table 3.10 shows that for the heating temperature at 45 – 60ºC for the first and 75
– 110ºC for the second step the same product was obtained whether there is seed crystal
or not. The product has nearly the same B2O3/ZnO ratio 1.47 – 1.51 and same water
content H2O/ZnO 1.60 – 1.65. The median diameter of the particles were in the range
of 2.7 – 3.8 µm. Same X-ray powder diffractor diagram was obtained for all products
obtained. The synthesis solution had B2O3/ZnO ratio of 2.0 and the product had
B2O3/ZnO ratio of 1.47 – 1.51. Thus the mother liquor of the filtered zinc borate
crystals showed unreacted boric acid and should have an acidic pH value.

32
Figure 3.5 X-ray diffraction image of example 1(Igarashi et.al., 2001).
Figure 3.6 X-ray diffraction image of example 2(Igarashi et.al., 2001).
2θ
Intensity (Counts)
Intensity (Counts)
2θ

33
Figure 3.7 X-ray diffraction image of example 3(Igarashi et.al., 2001).
Figure 3.8 X-ray diffraction image of example 4(Igarashi et.al., 2001).
2θ
2θ
Intensity (Counts)
Intensity (Counts)

34
Figure 3.9 X-ray diffraction image of example 5(Igarashi et.al., 2001).
Figure 3.10 X-ray diffraction image of example 6(Igarashi et.al., 2001).
Intensity (Counts)
Intensity (Counts)
2θ
2θ

35
Figure 3.11 X-ray diffraction image of example 7(Igarashi et.al., 2001).
Figure 3.12 X-ray diffraction image of example 8(Igarashi et.al., 2001).
2θ
2θ
Intensity (Counts)
Intensity (Counts)

36
3.10 IR Studies
3.10.1 Infrared Spectra of Copolymer Having Zinc Borate
Xie et.al., [2001], have studied the dynamic thermo-oxidative degradation (TOD)
of expandable graphite (EG)-based intumescent halogen-free flame retardant (HFFR)
LLDPE blends in the condensed phase at 300 or 400°C by real time Fourier transform
infrared spectroscopy. They were examined extensively for several LLDPE/EG blends
with different additives such as the phosphorus-nitrogen compound, ammonium
polyphosphate, red phosphorus and zinc borate.
Figure 3.13 (a) and Fig.3.13 (b) show the dynamic FTIR spectra from the thermo-
oxidative degradation of LLDPE/EG/ZB blends at 300 and 400°C, respectively. The
small peak at 3227 cm-1 and several peaks between 900 and 1300 cm-1 are
characteristics of ZB additive. It can be seen that the intensities of several peaks
between 900 – 1300 cm-1 decrease slowly with increasing TOD times which is due to
the dehydration or breakdown of ZB on heating in temperature range of 300 – 400°C
and the formation of boric acid to promote the formation of surface-expanded
carbonaceous char structures between flame and polyolefins in the condition of a fire.
Wavenumbers, cm-1
Wavenumbers, cm-1
Fig.3.13 Changes of dynamic FTIR spectra obtained from the thermo-oxidative
degradation of LLDPE/10% EG/20% ZB blends in the condensed phase with
different pyrolysis times. (a): 300°C, (b) : 400°C(Xie et.al., 2001).

37
3.10.2 IR Spectra of Borate Anions
Yongzhong et.al.[1999] investigated the FTIR spectroscopy of supersaturated
aqueous solutions of magnesium borate. Its acidized solutions with azeotropic
hydrochoric acid and its diluted solutions with water have been recorded. The FTIR
spectra of borate in solution are obtained by difference, subtracting the FTIR spectrum
of water from that of magnesium borate supersaturated aqueous solution. All of the
results showed that various polyborate anions in the supersaturated aqueous solutions
exist. The bands of symmetric pulse vibration of the corresponding polyborate anions
were indicated in this study. The observed frequencies of FTIR spectra of solid
MgB6O10·7H2O are given in Table 3.11.
Table 3.11 The observed frequencies of FTIR and Raman spectra of MgB6O10·7H2O
and its supersaturated aqueous solution (Yongzhong et.al., 1999)
FTIR Assignment 1662 m δ (H-O-H)
1423 w
1351 w
vas (B(3)-O)
1240 m δ (B-O-H) 1098 w
1026 m
vas (B(4)-O)
957 s
898 m
vs (B(3)-O)
863 s
812 vs
vs (B(4)-O)
676 m γ (B(3)-O)
641 m vp[B6O7(OH)6]-2/ vp[B3O3(OH)4]-
581 w δ(B(3)-O)/δ(B(4)-O)
529 vw δ(B(3)-O)/δ(B(4)-O) 436 w δ(B(4)-O)
m: middle, s: strong, v: very, w: weak. B(3)-O means three coordinate boron,
B(4)-O means four coordinate boron.

38
3.11 Kinetics of zinc borate formation by the reaction of boric acid and zinc oxide
Shete et.al.[2003] have studied the kinetics of fluid – solid reaction of zinc borate
by the reaction between zinc oxide and boric acid. Mixing parameters influencing the
final particle size and conversion of zinc oxide were studied for the formation of zinc
borate. The formation of zinc borate is via a fluid – solid reaction. The process was
kinetically controlled above the minimum speed for particle suspension. The reaction
kinetics was developed and the rate constant was estimated in this study.
Most precipitation reactions are homogeneous but for the particular reaction which
was studied in this work, one of the reactants, boric acid, was in solution while the other
reactant, zinc oxide, was in solid form. Therefore the reaction is homogeneous. Some
assumptions were made, namely;
1. both zinc oxide particles and zinc borate particles were assumed to be
spherical.
2. zinc oxide particles were assumed to be insoluble in water.
3. boric acid ions in boric acid solution react with zinc oxide particles on the
surface of the latter.
The reaction studied in this work was a fluid – particle forming an insoluble
reaction product. It has been suggested that an unreacted-core model applies in such
circumstances. The successive steps visualized during the reaction have been described
by Levenspiel, 1995.
Step 1: Diffusion of borate ions from the bulk phase of the boric acid solution to
the surface of zinc oxide particles (physical).
Step 2: Penetration and diffusion of borate ions through the blanket of ash layer
covering the unreacted core to the surface of the unreacted core of zinc oxide (physical).
Step 3: Reaction of borate ions with zinc oxide particles at reaction surface
(chemical).

39
Step 4: Formation of zinc borate and diffusion of co-product water molecule
through the ash layer covering the unreacted core back to the bulk phase (physical).
Step 5 (possibility): Peeling of zinc borate layer due to shear/collissions, etc.
The fluid – solid nature of the reaction makes it necessary to study the effect of
mixing conditions on conversion of the zinc oxide along with the mean particle size of
zinc borate.
To determine the effects of mixing, the following parameters were studied:
1. Speed of agitation.
2. Impeller type.
3. Mean particle size of zinc oxides.
4. Temperature.
5. Initial concentration of boric acid.
3.11.1 Effect of impeller type
Six – bladed pitched blade turbine down flow (PTD), impeller – disc turbine (DT)
and three – bladed hydrofoil impellers (HF3) having a diameter 0.05m equal to one
third of the vessel’s diameter (0.15m) were used in this study. These were located
0.05m from the vessel bottom. The minimum suspension speed is an important
parameter in fluid – solid reactions since only when all the particles are suspended will
the entire particle surface be available for the reaction. Each impeller has a minimum
suspension speed, Ns. For the conditions employed, the Ns values were 4.92 rev s-1 and
5.8 rev s-1 for PTD and DT, respectively. The minimum suspension speed was 10 rev s-1
for the HF3 which was measured experimentally by suspending particles in a non-
reacting medium having the same physical properties.
Conversion of zinc oxide was higher for the DT impeller and lower for each of the
PTD and HF3 impellers as shown in Fig.3.14(a). The effect of impeller type on mean
particle sizes of zinc borate is shown in Fig.3.14(b). Mean particle sizes shown in the
graphs are the values obtained at Ns. As seen from Fig.3.14(b), the HF3 impeller gave
the lowest particle size.

40
Figure 3.14. (a) Effect of impeller type on conversion of zinc oxide. Impeller DT,
PTD and HF3. temperature of reaction 90C. concentration of boric acid – 3:1 mole
ratio. Initial particle size of zinc oxide particles – 20.3µm. (b) Effect of impeller type on
mean particle size of zinc borate. Impeller –DT, PTD, HF3. Temperature of reaction –
90C. Concentration of boric acid – 3:1 mole ratio. Initial particle size of zinc oxide
particles – 20.3µm. (Shete et.al.,2003)
41
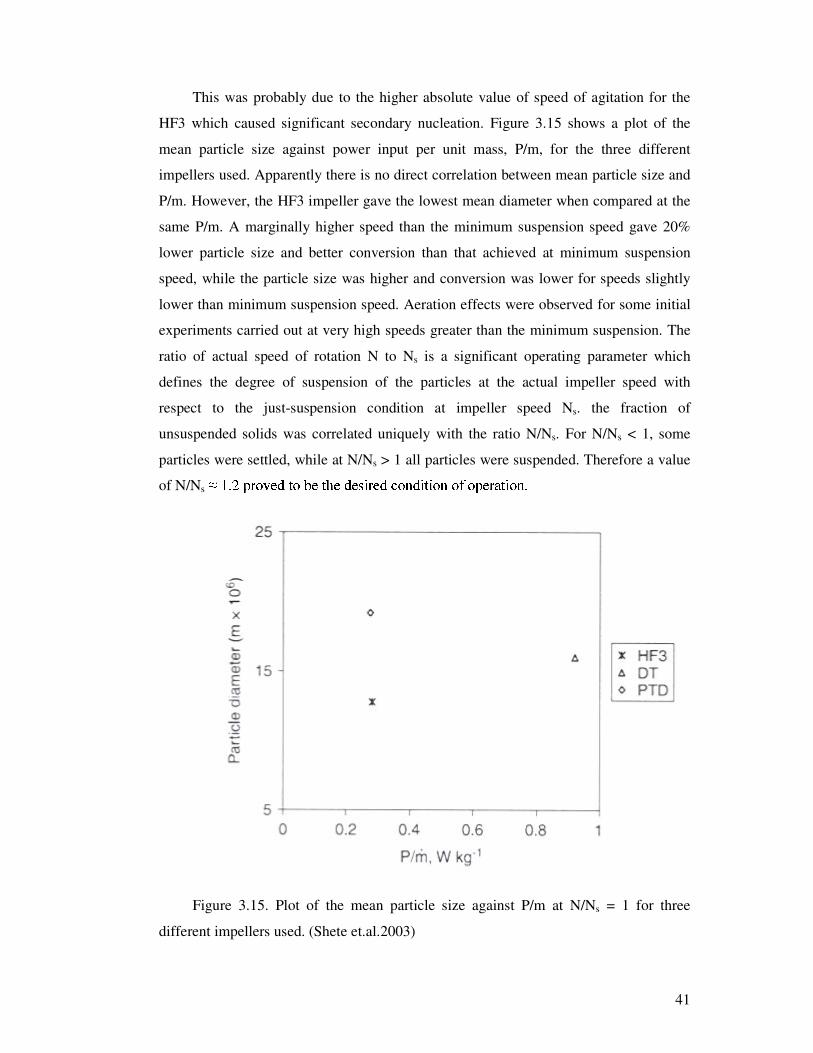
This was probably due to the higher absolute value of speed of agitation for the
HF3 which caused significant secondary nucleation. Figure 3.15 shows a plot of the
mean particle size against power input per unit mass, P/m, for the three different
impellers used. Apparently there is no direct correlation between mean particle size and
P/m. However, the HF3 impeller gave the lowest mean diameter when compared at the
same P/m. A marginally higher speed than the minimum suspension speed gave 20%
lower particle size and better conversion than that achieved at minimum suspension
speed, while the particle size was higher and conversion was lower for speeds slightly
lower than minimum suspension speed. Aeration effects were observed for some initial
experiments carried out at very high speeds greater than the minimum suspension. The
ratio of actual speed of rotation N to Ns is a significant operating parameter which
defines the degree of suspension of the particles at the actual impeller speed with
respect to the just-suspension condition at impeller speed Ns. the fraction of
unsuspended solids was correlated uniquely with the ratio N/Ns. For N/Ns < 1, some
particles were settled, while at N/Ns > 1 all particles were suspended. Therefore a value
of N/Ns �������x���D� �/ �¡£¢R�x¤ ¥¢Y¦ 7¡� 0§©¨H�� 0¡«ª0� ¬:¡/¨¢�¨}� ¬®��¯5���/ ��=°�¢�¨Y� ¬��
Figure 3.15. Plot of the mean particle size against P/m at N/Ns = 1 for three
different impellers used. (Shete et.al.2003)
42
3.11.2 Effect of speed of agitation
To study the effect of speed of agitation on conversion of zinc oxide and mean
particle size of zinc borate, the speed of agitation was varied for 0.83 < N/Ns > 1.2.
Typical results are shown in Fig.3.16(a). As the speed was increased conversion also
increased. With increasing speed of agitation, the mass transfer of borate ions in
solution to zinc oxide particles increased. Thus higher conversion was achieved with the
increase in speed of agitation in a shorter time. It is evident that initially the conversion
increased with speed of agitation (N/Ns < 1). However at higher speed (N/Ns ±5²o³�´µspeed of agitation has no effect on conversion, indicating that the diffusional resistance
is eliminated (Step 2).

43
Figure 3.16. (a) Effect of impeller speed on conversion of zinc oxide. Impeller – HF3.
Temperature of reaction 90ºC. Concentration of boric acid, 3:1 mole ratio.
Initial particle size of zinc oxide particles, 20.3µm. (b) Effect of impeller
speed on mean particle size of zinc borate for different impellers. Impeller,
DT, PTD, HF3. Temperature of reaction, 90ºC. Concentration of boric
acid, 3:1 mole ratio. Initial particle size of zinc oxide particles, 20.3
µm(Shete et.al.,2003).
44
Figure 3.14(b) shows the effect of speed of agitation on mean particle size of zinc
borate. Mean particle size decreased with increase in speed as expected since the higher
speed of agitation caused greater secondary nucleation due to higher strength and
frequency of collisions.
3.11.3 Effect of mean initial particle size of zinc oxide
To study this effect, three different mean particle sizes of zinc oxide were used.
These are 20.30 (50-100 µm), 26.29 (100-150 µm) and 26.98 (150-180 µm). The
impeller used was the DT at N/Ns = 1. Figure 3.17(a) shows that the mean initial
particle size affected the conversion of zinc oxide. The time needed for conversion of
zinc oxide was longer with increase in mean particle size of zinc oxide. This is
indication that the process is surface reaction controlled. The mean particle size of zinc
borate was higher for higher mean initial particle size of zinc oxide, as shown in
Fig.3.17 (b).

45
Figure 3.17. (a) Effect of mean initial particle size on conversion of zinc oxide.
Impeller, DT. Temperature of reaction, 90ºC. Impeller speed, 5.8 rev s-1.
Concentration of boric acid, 3:1 mole ratio. (b) Effect of mean initial
particle size of zinc oxide on particle size of zinc borate. Impeller, DT.
Impeller speed, 5.8 rev s-1. Temperature of reaction, 90ºC. Concentration
of boric acid, 3:1 mole ratio(Shete et.al.,2003).

46
3.11.4 Effect of temperature of reaction
The temperature range selected was 90 to 110°C. The impeller used was the DT at
N/Ns = 1. From Fig.3.18 (a), it is clear that with rise in temperature, the rate of reaction
increased sharply. Complete conversion was achieved after 3.5 h at 110°C while the
time needed for complete conversion at 90°C was 4.5 h. Figure 3.18(b) shows the effect
of temperature on the mean particle size of zinc borate. There was an approximately
linear decrease in particle size with increase in temperature.
Figure 3.18. (a) Effect of temperature of reaction on conversion of zinc oxide. Impeller, DT. Impeller speed, 5.8 rev s-1. Concentration of boric acid, 3:1 mole ratio. Initial particle size of zinc oxide particles, 20.3 µm. (b) Effect of temperature of reaction on mean particle size of zinc borate. Impeller, DT. Impeller speed, 5.8 rev s-1. Concentration of boric acid, 3:1 mole ratio. Initial particle size of zinc oxide particles, 20.3 µm(Shete et.al.,2003).

47
3.11.5 Effect of concentration of boric acid
Three different boric acid to zinc oxide mole ratios were used, viz 3:1, 4:1, and
5:1. The impeller used was the DT at N/Ns = 1.
Figure 3.19(a) shows the variation of conversion with increase in concentration.
When boric acid was added in an amount in excess of the stoichiometric quantity, there
were more borate ions available to react with zinc oxide particles. Therefore, conversion
of zinc oxide increased with increase in concentration of boric acid. Also, complete
conversion was achieved in a shorter time.
Figure 3.19(b) gives a plot of the mean particle size of zinc borate against the
concentration of boric acid. In this case, the reverse effect was observed for mean
particle size. The size of zinc borate particles increased with increase in quantity of
boric acid. This was because an additional quantity of boric acid forms a layer around
the zinc borate particles.

48
Figure 3.19 (a) Effect of concentration of boric acid on conversion of zinc oxide.
Impeller, DT. Impeller speed, 5.8 rev s-1. Temperature of reaction, 90ºC.
Initial particle size of zinc oxide particles, 20.3 µm. (b) Effect of
concentration of boric acid on men particle size of zinc borate. Impeller,
DT. Impeller speed, 5.8 rev s-1. Temperature of reaction, 90ºC. Initial
particle size of zinc oxide particles, 20.3 µm(Shete et.al.,2003).
49
3.11.6 Reaction kinetics
For the particular reaction of formation of zinc borate, the majority of the
experiments were conducted at the speeds having ratios of N/Ns greater than 1.
Pangarkar et.al. have presented an exhaustive discussion on the particle – liquid mass
transfer coefficient, kSL, in two/three-phase stirred tank reactors. They concluded that
for N/Ns > 1, kSL is practically constant. Thus the effect of mass transfer rate of this
particular reaction is negligible at N/Ns > 1.
The various kinetic expressions considered for fitting the experiments were:
1. Reaction between dissolved zinc oxide and boric acid. However, this
possibility is very remote due to the very low solubility of zinc oxide in
water.
2. First/second order surface reaction between boric acid and zinc oxide.
However, the data showed a very poor fit for the second order surface
reaction. The first order reaction kinetics on the other hand gave an
excellent fit of the data, indicating that this represents the intrinsic kinetics
of the surface reaction.
From Fig.3.20, it is seen that ln (rate of consumption of boric acid), ln r, is a linear
function of 1/T. the slope of this line yields an activation energy value of 6.1 x 10⁴ J
mol-1 and is sufficiently high to ensure that the process is kinetically controlled. Thus,
the controlling regime is likely to be the reaction between boric acid and zinc oxide on
the surface of zinc oxide particles.
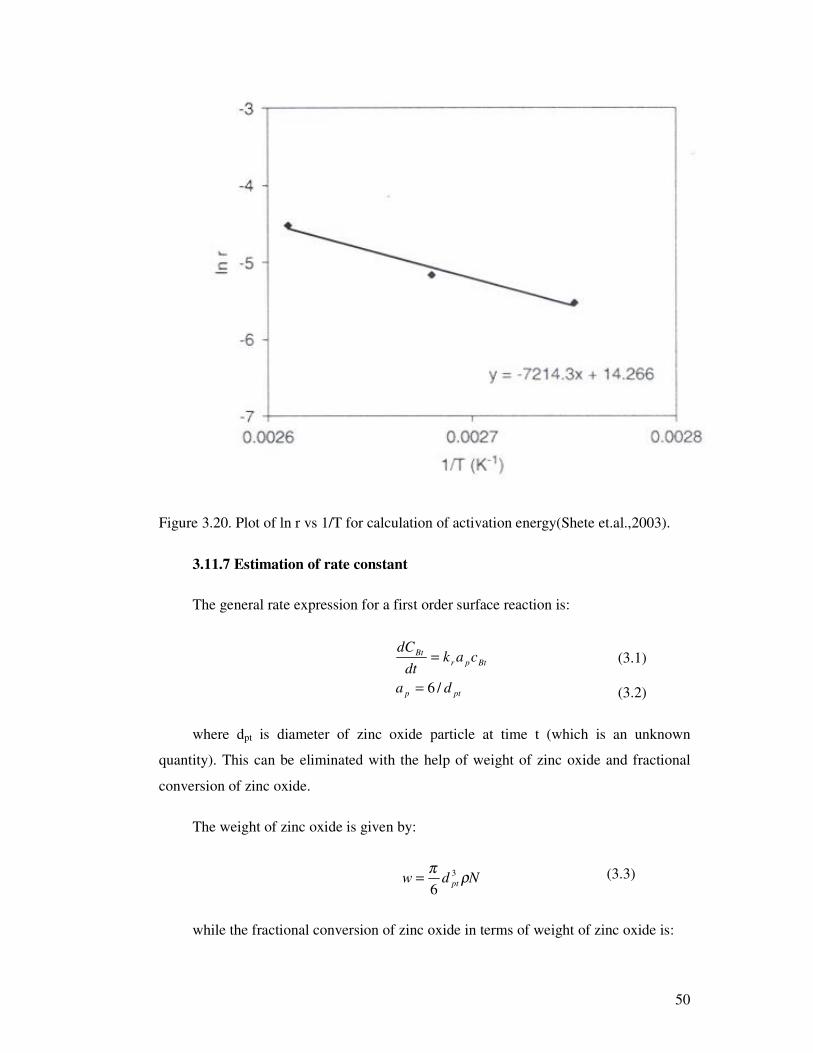
50
Figure 3.20. Plot of ln r vs 1/T for calculation of activation energy(Shete et.al.,2003).
3.11.7 Estimation of rate constant
The general rate expression for a first order surface reaction is:
ptp
BtprBt
da
cakdt
dC
/6=
=
where dpt is diameter of zinc oxide particle at time t (which is an unknown
quantity). This can be eliminated with the help of weight of zinc oxide and fractional
conversion of zinc oxide.
The weight of zinc oxide is given by:
Ndw pt ρπ 3
6=
while the fractional conversion of zinc oxide in terms of weight of zinc oxide is:
(3.1) (3.2)
(3.3)
51
( )in
tin
www
x
weightinitialreactedoxidezincofweight
x
−=
=
This can be written in terms of the diameter of the particle of zinc oxide:
( )3
33
pt
ptpin
d
ddx
−=
From eqn.4.6 the diameter of the particle of zinc oxide at time t is:
( )31 xdd inpt −=
Substituting this value of dpt, eqn.4.1 becomes:
( ) Bt
pt
rBtc c
xdk
dtdc
31
1
6
−=
CBt, the concentration of boric acid at time t, can be written as:
( )mv
wwcc tin
BBt
−−=
30
where m and v are molar mass and volume of the solution respectively. Also wt,
the remaining weight of zinc oxide at time t is:
( )xww int −= 1
Substituting wt in eqn.3.9 gives:
( )( )mv
wxwcc inin
BBt
−−−=
130
Therefore,
mvxw
cc inBBt
30 −=
(3.4) (3.5)
(3.6)
(3.7)
(3.8)
(3.9)
(3.10)
(3.11)
(3.12)
52
Substituting the value of cbt in eqn 3.7:
( )
−−= −
mvxw
cxd
kdt
dc inB
ptr
Bt 31
60
31
The above equation can be rearranged as:
)(' xfkdt
dcp
Bt =
where
( )
−−=
=
−
mvxw
cxxf
dptkk
inB
rr
31)(
6
03
1
'
In Eqn.3.14, the values of dcBt/dt and f(x) can be obtained from experimental data.
Therefore, dcBt/dt was plotted against f(x). The straight line plot obtained further
supported the assumption that the reaction is first order with respect to boric acid. The
slope of this line gives the value of kr’. As the initial particle size of zinc oxide was a
measure quantity, it was substituted in Eqn.3.15 and kr was calculated. According to the
first order surface reaction kinetic expression given by Eqn.3.1, the dimension of kr are
LT-1. The value of rate constant for the experiments using DT is 3.83 x 10⁻⁵ cm s-1.
The corresponding values of kr for the PTD and HF3 are 2.7 x 10⁻⁵ cm s-1 and 1.61
x 10-5 cm s-1 respectively. The difference in the values is most likely due to variation in
dpin, dpt and the the shape factor which vary with the type of the impeller. However, the
differences are less than an order of magnitude and are explainable on the basis of
different dpin, dpt and shape factors given above.
The effect of hydrodynamic and operating conditions was studied for the
formation of zinc borate in a batch stirred reactor. From the results, it was observed that
mixing parameters show an influence on the particle size of zinc borate. It was also
observed that the rate controlling step is a surface reaction between dissolved boric acid
and zinc oxide. To achieve rapid conversion and lower crystal size of the zinc borate, a
speed marginally higher than the minimum suspension speed of the impeller should be
(3.13)
(3.14)
(3.15) (3.16)

53
used. Also, higher temperatures and low mean initial particle size of zinc oxide
beneficial in obtaining a lower final product size.
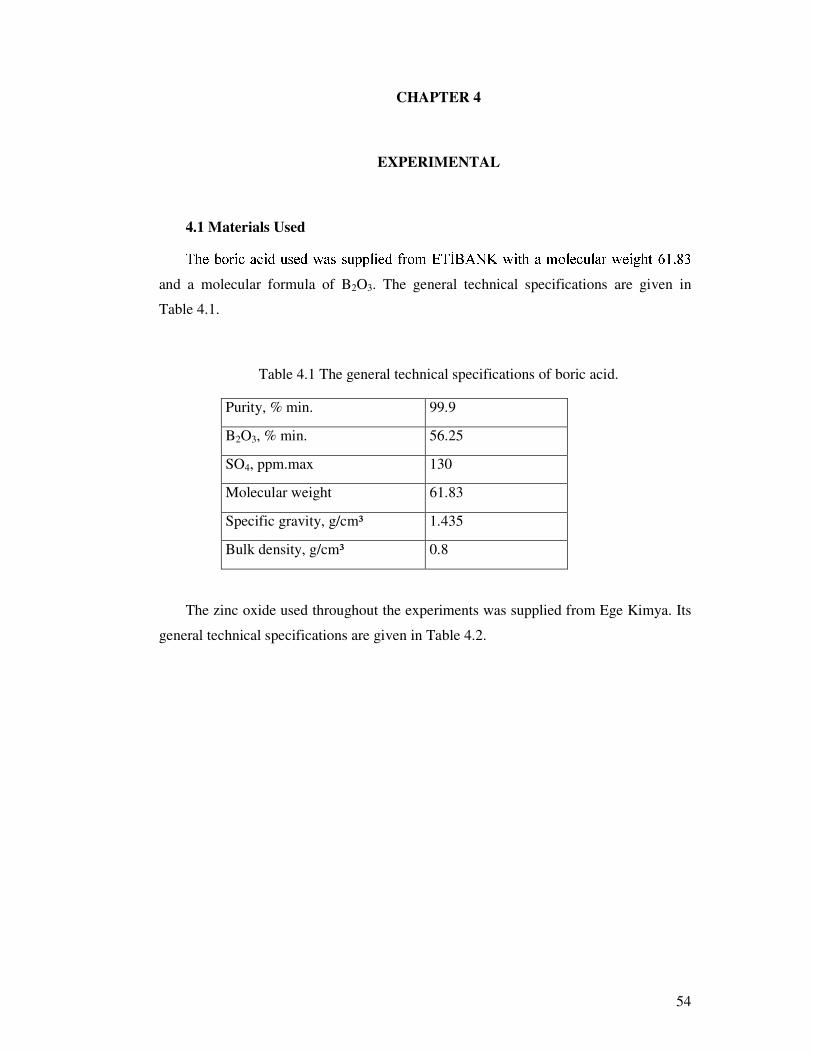
54
CHAPTER 4
EXPERIMENTAL
4.1 Materials Used ������������ ��� ���������������������� �!�#"������%$&��')(*�,+&-/.10324���657�8��'9��":�� ;�<":�;=������>��!5/?A@�BDCFE
and a molecular formula of B2O3. The general technical specifications are given in
Table 4.1.
Table 4.1 The general technical specifications of boric acid.
Purity, % min. 99.9
B2O3, % min. 56.25
SO4, ppm.max 130
Molecular weight 61.83
Specific gravity, g/cm³ 1.435
Bulk density, g/cm³ 0.8
The zinc oxide used throughout the experiments was supplied from Ege Kimya. Its
general technical specifications are given in Table 4.2.

55
Table 4.2 The general technical specifications of zinc oxide.
Appearance White, powder
Zinc oxide % min. 99
Loss on ignition at 105°C % max 0.1
Loss on calcination, % max. 0.2
Sieve residue on 325 mesh, % max. 0.05
Insoluble matter in acetic acid, % max. 0.05
Water soluble salts, % max. 0.05
Density, g/cm³ ± 0,1 5.56
Appearent density, g/lt 500 – 600
Commercial zinc borates called ZB-2335 and Chinese zinc borate were used in the
experiments.
The general technical specifications of the commercial two zinc borates are
tabulated in Tables 4.3 and 4.4.
Table 4.3 Commercial zinc borate ZB-2335.
Appearance White amorphous powder
Volatile loss at 1h, 105°C, % max. 1.5
Bulk density, g/cm³ 0.3 - 0.5
pH 7.0 –8.0
Sieve residue on 200 mesh, % max. 0.2
Ignition loss at 950°C, % max. 15.5
ZnO content, % min. 37
B2O3 content, % min. 47
Water of crystallization, % max. 16

56
Table 4.4 Commercial Chinese zinc borate.
Appearance White powder
ZnO content, % min 37.5
B2O3 content, % min. 48
Ignition loss at 450°C, % max. 14.5
Free water at 105°C, % max. 1.0
Sieve residue on 325 mesh, % max. 1.0
4.2 Methods
4.2.1. Production of ZB
The synthesis of 2ZnO·3B2O3·3.5H2O by following the US Patent by Igarashi
(2001) was done. The amounts of the raw materials used in the experiments and their
reaction conditions are reported in Table 4.5. Experiment No.1 and No.2 were carried in
glass beaker seen Figure 4.1(a) and a glass flask under reflux was used for experiment
3. These exp G;HJI:KLG;M!NPO�QRG;H�GTS�UVHWH�I:G�X�YZN[UVN#\AI�]FKLG;M!N�^�U;M UV_�I `9acbda�e7UVf�YHgU;NhYHJI7G�Oia�j,G�K�k�GVH�UVN7Z!H�Gcontrol was done manually. In open beaker long heating times at 90ºC caused
evaporation of water, thus a reflux condenser is attached to a glass flask for the third
experiment.
For good temperature and agitation control thermostated shaking bath at Izmir
Institute of Technology laboratories was used. An Erlenmeyer flask was used as the
reactor. Experiment 4 and 5 were done in this system. Samples were taken at the end of
90 minute heating at 60ºC for experiment 4 and 5. They are called as experiment 4a and
5b.
The experiments were carried out by first dissolving the required amount of boric
acid in a separate beaker in pure water. Since the solubility of boric acid at room
temperature (20°C) is 5.04%, the solubility was achieved by heating the mixture to
60°C. After boric acid was completely dissolved in water, part of the solution was fed to
the reactor.

57
Then zinc oxide and remaining portion of boric acid was added so that the molar
ratio of B2O3 to ZnO is 2. This mixture was stirred for 90 minutes at this temperature.
The same solution was further stirred and reacted at 90°C for 4 hours.
The upper limit for reaction temperature is boiling point of water (100°C) under
atmospheric pressure. In the first three experiments, the agitation was achieved by using
a magnetic lab stirrer (Velp Scientifica) having a speed around 200 to 250 rpm whereas
in experiments 4 and 5 the mixing was achieved by shaking the flasks in a water bath at
a rate of 170 rpm. Temperature control was monitored by water bath which is shown in
Figure 4.2.
In experiment 3 different than experiments 1 and 2, seed crystals and reflux has
been used as seen in Figure 4.2(a) and the experimental setup for the first two
experiments is shown in Figure 4.2(b).

58
(a)
(b)
Figure 4.1 (a) The experimental setup for the first two experiments, (b) The
experimental setup for the third experiment.

59
(a)
(b)
Fig.4.2 The water bath system (a) Exterior view, (b) Interior view.
In experiments 4 and 5, the flasks were sealed to achieve reflux effect. The only
difference between two experiments is that experiment 4 has seed crystal where
experiment 5 does not. The seed crystal was used to be able to observe its effect on the
ZB yield.

60
The obtained product was filtered, washed with water and was then dried at 105°C
in an oven to obtain zinc borate.
Two of the experiments contained seed crystals. The amounts of seed crystals,
boric acid and zinc oxide are summarized in Table 4.5 for each experiment.
Minimum suspension speed depends on type of impeller. It was 4.92, 5.8 and 10
rev s-1 for six bladed, impeller – disc testing and three bladed impellers (Shete et.al.,
2003). The rpm used in this thesis is 350 and 170 rpm corresponding to 5.8 rev/min and
2.8 rev/min close to minimum suspension speed of different types of impellers. While a
magnetic stirrer was used at 350 rpm, an orbital shaking movement was done at 170
rpm.
The experimental conditions are given in Table 4.5.
Table 4.5 Conditions of experimental runs.
Time, min
T, ºC H2O,g
H3BO3,g 56% B2O3
ZnO,g ZB seed crystal,
g
Reflux Reactor type
Reactor rpm
Experiment No.1 90 240
60 90 1000
290
96 _
_
1
350
Experiment No.2 90 240
60 90 1000 144,7 48 _ _ 1
350 Experiment No.3 90
240 60 90
500
145
47.85
0.625 + 1
350 Experiment No.4-a
90 60 100
29
9.6
0.125
+
2
170
Experiment No.4-b
90 240
60 90
100
29
9.6
0.125
+
2
170
Experiment No.5-a
90 60 100
29
9.6
_
+
2
170
Experiment No.5-b
90 240
60 90
100
29
9.6
_
+
2
170
Experiment No.6 90 60 500 21 6.97 - - 1 630

61
4.3 Characterization
The physico-chemical properties of each sample were characterized by X-Ray
diffraction, Fourier Transform Infrared Spectroscopy (FTIR), Scanning Electron
Microscopy (SEM), Energy Dispersive X-ray (EDX) analysis and thermal gravimetric
analysis (TGA).
X-Ray Diffraction: All of the samples were characterized by X-Ray diffractometer
(Philips Xpert-Pro) to analyse the crystal structures of the ZB with CuKα radiation at 45
kV and 40 mA. The registrations were performed in the 5-60° 2θ range. FTIR
Spectroscopy: To determine which functional groups are present in the samples, FT –
IR instrument (the FT-IR 8601 by Shimadzou) was used. In the preparation of ZnSt2
samples KBr disc method wad used. 4.0 mg of ZB weighed and 196 mg of KBr was
added to it and mixed together. A pellet was obtained by pressing the powder under 8
tons of pressure. Scanning Electron Microscopy: Microstructural characterization of the
samples was done by X-Ray energy spectrometer (the XL-305 FEG SEM instrument by
Philips) for identification of particle size and product purity. Energy Dispersive X-ray
(EDX): The samples were characterized by an Energy Dispersive X-ray (EDX)
instrument (the XL-305 FEG SEM instrument by Philips) to investigate the elemental
analyses of the samples. Thermal Gravimetric Analyses (TGA): Thermogravimetric
analyses TGA utilized (Schimadzu TGA-51), ZB samples (10-15 mg) were loaded into
an aluminum pan and heated from 30°C to 600°C at 10°C min-1 under N2 flow (40
ml.min-1). pH Measurement: pH of the experiments were measured by Methrohm pH-
meter at different time periods at 25ºC.

62
CHAPTER 5
RESULTS AND DISCUSSION
5.1 Characterization of Commercial Zinc Borate and Raw Materials
The Fourier Transform Infrared spectra of commercial ZB and raw materials are
given between Figures 5.1 and 5.4.
500.01000.01500.02000.03000.04000.01/cm
0.25
0.5
0.75
1.0
1.25
1.5
1.75
Abs
Fig.5.1 FTIR spectrum of ZB-2335.
The main characteristic peak of ZnO � �2O3 at 3227 cm-1 is clearly seen in Figures
5.1 and 5.2. Both ZB samples had the same IR spectrum. Their peak values are
tabulated in Table 5.1.

63
Table 5.1 The observed peaks of commercial ZB samples.
ZB 2335 Chinese ZB
Wavenumber Absorbance Wavenumber Absorbance
3460 0.94 3460 0.7
3210 1.1 3217 0.75
2510 0.37 2510 0.425
1415 1.45 1420 1.04
1300 1.58 1340 1.0
1255 1.05 1290 1.05
1195 1.0 1195 0.85
1120 1.35 1120 1.05
1070 1.35 1065 1.04
975 1.68 927 1.18
860 1.1 860 1.0
800 0.85 800 0.88
750 1.12 750 1.0
575 0.6 575 0.69
550 0.62 550 0.72
525 0.7 525 0.77
ZnO had a characteristic peak between 400 and 500 cm-1 as clearly observed in
Fig.5.3.
In IR spectrum of boric acid which is seen in Fig.5.4. The following bands were
observed at 3400, 1400, 1200 and 590 cm-1.
TGA curve of ZB samples indicated they start to dehydrate at 350ºC. They lost 8
and 6% of their mass at 600ºC for ZB 2335 and Chinese ZB, respectively.
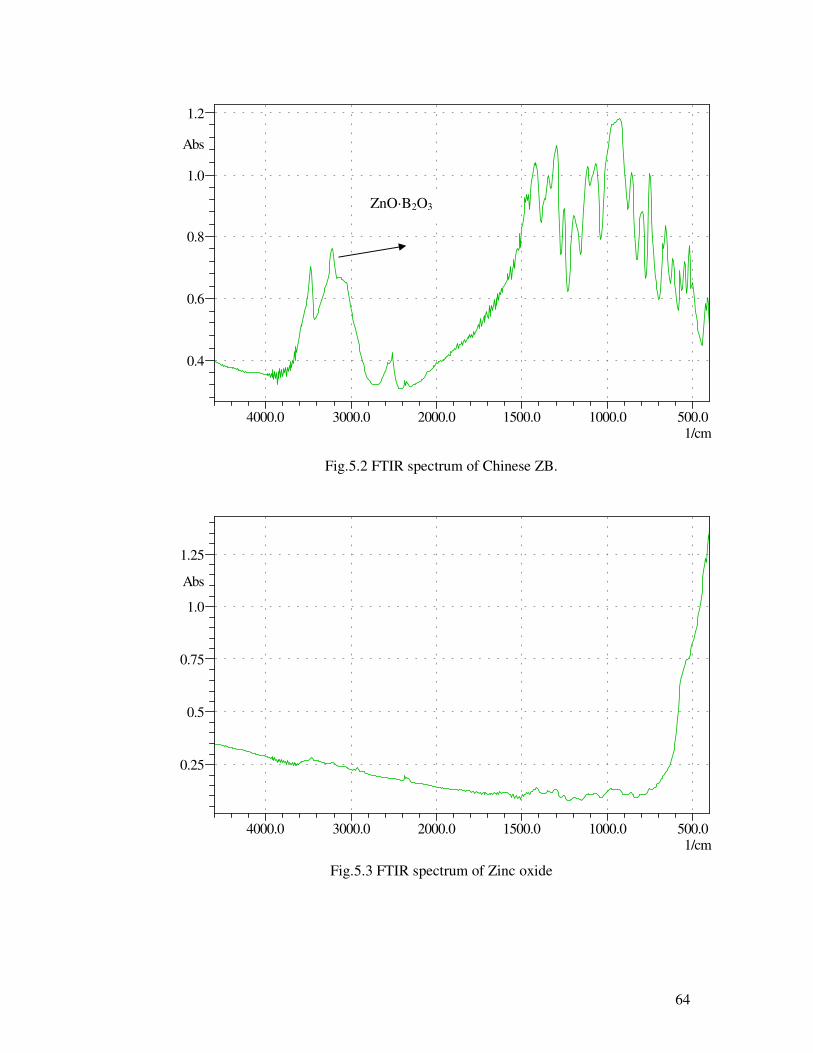
64
500.01000.01500.02000.03000.04000.01/cm
0.4
0.6
0.8
1.0
1.2
Abs
Fig.5.2 FTIR spectrum of Chinese ZB.
500.01000.01500.02000.03000.04000.01/cm
0.25
0.5
0.75
1.0
1.25
Abs
Fig.5.3 FTIR spectrum of Zinc oxide
ZnO·B2O3

65
500.01000.01500.02000.03000.04000.01/cm
0.45
0.5
0.55
0.6
0.65
0.7
Abs
Fig.5.4 FTIR spectrum of boric acid
The thermogravimetrical analyses of the commercial ZB are also given in figure in
Fig.5.5.
��� ���
��� �
�� ���
�� ���
��� ���
� ��� ���
� ��� ���
� � ��� ����� ����� ����� ����� ���������
! "## $%&
Fig.5.5 TGA curve of commercial ZB. (1:ZB-2335, 2:Chinese ZB).
1
2
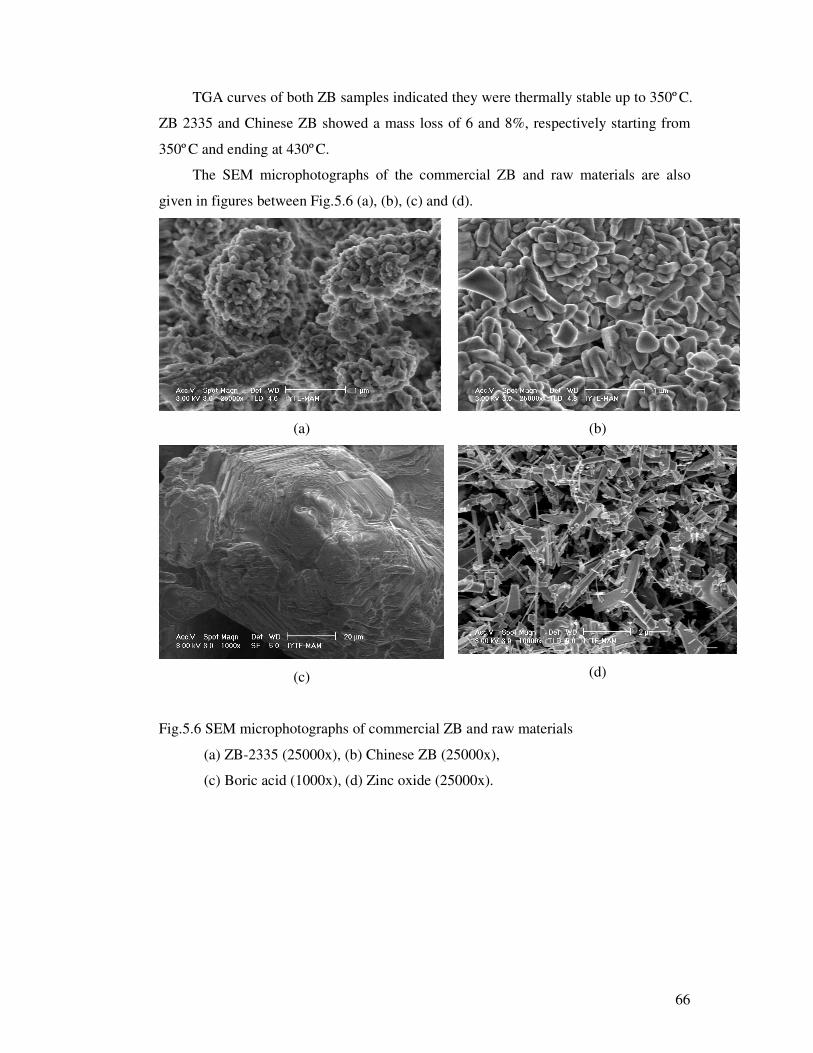
66
TGA curves of both ZB samples indicated they were thermally stable up to 350ºC.
ZB 2335 and Chinese ZB showed a mass loss of 6 and 8%, respectively starting from
350ºC and ending at 430ºC.
The SEM microphotographs of the commercial ZB and raw materials are also
given in figures between Fig.5.6 (a), (b), (c) and (d).
(a)
(b)
(c)
(d)
Fig.5.6 SEM microphotographs of commercial ZB and raw materials
(a) ZB-2335 (25000x), (b) Chinese ZB (25000x),
(c) Boric acid (1000x), (d) Zinc oxide (25000x).
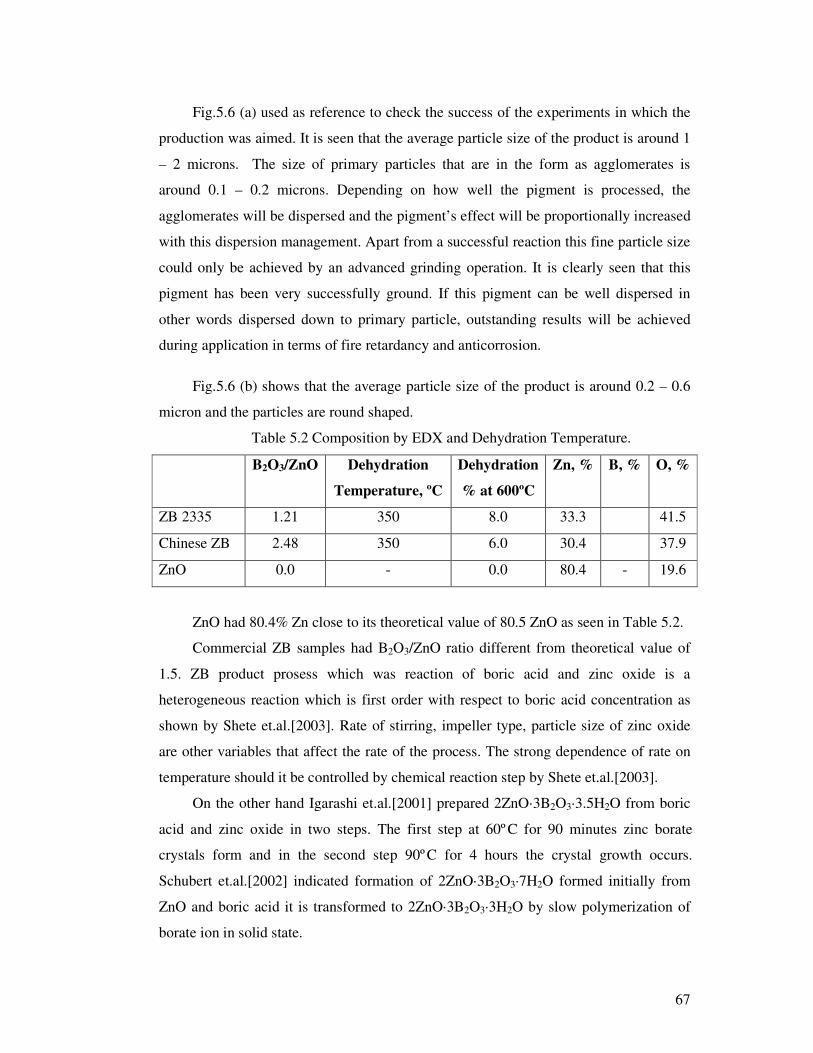
67
Fig.5.6 (a) used as reference to check the success of the experiments in which the
production was aimed. It is seen that the average particle size of the product is around 1
– 2 microns. The size of primary particles that are in the form as agglomerates is
around 0.1 – 0.2 microns. Depending on how well the pigment is processed, the
agglomerates will be dispersed and the pigment’s effect will be proportionally increased
with this dispersion management. Apart from a successful reaction this fine particle size
could only be achieved by an advanced grinding operation. It is clearly seen that this
pigment has been very successfully ground. If this pigment can be well dispersed in
other words dispersed down to primary particle, outstanding results will be achieved
during application in terms of fire retardancy and anticorrosion.
Fig.5.6 (b) shows that the average particle size of the product is around 0.2 – 0.6
micron and the particles are round shaped.
Table 5.2 Composition by EDX and Dehydration Temperature.
B2O3/ZnO Dehydration
Temperature, ºC
Dehydration
% at 600ºC
Zn, % B, % O, %
ZB 2335 1.21 350 8.0 33.3 41.5
Chinese ZB 2.48 350 6.0 30.4 37.9
ZnO 0.0 - 0.0 80.4 - 19.6
ZnO had 80.4% Zn close to its theoretical value of 80.5 ZnO as seen in Table 5.2.
Commercial ZB samples had B2O3/ZnO ratio different from theoretical value of
1.5. ZB product prosess which was reaction of boric acid and zinc oxide is a
heterogeneous reaction which is first order with respect to boric acid concentration as
shown by Shete et.al.[2003]. Rate of stirring, impeller type, particle size of zinc oxide
are other variables that affect the rate of the process. The strong dependence of rate on
temperature should it be controlled by chemical reaction step by Shete et.al.[2003].
On the other hand Igarashi et.al.[2001] prepared 2ZnO·3B2O3·3.5H2O from boric
acid and zinc oxide in two steps. The first step at 60ºC for 90 minutes zinc borate
crystals form and in the second step 90ºC for 4 hours the crystal growth occurs.
Schubert et.al.[2002] indicated formation of 2ZnO·3B2O3·7H2O formed initially from
ZnO and boric acid it is transformed to 2ZnO·3B2O3·3H2O by slow polymerization of
borate ion in solid state.

68
Fig.5.7 The X-ray diagram of the raw materials and reference materials (ZB 223 and ZB stands for another commercial ZB).

69
In Fig.5.7, X-ray diffraction diagram of boric acid, ZnO and three commercial ZB
samples are seen. The X-ray diagram of boric acid and ZnO confirmed they were pure
boric acid and ZnO.
5.1.1 The Viscosity and pH Change During ZB Production
The specific gravity of ZnO and 2ZnO·3B2O3·3H2O are 5.3 and 2.77 g/cm3
respectively. In patent by Igarashi et.al.[2001] one liter water contained 240 gr.boric
acid and 96 gr.ZnO while boric acid present in dissolved form ZnO is a solid. The
B2O3/ZnO ratio was 2.0 but in the product B2O3/ZnO was 1.5.
The mass of the solid fraction increases from 96 gr.to 313.5g.causing the viscosity
of the mixture to increase. In the present study in applying Igarashi et.al.’s patent had
difficulties of mixing the product and water loss by evaporation at long heating periods.
The viscosity of suspension,
( )φηη Es k+= 1
where η is viscosity of suspension, ηs is the viscosity of the solvent, kE is 2.5 for
spherical particles and φ volume fraction of dispersed solid phase.
116.01000117
116314
7.2
017.01000
3.17
3.1796
56.5
7.2
56.5
3
3
==
=→=
==
=→=
==
ZnO
ZnOZnO
ZnO
ZnOZnO
ZB
ZnO
cmVV
cmVV
φ
φ
ρρ
24.104.129.1
29.1116.05.21
04.1017.05.21
=
=+=
=+=
x
x
ZBs
ZnOs
ηη
ηη
The relative viscosity will increase to at least 1.24 times thus a mechanical mixer
which will stir the mixture even when the viscosity is high should be used.
An additional experiment was performed (as experiment 6) to follow the pH change
during reaction at 60ºC. The pH of boric acid solution in the beginning is 4.3. The pH of
(5.1)

70
boric acid solution and pH of the mixture after ZnO was added was measured at
different time periods by using Methrom pH-meter with a glass electrode. The results
are tabulated in Table 5.3.
Table 5.3 pH change of experiment 6 at 60ºC.
Time, s 0 10 30 60 120 180 240 360 420
pH 4.30 5.33 5.63 5.68 5.70 5.72 5.72 5.72 5.72
Since an excess of boric acid was used in the patent of Igarashi, the solution pH is
expected to be acidic. In the experimental run to follow pH change during reaction it
was found that pH of boric acid solution was 4.3 and there was a step change to 5.33 in
10 sec., after ZnO was added as seen in Table 5.3. pH was stabilized at 5.72 after 180 s.
Thus, during preparation of ZB, pH was lower than pH of 7 and reaction medium was
acidic as expected.
This experiment shows that the formation of ZB occurs instantly after the addition
of ZnO to boric acid as there was a step change to pH 5.33 in 10 sec. However the
formed product is not the desired crystal modification of ZB. It is probably a form
which contains 10 hydrate water. By looking at figures of FTIR, X-ray, TGA and SEM
it is obvious that the desired form of ZB is not formed at 60ºC for 90 min. The further
mixing of ZnO and boric acid at 90ºC for 4 hours under reflux, results in a ZB
formation which has the desired chemical formula thus the desired dehydration
temperature.

71
5.2 Characterization of Synthesized Zinc Borate
5.2.1 Thermogravimetric Analyses
To have an idea about the thermal behaviour of the ZB samples, TGA instrument
used to carry out the investigations which is a good way in studying dehydration of
water in the zinc borate.
TGA curves of Experiments 1, 2 and 3 are given in Figure 5.8. In Experiment
No.1 ZB starts to lose its crystal water at 109ºC and then at 145ºC and finally at 225ºC
with a total mass loss of 20.63% and in Experiment No.2, ZB starts to lose its crystal
water beginning from 133ºC and 186ºC with a total mass loss of 6.51% and in
Experiment No.3 ZB starts to give its hydration water first at 355ºC and then it goes on
until at 445ºC with a total mass loss of 9.65% which is a desired result for a ZB which
can be used commercially as a flame retardant pigment.
'�( '�'
)�* +�+
,�- .�.
/�0 1�1
243 5�5
6 7�8 7�7
6 9�8 7�7
7 6 7�7 9�7�7 :�;�; <�;�; =�>�> ?�>�>@BA�C
D EFF GHI
Fig.5.8 TGA curve of Experiment No.1, No.2 and No.3
TGA curves of Experiment Nos.4 and 5 at 60ºC and 1.5h are given in Figure 5.9.
In Experiment No.4 at 60ºC, 1.5h ZB starts to lose its hydration water at 130ºC until
403ºC with a mass loss of 19.05% and in Experiment No.5 at 60ºC, 1.5h ZB starts at
131ºC until 403ºC with a mass loss of 25%. When these two samples are compared it is
observed that the one with seed crystals have a less mass loss which shows less
degradation of the compound which can be said to be a better flame retardant.
2
1
3

72
J
K
L
M
N
O J
O K
J O J�J K�J�J P�J�J L�J�J Q�J�J M�J�JRBS�T
U VWW XYZ
Fig.5.9 TGA curves 1:Experiment No.4 at 60ºC, 1.5h, 2:Experiment No.5 at 60ºC, 1.5h.
[�\ [�[
]�\ [�[
^�\ [�[
_�\ [�[
`�\ [�[
a [�\ [�[
a ]�\ [�[
[ a [�[ ]�[�[ b�[�[ ^�[�[ c�[�[ _�[�[d�\�e
f ghh ijk
Fig.5.10 The effect of seed crystal on product formed at 90ºC, 4h. 1:Experiment No.4
(with seed crystal), 2:Experiment No.5 without seed crystal (without seed
crystal. They were heated at 60ºC for 90 minutes initially).
In Figure 5.10, the TGA curves of the Experiment Nos.4 and 5 at 90ºC, 4h. are
shown. In Experiments 4 and 5, ZB starts to lose its crystal water at 340ºC at both
2
1
2
1

73
experiments until 439ºC and 426ºC with total mass losses of 9.72% and 11.38%,
respectively. Again Experiment No.4 gave a less mass loss which is an advantage.
Dehydration results and molar results according to the experiments carried out
were tabulated in Table 5.4.
Table 5.4 Dehydration results of the experiments
H2O loss at 600 °C %
Dehydration Temperature, °C
B2O3/ZnO (Molar ratio)
Experiment No.1 24 110 and 130
1.74 Experiment No.2 8.1 130 0.085 Experiment No.3 10 350 1.27
Experiment No.4-a 21
140
1.49
Experiment No.4-b 10
350
1.40
Experiment No.5-a 27.25 100 and 140
1.78
Experiment No.5-b 12
340
1.68
If 2ZnO·3B2O3·3.5H2O were obtained, mass loss should be 14.9%. Experiment
No.5 which has a closer mass loss (12%) contained a product closer to
2ZnO·3B2O3·3.5H2O than experiment No.4b.
5.2.2 Scanning Electron Microphotographs
Experiment No.1. When compared with the SEM photographs of commercial ZB
and raw materials it is seen that the product formed has not completed the formation of
ZB. The shapes of the particles are not rounded like the commercial products that are
taken as reference. The angular shape and needle like shape of the particles prove that
the product obtained is not ZB but a composition that is richer in ZnO and boric acid.
The TGA, EDX and FTIR analyses also support this idea. The average particle size is
around 5 -7 micron like ZnO’s. SEM microphotograph of this experiment is shown in
Figure 5.11.
Experiment No.2. Again comparing the photo of this experiment with
commercial ZB and raw materials it is seen that the desired reaction between ZnO and
H3BO3 could not be achieved. ZnO and H3BO3 particles are clearly seen as unreacted.
Thus according to the EDX result the B2O3/ZnO ratio is found as 0.085 as seen in Table
5.5 which shows that the product obtained is rich in ZnO. The average particle size of

74
this product is like that of ZnO’s which is around 5 – 7 microns. SEM microphotograph
of this experiment is shown in Figure 5.12.
Experiment No.3. The obtained product has an average particle size around 0.2 –
1 micron as seen in Figure 5.13 which is approximately the same as two commercial
products studied as a reference. The round shapes of the particles prove that the
experiment has been successful and ZB is obtained.
Here the agglomerated particles are to be dispersed when the pigment is being
processed in the equipment chosen according to the application.
The shape of the particles looks neither like ZnO nor like H3BO3. It is clearly seen
that the reaction between ZnO and H3BO3 has taken place and desired product was
successfully obtained.
Experiment Nos.4 and 5. When SEM microphotographs of these two
experiments are compared it was clearly seen that the similar morphology was obtained
and this morphology is similar to those which are used as reference products. An
additional note about experiment 4 which contains ZB-2335 as seed crystal is that
morphologywise it is more like the reference product ZB-2335. Finer particles and
agglomerates as bigger groups while experiment 5 has also fine particles but
agglomerated in smaller groups. They are figure in Fig.5.14.

75
Fig.5.11 SEM microphotographs of Experiment No.1 (5000x).
Fig.5.12 SEM microphotographs of Experiment No.2 (15000x).
Fig.5.13 SEM microphotographs of Experiment No.3 (25000x).

76
(a)
(b)
(c)
(d)
Fig.5.14 (a) SEM microphotographs of Experiment No.4 at 60C, 90min. (8000x) (b)
SEM microphotographs of Experiment No.5 at 60C,90 min.(10000x), (c) SEM
microphotographs of Experiment No.4 at 90C, 1.5h (8000x), (d) SEM
microphotographs of Experiment No.5 at 90C, 1.5h (15000x).

77
5.2.3 FTIR Spectra
The observed peaks of FTIR spectra of the experiments are tabulated in Table 5.5.
The main peak of ZnO l m 2O3 at around 3227 cm-1 is clearly seen in Fig.5.17, Fig.5.20
and Fig.5.21. The peaks between 900 and 1300 are all visible in these figures which
were reported to be other characteristic peaks of zinc borate and they are also observed
in reference ZB’s FTIR spectra (Xie et.al., 2001). When these values are compared with
the values in Table 3.11 of MgB6O10·7H2O by a study of Yongzhong et.al.[1999], it is
clear that the same peaks at 1423, 1351 (belonging to B(3)-O) are observed around 1360
cm-1; the peaks at 1098, 1026 (belonging to B(4)-O) are observed around 1067 cm-1; the
peaks at 957, 898 (belonging to B(3)-O) are observed at around 992 and 898 cm-1; 863,
812 (belonging to B(4)-O) are observed are around 838 cm-1.
The characteristic peaks of tetrahedral (BO4) and trihedral (BO3) borate groups are
clearly seen between 1100 and 800 cm-1 and between 1450 and 1200 cm-1, respectively
between Figures 5.17, 5.20 and 5.21 just like reference’s FTIR spectra. The
characteristic peak of trihedral borate groups are also obvious at peaks below 800 cm-1
in these figures as well. These peaks are much clearer in the experiments where reflux is
used and the material is heated for 4h under 90ºC.
In Fig.5.15, 5.16, 5.18 and 5.19 the characteristic peak of ZnO l m 2O3 at 3227 cm-1
is not observed but the peak of isolated OH between 3350 cm-1 and 3500 cm-1 is
observed. This peak is also observed in FTIR spectra of reference commercial products.
This means that the formation of ZB has not fully been achieved in these experiments.
The formation of ZB crystals requires heating under reflux at 90ºC for 4h.
For experiments 1 and 2, the formation of ZB crystals could not be achieved due
to the lack of reflux which is seen in Fig.5.15 and 5.16. The experiments 4 and 5 were
carried out in two steps with proper mixing. The FTIR spectra of first stages showed
that mixing the material at 60ºC for 90 minutes does not lead to production of desired
zinc borate crystals. Thus, comparison of the FTIR spectra of these experiments
(Fig.5.18 and 5.19) with the reference ZBs are proof of this statement.
The peak seen in Fig.5.15, 5.16, 5.18 and 5.19 at 1600 cm-1 which is the
characteristic peak of water, is not observed in the other figures which belong to the
experiments where ZB formation completely achieved. This peak is also not observed in
FTIR spectra of commercial ZBs used as reference.
The peak at 2500 cm-1 is significant in Fig.5.17, 5.20 and 5.21, and the reference
ZBs.
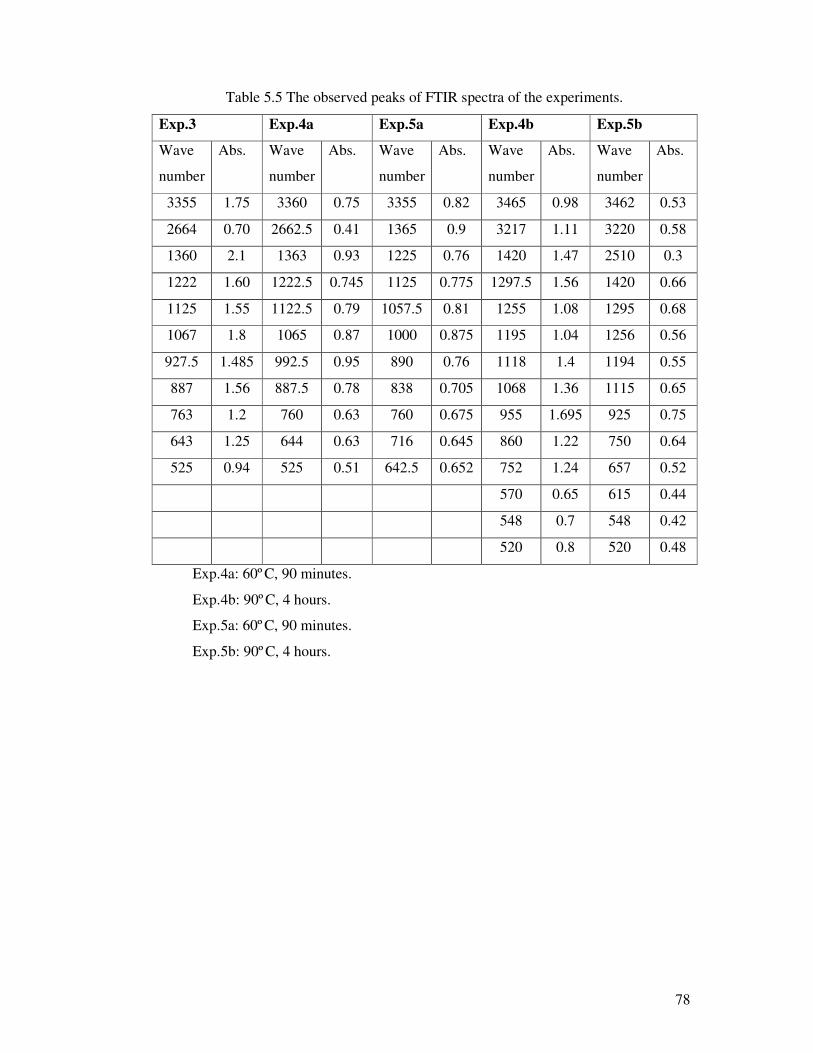
78
Table 5.5 The observed peaks of FTIR spectra of the experiments.
Exp.3 Exp.4a Exp.5a Exp.4b Exp.5b
Wave
number
Abs. Wave
number
Abs. Wave
number
Abs. Wave
number
Abs. Wave
number
Abs.
3355 1.75 3360 0.75 3355 0.82 3465 0.98 3462 0.53
2664 0.70 2662.5 0.41 1365 0.9 3217 1.11 3220 0.58
1360 2.1 1363 0.93 1225 0.76 1420 1.47 2510 0.3
1222 1.60 1222.5 0.745 1125 0.775 1297.5 1.56 1420 0.66
1125 1.55 1122.5 0.79 1057.5 0.81 1255 1.08 1295 0.68
1067 1.8 1065 0.87 1000 0.875 1195 1.04 1256 0.56
927.5 1.485 992.5 0.95 890 0.76 1118 1.4 1194 0.55
887 1.56 887.5 0.78 838 0.705 1068 1.36 1115 0.65
763 1.2 760 0.63 760 0.675 955 1.695 925 0.75
643 1.25 644 0.63 716 0.645 860 1.22 750 0.64
525 0.94 525 0.51 642.5 0.652 752 1.24 657 0.52
570 0.65 615 0.44
548 0.7 548 0.42
520 0.8 520 0.48
Exp.4a: 60ºC, 90 minutes.
Exp.4b: 90ºC, 4 hours.
Exp.5a: 60ºC, 90 minutes.
Exp.5b: 90ºC, 4 hours.

79
500.01000.01500.02000.03000.04000.01/cm
0.5
1.0
1.5
2.0
Abs
Fig.5.15 FTIR spectrum of Experiment no.1
500.01000.01500.02000.03000.04000.01/cm
0.25
0.5
0.75
1.0
1.25
Abs
Fig.5.16 FTIR spectrum of the Experiment No.2.
In Fig.5.15, unreacted ZnO was present as understood from the IR peak at 400
cm-1 characteristic of ZnO spectrum in Fig.5.3.

80
500.01000.01500.02000.03000.04000.01/cm
0.5
1.0
1.5
2.0
Abs
Fig.5.17 FTIR spectrum of the Experiment No.3
500.01000.01500.02000.03000.04000.01/cm
0.4
0.6
0.8
Abs
Fig.5.18 FTIR spectrum of the Experiment No.4 at 60ºC, 90min.
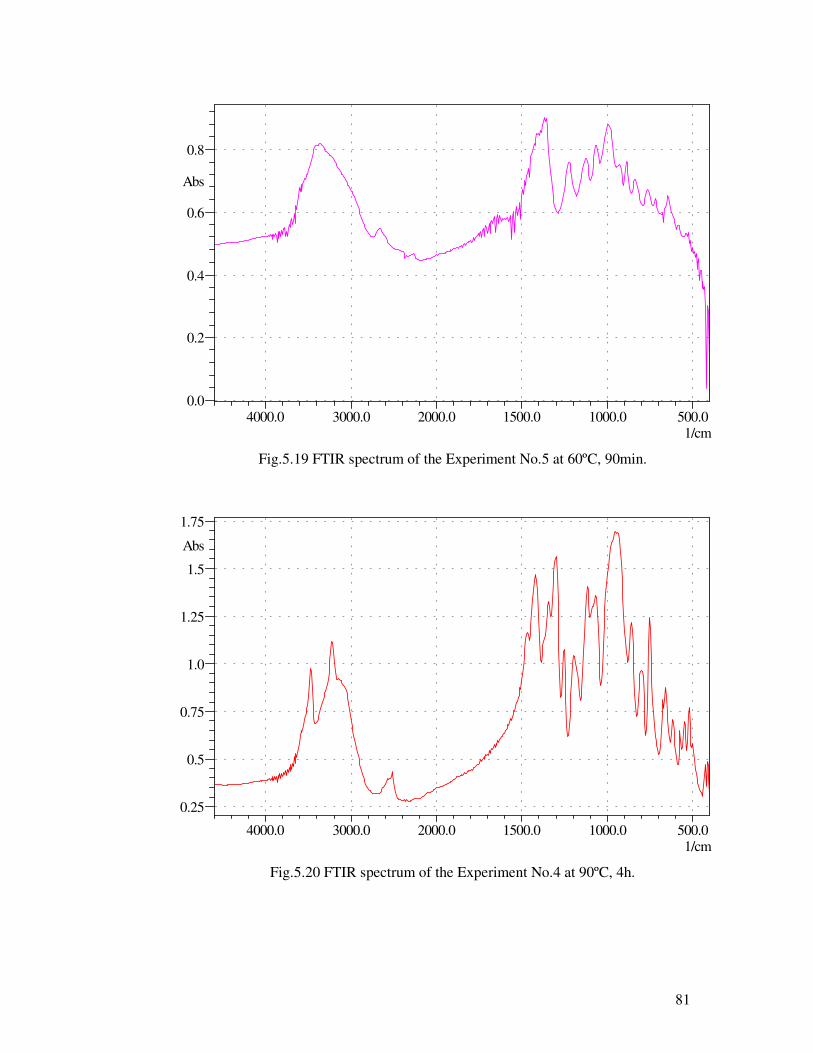
81
500.01000.01500.02000.03000.04000.01/cm
0.0
0.2
0.4
0.6
0.8
Abs
Fig.5.19 FTIR spectrum of the Experiment No.5 at 60ºC, 90min.
500.01000.01500.02000.03000.04000.01/cm
0.25
0.5
0.75
1.0
1.25
1.5
1.75
Abs
Fig.5.20 FTIR spectrum of the Experiment No.4 at 90ºC, 4h.
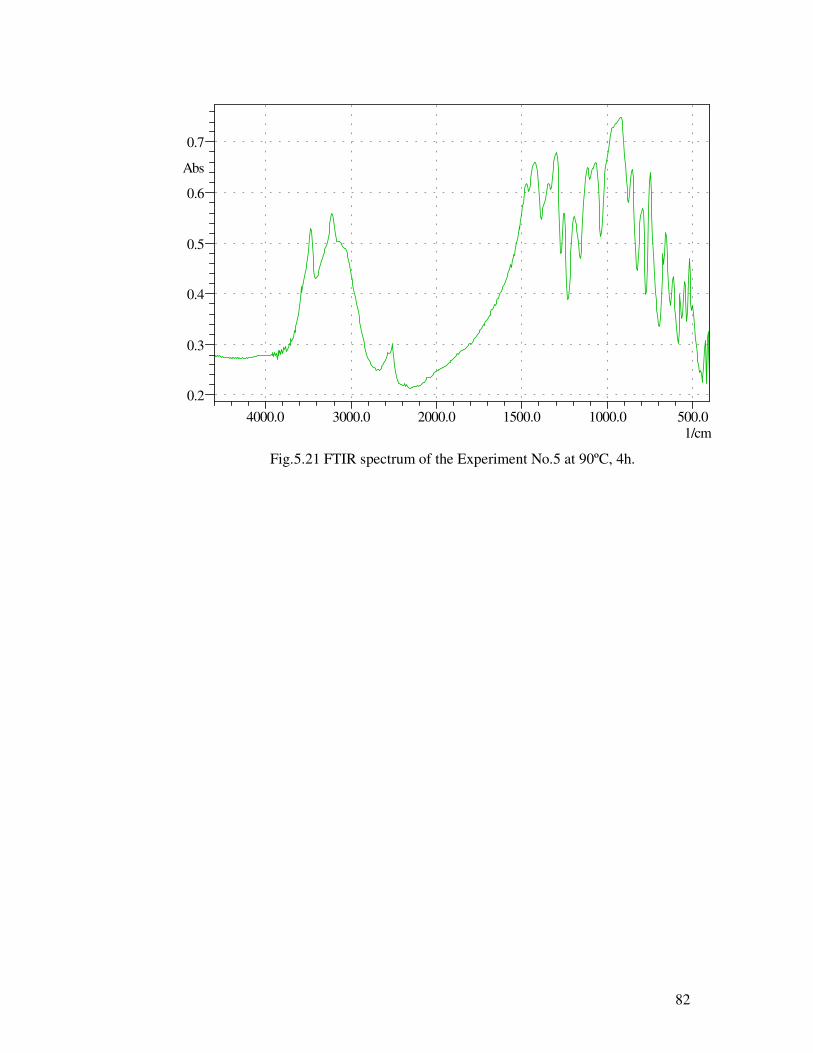
82
500.01000.01500.02000.03000.04000.01/cm
0.2
0.3
0.4
0.5
0.6
0.7
Abs
Fig.5.21 FTIR spectrum of the Experiment No.5 at 90ºC, 4h.

83
5.2.4 X-Ray Diffraction Analysis
X-ray diffraction diagram of the products of this project were compared with X-
ray diffraction diagram of 2ZnO·3B2O3·3.5H2O reported by Igarashi et.al.[2001] as seen
in Figures 5.22 – 5.26. In none of ZB products of Igarashi et.al.had any diffraction peak
at 2θ values lower than 17º. On the other hand for experiments 1, 2, 4a and 5a there are
strong diffraction peaks at 2θ value of 8º.
From Bragg equation,
nλ = 2dSinθ
where n is order of diffraction, λ is wavelength of incident X-rays. 1.546Aº for
CuKα radiation used in the experiments, θ is diffraction angle and d is the interplanar
distance.
( )oAd
xdxSinx
08.11
2/82546.11
==
this corresponds to a d value of 11.08 Aº for experiments 4b and 5b which were
carried in two steps at 60ºC for 90 minutes and at 90ºC for 4 hours, this peak at 2θ value
of 8 is not present. The X-ray diffraction diagram of these two products was the same
with those of Igarashi et.al.and ZB 2335 and Chinese ZB. X-ray intensities of samples
with ZB seed crystals were higher than the unseeded ones indicating higher crystallinity
while intensity at 2θ of 28.4 was 27 for unseeded sample, it was 44 for seeded sample.
The primary particle size, B of the crystals was found from Scherer equation.
θλ
LCosB
9.0=
where L is the breadth of the peak at θ value at half height.
oAxCosx
xB 2.81
217
14.31801
546.19.0 =
=
From the breadth of the peaks of 2θ 18.0 for [020] plane of experiment 5b. The X-
ray diffraction values are given in Table 5.6.

84
Table 5.6 X-ray diffraction values of Experiments
Exp.1 Exp.2 Exp.3 Exp.4a Exp.5a Exp.4b Exp.5b
2θ Int. 2θ Int 2θ Int 2θ Int 2θ Int 2θ Int 2θ Int
17.5 27 17.6 24 17.8 25 17.5 11 17.6 19 17.7 31 17.9 53
20.6 11 19.7 6 20.2 9 20.8 6 20.4 5 20.3 44 20.3 53
21.6 4 21.3 5 22.3 6 23.0 4 22.8 5 21.4 27 21.6 48
22.7 4 23.2 10 23.4 9 23.5 4 23.3 11 23.4 26 23.5 49
23.8 8 23.9 5 24.0 7 27.4 9 24.0 7 25.5 37 25.5 48
24.7 5 27.2 12 27.2 13 28.7 9 27.0 21 27.2 11 27.2 19
27.4 16 28.8 10 28.1 45 28.1 23 28.4 27 28.5 44
28.8 9
Exp.4a: 60ºC, 90 minutes.
Exp.5a: 60ºC, 90 minutes.
Exp.4b: 90ºC, 4 hours.
Exp.5b: 90ºC, 4 hours.
The X-ray diagrams of the ZB sample from the experiments

85
Fig.5.22 X-ray diffraction image of Experiment No.1, No.2 and No.3.
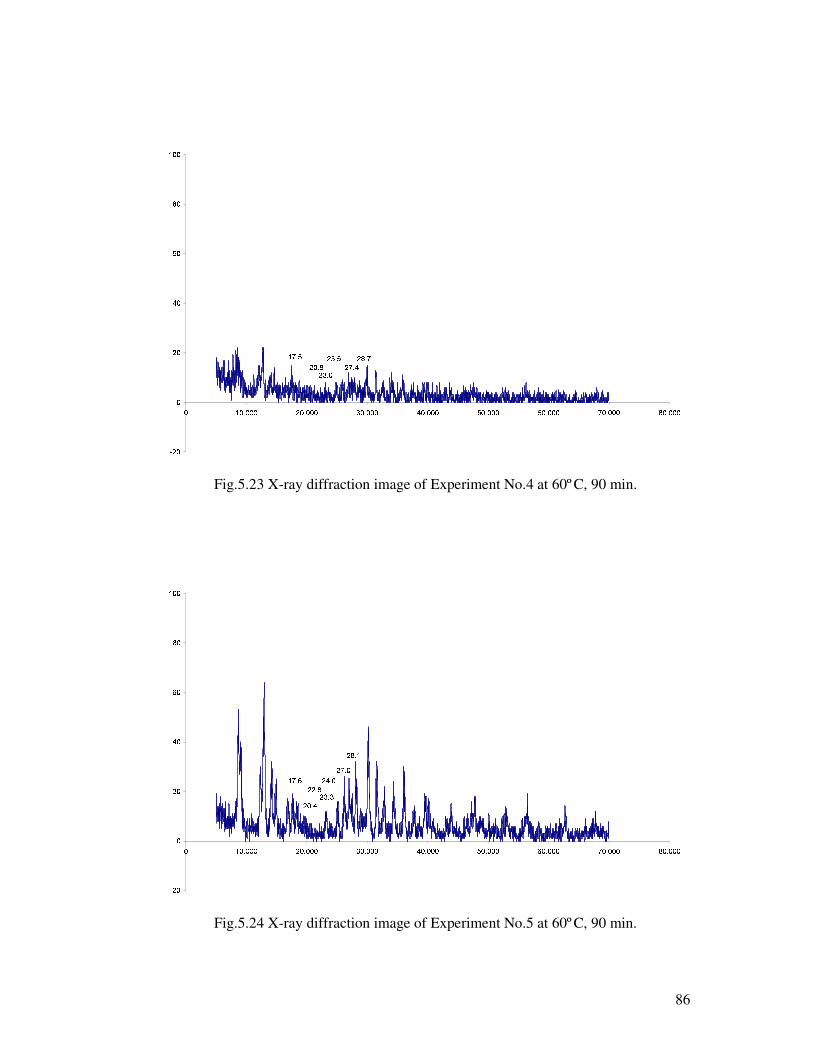
86
n oqp
p
oqp
rqs
tqu
vxw
y�zxz
z {�|~} |x|x| �q|~} |x|x| �x�~� �x�x� �q�~� �x�x� �x�~� �x�x� �q�~� �x�x� �x�~� �x�x� �x�~� �x�x�
���~� � � �~� ��q� � ��q� � � � �~� �
� �~� �
Fig.5.23 X-ray diffraction image of Experiment No.4 at 60ºC, 90 min.
� � �
�
� �
�q�
�q�
�x�
���x�
� ���~� �x�x� � �~� �x�x� � �~� �x�x� �q�~� �x�x� �x�~� �x�x� �q�~� �x�x� �x�~� �x�x� �x�~� �x�x�
���~� � � �~� ��x��� � �q�~� �
�q�~� ��q�~� ��x��� �
Fig.5.24 X-ray diffraction image of Experiment No.5 at 60ºC, 90 min.

87
� �q�
�
�q�
� �
� �
�
¡ �x�
� ¡ �~¢ �x�x� �q�~¢ �x�x� £x�~¢ �x�x� � �~¢ �x�x� ¤x�~¢ �x�x� � �~¢ �x�x� ¥x�~¢ �x�x� �~¢ �x�x�
¡ ¥~¢ ¥�q�~¢ £
� ¡ ¢ � �q£~¢ �
�q¥~¢ �
�q¤~¢ ¤� ¢ �
Fig.5.25 X-ray diffraction image of Experiment No.4 at 90ºC, 4h.
� �q�
�
�q�
� �
� �
�
¡ �x�
� ¡ �~¢ �x�x� �q�~¢ �x�x� £x�~¢ �x�x� � �~¢ �x�x� ¤x�~¢ �x�x� � �~¢ �x�x� ¥x�~¢ �x�x� �~¢ �x�x�
¦�§~¨ © ªq«~¨ ¬ª¦�¨ ®ªq¬~¨ ¯
ªq§~¨ ª
ªq°~¨ ¯
Fig.5.26. X-ray diffraction image of Experiment No.5 at 90ºC, 4h.

88
5.3 Discussion
In this study, the development of zinc borate production process was investigated.
The produced zinc borates were then characterized by SEM, TGA, X-ray diffraction,
FTIR and the results were discussed in the previous chapters.
First of all, thermogravimetric (TGA) analyses were done to investigate the thermal
behaviour of the samples of zinc borate in view of the crystal water and mass losses.
The mass loss of the experiment no.1, 2, 3, 4 and 5 at 60ºC for 1.5h and 4 and 5 at 90ºC
for 4h. were 20.63%, 6.51%, 9.65%, 19.1%, 25%, 9.72 and 11.4%, respectively. It is
appearent that the one with seed crystal had got a less mass loss than its counterpart.
The morphology of all of the samples of zinc borate was investigated by a scanning
electron microscope (SEM) by taking the microphotographs. This instrument gives
information regarding the structures of the films in micron scales. When the first two
experiments are compared with the SEM photographs of commercial ZB and raw
materials, it is seen that the product formed has not completed the formation of ZB. The
shapes of the particles are not rounded like the commercial products that are taken as
reference. The angular shape and needle like shape of the particles prove that the
product obtained is not ZB but a composition that is richer in ZnO and boric acid. The
obtained product in experiment No.3 has an average particle size around 0.2 – 1 micron
which is approximately the same as two commercial products studied as a reference.
The round shapes of the particles prove that the experiment has been successful and ZB
is obtained. When SEM microphotographs of the latest two experiments are compared,
it is clearly seen that the similar morphology was obtained and this morphology is
similar to those which are used as reference products. An additional note about
experiment 4 which contains ZB-2335 as seed crystal is that morphologywise it is more
like the reference product ZB-2335.
FTIR spectra of the zinc borate samples were analyzed to have an idea on the
structures which are present in the samples. The main peak of ZnO ± ² 2O3 at around 3227
cm-1 is clearly seen. The characteristic peaks of tetrahedral (BO4) and trihedral (BO3)
borate groups are clearly seen between 1100 and 800 cm-1 and between 1450 and 1200
cm-1, respectively. The characteristic peak of trihedral borate groups are also obvious at
peaks below 800 cm-1 in these figures as well. These peaks are much clearer in the
experiments where reflux is used and the material is heated for 4h under 90ºC.
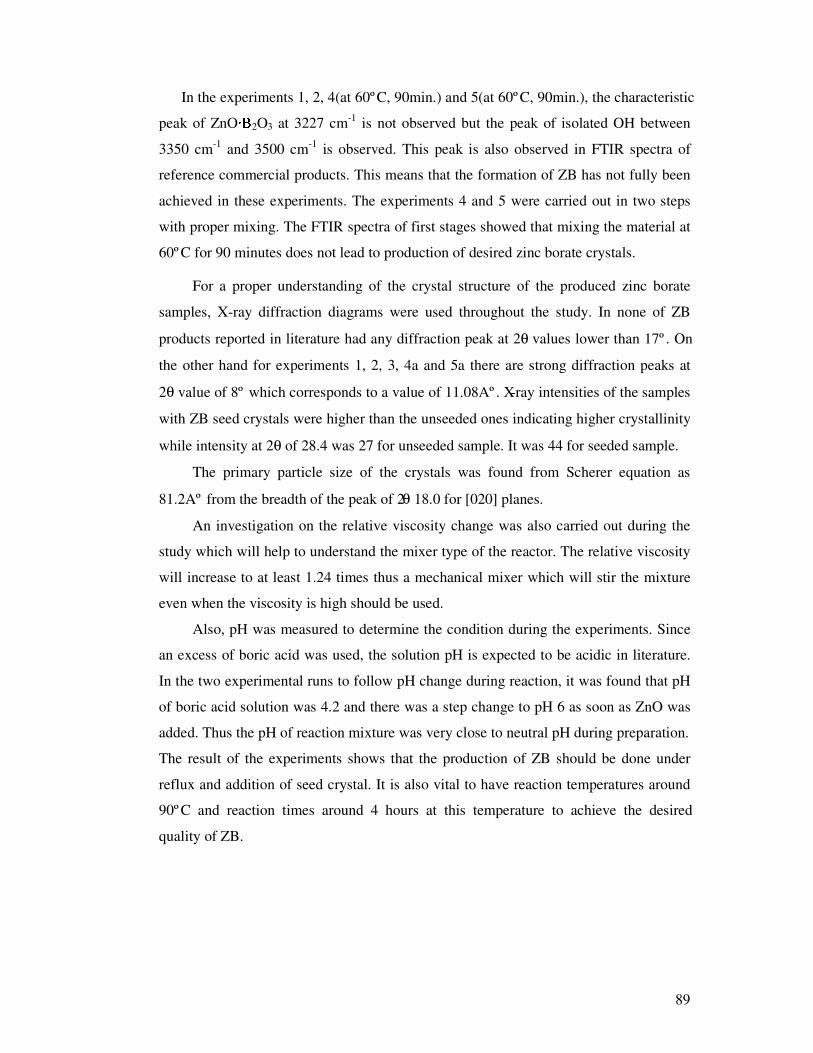
89
In the experiments 1, 2, 4(at 60ºC, 90min.) and 5(at 60ºC, 90min.), the characteristic
peak of ZnO ³ ´ 2O3 at 3227 cm-1 is not observed but the peak of isolated OH between
3350 cm-1 and 3500 cm-1 is observed. This peak is also observed in FTIR spectra of
reference commercial products. This means that the formation of ZB has not fully been
achieved in these experiments. The experiments 4 and 5 were carried out in two steps
with proper mixing. The FTIR spectra of first stages showed that mixing the material at
60ºC for 90 minutes does not lead to production of desired zinc borate crystals.
For a proper understanding of the crystal structure of the produced zinc borate
samples, X-ray diffraction diagrams were used throughout the study. In none of ZB
products reported in literature had any diffraction peak at 2θ values lower than 17º. On
the other hand for experiments 1, 2, 3, 4a and 5a there are strong diffraction peaks at
2θ value of 8º which corresponds to a value of 11.08Aº. X-ray intensities of the samples
with ZB seed crystals were higher than the unseeded ones indicating higher crystallinity
while intensity at 2θ of 28.4 was 27 for unseeded sample. It was 44 for seeded sample.
The primary particle size of the crystals was found from Scherer equation as
81.2Aº from the breadth of the peak of 2θ 18.0 for [020] planes.
An investigation on the relative viscosity change was also carried out during the
study which will help to understand the mixer type of the reactor. The relative viscosity
will increase to at least 1.24 times thus a mechanical mixer which will stir the mixture
even when the viscosity is high should be used.
Also, pH was measured to determine the condition during the experiments. Since
an excess of boric acid was used, the solution pH is expected to be acidic in literature.
In the two experimental runs to follow pH change during reaction, it was found that pH
of boric acid solution was 4.2 and there was a step change to pH 6 as soon as ZnO was
added. Thus the pH of reaction mixture was very close to neutral pH during preparation.
The result of the experiments shows that the production of ZB should be done under
reflux and addition of seed crystal. It is also vital to have reaction temperatures around
90ºC and reaction times around 4 hours at this temperature to achieve the desired
quality of ZB.

90
CHAPTER 6
CONCLUSION
For 29.6 g.boric acid and 9.6 g.ZnO per 100 g.water heating at 60ºC for 90
minutes and at 90ºC for 120 minutes, water reflux gave ZB crystals having the same IR
spectrum and X-ray diffraction diagram of commercial ZB.
ZB which has 10 – 12 % crystalline water and which dehydrates above 290ºC was
obtained from ZnO and boric acid by heating under reflux.
Because of the viscosity increase during reaction, using a powerful mixer and a
good temperature control and keeping the volume constant by using reflux are
important parameters in ZB production.
Further studies in pilot scale are recommended.
91
REFERENCES
• Bourbigot S., Bras M.L., Leeuwendal R., Shen K.K., Schubert D., “Recent
Advances In the Use of Zinc Borates In Flame Retardancy of EVA”, Polymer
Degradation and Stability, 64, 419 – 425, 1999.
• Burns P.C., Hawthorne F.C., Can.Mineral. 31, 297 – 304, 1993.
• Christ C., Clark J.R., Physical Chemistry Minerology, 2, 59 – 87, 1977.
• Giudice C.A., Benitez J.C., “Zinc Borates As Flame-retardant Pigments In
Chlorine-containing Coatings”, Progress In Organic Coatings, 42, 82 – 88, 2001.
• http://minerals.usgs.gov, 2001.
• http://www.etiholding.gov.tr
• http://www.samuelbanner.co.uk/storey/home.htm
• Igarashi H., Tatebe A., Sakao K., Zinc Borate, and Production Method and Use
Thereof”, EP.Patent No.1 205 439 A1, 2001.
• Kirk-Othmer Encyclopedia of Chemical Technology, Vol.10 and Vol.4, 4th ed.,
John Wiley and Sons, 910 – 961 and 407 – 408,1994, N.Y.
• Kirk-Othmer Encyclopedia of Chemical Technology, Vol.22, 2nd ed., John
Wiley and Sons, 606, 1970, N.Y.
• Schubert D.M., “Zinc Borate”, US.Patent No.5472644, 1995.
• Schubert D.M., Alam F., Mandana Z.V., Knobler C., “Structural
Characterization and Chemistry of The Industrially Important Zinc Borate,
Zn[B3O4(OH)3]”, Americal Chemical Society, 15, 866 – 871, 2003.
• Shete A.V., Sawant S.B., Pangarkar V.G., “Kinetics of Fluid -Solid Reaction
With An Insoluble Product: Zinc Borate By The Reaction of Boric Acid and
Zinc Oxide”, Journal of Chemical Technology and Biotechnology, 79, 526 –
532, 2003.
• ������������ ���������������� �������� �!�#"%$&"'�(���*)+�'���,�.-#���!�#�0/#1�1!23

92
• Ullmann’s Encyclopedia of Industrial Chemistry, Vol.A11, 5th ed., VCH
Publication, 123 – 139,1988, Weinherm.
• Xie R., Qu B., Hu K., “Dynamic FTI R Studies of Thermo Oxidation of
Expandable Graphite-based Halogen-free Flame Retardant LLDPE Blends”,
Polymer Degradation and Stability, 72, 313 – 321, 2001.
• Yongzhong J., Shiyang G., Shuping X., Jun L., Spectrochimica Acta Part A, 56,
1291 – 1297, Elsevier, 1999.