the diabetes prevention program - dppos.org
TRANSCRIPT

The Diabetes Prevention Program
A Randomized Clinical Trial to Prevent Type 2 Diabetes
in Persons at High Risk
The DPP Research Group

Institutions and Investigators
Abbas Kitabchi U. of Tennessee
Steven Kahn U. of Washington Edward Horton Joslin Diabetes Center Richard Hamman U. of Colorado Health Sciences Center Steven Haffner U. of Texas Health Science Center Ronald Goldberg U. of Miami School of Medicine
Pamela Watson Thomas Jefferson U. David Ehrmann U. of Chicago Hospitals George Bray Pennington Biomedical Research Center

Institutions and Investigators Boyd Metzger Northwestern U. Med. School
David Nathan Massachusetts General Hospital
Jerrold Olefsky U. of California, San Diego
Xavier Pi-Sunyer St. Luke’s-Roosevelt Hospital
David Marrero Indiana U. School of Medicine
David Schade U. of New Mexico School of Medicine
Christopher Saudek Johns Hopkins U
Neil White Washington U. School of Medicine
Robert Ratner Medstar Clinical Research Center

Institutions and Investigators
Mohammed Saad U. of California Los Angeles Sarah Fowler George Washington University
(Coordinating Center)
Harry Shamoon Albert Einstein College of Medicine Rena Wing U. of Pittsburgh Medical Center Richard Arakaki U. of Hawaii
William Knowler Southwest American Indian Center for Diabetes Prevention

Central Resources Lifestyle core Univ. Pittsburgh Medication resource group Albert Einstein Central biochemistry lab Univ. Washington ECG reading center Wake Forest Univ. Carotid US reading center New England Medical Center CT scan reading center Univ. of Colorado Health
Sciences Center Nutrition coding center Univ. South Carolina Quality of well being center Univ. California San Diego Drug distribution center McKesson Biosciences Community outreach/media Matthews Media Group Clinical monitoring group ACRN

Sponsors • National Institute of Diabetes & Digestive & Kidney Diseases
• Other NIH Institutes, Offices
National Center on Minority Health and Health Disparities National Institute of Child Health and Human Development National Institute on Aging National Center for Research Resources, GCRC Program Office of Research on Women’s Health
• Other Federal Agencies Indian Health Service Centers for Disease Control and Prevention • American Diabetes Association

Sponsors
• Industrial grant support Bristol-Myers Squibb Warner-Lambert.
• Additional Support LifeScan, Inc Merck & Co. Health O Meter Nike Sports Marketing Hoechst Marion Roussel, Inc. Slim Fast Foods Co. Merck-Medco Managed Quaker Oats Co. Care, Inc

• There is a long period of glucose intolerance that
precedes the development of diabetes
• Screening tests can identify persons at high risk
• There are safe, potentially effective interventions that can address modifiable risk factors
Feasibility of Preventing Type 2 Diabetes

Modifiable Risk Factors for Type 2 Diabetes
• Obesity • Body fat distribution • Physical inactivity
• Elevated fasting and 2 hr glucose levels

•To prevent or delay the development of type 2 diabetes in persons with impaired glucose tolerance (IGT)
DPP Primary Goal

DPP Secondary Goals
• Reduce cardiovascular disease (CVD) events
• Reduce CVD risk factors
• Reduce atherosclerosis

Study Design
• 3-group randomized clinical trial • 27 clinical sites • Standardized across clinics:
–Common protocol and procedures manual –Staff training –Data quality control program

Diabetes Prevention Program Clinics
. .
. . .
.
.
. . .
. .
. . .
.
. . . . . .
. . . .

• Age > 25 years • Plasma glucose
– 2 hour glucose 140-199 mg/dl (7.8- <11.1 mmol/L) and – Fasting glucose 95-125 mg/dl (5.3- <7.0 mmol/L)
• Body mass index > 24 kg/m2 • All ethnic groups
goal of up to 50% from high risk populations
Eligibility Criteria

Screening and Recruitment
Step 1 screening
Step 2 OGTT
Step 3 start run-in
Step 4 randomization
Number of participants
158,177
30,985
4,719
4,080
3,819*
Step 3 end run-in
*3,234 in 3 arm study (585 in troglitazone arm)
The DPP Research Group, Controlled Clin Trials (in press)

Study Interventions Eligible participants
Randomized
Standard lifestyle recommendations
Intensive Metformin Placebo Lifestyle (n = 1079) (n = 1073) (n = 1082)

Primary Outcome: Diabetes
• Annual fasting plasma glucose (FPG) and 75 gm Oral Glucose Tolerance Test – FPG > 126 mg/dL (7.0 mmol/L) or – 2-hr > 200 mg/dL (11.0 mmol/L), – Either confirmed with repeat test
• Semi-annual FPG – > 126 mg/dL, confirmed

Lifestyle Intervention An intensive program with the
following specific goals:
• > 7% loss of body weight and maintenance of weight loss
– Dietary fat goal -- <25% of calories from fat – Calorie intake goal -- 1200-1800 kcal/day
• > 150 minutes per week of physical activity

Lifestyle Intervention Structure • 16 session core curriculum (over 24 weeks)
• Long-term maintenance program
• Supervised by a case manager
• Access to lifestyle support staff – Dietitian
– Behavior counselor
– Exercise specialist

The Core Curriculum • 16 session course conducted over 24 weeks
• Education and training in diet and exercise
methods and behavior modification skills
• Emphasis on: – Self monitoring techniques – Problem solving – Individualizing programs – Self esteem, empowerment, and social
support – Frequent contact with case manager and DPP
support staff

Post Core Program • Self-monitoring and other behavioral strategies
• Monthly visits – Must be seen in person at least every two months
• Supervised exercise sessions offered
• Periodic group classes and motivational campaigns
• Tool box strategies – Provide exercise videotapes, pedometers
– Enroll in health club or cooking class

DPP Study Interventions: Criteria for Drug Treatment
• Efficacy
• Safety
• Tolerability - minimal side effects
• Acceptability - dose frequency

Metformin- 850 mg per day escalating after 4 weeks to 850 mg twice per day Placebo- Metformin placebo adjusted in parallel with active drugs
Interventions: Medications

DPP Population
Caucasian 1768 (55%)
African American 645 (20%)
Hispanic American 508 (16%)
Asian/Pacific Islander 142 (4%)
American Indian 171 (5%)
The DPP Research Group, Diabetes Care 23:1619-29, 2000

DPP Population
Sex Distribution Age Distribution
25-44 31%
> 60 20%
45-59 49%
Men 32%
Women 68%
The DPP Research Group, Diabetes Care 23:1619-29, 2000

Retention and Participation
• 99.6% of the study cohort alive at study end • 93% completed study • 93% of annual visits completed • Average follow-up 2.8 years (range 1.8 - 4.6)
The DPP Research Group, NEJM 346:393-403, 2002

Lifestyle Intervention: Physical Activity Results
• 74% of volunteers assigned to intensive lifestyle achieved the study goal of > 150 minutes of activity per week at 24 weeks
The DPP Research Group, NEJM 346:393-403, 2002

Mean Change in Leisure Physical Activity
0
2
4
6
8
0 1 2 3 4
Years from Randomization
ME
T-h
ou
rs/w
eek
Placebo Metformin
Lifestyle
The DPP Research Group, NEJM 346:393-403, 2002

-8
-6
-4
-2
0
0 1 2 3 4Years from Randomization
Wei
gh
t C
han
ge
(kg
)
Placebo Metformin
Lifestyle
Mean Weight Change
The DPP Research Group, NEJM 346:393-403, 2002

Percent Taking > 80% of Prescribed Dose of Coded Medication
0
20
40
60
80
100
1 2 3 4
Years from Randomization
% o
f Par
ticip
ants
Metformin
Placebo
The DPP Research Group, NEJM 346:393-403, 2002

0 1 2 3 4
0
10
20
30
40 Placebo (n=1082)Metformin (n=1073, p<0.001 vs. Plac)Lifestyle (n=1079, p<0.001 vs. Met , p<0.001 vs. Plac )
Percent developing diabetes
All participants
All participants
Years from randomization
Cum
ulat
ive
inci
denc
e (%
)
Placebo (n=1082) Metformin (n=1073, p<0.001 vs. Placebo) Lifestyle (n=1079, p<0.001 vs. Metformin , p<0.001 vs. Placebo)
Incidence of Diabetes
Risk reduction 31% by metformin 58% by lifestyle
The DPP Research Group, NEJM 346:393-403, 2002

Effect of Treatment on Incidence of Diabetes
Placebo Metformin Lifestyle Incidence of diabetes 11.0% 7.8% 4.8% (percent per year) Reduction in incidence ---- 31% 58% compared with placebo Number needed to treat ---- 13.9 6.9 to prevent 1 case in 3 years
The DPP Research Group, NEJM 346:393-403, 2002

Mean Change in Fasting Plasma Glucose
100
105
110
115
0 1 2 3 4
Years from Randomization
FP
G (
mg
/dl)
Placebo
Metformin Lifestyle
The DPP Research Group, NEJM 346:393-403, 2002

Mean Change in HbA1c
5.8
5.9
6.0
6.1
0 1 2 3 4
Years from Randomization
H
bA
1c
(%
)
Placebo
Metformin Lifestyle
The DPP Research Group, NEJM 346:393-403, 2002

0
4
8
12
Male (n=1043) Female (n=2191)
Case
s/10
0 pe
rson
-yr
LifestyleMetforminPlacebo
Diabetes Incidence Rates by Sex
The DPP Research Group, NEJM 346:393-403, 2002

0
4
8
12
25-44 (n=1000) 45-59 (n=1586) > 60 (n=648)
Cas
es/1
00 p
erso
n-yr
Lifestyle Metformin Placebo
Diabetes Incidence Rates by Age
Age (years)
The DPP Research Group, NEJM 346:393-403, 2002

Diabetes Incidence Rates by Ethnicity
0
4
8
12
Caucasian(n=1768)
AfricanAmerican(n=645)
Hispanic(n=508)
AmericanIndian
(n=171)
Asian(n=142)
Case
s/10
0 pe
rson
-yr
Lifestyle Metformin Placebo
The DPP Research Group, NEJM 346:393-403, 2002

0
4
8
12
16
24 - < 30 30 - < 35 > 35
Cas
es/1
00 p
erso
n-yr
Lifestyle Metformin Placebo
(n=1045) (n=995) (n=1194)
Diabetes Incidence Rates by BMI
Body Mass Index (kg/m2)
The DPP Research Group, NEJM 346:393-403, 2002

0
5
10
15
20
95-109 (5.3- 6.0)(n=2174)
110-125 (6.1-6.9)(n=1060)
Case
s/10
0 pe
rson
-yr
LifestyleMetforminPlacebo
Diabetes Incidence Rates by Fasting Glucose
Fasting Plasma Glucose: mg/dl (mmol/l)
The DPP Research Group, NEJM 346:393-403, 2002

0
4
8
12
16
140-153(n=1049)
154-172(n=1103)
173-199(n=1082)
Cas
es/1
00 p
erso
n-yr Lifestyle Metformin Placebo
Diabetes Incidence Rates by 2-hr Glucose
2-Hour Plasma Glucose (mg/dl)
The DPP Research Group, NEJM 346:393-403, 2002

Consistency of Treatment Effects
• Lifestyle intervention was beneficial regardless of ethnicity, age, BMI, or sex
• The efficacy of lifestyle relative to metformin was greater in older persons and in those with lower BMI
• The efficacy of metformin relative to placebo was greater in those with higher baseline fasting glucose and BMI

Normal Fasting Glucose at Annual Visits
The DPP Research Group, NEJM 346:393-403, 2002

Normal 2-hr Glucose at Annual Visits
The DPP Research Group, NEJM 346:393-403, 2002
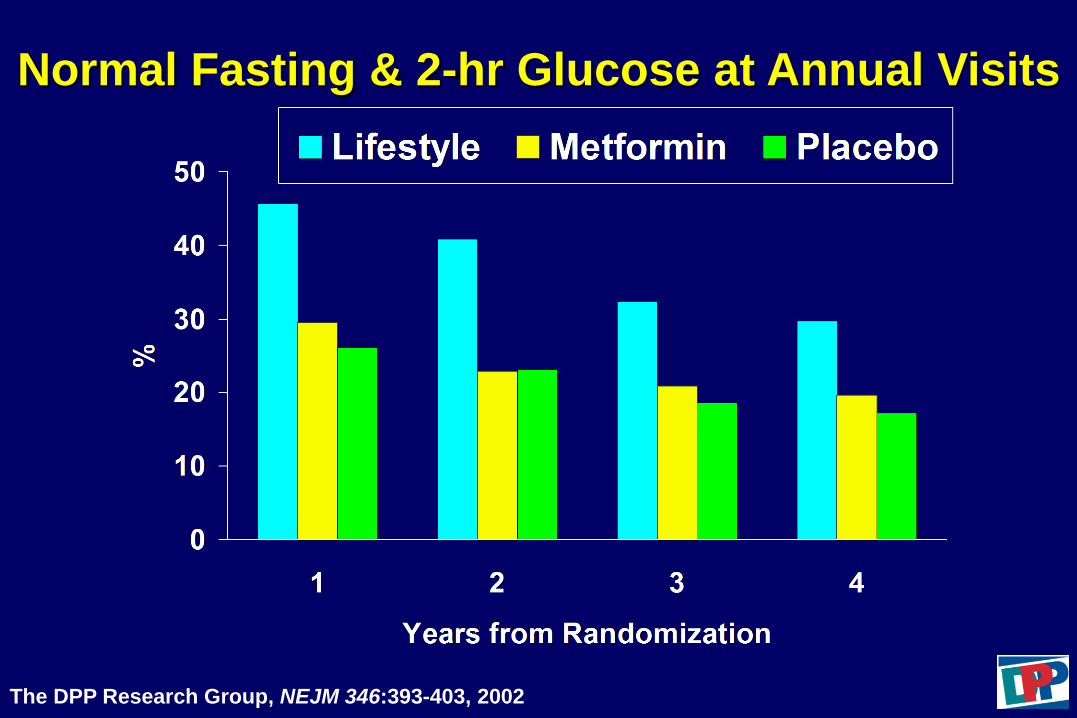
Normal Fasting & 2-hr Glucose at Annual Visits
The DPP Research Group, NEJM 346:393-403, 2002

Normal Glucose at Annual Visits
Years from Randomization
Years from Randomization
Years from Randomization
Normal Fasting Glucose
Normal Fasting & 2-hr Glucose
Normal 2-hr Glucose
Lifestyle Metformin Placebo
The DPP Research Group, NEJM 346:393-403, 2002

Adverse Events (rates per 100 person years)
Death 0.16 0.20 0.10
Hospitalization 7.9 8.4 8.0 GI Symptoms 30.7 77.8 12.9
Musculoskeletal 21.1 20.0 24.1 Symptoms * significantly different from placebo
Placebo Metformin Lifestyle
* *
*
The DPP Research Group, NEJM 346:393-403, 2002

Summary-1
• Both interventions were well accepted and safe
• Intensive lifestyle resulted in weight
loss and increased activity level for the duration of the study

Summary-2
• Both interventions were effective in men and women and all ethnic groups
• Intensive lifestyle intervention was effective in all age groups, including
those > 60 years of age

Summary-3
• Intensive lifestyle intervention reduced the development of diabetes by 58%
• Metformin reduced the development of diabetes by 31% • Lifestyle was more effective than metformin

THANK YOU

Diabetes Prevention Program
Baseline Characteristics

Participant Characteristics by Treatment Group Assignment (1)
Overall ILS Metformin Placebo
n 3,234 1,079 1,073 1,082
Age (years)* 50.6 ± 10.7 50.6 ± 11.3 50.9 ± 10.3 50.3 ± 10.4
Sex** Male 1043 (32%) 345 (32%) 363 (34%) 335 (31%) Female 2191 (68%) 734 (68%) 710 (66%) 747 (69%)
Ethnicity Caucasian 1768 (55%) 580 (54%) 602 (56%) 586 (54%) African-American 645 (20%) 204 (19%) 221 (21%) 220 (20%) Hispanic 508 (16%) 178 (17%) 162 (15%) 168 (16%) American Indian 171 (5%) 60 (6%) 52 (5%) 59 (6%) Asian-American 142 (4%) 57 (5%) 36 (3%) 49 (4%)
*Mean ± SD; ** n, (%) The DPP Research Group, Diabetes Care 23:1619-29, 2000

Participant Characteristics by Treatment Group Assignment (2)
*Mean ± SD
n
FPG (mmol/L) * 5.9 ± 0.5 5.9 ± 0.4 5.9 ± 0.5 5.9 ± 0.5
BMI (kg/m2 ) 34.0 ± 6.7 33.9 ± 6.8 33.9 ± 6.6 34.2 ± 6.8
BP (mm Hg) Systolic 124 ± 15 124 ± 15 124 ± 15 124 ± 14
Diastolic 78 ± 9 79 ± 9 78 ± 10 78 ± 9
3,234 1,079 1,073 1,082Overall ILS Metformin Placebo
The DPP Research Group, Diabetes Care 23:1619-29, 2000

Demographic and Socioeconomic Characteristics by Sex (1)
* n, (%)
nAge (years) * 25 to <40 505 (16%) 113 (11%) 392 (18%) 40 to <50 1137 (35%) 286 (27%) 851 (39%) 50 to <60 945 (29%) 325 (31%) 620 (28%) ≥60 647 (20%) 319 (31%) 328 (15%)
Race/Ethnicity Caucasian 1768 (55%) 608 (58%) 1160 (53%) African-American 645 (20%) 165 (16%) 480 (22%) Hispanic 508 (16%) 167 (16%) 341 (16%) American Indian 171 (5%) 20 (2%) 151 (7%) Asian American 142 (4%) 83 (8%) 59 (3%)
Female2,191
Overall3,234
Male1,043
The DPP Research Group, Diabetes Care 23:1619-29, 2000

Demographic and Socioeconomic Characteristics by Sex (2)
* n, (%)
nEmployment Status * Employed 2401 (74.2%) 771 (73.9%) 1630 (74.4%) Retired 420 (13.0%) 217 (20.8%) 203 (9.3%) Homemaker 204 (6.3%) 1 (0.1%) 203 (9.3%) Not employed 121 (3.7%) 33 (3.2%) 88 (4.0%) Seasonally employed 25 (0.8%) 8 (0.8%) 17 (0.8%) Student 21 (0.6%) 2 (0.2%) 19 (0.9%) Other 37 (1.1%) 11 (1.1%) 26 (1.2%) Never worked 5 (0.2%) 0 (0.0%) 5 (0.2%)
Male1,043
Female2,191
Overall3,234
The DPP Research Group, Diabetes Care 23:1619-29, 2000

Demographic and Socioeconomic Characteristics by Sex (3)
* n, (%)
n
Education in years * <13 834 (26%) 221 (21%) 613 (28%) 13 to 16 1556 (48%) 488 (47%) 1068 (49%) 17 or more 844 (26%) 334 (32%) 510 (23%)
Annual family income < $20,000 446 (14%) 110 (11%) 336 (15%) $20,000 to <$35,000 561 (17%) 146 (14%) 415 (19%) $35,000 to <$50,000 641 (20%) 207 (20%) 434 (20%) $50,000 to <$75,000 646 (20%) 218 (21%) 428 (20%) > $75,000 682 (21%) 281 (27%) 401 (18%) Refused 257 (8%) 81 (8%) 176 (8%)
Female
2,191
Overall
3,234
Male
1,043
The DPP Research Group, Diabetes Care 23:1619-29, 2000

Demographic and Socioeconomic Characteristics by Sex (4)
* n, (%)
n
Marital status * Married 1999 (62%) 765 (73%) 1234 (56%) Divorced 448 (14%) 75 (7%) 373 (17%) Never married 420 (13%) 115 (11%) 305 (14%) Widowed 151 (5%) 31 (3%) 120 (6%) Living together 125 (4%) 31 (3%) 94 (4%) Separated 91 (3%) 26 (3%) 65 (3%)
Smoking Never 1897 (59%) 497 (48%) 1400 (64%) Former 1111 (34%) 471 (45%) 640 (29%) Current 226 (7%) 75 (7%) 151 (7%)
Female2,191
Overall3,234
Male1,043
The DPP Research Group, Diabetes Care 23:1619-29, 2000

Self-reported Characteristics by Sex and Ethnicity
* n, (%)
No. of MEN Fam hx type 2 diabetes * 690 (66%) 390 (64%) 117 (71%) 112 (67%) 13 (65%) 58 (70%)
Hx of high cholesterol 389 (37%) 234 (39%) 65 (39%) 53 (32%) 3 (15%) 34 (41%)
Hx of hypertension 302 (29%) 171 (28%) 58 (35%) 49 (29%) 5 (25%) 19 (23%)
No. of WOMEN Fam hx type 2 diabetes 1553 (71%) 799 (69%) 360 (75%) 243 (71%) 116 (77%) 35 (60%)
Hx of gest. diabetes 353 (16%) 191 (17%) 63 (13%) 55 (16%) 36 (24%) 8 (14%)
Hx of high cholesterol 730 (33%) 429 (37%) 147 (31%) 114 (33%) 22 (15%) 17 (29%)
Hx of hypertension 569 (26%) 303 (26%) 144 (30%) 68 (20%) 40 (27%) 15 (26%)
African American
165
Overall
1,043
Caucasian
608
HispanicAmerican
Indian
2,191 1,160 480 341
Asian American
167 20 83
151 59
The DPP Research Group, Diabetes Care 23:1619-29, 2000

Body Mass Index by Sex and Ethnicity
*Mean ± SD; **n, (%)
No. of MEN BMI (kg/m2) * 32.0 ± 5.7 32.5 ± 5.8 32.5 ± 6.0 31.7 ± 5.0 31.2 ± 4.1 28.3 ± 3.7
range 22.7 - 70.9 24.0 - 70.9 24.4 - 64.9 24.4 - 54.4 24.3 - 40.1 22.7 - 44.0
<30 ** 453 (43%) 246 (41%) 66 (40%) 72 (43%) 8 (40%) 61 (74%) 30 to <40 505 (48%) 305 (50%) 84 (51%) 84 (50%) 11 (55%) 21 (25%) ≥40 85 (8%) 57 (9%) 15 (9%) 11 (7%) 1 (5%) 1 (1%)
No. of WOMEN BMI (kg/m2) 34.9 ± 7.0 35.0 ± 7.1 36.3 ± 7.1 34.0 ± 6.0 33.9 ± 6.3 30.7 ± 6.5
range 22.1 - 71.5 23.9 - 71.5 24.1 - 65.1 22.6 - 64.9 24.0 - 55.4 22.1 - 50.4
<30 593 (27%) 325 (28%) 101 (21%) 94 (28%) 38 (25%) 35 (59%) 30 to <40 1134 (52%) 585 (50%) 248 (52%) 194 (57%) 90 (60%) 16 (29%) ≥40 464 (21%) 250 (22%) 131 (27%) 53 (16%) 23 (15%) 7 (12%)
151 59
Asian American
167 20 83
HispanicAmerican
Indian
2,191 1,160 480 341
African American
165
Overall
1,043
Caucasian
608
The DPP Research Group, Diabetes Care 23:1619-29, 2000

Glycemia by Sex and Ethnicity
*Mean ± SD; **n, (%)
No. of MEN FPG (mmol/L) * 6.0 ± 0.5 6.0 ± 0.5 6.0 ± 0.4 6.0 ± 0.5 5.8 ± 0.4 6.0 ± 0.4
range 5.2 - 7.7 5.3 - 7.7 5.3 - 7.3 5.3 - 7.7 5.2 - 6.6 5.3 - 7.5
2-hr PG (mmol/L) 9.1 ± 0.9 9.2 ± 0.9 9.1 ± 1.0 9.1 ± 1.0 9.1 ± 0.9 9.1 ± 0.9range 7.8 - 11.0 7.8 - 11.0 7.8 - 11.0 7.8 - 11.0 7.9 - 10.5 7.8 - 11.0
HbA1c (%) 5.9 ± 0.5 5.8 ± 0.4 6.2 ± 0.7 5.9 ± 0.5 5.8 ± 0.5 6.0 ± 0.4range 4.0 - 7.7 4.0 - 7.2 4.2 - 7.7 4.4 - 7.2 4.5 - 6.7 4.8 - 6.8 > 6.1% ** 316 (30%) 133 (22%) 105 (64%) 47 (28%) 5 (25%) 26 (31%)
No. of WOMEN FPG (mmol/L) 5.9 ± 0.4 5.9 ± 0.4 6.0 ± 0.5 5.8 ± 0.4 5.5 ± 0.5 5.9 ± 0.4
range 4.2 - 7.7 5.3 - 7.7 5.3 - 7.5 5.3 - 7.3 4.2 - 6.8 5.3 - 6.8
2-hr PG (mmol/L) 9.1 ± 0.9 9.2 ± 0.9 9.1 ± 1.0 9.1 ± 0.9 9.1 ± 1.0 9.4 ± 0.9range 7.8 - 11.0 7.8 - 11.0 7.8 - 11.0 7.8 - 11.0 7.8 - 11.0 7.8 - 11.0
HbA1c (%) 5.9 ± 0.5 5.8 ± 0.4 6.2 ± 0.6 5.9 ± 0.5 6 ± 0.4 5.9 ± 0.4range 3.2 - 8.5 3.6 - 7.4 3.2 - 8.5 4.4 - 7.5 5.0 - 7.6 4.5 - 7.1 > 6.1% 616 (28%) 215 (19%) 259 (54%) 76 (22%) 52 (34%) 15 (25%)
African American
165
Overall
1,043
Caucasian
608
HispanicAmerican
Indian
2,191 1,160 480 341
Asian American
167 20 83
151 59
The DPP Research Group, Diabetes Care 23:1619-29, 2000

Insulinemia by Sex and Ethnicity
*Mean ± SD
INSULIN (pmol/L)
No. of MEN Fasting * 158 ± 99 157 ± 101 148 ± 74 178 ± 118 151 ± 70 155 ± 88
range 26 - 1104 27 - 684 26 - 510 43 - 1104 48 - 288 36 - 480
30-min 590 ± 423 555 ± 424 527 ± 317 711 ± 414 820 ± 760 661 ± 441range 27 - 4854 31 - 4854 66 - 1812 27 - 2190 294 - 3480 78 - 2280
No. of WOMEN Fasting 158 ± 86 151 ± 80 167 ± 91 168 ± 91 170 ± 89 148 ± 103
range 14 - 720 14 - 552 18 - 576 32 - 720 34 - 534 36 - 576
30-min 607 ± 368 557 ± 323 617 ± 416 681 ± 378 810 ± 444 569 ± 276range 18 - 3600 36 - 3600 18 - 3024 52 - 2100 78 - 2436 132 - 1248
Asian American
151 59
8320
HispanicAmerican
Indian
2,191 1,160 480 341
African American
165
Overall
1,043
Caucasian
608 167
The DPP Research Group, Diabetes Care 23:1619-29, 2000
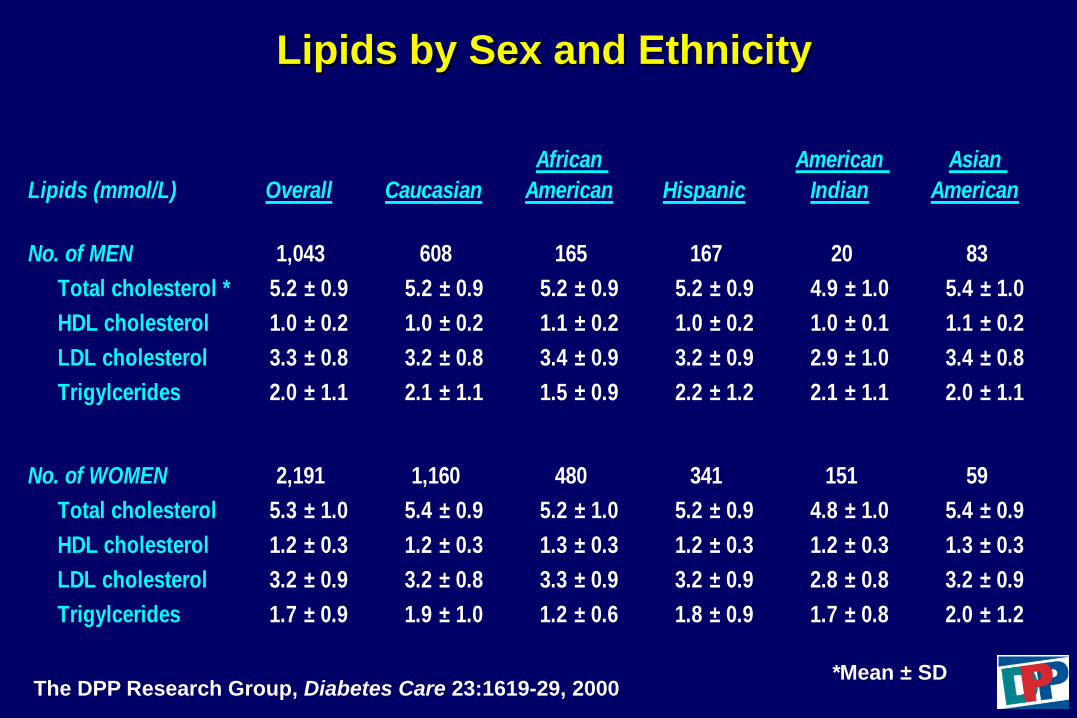
Lipids by Sex and Ethnicity
*Mean ± SD
Lipids (mmol/L)
No. of MEN Total cholesterol * 5.2 ± 0.9 5.2 ± 0.9 5.2 ± 0.9 5.2 ± 0.9 4.9 ± 1.0 5.4 ± 1.0HDL cholesterol 1.0 ± 0.2 1.0 ± 0.2 1.1 ± 0.2 1.0 ± 0.2 1.0 ± 0.1 1.1 ± 0.2LDL cholesterol 3.3 ± 0.8 3.2 ± 0.8 3.4 ± 0.9 3.2 ± 0.9 2.9 ± 1.0 3.4 ± 0.8Trigylcerides 2.0 ± 1.1 2.1 ± 1.1 1.5 ± 0.9 2.2 ± 1.2 2.1 ± 1.1 2.0 ± 1.1
No. of WOMEN Total cholesterol 5.3 ± 1.0 5.4 ± 0.9 5.2 ± 1.0 5.2 ± 0.9 4.8 ± 1.0 5.4 ± 0.9HDL cholesterol 1.2 ± 0.3 1.2 ± 0.3 1.3 ± 0.3 1.2 ± 0.3 1.2 ± 0.3 1.3 ± 0.3LDL cholesterol 3.2 ± 0.9 3.2 ± 0.8 3.3 ± 0.9 3.2 ± 0.9 2.8 ± 0.8 3.2 ± 0.9Trigylcerides 1.7 ± 0.9 1.9 ± 1.0 1.2 ± 0.6 1.8 ± 0.9 1.7 ± 0.8 2.0 ± 1.2
Asian American
151 59
8320
HispanicAmerican
Indian
2,191 1,160 480 341
African American
165
Overall
1,043
Caucasian
608 167
The DPP Research Group, Diabetes Care 23:1619-29, 2000