the direct detection of the irradiated brown dwarf in the
TRANSCRIPT
MNRAS 481, 5216–5222 (2018) doi:10.1093/mnras/sty2599Advance Access publication 2018 September 24
The direct detection of the irradiated brown dwarf in the whitedwarf–brown dwarf binary SDSS J141126.20+200911.1
S. L. Casewell ,1‹ S. P. Littlefair,2 S. G. Parsons ,2 T. R. Marsh,3 J. J. Fortney,4 andM. S. Marley5
1Department of Physics and Astronomy, University of Leicester, University Road, Leicester LE1 7RH, UK2Department of Physics and Astronomy, University of Sheffield, Sheffield S3 7RH, UK3Department of Physics, University of Warwick, Gibbet Hill Road, Coventry CV4 7AL, UK4Department of Astronomy and Astrophysics, University of California, Santa Cruz, CA 95064, USA5NASA Ames Research Center, MS-245-3, Moffett Field, CA 94035, USA
Accepted 2018 September 13. Received 2018 August 15; in original form 2018 June 14
ABSTRACTWe have observed the eclipsing, post-common envelope white dwarf–brown dwarf binary,SDSS141126.20+200911.1, in the near-IR with the HAWK-I imager, and present here the firstdirect detection of the dark side of an irradiated brown dwarf in the H band, and a tentativedetection in the Ks band. Our analysis of the light curves indicates that the brown dwarf islikely to have an effective temperature of 1300 K, which is not consistent with the effectivetemperature of 800 K suggested by its mass and radius. As the brown dwarf is already absorbingalmost all the white dwarf emission in the Ks band, we suggest that this inconsistency maybe due to the UV-irradiation from the white dwarf inducing an artificial brightening in the Ks
band, similar to that seen for the similar system WD0137-349B, suggesting this brighteningmay be characteristic of these UV-irradiated binaries.
Key words: binaries: eclipsing – brown dwarf – white dwarfs.
1 IN T RO D U C T I O N
Despite recent results reporting the discovery of brown dwarf com-panions to main sequence stars (e.g. Anderson et al. 2011; Siverdet al. 2012; Bayliss et al. 2017; Hodzic et al. 2018), there are stillonly 13 known to date, and they are very rare compared to planetaryor stellar companions to main sequence stars (Metchev & Hillen-brand 2004; Grether & Lineweaver 2006). As a result, there are veryfew systems known to have evolved from these binaries with Steeleet al. (2011) predicting only 0.5 per cent of white dwarfs havingbrown dwarf companions.
To date only nine post-common envelope systems have beenconfirmed: GD1400 (WD+L6, P = 9.98 h; Farihi & Christo-pher 2004; Dobbie et al. 2005; Burleigh et al. 2011), WD0137-349 (WD+L6-L8, P = 116 min; Burleigh et al. 2006; Maxtedet al. 2006), WD0837+185 (WD+T8, P = 4.2 h; Casewell et al.2012), NLTT5306 (WD+L4-L7, P = 101.88 min; Steele et al.2013), SDSS J155720.77+091624.6 (WD+L3-L5, P = 2.27 h;Farihi, Parsons & Gansicke 2017), SDSS J1205-0242 (WD+L0,P = 71.2 min; Parsons et al. 2017; Rappaport et al. 2017), SDSSJ1231+0041 (WD+M/L, P = 72.5 min; Parsons et al. 2017),EPIC212235321 (WD+L5, P = 68 min; Casewell et al. 2018) andSDSS J141126.20+200911.1, hereafter SDSS1411+2009 (WD+T5,
� E-mail: [email protected]
P = 121.73 min; Beuermann et al. 2013; Littlefair et al. 2014). Allof these systems have survived a phase of common-envelope evolu-tion, resulting in the close binary system. They are all detached, andlikely tidally locked, resulting in a brown dwarf that is irradiatedon one hemisphere, similar to the situation in most hot Jupiter ex-oplanets. Eventually, these white dwarf–brown dwarf binaries willbecome cataclysmic variables, such as SDSS1433+1011 in whichthe substellar donor was recently detected (Hernandez Santistebanet al. 2016).
Irradiated brown dwarfs are expected to have very similar atmo-spheres to irradiated exoplanets, and have been described as the‘fourth corner’ of the parameter space containing irradiated exo-planets, solar system planets, and isolated brown dwarfs (Showman2016). For instance, Kelt-9b (Gaudi et al. 2017) is a 2.88 MJup
planet orbiting a ∼10 000 K star. This planet is expected to receive∼700 times more UV irradiation than a planet orbiting the nexthottest exoplanet host star (WASP-33). However, the primary starin the Kelt-9 system is still ∼3000 K cooler than SDSS1411+1011Aand ∼6500 K cooler than WD0137-349A. The brown dwarf com-panion in this latter system has been shown to have an atmospherethat is significantly affected by UV irradiation (Casewell et al. 2015;Longstaff et al. 2017). In fact, Kelt-9b has been shown to have aday-nightside temperature difference of ∼500 K, the same as theirradiated brown dwarf WD0137-349B, indicating poor heat re-distribution is present in both systems, despite their differences in
C© 2018 The Author(s)Published by Oxford University Press on behalf of the Royal Astronomical Society
Dow
nloaded from https://academ
ic.oup.com/m
nras/article-abstract/481/4/5216/5106362 by Leicester University Library user on 15 January 2019

The direct detection of SDSS1411+2009B 5217
internal temperature. Studying irradiated brown dwarfs can there-fore provide a useful proxy for exoplanet systems, especially toexplore the effects of UV irradiation and any resultant photochem-istry, as in general hot Jupiter host stars replicating the same con-ditions must be very large, making them challenging systems toobserve. One of the most recently discovered of the post-commonenvelope systems, and the first eclipsing system to be discovered,SDSS1411+2009, was discovered as part of the Catalina Sky Surveyby Drake et al. (2010). The substellar nature of the companion tothe white dwarf was confirmed by Beuermann et al. (2013). Whileits period is very similar to that of the well-studied WD0137-349,the white dwarf is cooler with Teff = 13 000 ± 300 K and log g =7.86 ± 0.07, giving a mass of 0.53 ± 0.03 M� (Littlefair et al.2014). The brown dwarf mass is calculated to be 50 ± 2 MJup, andhas an estimated spectral type of T5, derived from the secondary’smass. The z
′band eclipse and Ks excess presented in Littlefair et al.
(2014) were used to estimate the dayside spectral type to be betweenL7 and T1, suggesting significant irradiation.
2 O B S E RVAT I O N S A N D DATA R E D U C T I O N
We observed SDSSJ1411+2009 with the infrared imager HAWK-I(Kissler-Patig et al. 2008) on the VLT as part of programme 94.C-0032. The data were obtained on the nights of the 2015 April 04,2015 April 05, and the 2015 MArch 13 for J, H, and Ks, respec-tively. The seeing was 1′ in the J, and H bands and between 1.5′
and 2.5′ in the Ks band. We used the fast photometry mode, allow-ing us to window the detector and reduce the deadtime betweenframes to a few microseconds, and used exposure times of 5 s ineach of the J, H, and Ks bands. We observed using chip 4, andorientated the 128 pixel window to 120 deg to also observe a stan-dard star, 2MASS14112391+2008132 which was used to calibratethe photometry. The data were dark-subtracted, flat fielded, and ex-tracted using aperture photometry within the ULTRACAM pipeline(Dhillon et al. 2007).
3 R ESULTS
We used LROCHE, part of the LCURVE software to model the lightcurves (see Copperwheat et al. 2010 for a description). We sam-ple the posterior probability distributions for model parameters us-ing affine-invariant Markov-chain Monte Carlo (MCMC; Foreman-Mackey et al. 2013). We used the system parameters given in Beuer-mann et al. (2013) and Littlefair et al. (2014) to set priors on themass ratio, orbital period, angle of inclination, white dwarf temper-ature, and stellar radii. The covariance matrix from Littlefair et al.(2014) was used to create multivariate normal priors for the stellarradii and the inclination. Independent Gaussian priors were usedfor all other parameters. Since the light curves show evidence forred noise, presumably arising from instrumental systematics, we donot use the chi-squared statistic to estimate the likelihood. Insteadwe model the residuals from the LROCHE model using a Gaussianprocess with a Matern-3/2 kernel and use the likelihood of the resid-uals (see McAllister et al. 2017, for an example of this approach).Multiple, independent MCMC chains are run from different start-ing points, and we use the Gelman-Rubin diagnostic, applied tothe independent runs, to test for convergence. We also tested thatthe results were insensitive to the kernel function adopted for theGaussian process.
We adopt the limb darkening coefficients in Gianninas et al.(2013) for a 13 000 K, log g = 8.00 white dwarf for the y band, asthere are none available for the near-IR, although as this is within the
Raleigh–Jeans tail of the white dwarf spectrum, these coefficientsare not expected to deviate much from these values. Additionally,given the S/N of our data, any deviation will have a negligible effecton our fit.
The LROCHE model is used to measure the level of the reflectioneffect caused as the heated side of the brown dwarf moves intoview. The brightness temperature of an element on the companionis modelled as
T 4c,j =
[Tc
(gj
gpole
)β]4
+ αGjT4
wd,
where α is the fraction of the incident flux which is absorbed (i.e.α = 1 − A), where A is the albedo. gj is the surface gravity of theelement, gpole is the surface gravity at the pole, β is the gravity-darkening exponent, for which we adopted a value of 0.45. Gj isa geometric factor which accounts for the fraction of the WD fluxabsorbed by the companion, taking the full Roche geometry into ac-count. Tc and Twd are the black-body brightness temperatures of thecompanion and white dwarf, respectively. Because our observationsare within the Raleigh–Jeans tail of the white dwarf spectrum, thesurface brightness of a white dwarf differs from that of the same-temperature black-body by less than 5 per cent. The light curve of anirradiated binary in a single band constrains the ratio of brightnesstemperatures of the two components. Therefore, since a black-bodyis a reasonable description for the white dwarf, we can say thatusing Tc in the Planck function gives an accurate prediction of thesurface flux of the brown dwarf; these surface fluxes can be com-pared directly with surface fluxes predicted by irradiated models(Fig. 1). The posterior probability distributions for these models areshown in Figs A1 and A2.
Our model of the system in the H band predicts a nightsidetemperature of the brown dwarf of 1540+90
−70 K and the fraction of fluxfrom the white dwarf absorbed by the brown dwarf as 0.50 ± 0.06.The equivalent model for the Ks band predicts 1000 ± 500 K and0.80 ± 0.15. As the J band eclipse was not observed, we wereunable to fit a model to these data, and instead fitted a sine curveto the data to measure the reflection effect as was done in Casewellet al. (2015) for WD0137-349.
We detect the primary eclipse of the white dwarf in both the Hand Ks data (Figs 2 and 3). We do not detect the secondary eclipsein any of our data. Our model predicts that the secondary eclipsedepth is 0.8 per cent in the H band and 3 per cent in the Ks band,which is smaller than our photometric errors (∼0.05 mags in H, and0.2 mags in Ks), and as the secondary eclipse is predicted to last ∼4 min including ingress and egress, we cannot bin our data up to ahigh enough precision.
The primary eclipse is total, not unexpected, as brown dwarf radiiare typically comparable to that of Jupiter, while white dwarfs haveradii similar to that of the Earth, hence all the flux we detect isfrom the nightside of the brown dwarf at this point. This flux issignificantly non-zero in the H-band, making this the first directdetection of the dark side of an irradiated brown dwarf. The flux inthe Ks band is consistent with zero, which is reflected in our largeuncertainties on the Ks brightness temperature. Although our modelhas calculated an average nightside temperature in the Ks band, wehave chosen to give the nightside an upper limit of 1500 K to reflectthe zero flux.
In addition to the detection of the nightside of the brown dwarf, weare also able to calculate the magnitude of the dayside of the browndwarf due to the reflection effect in the system, causing sinusoidalvariations as the tidally locked brown dwarf orbits the white dwarf.
MNRAS 481, 5216–5222 (2018)
Dow
nloaded from https://academ
ic.oup.com/m
nras/article-abstract/481/4/5216/5106362 by Leicester University Library user on 15 January 2019

5218 S. L. Casewell et al.
Figure 1. JHKs band light curves phased on the ephemeris in Beuermann et al. (2013). The light curves have been offset for display purposes by 0.05 mJyin the H and J bands. The data have been plotted in 400 error-weighted flux bins for display purposes and the models are plotted with the red solid line. Theshaded-blue region represents the 1σ prediction of the binary model, plus the Gaussian process model of the systematics.
Figure 2. H-band light curve phased on the ephemeris in Beuermann et al.(2013), and zoomed in on the eclipse. The top panel shows the raw lightcurve and the binary plus Gaussian process model. The middle panel showsthe data with the Gaussian process subtracted, and the binary model alone.The bottom panel shows the residuals to the binary model, and the Gaussianprocess. The models are plotted with the red solid line, and zero flux ismarked by the dotted line.
The semi-amplitude of this variability is 0.0019 ± 0.0003 mJy in theH band, and 0.0039 ± 0.0006 mJy in the Ks band. This variabilityis slightly larger than that detected for the WD0137-349AB system(Casewell et al. 2015) which has a similar period, but a hotter, andless massive white dwarf (Teff = 16 500 K, M = 0.4 M� Maxtedet al. 2006), but the errors are large on these measurements.
We also used the MOLLY software package to search for anyemission lines from the brown dwarf in the 28 UVB and VISXSHOOTER spectra used to measure the radial velocity in Lit-tlefair et al. (2014). We did not detect Hα emission, as is seen forWD0137-349B (Maxted et al. 2006), or any other emission lines aswere detected by Longstaff et al. (2017) for the same system. As
Figure 3. Ks band light curve phased on the ephemeris in Beuermann et al.(2013), and zoomed in on the eclipse. Panels and plot markers are the sameas in Fig. 2.
SDSS1411+2009 is 3 mag fainter in the optical than the WD0137-349 system, we phase binned the data and combined the spectra inphase, but still did not detect any emission features from the browndwarf. The data from the NIR arm of XSHOOTER are of not goodenough quality to be used in any analysis.
4 D ISCUSSION
We calculated brightness temperatures for the dayside of the browndwarf for the J band using a model white dwarf spectrum and themethod detailed in Casewell et al. (2015). For the H and Ks bandswhere we have models of the system from LCURVE we generateda temperature map of the surface of the brown dwarf as was done
MNRAS 481, 5216–5222 (2018)
Dow
nloaded from https://academ
ic.oup.com/m
nras/article-abstract/481/4/5216/5106362 by Leicester University Library user on 15 January 2019
The direct detection of SDSS1411+2009B 5219
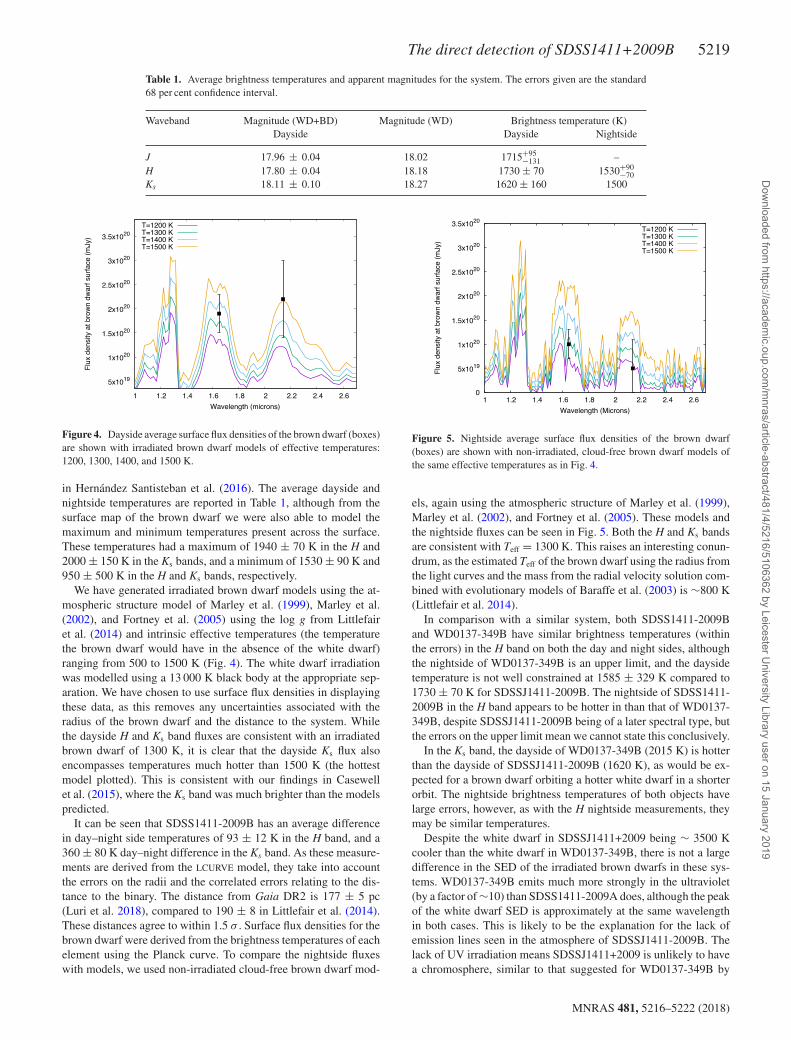
Table 1. Average brightness temperatures and apparent magnitudes for the system. The errors given are the standard68 per cent confidence interval.
Waveband Magnitude (WD+BD) Magnitude (WD) Brightness temperature (K)Dayside Dayside Nightside
J 17.96 ± 0.04 18.02 1715+95−131 –
H 17.80 ± 0.04 18.18 1730 ± 70 1530+90−70
Ks 18.11 ± 0.10 18.27 1620 ± 160 1500
Figure 4. Dayside average surface flux densities of the brown dwarf (boxes)are shown with irradiated brown dwarf models of effective temperatures:1200, 1300, 1400, and 1500 K.
in Hernandez Santisteban et al. (2016). The average dayside andnightside temperatures are reported in Table 1, although from thesurface map of the brown dwarf we were also able to model themaximum and minimum temperatures present across the surface.These temperatures had a maximum of 1940 ± 70 K in the H and2000 ± 150 K in the Ks bands, and a minimum of 1530 ± 90 K and950 ± 500 K in the H and Ks bands, respectively.
We have generated irradiated brown dwarf models using the at-mospheric structure model of Marley et al. (1999), Marley et al.(2002), and Fortney et al. (2005) using the log g from Littlefairet al. (2014) and intrinsic effective temperatures (the temperaturethe brown dwarf would have in the absence of the white dwarf)ranging from 500 to 1500 K (Fig. 4). The white dwarf irradiationwas modelled using a 13 000 K black body at the appropriate sep-aration. We have chosen to use surface flux densities in displayingthese data, as this removes any uncertainties associated with theradius of the brown dwarf and the distance to the system. Whilethe dayside H and Ks band fluxes are consistent with an irradiatedbrown dwarf of 1300 K, it is clear that the dayside Ks flux alsoencompasses temperatures much hotter than 1500 K (the hottestmodel plotted). This is consistent with our findings in Casewellet al. (2015), where the Ks band was much brighter than the modelspredicted.
It can be seen that SDSS1411-2009B has an average differencein day–night side temperatures of 93 ± 12 K in the H band, and a360 ± 80 K day–night difference in the Ks band. As these measure-ments are derived from the LCURVE model, they take into accountthe errors on the radii and the correlated errors relating to the dis-tance to the binary. The distance from Gaia DR2 is 177 ± 5 pc(Luri et al. 2018), compared to 190 ± 8 in Littlefair et al. (2014).These distances agree to within 1.5 σ . Surface flux densities for thebrown dwarf were derived from the brightness temperatures of eachelement using the Planck curve. To compare the nightside fluxeswith models, we used non-irradiated cloud-free brown dwarf mod-
Figure 5. Nightside average surface flux densities of the brown dwarf(boxes) are shown with non-irradiated, cloud-free brown dwarf models ofthe same effective temperatures as in Fig. 4.
els, again using the atmospheric structure of Marley et al. (1999),Marley et al. (2002), and Fortney et al. (2005). These models andthe nightside fluxes can be seen in Fig. 5. Both the H and Ks bandsare consistent with Teff = 1300 K. This raises an interesting conun-drum, as the estimated Teff of the brown dwarf using the radius fromthe light curves and the mass from the radial velocity solution com-bined with evolutionary models of Baraffe et al. (2003) is ∼800 K(Littlefair et al. 2014).
In comparison with a similar system, both SDSS1411-2009Band WD0137-349B have similar brightness temperatures (withinthe errors) in the H band on both the day and night sides, althoughthe nightside of WD0137-349B is an upper limit, and the daysidetemperature is not well constrained at 1585 ± 329 K compared to1730 ± 70 K for SDSSJ1411-2009B. The nightside of SDSS1411-2009B in the H band appears to be hotter in than that of WD0137-349B, despite SDSSJ1411-2009B being of a later spectral type, butthe errors on the upper limit mean we cannot state this conclusively.
In the Ks band, the dayside of WD0137-349B (2015 K) is hotterthan the dayside of SDSSJ1411-2009B (1620 K), as would be ex-pected for a brown dwarf orbiting a hotter white dwarf in a shorterorbit. The nightside brightness temperatures of both objects havelarge errors, however, as with the H nightside measurements, theymay be similar temperatures.
Despite the white dwarf in SDSSJ1411+2009 being ∼ 3500 Kcooler than the white dwarf in WD0137-349B, there is not a largedifference in the SED of the irradiated brown dwarfs in these sys-tems. WD0137-349B emits much more strongly in the ultraviolet(by a factor of ∼10) than SDSS1411-2009A does, although the peakof the white dwarf SED is approximately at the same wavelengthin both cases. This is likely to be the explanation for the lack ofemission lines seen in the atmosphere of SDSSJ1411-2009B. Thelack of UV irradiation means SDSSJ1411+2009 is unlikely to havea chromosphere, similar to that suggested for WD0137-349B by
MNRAS 481, 5216–5222 (2018)
Dow
nloaded from https://academ
ic.oup.com/m
nras/article-abstract/481/4/5216/5106362 by Leicester University Library user on 15 January 2019

5220 S. L. Casewell et al.
Longstaff et al. (2017). This is also suggested by the lack of Hα
emission lines in the optical spectra. However, despite this lackof emission lines, the same brightening is seen in the Ks for bothWD0137-349B and SDSSJ1411-2009B.
Our nightside brightness temperatures for SDSSJ1411-2009Bindicate that in the absence of any heat transport, the Teff of thebrown dwarf is 1300 K. Our LCURVE modelling of these light curvesgives an absorb parameter (the fraction of flux from the white dwarfabsorbed by the brown dwarf) of 0.50 ± 0.06 in the H band and0.80 ± 0.15 in the Ks band. These parameters mean that if onlyabsorption and reprocessing within the brown dwarf atmosphere isimportant, SDSS1411J-2009B must be absorbing 50 per cent of theH band flux and 80 per cent of the Ks band flux, in order to producethe dayside brightness temperatures.
However, the brown dwarf effective temperature as estimatedfrom the mass and radius is 800 K (Littlefair et al. 2014). If thisis the true effective temperature of the brown dwarf, were it anisolated object, then the absorb parameters must be even higherin order to produce enough heat transport to heat the nightside to1300 K. The absorb parameter for the Ks band is already closeto 100 per cent though, which would indicate there is poor energycirculation around the brown dwarf, supported by the 200 K day–nightside difference in the H band.
An additional factor that would affect estimates of temperatureand energy circulation, may be fluorescence or emission within thebrown dwarf atmosphere. We suggested this is present in WD0137-349B (Casewell et al. 2015), again causing brightening in the Ks
and 4.5 μm bands. If this emission is present, it will increase thedayside flux, particularly in the Ks band, meaning that the absorbparameter is artificially high. In particular it would mean that thebrown dwarf needs to absorb a smaller fraction of flux in orderto heat the nightside. This scenario is also potentially consistentwith a lower Teff of the brown dwarf. Emission from the daysidehas artificially increased the flux, leading to an overestimate of theeffective temperature.
Observations of Kelt-1b, a T2 dwarf orbiting a main sequence star(Siverd et al. 2012), seem to support the hypothesis of UV-inducedbrightening in the Ks band. Kelt-1b, orbiting a 6500 K F5V star lacksthe intense UV irradiation of the white dwarf irradiated systems,and does not show this brightening. Indeed eclipse measurementssuggest that this object fits very well with a field dwarf template(Croll et al. 2015; Beatty et al. 2017).
The only way we can, however, confirm this hypothesis of UV-induced emission is by obtaining spectrophotometry of SDSSJ1411-2009B with JWST. This would allow us to determine if at Ks and4.5 μm the brown dwarf looks like an isolated field object on thedayside, or whether UV-induced emission lines are present.
5 C O N C L U S I O N S
We have observed the close, post-common envelope binarySDSS1411+2009 with HAWK-I in the JHKs bands, and have di-rectly detected the brown dwarf in the H and Ks bands as it eclipsesits white dwarf companion. We have determined the brightnesstemperatures for the day and night-sides of the brown dwarf andmeasure a temperature difference of only ∼200 K, compared to∼500 K for WD0137-349B, a system with a similar period, buta hotter white dwarf primary. From comparing the surface fluxesto models of irradiated and non-irradiated brown dwarfs, we alsodetermine that in general, the models indicate the brown dwarf isconsistent with Teff = 1300 K, but that the mass and radius suggestan effective temperature that is much lower. As the brown dwarf is
already absorbing almost all the emission from the white dwarf inthe Ks band, this discrepancy suggests that an additional mechanismis making the Ks band brighter. This mechanism may be similar tothat suggested in WD0137-349B, hinting this may be a commontrait in these systems, and may be due to photochemistry.
AC K N OW L E D G E M E N T S
We thank Detlev Koester for providing the white dwarf models. Thiswork is based on observations made with ESO Telescopes at the LaSilla Paranal Observatory. This work also makes use of the whitedwarf models from Pierre Bergeron: ∼bergeron/CoolingModels.SLC acknowledges support from the University of Leicester, Col-lege of Science and Engineering. SPL is supported by STFC grantST/M001350/1, and TRM is supported by STFC grant ST/L000733.SGP acknowledges the support of the Leverhulme Trust.
REFERENCES
Anderson D. R. et al., 2011, ApJ, 726, L19Baraffe I., Chabrier G., Barman T. S., Allard F., Hauschildt P. H., 2003,
A&A, 402, 701Bayliss D. et al., 2017, AJ, 153, 15Beatty T. G., Madhusudhan N., Pogge R., Chung S. M., Bierlya A., Gaudi
B. S., Latham D. W., 2017, AJ, 154, 242Beuermann K. et al., 2013, A&A, 558, A96Burleigh M. R., Hogan E., Dobbie P. D., Napiwotzki R., Maxted P. F. L.,
2006, MNRAS, 373, L55Burleigh M. R. et al., 2011, in Schuh S., Drechsel H., Heber U., eds, AIP
Conf. Proc. Vol. 1331, Planetary Systems Beyond the Main Sequence.Am. Inst. Phys., New York,p. 262
Casewell S. L. et al., 2012, ApJ, 759, L34Casewell S. L. et al., 2015, MNRAS, 447, 3218Casewell S. L. et al., 2018, MNRAS, 476, 1405Copperwheat C. M., Marsh T. R., Dhillon V. S., Littlefair S. P., Hickman R.,
Gansicke B. T., Southworth J., 2010, MNRAS, 402, 1824Croll B. et al., 2015, ApJ, 802, 28Dhillon V. S. et al., 2007, MNRAS, 378, 825Dobbie P. D., Burleigh M. R., Levan A. J., Barstow M. A., Napiwotzki R.,
Hubeny I., 2005, A&A, 439, 1159Drake A. J. et al., 2010, preprint(arXiv:1009.3048)Farihi J., Christopher M., 2004, AJ, 128, 1868Farihi J., Parsons S. G., Gansicke B. T., 2017, Nature Astron., 1, 0032Foreman-Mackey D., Hogg D. W., Lang D., Goodman J., 2013, PASP, 125,
306Fortney J. J., Marley M. S., Lodders K., Saumon D., Freedman R., 2005,
ApJ, 627, L69Gaudi B. S. et al., 2017, Nature, 546, 514Gianninas A., Strickland B. D., Kilic M., Bergeron P., 2013, ApJ, 766, 3Grether D., Lineweaver C. H., 2006, ApJ, 640, 1051Hernandez Santisteban J. V. et al., 2016, Nature, 533, 366Hodzic V. et al., 2018, MNRAS, preprint(arXiv:1807.07557)Kissler-Patig M. et al., 2008, A&A, 491, 941Littlefair S. P. et al., 2014, MNRAS, 445, 2106Longstaff E. S., Casewell S. L., Wynn G. A., Maxted P. F. L., Helling C.,
2017, MNRAS, 471, 1728Luri X. et al., 2018, A&A, 616, A9Marley M. S., Gelino C., Stephens D., Lunine J. I., Freedman R., 1999, ApJ,
513, 879Marley M. S., Seager S., Saumon D., Lodders K., Ackerman A. S., Freedman
R. S., Fan X., 2002, ApJ, 568, 335Maxted P. F. L., Napiwotzki R., Dobbie P. D., Burleigh M. R., 2006, Nature,
442, 543McAllister M. J. et al., 2017, MNRAS, 464, 1353Metchev S. A., Hillenbrand L. A., 2004, ApJ, 617, 1330Parsons S. G. et al., 2017, MNRAS, 471, 976
MNRAS 481, 5216–5222 (2018)
Dow
nloaded from https://academ
ic.oup.com/m
nras/article-abstract/481/4/5216/5106362 by Leicester University Library user on 15 January 2019

The direct detection of SDSS1411+2009B 5221
Rappaport S. et al., 2017, MNRAS, 471, 948Showman A. P., 2016, Nature, 533, 330Siverd R. J. et al., 2012, ApJ, 761, 123Steele P. R., Burleigh M. R., Dobbie P. D., Jameson R. F., Barstow M. A.,
Satterthwaite R. P., 2011, MNRAS, 416, 2768Steele P. R. et al., 2013, MNRAS, 429, 3492
APPENDI X A : POSTERI OR PRO BA BI LI TYDI STRI BU TI ONS
Figure A1. Posteriorprobability distributions for model parameters obtained through fitting the H band light curve. See Section 3 for details of the modelused. Grey-scales and contours illustrate the joint probability distributions for each pair of parameters, while histograms show the marginalized probabilitydistribution for each individual parameter.
MNRAS 481, 5216–5222 (2018)
Dow
nloaded from https://academ
ic.oup.com/m
nras/article-abstract/481/4/5216/5106362 by Leicester University Library user on 15 January 2019

5222 S. L. Casewell et al.
Figure A2. Same as for Fig. A1 in the Ks band.
This paper has been typeset from a TEX/LATEX file prepared by the author.
MNRAS 481, 5216–5222 (2018)
Dow
nloaded from https://academ
ic.oup.com/m
nras/article-abstract/481/4/5216/5106362 by Leicester University Library user on 15 January 2019