the distribution and abundance of dugong and … · department of environment and natu ral...
TRANSCRIPT

www.denr.nt.gov.au
DEPARTMENT OF
ENVIRONMENT AND NATURAL RESOURCES
The distribution and
abundance of Dugong and
other marine megafauna in
the Northern Territory
November 2015

ii
Disclaimer: To the extent permitted by law, NT Government (including its employees)
excludes all liability to any person for any consequences, including but not limited to
all losses, damages, costs, expenses and any other compensation, arising directly or
indirectly from using this publication (in part or in whole) and any information or
material contained in it.
ISBN: 978-1-74-350120-7
Cite report as:
Groom RA, Dunshea GJ, Griffiths AD, and Mackarous K (2017). The distribution and
abundance of Dugong and other marine megafauna in Northern Territory, November 2015.
Department of Environment and Natural Resources, Darwin.

iii
Executive summary
The northern Australian coast is a region of national and international significance for
Dugongs. The distribution and abundance of Dugong along the coast varies and is generally
associated with extensive seagrass and algal habitats. The Northern Territory supports a
moderate population compared with the Torres Strait, which is the largest global population
with approximately 16,000 animals (± 3000) (Sobtzick et al. 2014).
Aerial surveys are an established method of collecting broad scale distribution and
abundance data for Dugongs. We conducted an aerial survey based on the established strip-
width transect methodology (Marsh and Sinclair 1989). The method accounts for biases in
Dugong counts caused by different detection probabilities among those observed (perception
bias) and the fact that not all Dugongs are near the water’s surface, so are unavailable to be
seen (availability bias). Sampling intensity of survey blocks ranged from 5 - 9% of the survey
area. The Dugong aerial survey occurred during October/November 2015 and surveyed over
93,145 km2 of the Northern Territory (up to 5.5 km seaward from the coast) and
Commonwealth’s coastal waters. This represents the first broad scale survey conducted in
20 years and the fifth aerial survey of Dugongs by the Northern Territory government in the
Gulf of Carpentaria.
We sighted a total of 194 Dugongs within transects, including 26 calves (13.4%). Mean group
size was 1.4 and maximum group size was six Dugongs. With perception and availability
correction factors applied, the population estimate was 8,176 (± 958) Dugongs. The Sir
Edward Pellew Island Group and Limmen Bight had the highest population estimates,
consistent with results from 2007 and 2014. The mean density of Dugongs across the survey
area was generally low at 0.13 Dugong km-2 and ranged from 0 – 0.85 Dugong km-2. The
density of Dugong for the Gulf of Carpentaria has not changed significantly across three
survey periods (2007, 2014 and 2015).
In addition to Dugongs, we recorded other marine megafauna during the survey. Marine
turtles were the most abundant animal recorded with 1,854 turtles observed on transect, they
were not identified to species level except for the leatherback turtle, which is distinctly larger
and darker than other species. Dolphins were abundant across the survey area with 1,497
individuals on transect. Five species of dolphin were recorded, although most observations
(1189 individuals) could not be identified to species. Of the dolphins that were identified to
species, the Australian Snubfin Dolphin (Orcaella heinshoni) was the most frequently
observed. Larger cetaceans including the False Killer Whales (Pseudorca crassidens) and

iv
Humpback Whales (Megaptera novangliae) were also recorded on survey, as well as other
marine megafauna including Whale Sharks (Rhincodon typus) and Manta Rays (Manta
birostris/alfredi).
This broad scale survey provides a regional context for the significant marine biodiversity
values of the Northern Territory coast. The high relative abundance of many marine
megafauna species, particularly coastal dolphins and turtles suggest that the Northern
Territory has some of the most important populations in Australia and the Asia-Pacific region.
These data will inform future research priorities for Dugong, marine turtles and cetaceans
and contribute towards improved management of these important species.

v
Contents
Executive summary iii
1. Introduction 1
1.1 Background 1
2. Methods 3
2.1 Study area 3
2.2 Study design 4
2.3 Data analysis 6
2.3.1 Dugong population size and density 6
2.3.2 Availability and perception bias 7
2.3.2 Quality assurance 7
3 Results 9
3.1 Environmental Conditions 9
3.2 Dugong sightings 10
3.2.1 Population size estimate trends 10
3.3 Observations of other marine megafauna 14
4 Discussion 17
5 Acknowledgments 20
6 References 21

vi
List of Figures
Figure 1 a) Flying height of 152 m relative to transect strip width of 200 m. b) Transect
markers fitted to the outside of the plane to demarcate transect width and zones within
transect (Sobtzick et al. 2013b). ............................................................................................. 4
Figure 2 Location of 2015 Dugong aerial survey transects and survey blocks, Northern
Territory. ............................................................................................................................. 8
Figure 3 Comparison of relative densities between Dugongs, inshore dolphins and turtles
observed on aerial survey along the NT coast with detection and perception correction
factors applied to Dugong and perception corrections factors applied to turtles and inshore
dolphins ........................................................................................................................... 16
List of Tables
Table 1 Water visibility categories used in the survey, based on Pollock et al. (2006). ..... 6
Table 2 Categories of environmental conditions (Pollock et al. 2006) and the mean
proportions experienced during the Dugong aerial survey .................................................... 10
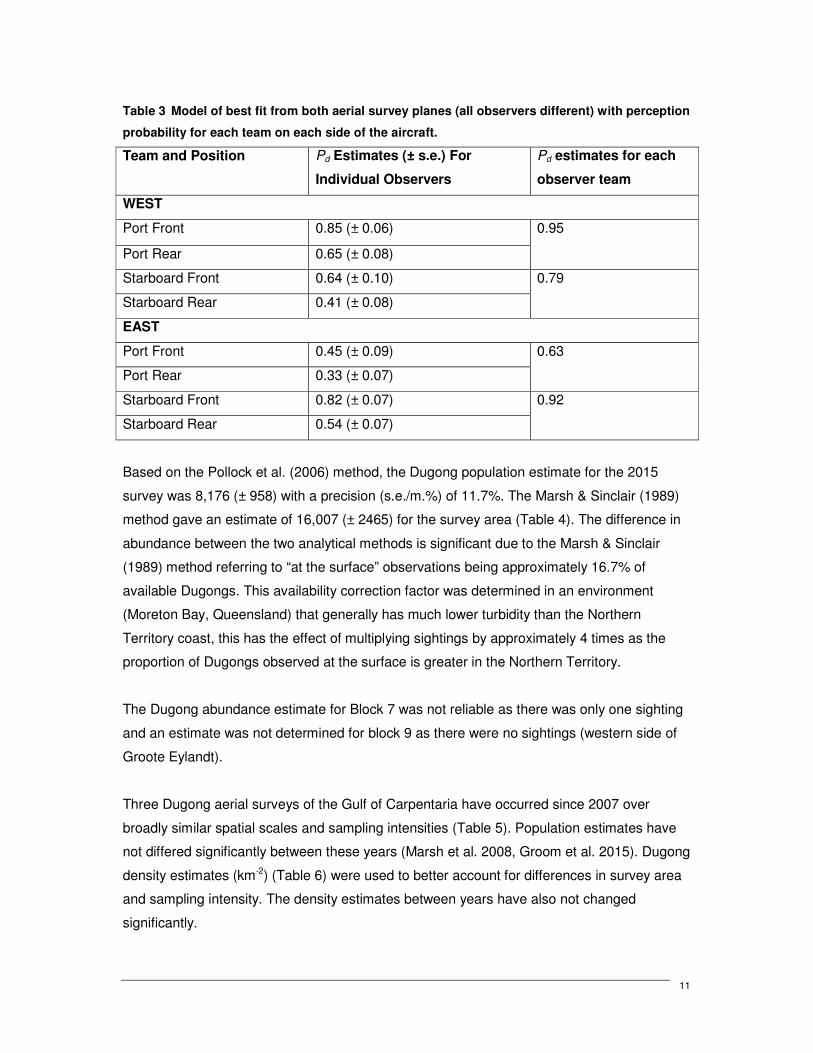
Table 3 Model of best fit from both aerial survey planes (all observers different) with
perception probability for each team on each side of the aircraft. ......................................... 11
Table 4 Summary of estimated Dugong abundance (± s.e.) using Pollock et al. (2006)
and Marsh & Sinclair (1989a) methods for the 2015 Dugong aerial survey. .......................... 12
Table 5 Comparison of Dugong population estimates (Pollock et al. 2006) across aerial
survey years in 2007, 2014 and 2015 ................................................................................... 13
Table 6 Estimated densities (km-2) of Dugong in the Gulf of Carpentaria, 2007, 2014 and
2015 based on Pollock et al. (2006) population abundance estimates .................................. 13
Table 7 Megafauna sightings other than Dugongs (dolphins, turtles, manta rays, whale
sharks and humpback whales) during the 2015 aerial survey. The number in parenthesis
represents animals observed outside the strip transect area on survey ................................ 15
Appendices
Appendix 1 Overview of survey flights undertaken in the Gulf of Carpentaria ................. 24
Appendix 1.1 Raw data sightings ...................................................................................... 26
Appendix 1.2 Details of tested models perception correction ............................................. 27
Appendix 2 Geo-referenced survey sightings ................................................................. 28
Appendix 2.1 Dugong sightings ......................................................................................... 29
Appendix 2.2 Dolphin sightings .......................................................................................... 30
Appendix 2.3 Turtle sightings ............................................................................................ 31
Appendix 2.4 Sea snake and manta ray sightings ............................................................. 32

Introduction
1
1. Introduction
Background
The Dugong, Dugong dugon, is a species of high cultural and conservation significance in
Australia and many other coastal regions globally. It is listed as Vulnerable to extinction by
the International Union for Conservation (IUCN 2015), a Migratory/Marine species under the
Commonwealth’s Environment Protection and Biodiversity Conservation Act and as Near
Threatened under the Northern Territory’s Territory Parks and Wildlife Conservation Act. The
Dugong has an extensive range spanning some 40 countries in Africa, the middle east, Asia
and Oceania including tropical and subtropical coastal waters, between about 26° and 27°
north and south of the equator (Nishiwaki and Marsh 1985). Dugong numbers are generally
declining throughout most of their range (Marsh et al. 2002) where they are subject to a
range of natural and human-related pressures, including entanglement in shark and fishing
nets (e.g. mesh and gill nets) (Marsh et al. 2005), marine debris (Perrin et al. 1996, Coates
2002, Marsh et al. 2002), loss and degradation of seagrass habitat (Preen and Marsh 1995,
Haynes et al. 2005, Marsh et al. 2011), unsustainable hunting (Marsh et al. 2002) and
collisions with boats (Groom et al. 2004, Marsh et al. 2004, Grech and Marsh 2008, Hughes
et al. 2008).
Monitoring population trends provides insight into population health and potential significant
impacts. Surveying for Dugongs in coastal waters of northern Australia is difficult due to
heterogeneous environmental conditions and Dugong diving behaviour, in particular
detection of Dugongs is limited by highly turbid or deep water (Pollock et al. 2006). Aerial
surveys using standardised techniques developed by Marsh and Sinclair (1989) have
provided much of the information used to manage Dugongs in Australia. The aerial survey
data analysis was improved by Pollock et al. (2006) to account for the spatial heterogeneity
in Dugong availability bias (related to environmental conditions on survey).
In the Northern Territory, Dugong aerial surveys have previously been undertaken by the
Northern Territory government and collaborators in the Gulf of Carpentaria in 1984-1985,
1997,2007 and 2014 (Bayliss and Freeland 1989, Parks and Wildlife Service 2003, Marsh et
al. 2008, Groom et al. 2015). These surveys have indicated that a significant Dugong
population exists in the Northern Territory with recent population estimates over an area
comparable to previous surveys ranging from 4786 (±1101) – 5784 (±767) Dugongs (Marsh
et al. 2008, Groom et al. 2015). The relative density of Dugong within Limmen Bight to Sir
Edward Pellew Islands and Blue Mud Bay ranks within the top eight Dugong density areas in

Introduction
2
Australia (Environment 2016). In the western region of the Northern Territory the distribution
and abundance of Dugongs is smaller and more variable than the Gulf of Carpentaria (Parks
and Wildlife Service 2003). More recently, Dugong aerial surveys have been undertaken over
the Darwin-Bynoe Harbour region as part of an INPEX-led Ichthys LNG Project Nearshore
Environmental Monitoring Plan (Cardno 2015b). This program used methods comparable to
those in other Dugong aerial surveys with a greater intensity to try to detect change in
Dugong populations.
The primary objective of this Dugong aerial survey was to improve current knowledge of
Dugong abundance and distribution in Northern Territory coastal waters and compare this
with historical survey efforts.

Methods
3
2. Methods
2.1 Study area
The aerial survey was conducted along the entire Northern Territory coastline which is
extensive (10,953 km) and shallow (<70 m), with the boundaries defined by the Gulf of
Carpentaria (139° longitude east) in Queensland and the Joseph Bonaparte Gulf in the west
(129° east longitude). The region is dynamic and characterised by monsoonal seasonality in
temperature, salinity, rainfall and wind regimes with the wet season occurring during
December to April and the dry season outside of this period. Tidal regimes in the survey area
vary from micro (tidal range: ~2 m) in the western Gulf of Carpentaria to macro in the
Bonaparte Gulf and Darwin (tidal range: ~8 m) (Duke 2006) with low wave energy allowing
for seagrass and mangrove communities to establish. The majority of the seagrass
communities occur along open coastlines that are characterised by depth-zoned species
distributions (intertidal and sub tidal) (Poiner et al. 1987), and are considered important
feeding areas for Dugongs (Parks and Wildlife Service 2003). Seagrass species in northern
Australia are known to be highly dynamic with respect to seasonality and annual variability
(Rasheed et al. 2008, Cardno 2015a). Northern Australia seagrasses are usually at
maximum biomass in the dry season and lowest in the wet season (Unsworth et al 2010).
Such seasonality is similar to patterns observed throughout the Indo-Pacific (Erfteheijer and
Herman 1994; McKenzie 1994; Rasheed 2004, Unsworth et al 2010).
Within the survey area, two distinct regions were sampled: a turbid near shore zone to a
depth of 15 - 20 m and deeper waters separated from the coastal zone by a boundary current
(Wolanski and Ridd 1990). The Dugong aerial survey was undertaken between October 9
and November 3, 2015. This maximises survey efficiency due to the low-wind period
(October-November) and being prior to heavy monsoonal rains that increase turbidity and
sea state conditions (Godfred-Spenning and Reason 2002). The total area surveyed was
approximately 93,145 km2 along the Northern Territory coastline with a sampling intensity
(the proportion of each block within transect strip-widths) between blocks ranging from 5 - 9
% (Figure 2). The survey area was generally over water less than 45 m deep and mostly less
than 15 m deep. The deepest waters in the survey area were approximately 60 – 88 m
occurring between the Cobourg Peninsula mainland and the eastern coast of Melville Island.
The dates that transects were flown are presented in Appendix 1.

Methods
4
2.2 Study design
Aerial survey methods were based on previously described strip-width dugong aerial survey
methods (Marsh & Sinclair 1989b; Pollock et. al. 2006). Two, six-seater, high-wing twin-
engine Partenavia 68B’s were flown along predetermined transects (5 km apart), at an
altitude of approximately 152 m (Figure 1a and 1b) and as close as possible to 100 knots
groundspeed. One plane started at the extreme east of the survey area (Northern Territory
border with Queensland) and the other at the extreme west (Northern Territory border with
Western Australia), meeting around the middle of the northern coastline at the completion of
the survey (east of Maningrida). The survey team in each aircraft consisted of a dual
observer team on each side of the aircraft and a team leader positioned next to the pilot. All
fauna observers were experienced in field identification of the marine mammal species in
northern Australia, with at least one member of each dual observer team (the mid-seat
observer) experienced (>45 - 200 hours on effort) in marine megafauna aerial surveys,
and/or dugong surveys, in northern Australia. All survey participants undertook a training
workshop and trial survey flight before the commencement of the survey.
Figure 1 a) Flying height of 152 m relative to transect strip width of 200 m. b) Transect
markers fitted to the outside of the plane to demarcate transect width and zones within
transect (Sobtzick et al. 2013b).
Dual observer teams on both sides of the aircraft scanned the water surface in a 200 m wide
strip, marked on either side using fiberglass rods attached to a thin artificial wing strut. Within
the transect, four 50 m transect zones were marked by colored tape (from the closest to the
most far away from the plane: the low, medium, high and very high zones), so the observers
could record the approximate lateral location of sightings in relation to the plane, which aids
in identifying recapture sightings within dual observer teams (i.e. distance zones sensu
Pollock et al 2006). Fauna observation data were recorded orally on separate audio tracks
for each team member (TASCAM DR-680), when the sighting was perpendicular to the

Methods
5
observer in relation to the transect (where possible). The team leader and observers all wore
high-noise environment headsets consisting of earphones and microphones (Beyer Dynamic,
DT 797 LTD) and all fauna observers were acoustically isolated but could communicate with
the team leader (using a custom signal splitter from the TASCAM DR-680). Observers in dual
teams were also visually separated by a curtain between mid- and rear-seats.
At the start of each flight, two handheld GPS units were activated, which stored the time and
aircraft position every second throughout the survey flight. Prior to commencement of the first
transect for each flight, the audio recording device was started at an exact time on the GPS
and the recording starting time noted, such that the time of an observation recording could be
referenced by the GPS position of the aircraft when the observation was made. During each
transect, observers scanned within the 200 m strip and recorded observations of the
following ‘datatypes’: dugongs, dolphins, turtles, stingrays, manta rays, whales and Whale
Sharks. For each observation, the datatype, species (if known/applicable), transect zone,
group size, number at the surface, the number of calves in dugong and dolphin groups
(Defined as <2/3 the size of adults and swimming in close proximity) and the ‘water clarity’
category was recorded. Water clarity categories were defined as per Pollock et al. (2006) and
Sobtzich et al. (2015) where category 1 = Clear water, bottom clearly visible; 2 = Variable
water quality, bottom visible but unclear; 3 = Clear water, bottom not visible; 4 = Turbid
water, bottom not visible. The level of confidence associated with the datatype and species
of all sightings was also recorded (certain, probable or guess), with the default being a
certain sighting, such that observers only needed to indicate a confidence level if they were
uncertain. The mid-seat observer also recorded the glare category (0 = none of field of view
in the transect affected, 1 = 1-25% of field of view in the transect affected, 2 = 25-50%
affected, 3 = >50% affected) at the start of the transect and updated it if there was any
change. All surveys were conducted in passing mode (i.e. continual flying along transect),
however if observers noted a group size of around 10 dugongs, the plane broke off the
transect and tried to circle the sighting area in an effort to gain an accurate count of the entire
group (this occurred once, outside of the transect).
The team leader recorded broad environmental conditions in the region at the start of each
survey flight gathered from air-traffic control and observation (cloud cover and height, wind
speed and direction, visibility) (visibility scale reference, Table 1). All environmental data was
entered inflight via a small laptop and custom database with single key short-cuts facilitating
fast data entry. Records were time-stamped according to the computer clock, which was
synchronized with GPS time. For each transect the start and end time was recorded and at
the start the cloud cover (in octas), Beaufort sea state (BSS) and starboard-side water clarity

Methods
6
were recorded, as well as glare on each side of the aircraft (from the mid-seat observers),
with subsequent update of these fields throughout the transect when they changed.
Following each survey, dual observer teams jointly viewed and listened to the both audio files
from each observer simultaneously using audio signal visualization software (Audacity 2.1.2,
www.audacityteam.org). All sighting data from both observers (excepting single-observer
sting ray sightings) was entered into a custom database. Recapture sightings were identified
by their proximity in observation time (within 6 seconds, usually <= 2 s) and the position in
the transect (the same, or adjoining distance zones). Recapture sightings were linked within
the database by a field referencing the paired record. This design of data management
facilitated easy recognition of single platform- and dual- (i.e., recapture) sightings, while also
allowing analysis of discrepancies in data collection within and between dual observer teams.
Following completion of the survey, all data sources (survey metadata, time-stamped GPS
data, time-stamped environmental data and time-stamped fauna observations) were
imported into a custom database and cross-referenced.
Table 1 Water visibility categories used in the survey, based on Pollock et al. (2006).
Visibility category Visibility of sea floor Water quality
1 Clearly visible Clear
2 Visible but unclear Opaque
3 Not visible Clear
4 Not visible Opaque
Where calves were present, these were recorded for Dugong and dolphins and were defined
as being less than two-thirds of the size of the cow and swimming in relatively closer
proximity to an adult. All animals were recorded when flying along transects including those
that were not within the demarcated transect strip. Outside of this strip, animals were called
‘inside’ (below) or ‘outside’ (above) the transect.
2.3 Data analysis
2.3.1 Dugong population size and density
Survey blocks were demarcated based on historical survey blocks or the broad scale
distribution of sightings. The data from each survey block were analysed to estimate Dugong
population size and density, following the methods developed by Marsh & Sinclair (1989) and
Pollock et al. (2006). These methods aim to correct for perception bias (animals visible in the
survey transect but missed by observers) and availability bias (animals not available to
Methods
7
observers because of water visibility/turbidity). All population estimates are provided with one
standard error (± s.e.).
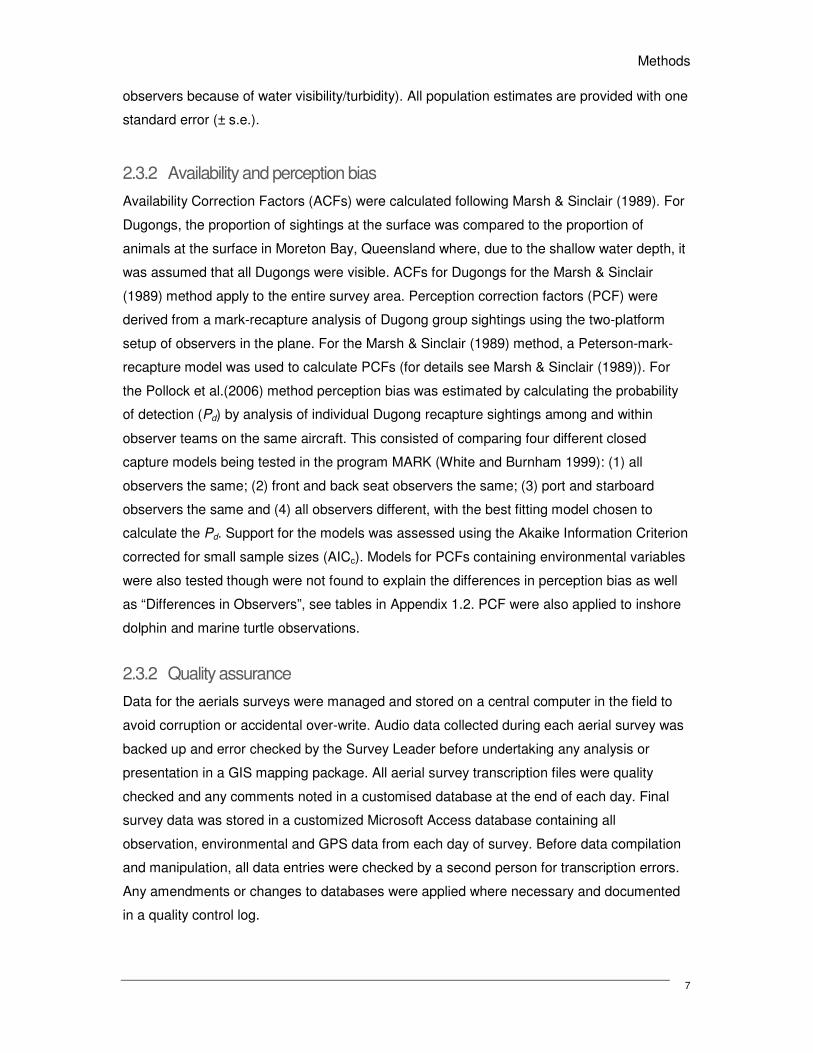
2.3.2 Availability and perception bias
Availability Correction Factors (ACFs) were calculated following Marsh & Sinclair (1989). For
Dugongs, the proportion of sightings at the surface was compared to the proportion of
animals at the surface in Moreton Bay, Queensland where, due to the shallow water depth, it
was assumed that all Dugongs were visible. ACFs for Dugongs for the Marsh & Sinclair
(1989) method apply to the entire survey area. Perception correction factors (PCF) were
derived from a mark-recapture analysis of Dugong group sightings using the two-platform
setup of observers in the plane. For the Marsh & Sinclair (1989) method, a Peterson-mark-
recapture model was used to calculate PCFs (for details see Marsh & Sinclair (1989)). For
the Pollock et al.(2006) method perception bias was estimated by calculating the probability
of detection (Pd) by analysis of individual Dugong recapture sightings among and within
observer teams on the same aircraft. This consisted of comparing four different closed
capture models being tested in the program MARK (White and Burnham 1999): (1) all
observers the same; (2) front and back seat observers the same; (3) port and starboard
observers the same and (4) all observers different, with the best fitting model chosen to
calculate the Pd. Support for the models was assessed using the Akaike Information Criterion
corrected for small sample sizes (AICc). Models for PCFs containing environmental variables
were also tested though were not found to explain the differences in perception bias as well
as “Differences in Observers”, see tables in Appendix 1.2. PCF were also applied to inshore
dolphin and marine turtle observations.
2.3.2 Quality assurance
Data for the aerials surveys were managed and stored on a central computer in the field to
avoid corruption or accidental over-write. Audio data collected during each aerial survey was
backed up and error checked by the Survey Leader before undertaking any analysis or
presentation in a GIS mapping package. All aerial survey transcription files were quality
checked and any comments noted in a customised database at the end of each day. Final
survey data was stored in a customized Microsoft Access database containing all
observation, environmental and GPS data from each day of survey. Before data compilation
and manipulation, all data entries were checked by a second person for transcription errors.
Any amendments or changes to databases were applied where necessary and documented
in a quality control log.

8
Figure 2 Location of 2015 Dugong aerial survey transects and survey blocks, Northern Territory.

9
3 Results
3.1 Environmental Conditions
The weather during the survey period was characteristic of the ‘build up’ period where it was
generally calm with occasional high winds and patchy rain. Higher winds were experienced in
offshore waters adjacent to Groote Eylandt and the Wessel Islands. Glare varied throughout
the survey relative to the direction of flight and sea state, and while glare was recorded
throughout the survey, it is not required for statistical analysis. The proportion of each block
at each combination of Beaufort sea state and visibility were determined for each survey
block as required by the Pollock et al. (2006) analysis. A large proportion of the survey was
conducted in conditions with relatively poor visibility (high turbidity)(Table 2). The
environmental conditions varied slightly between the east and west planes for the duration of
the survey. The eastern plane experienced Beaufort sea state (BSS) <=2 for ≈47% of
cumulative transect distance, BSS 3 for ≈42% and BSS 4 for ≈11%, whereas the western
plane had calmer conditions (BSS <=2 for ≈77% of cumulative transect distance, BSS 3 for
≈21% and BSS >=4 for ≈2%). Most waters surveyed were turbid, where the bottom could not
be discerned (i.e., water clarity ‘4’, ≈79% and ≈89% of cumulative transect distance for east
and west planes, respectively) with <1% of waters for both planes consisting of clear water
with the bottom clearly visible (i.e., water clarity ‘1’). Short sections of some transects were
flown in a Beaufort 4 sea state in the east and Beaufort 5 in the west - generally transects
further offshore, and these were considered sufficiently short and unlikely to be Dugong
habitat, to not warrant repeating. The maximum-recorded wind speed on survey was 15
knots. Cloud cover and glare were also recorded on survey but are not required for the
population analysis.

10
Table 2 Categories of environmental conditions (Pollock et al. 2006) and the mean proportions
experienced during the Dugong aerial survey
Category Turbidity
Beaufort Sea
State
Length Surveyed
(km) Mean Proportion
1 1 <=2 127.1 0.02
2 2 <=2 390.8 0.03
3 3 <=2 1105.1 0.06
4 4 <=2 7562.2 0.51
5 1 >2 8.4 0
6 2 >2 126.5 0.01
7 3 >2 625.3 0.04
8 4 >2 4905.1 0.33
3.2 Dugong sightings
A total of 151 Dugong groups, consisting of 229 individuals (including 26 calves) was sighted
on the Northern Territory survey (in and out of transect). The mean group size for the survey
area was 1.4 (SD = 0.7) Dugongs. The largest herd observed comprised eight individuals
(not within transect). Unless otherwise stated, the sightings reported here include those
animals observed within the transect strip.
3.2.1 Population size estimate trends
Based on the closed-capture models, the model of best fit in each aircraft was “all observers
different”. This model indicated that double-observer teams had combined detection
probabilities of 0.63- 0.95. The individual observer and observer team probability estimates
are provided in Table 3.
11
Table 3 Model of best fit from both aerial survey planes (all observers different) with perception
probability for each team on each side of the aircraft.
Team and Position Pd Estimates (± s.e.) For
Individual Observers
Pd estimates for each
observer team
WEST
Port Front 0.85 (± 0.06) 0.95
Port Rear 0.65 (± 0.08)
Starboard Front 0.64 (± 0.10) 0.79
Starboard Rear 0.41 (± 0.08)
EAST
Port Front 0.45 (± 0.09) 0.63
Port Rear 0.33 (± 0.07)
Starboard Front 0.82 (± 0.07) 0.92
Starboard Rear 0.54 (± 0.07)
Based on the Pollock et al. (2006) method, the Dugong population estimate for the 2015
survey was 8,176 (± 958) with a precision (s.e./m.%) of 11.7%. The Marsh & Sinclair (1989)
method gave an estimate of 16,007 (± 2465) for the survey area (Table 4). The difference in
abundance between the two analytical methods is significant due to the Marsh & Sinclair
(1989) method referring to “at the surface” observations being approximately 16.7% of
available Dugongs. This availability correction factor was determined in an environment
(Moreton Bay, Queensland) that generally has much lower turbidity than the Northern
Territory coast, this has the effect of multiplying sightings by approximately 4 times as the
proportion of Dugongs observed at the surface is greater in the Northern Territory.
The Dugong abundance estimate for Block 7 was not reliable as there was only one sighting
and an estimate was not determined for block 9 as there were no sightings (western side of
Groote Eylandt).
Three Dugong aerial surveys of the Gulf of Carpentaria have occurred since 2007 over
broadly similar spatial scales and sampling intensities (Table 5). Population estimates have
not differed significantly between these years (Marsh et al. 2008, Groom et al. 2015). Dugong
density estimates (km-2) (Table 6) were used to better account for differences in survey area
and sampling intensity. The density estimates between years have also not changed
significantly.

12
The raw data on sighting conditions, Dugong sightings, group sizes and perception correction
factors are listed in Appendix 1.1. Appendix 1.2 presents maps of the geo-referenced
Dugong sightings.
Table 4 Summary of estimated Dugong abundance (± s.e.) using Pollock et al. (2006) and
Marsh & Sinclair (1989a) methods for the 2015 Dugong aerial survey.
Block Area (km2) Sampling
Intensity
(%)
Dugong
Density
km-2
Mean Group
Size (SD)1
Pollock
Est (± s.e.)
Marsh and
Sinclair Est (±
s.e.)
WEST_1 4769.49 0.07 0.07 1.43 (0.79) 317 (±130) 512 (±255)
WEST_2 3725.03 0.07 0.09 1.67 (1.63) 322 (±119) 520 (±226)
WEST_3 5044.91 0.07 0.02 1.33 (0.58) 122 (±39) 274 (±151)
WEST_4 3800.15 0.07 0.11 1.36 (0.92) 421 (±131) 899 (±510)
WEST_5 5950.91 0.08 0.11 1.28 (0.46) 644 (±164) 1484 (±559)
WEST_6 5848.27 0.08 0.02 1.00 (0.00) 96 (±29) 270 (±192)
WEST_7 2319.55 0.08 0.08 1.38 (0.74) 186 (±88) 503 (±305)
WEST_8 3158.57 0.08 0.04 1.17 (0.41) 130 (±47) 352 (±270)
WEST_9 3745.67 0.09 0.09 2.17 (2.40) 326 (±113) 457 (±209)
MID 7184.98 0.05 0.01 1.00 (0.00) 84 (±25) 253 (±176)
EAST_1 1842.13 0.05 0.25 1.09 (0.30) 460 (±137) 1472 (±768)
EAST_2 2830.65 0.05 0.85 1.77 (1.11) 2404 (±785) 4005 (±1555)
EAST_3 3076.93 0.05 0.37 1.18 (0.39) 1129 (±352) 2564 (±1244)
EAST_4 3052.14 0.05 0.10 3.00 (1.41) 303 (±106) 303 (±293)
EAST_5 4413.05 0.05 0.17 2.00 (1.29) 745 (±196) 1056 (±410)
EAST_6 2460.31 0.05 0.14 1.20 (0.45) 344 (±90) 797 (±488)
EAST_7 3009.94 0 NA - -
EAST_9 3055.38 0 NA - -
NE-Block 23857.34 0.06 0.01 1.5 (0.71) 143 (±35) 285 (±202)
TOTAL 93,145 8,176 (±958) 16,007 (±2,465)

13
Table 5 Comparison of Dugong population estimates (Pollock et al. 2006) across aerial
survey years in 2007, 2014 and 2015
Table 6 Estimated densities (km-2
) of Dugong in the Gulf of Carpentaria, 2007, 2014 and
2015 based on Pollock et al. (2006) population abundance estimates
A T-test was calculated on the difference between mean Dugong density from 2007 and
2015 aerial surveys. The change in dugong density in the Gulf of Carpentaria between these
years was not significant according to Welch's t-test, t(0.60) = 9.4 p = 0.56.
Year 2007 2014 2015
Block Area
(km2)
Sampling
Intensity
Pop. Est.
(± s.e.)
Area
(km2)
Sampling
Intensity
Pop. Est.
(± s.e.)
Area
(km2)
Sampling
Intensity
Pop. Est.
(± s.e.)
2 2046 0.11 1702
(± 936) 2921 0.08
1379
(± 241) 2831 0.05
4005
(±1555)
3 1631 0.09 612
(± 281) 2814 0.08
1722
(± 501) 3077 0.05
2564
(±1244)
4 1937 0.09 555
(± 251) 3045 0.08
739
(± 184) 3052 0.05
303
(±293)
5 3734 0.09 994
(± 372) 4586 0.08
648
(± 270) 4413 0.05
1056
(±410)
6 2021 0.09 534
(± 165) 2198 0.08
598
(± 345) 2460 0.05
797
(±488)
7 2435 0.10 389
(± 174) 2852 0.08
698
(± 233) 3010 0.05 0
Total 13804 4786
(± 1101) 18416
5784
(± 767) 18843
4925
(± 893)
Block 2007 2014 2015
2 0.83 0.47 0.85
3 0.38 0.61 0.37
4 0.29 0.24 0.10
5 0.27 0.14 0.17
6 0.27 0.27 0.14
7 0.16 0.24 0
Mean Dugong density (km2) 0.37 0.33 0.27

14
3.3 Observations of other marine megafauna
In addition to Dugong sightings, we recorded a range of marine megafauna (Table 7). Marine
turtles were the most abundant animal recorded with 1,857 turtles observed on transect. With
exception of the Leatherback (which is distinctively larger and darker than other species),
turtles were not identified to species. Five species of dolphin were recorded though most
(approximately 50%) were not identified to species. Rates of dolphin species identification
were different between survey planes because of observer experience. Dolphins were
abundant across the survey range with 1,393 individuals on transect. Of the dolphins that
could be identified, the Snubfin Dolphin (Orcaella heinsohni) was the most prevalent marine
mammal species encountered with 243 individuals observed (in and out of transect
combined). We recorded 32 False Killer Whales (Pseudorca crassidens), and three
Humpback Whales (off transect). Other animals observed on transect included 93 Manta
Rays and three Whale Sharks.
Density estimates of observed Dugongs, turtles and inshore dolphins were compared across
the NT coast (Figure 3). Availability and detection correction factors were applied to Dugong
sightings and detection only, whereas (perception bias) correction factors were applied to
dolphin (certain and probable sightings) and turtle observations. False Killer Whales and
Dwarf Spinner Dolphins were excluded from the density estimates as they were generally
found in deeper water, in larger groups making them incomparable. The two highest density
areas for turtles were the same as those for Dugongs - the Sir Edward Pellew Island Group
and Limmen Bight. Inshore dolphins were found to be most dense in blocks west of Groote
Eylandt.

15
Table 7 Megafauna sightings other than Dugongs (dolphins, turtles, manta rays, whale sharks
and humpback whales) during the 2015 aerial survey. The number in parenthesis represents
animals observed outside the strip transect area on survey
Animal/Species # of
Groups
# of
Individuals
# of
Calves
%
Calves
Avg.
Group
Size
Australian Snubfin Dolphin
Orcaella heinsohni 45 (5) 206 (37) 10 4.6 3.4
Dwarf Spinner Dolphin
Stenella longirostris
rosieventris
10 146 (2) 1 0.7 12.8
Bottlenose Dolphin
Tursiops aduncus 18 77 (1) 5 6.1 4
Australian Humpback Dolphin
Sousa sahulensis 10 (2) 18 (7) 3 14.3 1.8
False Killer Whale
Pseudorca crassidens 2 32 1 3.0 17.5
Unidentified dolphin spp. 383 (60) 1018 (171) 46 (5) 4.3 2.7
Humpback Whale
Megaptera novaengliae (2) (3) 0 0 1.5
Marine turtles 1674 (154) 1854 (157) - - 1.1
Leatherback Turtle 2 (1) 2 (1) - - 1
Whale Shark
Rhincodon typus 3 (1) 3 (1) - - 1
Manta Ray 78 (32) 93 (48) - - 1.2

16
Figure 3 Comparison of relative densities between Dugongs, inshore dolphins and turtles observed on aerial survey along the NT coast with
detection and perception correction factors applied to Dugong and perception corrections factors applied to turtles and inshore dolphins
0
0.2
0.4
0.6
0.8
1
1.2
1.4
1.6
1.8
Ind
ivid
ua
ls p
er
km
2
Turtles
Inshore dolphins
Dugongs

17
4 Discussion
Dugong population abundance in 2015 for the NT survey area was estimated to be 8,176 (±
958) Dugongs using the Pollock et al. (2006) method. This analytical method improves the
survey precision by 3.7% compared with the Marsh & Sinclair method (Marsh and Sinclair
1989) which does not account for heterogeneity of environmental variables known to affect
Dugong availability to observers. The Pollock et al. (2006) method is considered superior
because the assumptions are more reasonable and more easily met in the field. The method
attempts to correct for availability bias (animals not available to observers because of water
turbidity), and perception bias (animals visible in the survey transect but missed by
observers). The Pollock et al. (2006) method, unlike Marsh and Sinclair (1989) uses
environment-specific correction factors for availability bias, addressing the spatial
heterogeneity in sighting conditions within each survey whereas the Marsh and Sinclair
(1989) method averages these conditions within surveys and only corrects for differences in
availability bias between surveys (Marsh et al. 2008). In addition, observers find it difficult to
determine whether the Dugongs sighted are at the surface (or not), as required by the Marsh
and Sinclair (1989) method.
Despite efforts to account for difficulties with detection, the availability bias remains a
considerable yet consistent source of error. It is likely that dive behaviour of Dugongs is
influenced by water clarity, tidal conditions and water depth, and that the dive behaviour of
individual Dugongs within a herd is not independent (Meager et al. 2013). It has recently
been argued that systematic variation in dive profiles could lead to biased aerial survey
estimates in areas with heterogeneous bathymetry (Hagihara et al. 2014). The resultant
effect of this inaccuracy of density estimates is that only a large change in abundance can be
detected, and that small declines (or increases) over time are likely to be missed (Taylor et
al. 2007). These uncertainties decrease survey precision and hence the statistical power to
detect changed in Dugong distribution and abundance.
The Dugong population abundance estimate is considered to be highly conservative as only
Dugong sightings categorised as ‘certain’, within transect markers, were used to develop the
population abundance estimates. The turbidity of Northern Territory coastal waters is a
significant limiting variable for aerial surveys in these waters. Dugong diving and surfacing
behaviour in this environment has not been investigated to date though would likely inform
improved population estimates, as has been achieved for Dugong population estimates in
Queensland (Hagihara et al. 2014).

18
Direct comparison of all previous NT Dugong aerial surveys is not possible as survey
methods differ. However, Dugong aerial surveys have been undertaken in the Gulf of
Carpentaria (GoC) using comparable methods and analysis since 2007. The GoC provides
an important reference for the NT’s Dugong population as this region comprises ~60% of
Dugong found in the Northern Territory. Since the implementation of standardised surveys,
there has been no significant difference in population density estimates detected for this
region with density ranging from 0.27 (2015) – 0.37 (2007) Dugong per km2. Furthermore,
time series analysis by Marsh et al. (2008) indicated that no significant change in the GoC
Dugong population had occurred between surveys in 1994 and 2007 suggesting the Dugong
population in the GoC has likely been stable for over 20 years.
Dugong presence is generally related to the presence of seagrass; this dependency infers a
relationship between Dugong population dynamics and seagrass availability (Meager et al.
2013, Cardno 2015b). Spatially explicit local declines in Dugong density and reproductive
potential have been attributed to major seagrass loss events (Preen and Marsh 1995, Gales
et al. 2004, Marsh and Kwan 2008, Meager and Limpus 2014). Seagrass presence is
generally constrained to shallow coastal environments as their growth is limited by light
availability, more so than algae species (Dennison 1987, Orth et al. 2006). Seagrasses have
a low tolerance to prolonged low-light conditions (Longstaff et al. 1999) and elevated
temperature (Collier et al. 2011, McKenzie et al. 2012, Collier and Waycott 2014, Pedersen
et al. 2016). This implies that processes contributing to these environmental changes, such
as severe weather events, disturbance of sediments, eutrophication and flooding may affect
Dugong populations and other species directly dependent upon seagrass ecosystem health.
Recent observations of extensive mangrove dieback in Limmen Bight correlate with extreme
warming and climate events in the region (Wild 2016). The extent of this dieback is
unprecedented and raises concerns for the seagrass habitat in the region and the
consequential impacts on local Dugong and turtle populations. Therefore, it will be important
to monitor the health of seagrass in this region.
With the exception of Darwin Harbour, seagrass habitats within the NT are not monitored.
Surveys by Poiner et al.(1987) and Roelofs et al. (2005) recorded seagrass presence
throughout the GoC, westward to Van Diemen Gulf. Within these regions, seagrass and
Dugong presence broadly correlate. If seagrass is also impacted by the extreme climate
events, localised density declines of Dugong are likely (Meager and Limpus 2014). However,
establishing a clear link between weather-related disturbance and Dugong abundance is
confounded by large-scale movements undertaken by Dugongs from impacted areas (Preen

19
and Marsh 1995, Holley et al. 2006, Sobtzick et al. 2013a). Deutsch et al. (2003) suggest
large-scale movements by Sirenians have evolved in response to seasonal changes in
environmental variables such as temperature, water levels, salinity and variability of forage.
The Sir Edward Pellew Islands and Limmen Bight region (survey Blocks 2 and 3) has
consistently had the highest Dugong density estimates recorded from aerial surveys (Marsh
et al. 2008, Groom et al. 2015). This survey confirms the significance of these blocks for
Dugongs within the GoC and justifies concern for the potential impacts to Dugong and turtles
in the GoC because of seagrass dieback. Impacts to the Dugong population may manifest as
movements to un-affected areas, animals presenting with reduced body fat, increased
mortality and reduced reproductive capacity.
Dugongs are particularly vulnerable to mortality as adults (Marsh et al. 2011) given their life
history characteristics of long lifespans (greater than 70 years), long gestation (12–14
months), single offspring, long intervals between births (more than 2.5 years), prolonged
periods until sexual maturity (6–17 years), and high and temporally stable adult survival
(Marsh et al. 1984). Adult survival is the most important determinant of population growth
(Marsh et al. 2011). The maximum rate of population increase under optimum conditions
when natural mortality is low is approximately 5 per cent per year. The maximum sustainable
mortality rate of adult females from anthropogenic activities (e.g. fishing interactions, hunting,
boat strike) is approximately 1 or 2 per cent (Marsh et al. 1997, Heinsohn et al. 2004, Marsh
et al. 2004, Marsh et al. 2015) and lower when food supplies are low (Marsh et al. 2002;
Marsh & Kwan 2008). Pressures that cause Dugong mortality are therefore of potential
concern if such pressures occur over a wide geographic area, even if the magnitude of the
pressures is uncertain (Marsh et al. 2015).
The survey recorded Dugong calves to be within a healthy and comparable range. The calf
count from this survey was 13.4%; greater than the range of mean estimates previously
observed for the GoC and Northern Great Barrier Reef region of 5.3% and 11.4%
respectively (Marsh et al. 2008, Groom et al. 2015). The mean Dugong group size for the
survey (in transect) was 1.4 (SD = 0.7), comparable to the 2007 mean (1.4).
The survey team’s experience on Dugong aerial surveys ranged from highly experienced to
limited. Nonetheless, the probability of observers sighting Dugongs given they were available
for detection was high for the survey teams. The Dugong population estimate from this
survey is a standardised under-estimate given recent research findings that investigated
Dugong surfacing and diving behaviour. Hagihara et al. (2014) used Dugong telemetry data
acquired under varying environmental conditions and determined the availability bias for

20
Dugongs is greater in deeper waters. This aerial survey data have not been modelled with
coastal bathymetry but application of the Hagihara et al. (2014) method would further
improve Dugong population estimates for this area.
Dugong aerial surveys allow for standardised collection of spatial and temporal data to
determine abundance, density and distribution of Dugongs and other marine megafauna.
Aerial surveys are appropriate for the collection of broad-scale data to meet management
objectives that require an understanding of ecological responses and population trends. The
data acquired from these surveys will be used to guide future research and management.
5 Acknowledgments
The research was funded by the INPEX-led Ichthys LNG Project. We wish to thank the
Thammarrurr, Tiwi, li-Anthawirriyarra, Garig Gunak Barlu, Anindilyakwa, Mardbalk and
Crocodile Islands coastal ranger groups for their assistance with survey logistics.
Appreciation and thanks to the aerial survey team who worked well in the heat and confined
space of the survey plane. We are grateful to the DLRM staff that assisted in administration,
survey design, gear preparation and data management. We thank James Cook University for
their technical guidance and provision of transect markers. The Dugong aerial survey was
authorised by the Northern Land Council under Permit ID: 58740.

21
6 References
Bayliss, P., and W. J. Freeland. 1989. Seasonal distribution and abundance of dugongs in
the western Gulf ofCarpentaria. Australian Wildlife Research 16:141-149.
Cardno. 2015a. Seagrass monitoring post-dredging report.
Cardno. 2015b. Turtle and dugong monitoring post-dredging report.
Coates, J. 2002. Sea Turtle and Dugong of the south-west Gulf of Carpentaria: Incorporating
traditional knowledge into sustainable resource management. Unpublished report to
Environment Australia.
Collier, C., S. Uthicke, and M. Waycott. 2011. Thermal tolerance of two seagrass species at
contrasting light levels: Implications forfuture distribution in the Great Barrier Reef.
Limnology and Oceanography 56:2200-2210.
Collier, C., and M. Waycott. 2014. Temperature extremes reduce seagrass growth and
induce mortality. Marine Pollution Bulletin 83:483-490.
Dennison, W. C. 1987. Effects of light on seagrass photosynthesis, growth and depth
distribution. Aquatic Botany 27:15-26.
Deutsch, C. J., J. P. Reid, R. K. Bonde, D. E. Easton, and H. I. Kochman. 2003. Seasonal
movements, migratory behavior, and site fidelity of West Indian manatees along the
Atlantic Coast of the United States. Wildlife monographs:1-77.
Duke, N. 2006. Australia's Mangroves. University of Queensland, Centre for Marine Studies,
Brisbane.
Environment, D. o. t. 2016. Dugong dugon - Dugong; SPRAT profile. Commonwealth of
Australia.
Gales, N., R. D. McCauley, J. Lanyon, and D. Holley. 2004. Change in abundance of
dugongs in Shark Bay, Ningaloo and Exmouth Gulf, Western Australia: evidence for
large-scale migration. Wildlife research (East Melbourne) 31:283-290.
Godfred-Spenning, C. R., and C. J. C. Reason. 2002. Interannual variability of lower-
tropospheric moisture transport during the Australian monsoon. International Journal
of Climatology 22:509-532.
Grech, A., and H. Marsh. 2008. Rapid Assessment of Risks to a Mobile Marine Mammal in
an Ecosystem-Scale Marine Protected Area. Conservation Biology 22:711-720.
Groom, R., G. Dunshea, and A. Griffiths. 2015. The distribution and abundance of Dugong
and other marine megafauna in the Gulf of Carpentaria, Northern Territory, November
2014., Department of Land Resource Management; Flora and Fauna Division,
Berrimah.
Groom, R., I. Lawler, and H. Marsh. 2004. The risk to dugongs of vessel strike in the
Southern Moreton Bay Islands area of Moreton Bay James Cook University.
Hagihara, R., R. E. Jones, A. Grech, J. M. Lanyon, J. K. Sheppard, and H. Marsh. 2014.
Improving population estimates by quantifying diving and surfacing patterns: A
dugong example. Marine Mammal Science 30:348-366.
Haynes, D., S. Carter, C. Gaus, J. Müller, and W. Dennison. 2005. Organochlorine and
heavy metal concentrations in blubber and liver tissue collected from Queensland
(Australia) dugong (Dugong dugon). Marine Pollution Bulletin 51:361-369.
Heinsohn, R., R. C. Lacy, D. B. Lindenmayer, H. Marsh, and D. Kwan. 2004. Unsustainable
harvest of dugongs in Torres Strait and Cape York (Australia) waters: two case
studies using population viability analysis. Animal Conservation 7:417-425.

22
Holley, D. K., I. R. Lawler, and N. J. Gales. 2006. Summer survey of dugong distribution and
abundance in Shark Bay reveals additional key habitat area. Wildlife Research
33:243-250.
Hughes, A. R., S. L. Williams, C. M. Duarte, K. L. Heck, and M. Waycott. 2008. Associations
of concern: declining seagrasses and threatened dependent species. Frontiers in
Ecology and the Environment 7:242-246.
Longstaff, B. J., N. R. Loneragan, M. J. O'Donohue, and W. C. Dennison. 1999. Effects of
light deprivation on the survival and recovery of the seagrass Halophila ovalis (R.Br.)
Hook. Journal of Experimental Marine Biology and Ecology 234:1-27.
Marsh, H., D. a. Glenn, G. Neil, and L. Baden. 2005. Historical Marine Population Estimates:
Triggers or Targets for Conservation? The Dugong Case Study. Ecological
Applications 15:481-492.
Marsh, H., J. Grayson, A. Grech, R. Hagihara, and S. Sobtzick. 2015. Re-evaluation of the
sustainability of a marine mammal harvest by indigenous people using several lines
of evidence. Biological Conservation 192:324-330.
Marsh, H., A. Grech, A. Hodgson, and S. Delean. 2008. Distribution and abundance of the
dugong in Gulf of Carpentaria waters: a basis for cross-jurisdictional conservation
planning and management. Australian Centre for Applied Marine Mammal Science.
Marsh, H., A. Harris, and I. Lawler. 1997. The Sustainability of the Indigenous Dugong
Fishery in Torres Strait, Australia/Papua New
Guinea. Society for Conservation Biology 11:1375-1386.
Marsh, H., G. E. Heinsohn, and L. M. Marsh. 1984. Breeding cycle, life history and population
dynamics of the dugong, Dugon dugon (Sirenia: Dugongidae). Australian Journal of
Zoology 32:767-788.
Marsh, H., and D. Kwan. 2008. Temporal variability in the life history and reproductive
biology of female
dugongs in Torres Strait: The likely role of sea grass dieback. Continental Shelf Research
28:2125-2159.
Marsh, H., I. Lawler, D. Kwan, S. Delean, K. Pollock, and M. Alldredge. 2004. Aerial surveys
and the potential biological removal technique indicate that the Torres Strait dugong
fishery is unsustainable. Animal Conservation 7:435-443.
Marsh, H., T. O’Shea, and J. Reynolds. 2011. Ecology and conservation of the Sirenia:
dugongs and manatees. Cambridge University Press, New York.
Marsh, H., H. Penrose, C. Eros, and J. Hugues. 2002. Dugong Status Report and Action
Plans for Countries and Territories. United Nations Environment Programme, Nairobi.
Marsh, H., and D. F. Sinclair. 1989. Correcting for Visibility Bias in Strip Transect Aerial
Surveys of Aquatic Fauna. The Journal of Wildlife Management 53:1017-1024.
McKenzie, L. J., C. Collier, and M. Waycott. 2012. Reef Rescue Marine Monitoring Program -
Inshore Seagrass, Annual Report for the sampling period 1st July 2010 – 31st May
2011. Fisheries Queensland, Cairns.
Meager, J., and C. Limpus 2014. Mortality of Inshore Marine Mammals in Eastern Australia Is
Predicted by Freshwater Discharge and Air Temperature. PLoSONE 9.
Meager, J., C. Limpus, and W. Sumpton. 2013. A review of the population dynamics of
dugongs in southern Queensland: 1830-2012. . Brisbane.
Nishiwaki, M., and H. Marsh. 1985. Dugong. (Dugong dugon (Muller, 1776)).
Orth, R. J., T. J. B. Carruthers, W. C. Dennison, C. M. Duarte, and J. W. Fourqurean. 2006.
A global crisis for seagrass ecosystems. Bioscience 56:987-996.

23
Parks and Wildlife Service. 2003. Draft management program for the dugong (Dugong
dugon) in the Northern Territory of Australia 2003–2008. Darwin.
Pedersen, O., T. D. Colmer, J. Borum, A. Zavala-Perez, and G. A. Kendrick. 2016. Heat
stress of two tropical seagrass species during low tides – impact on underwater net
photosynthesis, dark respiration and diel in situ internal aeration. New Phytologist.
Perrin, W. F., M. L. L. Dolar, and M. N. R. Alava. 1996. Report of the Workshop on the
Biology and Conservation of Small Cetaceans and Dugongs of Southeast Asia,
Dumaguete 1995.
Poiner, I., D. Staples, and R. Kenyon. 1987. Seagrass communities of the Gulf of
Carpentaria, Australia. Australian Journal of Marine and Freshwater Research
38:121-131.
Pollock, K. H., H. D. Marsh, I. R. Lawler, and M. W. Alldredge. 2006. Estimating animal
abundance in heterogeneous environments: An application to aerial surveys for
Dugongs. Journal of Wildlife Management 70:255-262.
Preen, A., and H. Marsh. 1995. Response of dugongs to large-scale loss of seagrass from
Hervey Bay, Queensland, Australia. Wildlife Research 22:507-519.
Rasheed, M., K. Dew, M. LJ, R. Coles, S. Kerville, and S. Campbell. 2008. Productivity,
carbon assimilation and intra-annual change in tropical reef platform seagrass
communities of the Torres Strait, north-eastern Australia. Continental Shelf Research
28 2292– 2303.
Roelofs, A., R. Coles , and N. Smit. 2005. A survey of intertidal seagrass from Van Diemen
Gulf to Castlereagh Bay, Northern Territory, and from Gove to Horn Island,
Queensland Department of Primary Industries & Fisheries, CRC Reef Research
Centre
Biodiversity and Conservation, NT Department of Infrastructure, Planning and Environment
Sobtzick, S., A. Grech, R. Coles, D. Cagnazzi, and H. Marsh. 2013a. Status of the dugong
population in the Gladstone area. A Report for Gladstone Ports Corporation Limited
for Project CA 120017: Monitoring of Dugongs. James Cook University, Centre for
Tropical Water & Aquatic Ecosystem Research (TropWATER) Publication, James
Cook University, Townsville.
Sobtzick, S., R. Hagihara, H. Penrose, A. Grech, C. Cleuger, and H. Marsh. 2014. An
assessment of the distribution and abundance of dugongs in the Northern Great
Barrier Reef and Torres Strait. Report to the National Environmental Research
Program. Reef and Rainforest Centre Limited, Cairns.
Sobtzick, S., A. Hodgson, H. Marsh, and . 2013b. Dugong aerial survey observer training
course. Handbook 2013. James Cook University, Townsville, Australia.
Taylor, B. L., M. Matinex, T. Gerrodette, and J. Barlow. 2007. Lessons from monitoring
trends in abundance of marine mammals. Marine Mammal Science 23:157-175.
White, G. C., and K. P. Burnham. 1999. Program MARK: survival estimation from populations
of marked animals. Bird Study 46:S120–S113.
Wild, K. 2016. 'Shocking images' reveal death of 10,000 hectares of mangroves across
northern Australia. ABC online.
Wolanski, E., and P. Ridd. 1990. Mixing and trapping in Australian coastal waters. Springer-
Verlag, New York.

24
Appendix 1 Overview of survey flights undertaken in the Gulf of Carpentaria
Date Survey Transects Completed
9/10/2015 17_East1, 15_East1, 13_East1, 11_East1, 9_East1, 7_East1, 5_East1, 3_East2,
727_West1, 725_West1, 709_West1, 711_West1, 713_West1, 715_West1, 717_West1
719_West1
10/10/2015 1_East2, 31_East2, 29_East2, 27_East2, 25_East2, 23_East2, 21_East2, 19_East2,
745_West1, 747_West1, 749_West1, 751_West1, 753_West1, 755_West1,
757_West1, 759_West1, 761_West1, 763_West1, 765_West1, 767_West2
11/10/2015 53_East3, 51_East3, 49_East3, 47_East3, 45_East3, 43_East3, 41_East3, 39_East3,
37_East3, 35_East3, 33_East3, 769_West2, 771_West2, 495_West2, 497_West2,
499_West2, 501_West2, 503_West2
12/10/2015 No surveys due to day off
13/10/2015 75_ East4, 73_ East4, 71_ East4, 99_ East5, 97_ East5, 95_ East5, 505_West2,
507_West2, 509_West2, 511_West2, 489_West2, 491_West2, 493_West2,
523_West2, 525_West2, 527_West2, 529_West3, 531_West3
14/10/2015 69_East4, 67_East4, 65_East4, 63_East4, 61_East4, 59_East4, 533_West3,
535_West3, 537_West3, 539_West3, 513_West3, 515_West3, 517_West3,
519_West3, 521_West3
15/10/2015 57_ East4, 55_ East4, 113_ East5, 943_West4, 935_West4, 921_West4, 913_West4,
907_West4, 899_West4, 889_West4, 879_West4, 877_West4, 867_West4,
835_West5, 827_West5, 821_West5, 817_West5, 813_West5
16/10/2015 111_East5, 101_East5, 105_ East5, 107_ East5, 109_ East5, 823_West5, 809_West5,
1164O_West5, 1163_West5, 1147W_West3, 1159W_West3 951_West4, 957_West4,
963W_West4, 976W_West3
17/10/2015 963E_West4, 1147E_West3, 1159E_West3, 976E_West3, 981_West3, 1001_West3,
1011_West3, 1025_West3, 1035_West3
No surveys in East
18/10/2015 91_East5&9, 89_East5&9, 103_East5, 93_East5, 121_East6, 119_East6
No surveys in West
19/10/2015 147_East7, 115_East6, 117_East6, 145_East7, 143_East7, 141_East7, 139_East7,
123_East9, 1045_West6, 1157_West6, 1153_West6, 1155_West6, 1013_West6,
1003_West6, 991_West3&6
20/10/2015 87_East9, 125_East9, 127_East9, 129_East9, 131_East9, 77_East9, 79_East9,
81_East9, 83_East9, 85_East9, 1179_West7, 1180O_West6, 1181_West6,
1182O_West6, 1027_West6, 1037_West6, 1049_West6, 1047_West6, 1061_West6
21/10/2015 541_EastNE, 543_EastNE, 545_EastNE, 547_EastNE, 549_EastNE, 551_EastNE,
1178O_West7, 1177_West7, 1176O_West7, 1175_West7, 1174O_West7,
1173_West7, 1172O_West7, 1171_West7, 929_West7, 845_West9, 859_West9,
871_West9, 881_West9, 881A_West9, 891_West9, 901_West9
22/10/2015 553_EastNE, 555_EastNE, 557_EastNE, 1131_EastNE, 1129_EastNE, 1127_EastNE,
1125_EastNE, 1123_EastNE, 1069_West6, 1059_West6, 1046O_West6,
1036O_West6, 1026O_West6, 1015_West6, 1004E_West6, 993_West6

25
23/10/2015 133_EastNE, 135_East7, 137_East7, 559_EastNE, 561_EastNE, 563_EastNE,
565_EastNE, 567_EastNE, 569_EastNE, 571_EastNE, 573_EastNE, 575_EastNE,
577_EastNE, 579_EastNE, 581_EastNE, 583_EastNE, 1144O_West4, 1143_West4,
937E_West4, 937W_West9, 925_West4&9, 915_West4&9, 909_West4&9,
900O_West4, 890O_West5, 880O_West5, 870O_West5, 856O_West5, 1A_West5,
2A_West5, 844O_West5, 1133_West5, 1135_West5, 819_West5, 815_West5,
1167_West5
24/10/2015 585_EastNE, 587_EastNE, 589_EastNE, 591_EastNE, 593_EastNE, 595_EastNE,
1165_West5, 1166O_West5, 807_West5, 811_West5, 814O_West5, 818O_West5,
1134Z_West5, 831_West5,
25/10/2015 1145_West4, 1146E_West4, 1147E_West6, 972E_West6, 976E_West6,
1150E_West6, 1151_West6, 1152E_West6
No surveys in East
26-28/10/2015 No surveys due to plane maintenance
29/10/2015 1121_EastNE, 1119_EastNE, 1115_EastNE, 1111_EastNE, 1105_EastNE,
1109_EastNE, 1113_EastNE, 1117_EastNE, 1100_EastNE
No surveys in West
30/10/2015 597_EastNE, 599_EastNE, 601_EastNE, 603_EastNE, 605_EastNE, 607_EastNE,
609_EastNE, 611_EastNE, 613_EastNE, 615_EastNE, 617_EastNE, 619_EastNE,
621_EastNE, 623_EastNE, 625_EastNE, 1232N_West8&9, 1193_West9,
1194N_West9, 846N_West9, 846Z_West9, 861_West9, 861Z_West9, 873_West9,
873Z_West9, 883_West9, 883Z_West9, 893_West9, 893Z_West9, 903_West9,
1299_West9, 1299Z_West9, 824_West9, 1194O_West9, BP1_West9, 862N_West9,
825_West8, 833_West8, 849_West8, 865_West8, 886O_West9, 875E_West9
875_West8, 887_West8, 887E_West9, 895E_West9, 895_West8, 905_West8,
905_West9
31/10/2015 1097_EastNE, 1107_EastNE, 1103_EastNE, 1099_EastNE, 1095_EastNE,
1215_EastNE, 1213_EastNE, 1211_EastNE, 905Z_West9, 911E_West9, 911_West8,
917_West8, 933_West8, 941_West8, 949E_West8, 949_Mid, 955_Mid, 961_Mid,
967_Mid, 1184E_Mid, 1185_Mid
1/11/2015 1093_EastNE, 1091_EastNE, 1089_EastNE, 1087_EastNE, 1231_EastNE,
1223_EastNE, 1185W_Mid, 1186N_Mid, 986N_Mid, 996N_Mid, 1000N_Mid, 1019_Mid,
987_Mid, 997_Mid, 1007_Mid
2/11/2015 1229_EastNE, 1041_EastNE, 1227_EastNE, 1065_EastNE, 1071_EastNE,
1075_EastNE, 1079_EastNE, 1021_Mid, 1028N_Mid, 1038N_Mid, 1050N_Mid,
1201_Mid, 1201W_Mid, 1207_Mid, 1203_Mid
3/11/2015 1221_EastNE, 1203_EastNE, 1205_EastNE, 1083_EastNE, 1063_Mid, 1207W_Mid,
1205E_Mid, 1077_Mid, 1081_Mid, 1081W_Mid, 1085_Mid
*Survey block number follows the underscore. i.e. 57_East4 is transect 57 in Block East4

26
Appendix 1.1 Dugong raw data sightings
Team/Plane Block Block Area
(Km2) Transects
Transects with Sightings in
transect Total
Sightings Total
Individuals #
Calves Sightings in
Transect Individuals in Transect
Group size mean
Group Size SD
Group Size
median At
surface Below
Surface
East East_1 1842.13 8 4 10 12 1 11 12 1.09 0.30 1 8 4
East East_2 2830.65 9 7 33 62 11 27 48 1.77 1.11 1 42 20
East East_3 3076.93 11 6 20 26 4 16 22 1.18 0.39 1 12 14
East East_4 3052.14 11 1 2 6 3 2 6 3.00 1.41 3 2 0
East East_5 4413.05 13 6 7 14 2 7 14 2.00 1.29 1 9 5
East East_6 2460.31 4 2 5 6 1 5 6 1.20 0.45 1 3 3
East East_7 3009.94 8 0 1 1 0 0 0 1.00 NA 1 0 NA
East East_9 3055.38 13 0 0 0 0 0 0 NA NA NA NA NA
East NW block 23857.34 83 2 2 3 1 2 3 1.5 0.71 1.50 3 0 Totals and
overall statistics
EAST 47597.87 160 28 80 130 23 70 111 1.64 1.14 1 79 47
West West_1 4769.49 17 4 7 10 1 5 8 1.43 0.79 1 8 2
West West_2 3725.03 18 5 6 10 0 6 10 1.67 1.63 1 7 3
West West_3 5044.91 23 6 3 4 0 3 4 1.33 0.58 1 2 2
West West_4 3800.15 23 5 11 15 0 10 13 1.36 0.92 1 10 5
West West_5 5950.91 31 10 18 23 1 16 20 1.28 0.46 1 17 6
West West_6 5848.27 29 2 3 3 0 3 3 1.00 0.00 1 1 2
West West_7 2319.55 10 3 8 11 1 6 7 1.38 0.74 1 7 4
West West_8 3158.57 14 2 6 7 0 4 4 1.17 0.41 1 6 1
West West_9 3745.67 37 5 6 13 0 6 12 2.17 2.40 1 10 3
West MID 7184.98 30 2 3 3 0 2 2 1.00 0.00 1 2 1
Totals and overall
statistics WEST 45547.53 232 44 71 99 3 61 83 1.39 0.99 1 70 29
GRAND TOTALS 93145 392 72 151 229 26 131 194

27
Appendix 1.2 Details of tested models perception correction (modelled with glare and turbidity)
Model AICc Delta AICc AICc Weight Model Likelihood #Parameters
AllObservs-Different-NO-ENVeffects 169.406 0 0.53434 1 4
All:Only-TURB effect:Observs-Different 170.8938 1.4878 0.25395 0.4753 8
All:Only-GLARE effect:Observs-Different 171.9319 2.5259 0.15112 0.2828 8
All-Turb:Glare:Observs-Different 173.7597 4.3537 0.06059 0.1134 12
Results from selected model and perception probability for each team (all observers different, no environmental effects)
Selected Model
Parameter Estimate Standard Error Lower CI Upper CI
WEST TEAM
1:p – port front observers 0.857143 0.06613 0.6755155 0.9453332
2:p – port rear observers 0.648649 0.0784828 0.4845404 0.7838198
3:p - starboard front observers 0.636364 0.1025593 0.4233439 0.8066352
4:p - starboard rear observers 0.411765 0.0844035 0.261214 0.5808634
EAST TEAM
1:p – port front observers 0.448276 0.0923495 0.2810031 0.6281324 0.448276
2:p – port rear observers 0.333333 0.0754851 0.2044149 0.4931584 0.333333
3:p - starboard front observers 0.818182 0.0671408 0.6500957 0.9159612 0.818182
4:p - starboard rear observers 0.54 0.070484 0.4023191 0.6718352 0.54

28
Perception and availability correction factors
Perception Correction Factor (C.V.)
Port Starboard Availability Correction Factor (C.V.)
EAST TEAM
1.525 (0.147) 1.137 (0.050) 3.754 (0.122)
WEST TEAM
1.083 (0.037) 1.218 (0.075) 4.234 (0.121)

29
Appendix 2.1 – Dugong sightings

30
Appendix 2.2 – Dolphin sightings

31
Appendix 2.3 – Turtle sightings

32
Appendix 2.4 – Humpback whale, Whale shark and Manta ray sightings