the economic impact of gatwick airport · 2017-01-09 · the economic impact of gatwick airport...
TRANSCRIPT
THE ECONOMIC IMPACT OF GATWICK AIRPORT

1
The economic impact of Gatwick Airport
TABLE OF CONTENTSGatwick Airport’s impact on the UK 2
Executive Summary 3
1. Introduction 6
2. Gatwick’s economic impact in 2016 9
2.1 The core impact of Gatwick Airport 9
2.2 The Airport’s catalytic impact 17
2.3 The Airport’s total economic impact 20
3. Gatwick’s future economic impact 22
3.1 Gatwick’s core impact in 2025 22
3.2 Catalytic impact of Gatwick in 2025 24
3.3 What barriers could impede this impact? 25
4. Conclusion 30
5. Appendix 1: Glossary 31
6. Appendix 2: Methodology 32
JANUARY 2017
2
The economic impact of Gatwick Airport
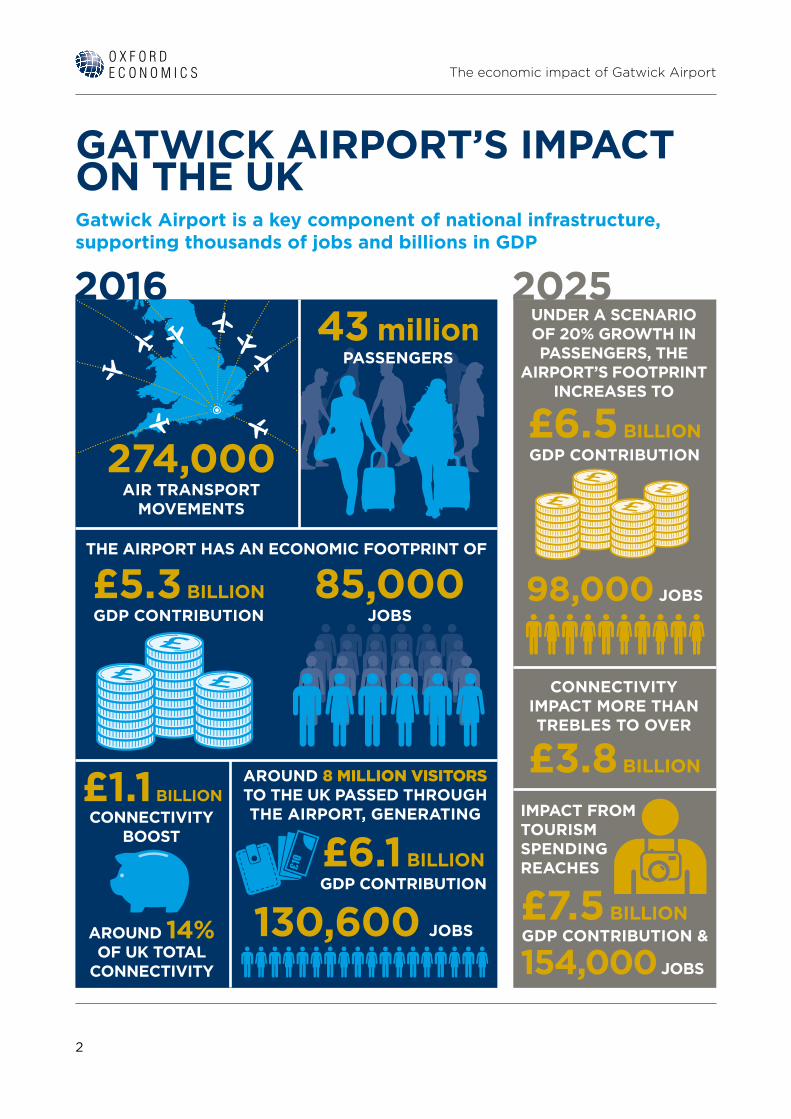
GATWICK AIRPORT’S IMPACT ON THE UKGatwick Airport is a key component of national infrastructure, supporting thousands of jobs and billions in GDP
2016 2025
274,000AIR TRANSPORT
MOVEMENTS
43 millionPASSENGERS
£1.1 BILLION
£5.3 BILLIONGDP CONTRIBUTION
£6.5 BILLIONGDP CONTRIBUTION
£3.8 BILLION
£7.5 BILLION
£6.1 BILLIONGDP CONTRIBUTION
85,000JOBS
98,000 JOBS
154,000 JOBS
130,600 JOBS
THE AIRPORT HAS AN ECONOMIC FOOTPRINT OF
AROUND 14%OF UK TOTAL
CONNECTIVITY
CONNECTIVITY BOOST
AROUND 8 MILLION VISITORS TO THE UK PASSED THROUGH THE AIRPORT, GENERATING
UNDER A SCENARIO OF 20% GROWTH IN PASSENGERS, THE
AIRPORT’S FOOTPRINT INCREASES TO
CONNECTIVITY IMPACT MORE THAN TREBLES TO OVER
IMPACT FROM TOURISM SPENDING REACHES
GDP CONTRIBUTION &
3
The economic impact of Gatwick Airport
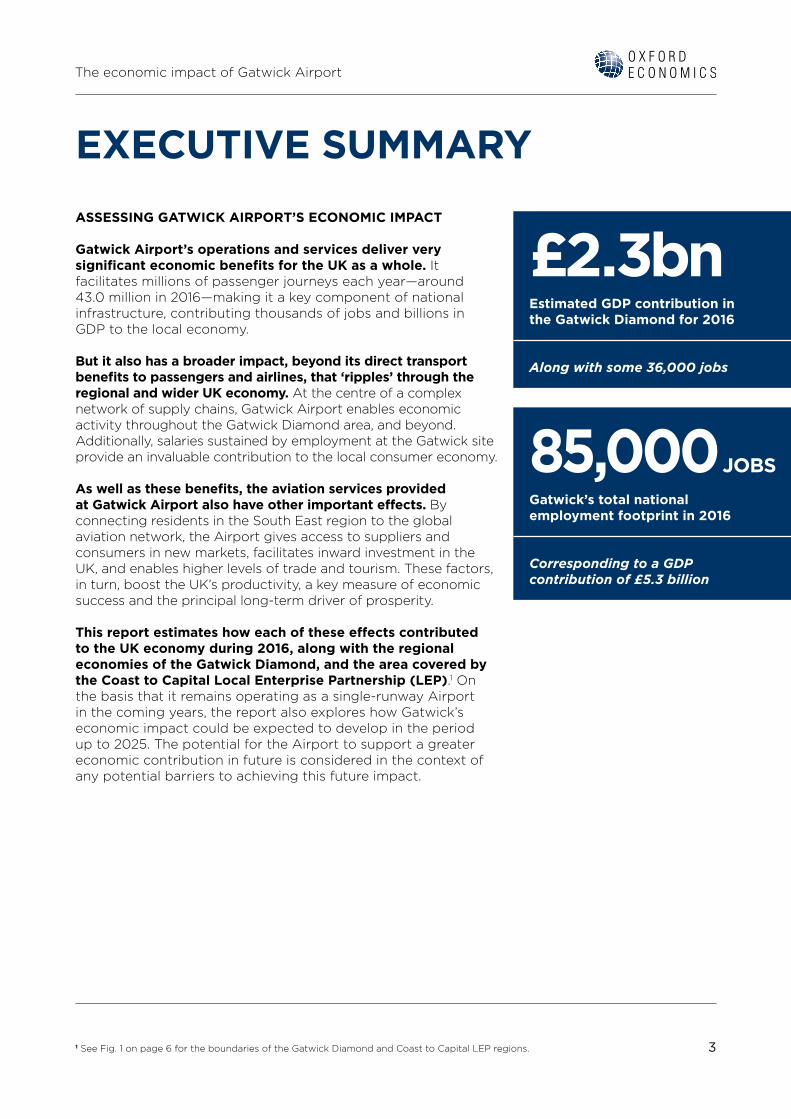
EXECUTIVE SUMMARYASSESSING GATWICK AIRPORT’S ECONOMIC IMPACT
Gatwick Airport’s operations and services deliver very significant economic benefits for the UK as a whole. It facilitates millions of passenger journeys each year—around 43.0 million in 2016—making it a key component of national infrastructure, contributing thousands of jobs and billions in GDP to the local economy.
But it also has a broader impact, beyond its direct transport benefits to passengers and airlines, that ‘ripples’ through the regional and wider UK economy. At the centre of a complex network of supply chains, Gatwick Airport enables economic activity throughout the Gatwick Diamond area, and beyond. Additionally, salaries sustained by employment at the Gatwick site provide an invaluable contribution to the local consumer economy.
As well as these benefits, the aviation services provided at Gatwick Airport also have other important effects. By connecting residents in the South East region to the global aviation network, the Airport gives access to suppliers and consumers in new markets, facilitates inward investment in the UK, and enables higher levels of trade and tourism. These factors, in turn, boost the UK’s productivity, a key measure of economic success and the principal long-term driver of prosperity.
This report estimates how each of these effects contributed to the UK economy during 2016, along with the regional economies of the Gatwick Diamond, and the area covered by the Coast to Capital Local Enterprise Partnership (LEP).1 On the basis that it remains operating as a single-runway Airport in the coming years, the report also explores how Gatwick’s economic impact could be expected to develop in the period up to 2025. The potential for the Airport to support a greater economic contribution in future is considered in the context of any potential barriers to achieving this future impact.
1 See Fig. 1 on page 6 for the boundaries of the Gatwick Diamond and Coast to Capital LEP regions.
£2.3bn Estimated GDP contribution in the Gatwick Diamond for 2016
Along with some 36,000 jobs
85,000 JOBS Gatwick’s total national employment footprint in 2016
Corresponding to a GDP contribution of £5.3 billion

4
The economic impact of Gatwick Airport
GATWICK AIRPORT’S IMPACT IN 2016
We estimate that businesses on the Gatwick Campus directly generated £1.6 billion in gross value added (GVA) contribution to GDP in 2016. Firms on the Airport site directly employed some 23,800 people to produce this impact, and in doing so, underpinned £1.2 billion in tax revenues for the UK Government.
The Airport’s GDP impact in the Gatwick Diamond rises to £2.3 billion, when including its supply chain activity, and the wages that its staff (and suppliers’ staff) spend in the wider consumer economy. This means ten percent of the Diamond’s economy can be traced back to the Airport. Once these multiplier effects are accounted for, Gatwick Airport is estimated to support almost 36,000 jobs—or one in every 12—in the Diamond region. These figures rise to £2.7 billion and 43,000, respectively, when expanding the scope of analysis to include the entire the region of the Coast to Capital LEP. This makes the Airport’s footprint equal to six percent of the region’s economy and four percent of its employment.
Its footprint at a national level is larger still, amounting to £5.3 billion in GDP and over 85,000 jobs. The greater UK-level impact reflects the extent that the Airport’s supply chains (and the consumption of its workers) spread over the wider South East region and across the nation as a whole. Through this channel, the Airport’s operations and activities on the Airport campus deliver benefits to distant communities throughout the entire UK.
Gatwick Airport accounted for around 14 percent of the UK’s aviation connectivity in 2016. Connectivity, which describes the availability of seats to international destinations and the economic importance of these destinations, delivers productivity benefits to the UK. We estimate that Gatwick’s contribution to this productivity benefit increased UK GDP by £1.1 billion during 2016.
Further, international tourists arriving in the UK at Gatwick Airport contribute more economic benefits. The spending of these tourists is estimated to add £6.1 billion to the UK’s GDP, while supporting some 130,600 jobs among Britain’s tourism industries, and within their supply chains.
EXECUTIVE SUMMARY (cont)
14%Gatwick’s share of the UK’s 2016 aviation connectivity
Supporting £1.1 billion in GDP
5
The economic impact of Gatwick Airport
£2.8bn Gatwick’s projected GDP contribution in the Gatwick Diamond, 2025
In addition to 41,000 jobs
GATWICK AIRPORT’S POTENTIAL IMPACT IN 2025
Gatwick Airport Limited (GAL) expects the Airport to serve growing numbers of passengers in the period to 2025, from more efficient and intensive use of its single-runway operation. There is a range of forecasts for the potential scale of this growth. We have examined one potential scenario in which passenger traffic grows from nearly 43 million in 2016 to around 52 million by 2025, an increase of over 20 percent. Such greater activity would support higher demand among the businesses on the campus and beyond, delivering output and employment growth over the coming years, and into the next decade.
Our modelling suggests such growth in traffic would be sufficient to increase the Airport’s GDP footprint in the Gatwick Diamond area to £2.8 billion, when measured in constant 2016 prices, equivalent to 12 percent of the local economy. The growth in its GDP impact is expected to be accompanied by an employment contribution in the Diamond area of around 41,000 jobs, around eight percent of local employment. The equivalent figures for the Coast to Capital LEP region amount to around £3.3 billion (seven percent of the region’s economy) and 49,000 jobs (five percent of regional employment), respectively. Meanwhile across the UK as a whole, we expect the Airport’s economic footprint to reach £6.5 billion in GDP terms, while supporting 98,000 jobs.
Gatwick’s connectivity impact on UK productivity is expected to increase also, producing a GDP uplift of £3.8 billion in 2025 (again measured in 2016 prices). This rising productivity contribution would support the UK’s prosperity in the long-term, and would be accompanied by a projected gross tourism impact of about £7.5 billion and 154,000 jobs.
Our study suggests that businesses at Gatwick are largely positive about the prospects for this expansion, indicating few structural impediments to their activities or future growth. However, some firms of certain sizes and types did report a diverse set of lower-level challenges such as regulatory hurdles, increasing cost pressures, and the quality of local transport links. This finding underlines the necessity of addressing the bespoke needs of businesses operating on the Gatwick campus.
6
The economic impact of Gatwick Airport
1. INTRODUCTION
2 The GGB was established in August 2016 with the appointment of Co-Chairs Baroness Tessa Jowell and Steve Norris.
The Gatwick Growth Board (GGB) has been appointed by Gatwick Airport Limited (GAL) to advise on matters linked to Gatwick Airport’s recent and future growth.2 Whatever decisions are taken on future runway capacity, Gatwick will grow between now and 2025. The remit of the GGB is to consider the implications of that growth in terms of GDP contribution at local, regional and national level generated by this expansion as well as the implications for jobs, training and procurement.
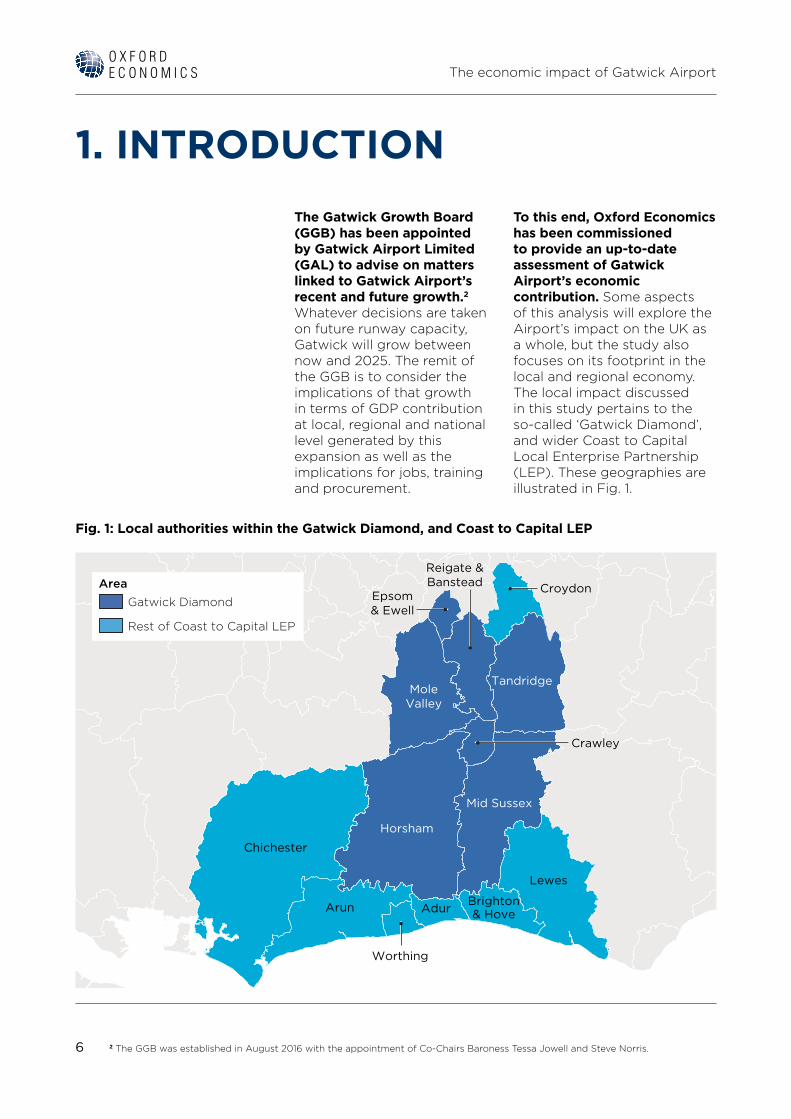
To this end, Oxford Economics has been commissioned to provide an up-to-date assessment of Gatwick Airport’s economic contribution. Some aspects of this analysis will explore the Airport’s impact on the UK as a whole, but the study also focuses on its footprint in the local and regional economy. The local impact discussed in this study pertains to the so-called ‘Gatwick Diamond’, and wider Coast to Capital Local Enterprise Partnership (LEP). These geographies are illustrated in Fig. 1.
Fig. 1: Local authorities within the Gatwick Diamond, and Coast to Capital LEP
Chichester
Worthing
Arun
Horsham
Mid Sussex
TandridgeMole
Valley
Reigate &Banstead Croydon
Crawley
Lewes
Brighton& HoveAdur
Epsom& Ewell
Gatwick Diamond
Rest of Coast to Capital LEP
Area
7
The economic impact of Gatwick Airport
The report presents estimates for Gatwick Airport’s impact in calendar year 2016. While complete data for the full year are not yet available, we have used the most up-to-date information available, and have (where necessary) extrapolated values for the full calendar year. The sources for our analysis include:
• GAL’s financial statements and annual accounts, for the financial year 2015/16 and the first half of 2016/17;
• GAL’s records of monthly passenger movements, to adjust for the seasonality in Airport activity throughout the year when ‘now-casting’ 2016 values;
• The Gatwick Employer and Travel to Work Survey 2016;
• A bespoke survey of businesses operating on the Gatwick campus, conducted by Oxford Economics and GAL during October and November 2016.
This study also presents projections for how Gatwick Airport’s economic impact may develop by 2025. These are based on scenarios from GAL of the possible evolution of passenger traffic over the years from 2016 to 2025. The resulting economic contribution is estimated using Oxford Economics’ in-house forecasts for future growth in productivity and tourist spending.
We also explore whether and to what extent this projected economic impact in 2025 could be realised. This part of the study uses a survey of firms on the Gatwick campus, exploring any barriers and constraints they are facing.
8
The economic impact of Gatwick Airport
INTRODUCING ECONOMIC IMPACT ANALYSISThe economic impact of a company or industry is measured using a standard means of analysis called an economic impact assessment. This consists of two parts. First, we quantify the three ‘core’ channels of impact that comprise the organisation’s ‘economic footprint’, consisting of:
• Direct impact, which relates to the activities taking place on the Gatwick Airport campus, encompassing both the airport operator (GAL) as well as other businesses on the site.
• Indirect impact, which encapsulates the activity and employment supported in Gatwick Airport’s supply chain, as a result of the procurement of goods and services by GAL and businesses on the campus; and,
• Induced impact, comprising the wider economic benefits that arise when workers at Gatwick Airport and its supply chains spend their earnings, for example in local retail and leisure establishments.
Using these pathways, a picture of Gatwick’s economic footprint is presented, using three key metrics:
• Gross Domestic Product (GDP), or more specifically, Gatwick Airport’s gross value added (GVA) contribution to GDP;
• Employment, as the number of people employed, measured on a headcount basis; and,
• Tax revenues, measured in terms of the corporate, employment, and indirect taxes generated.
Second, we examine the ‘catalytic’ effect that Gatwick Airport’s services have in boosting or enabling economic activity elsewhere in the economy.
The catalytic impact of Gatwick Airport represents the wider benefits that the government, consumers, society and other industries gain from the services the airport provides. For an airport, these are primarily captured in the contribution that increased air connectivity makes to wider economic potential. Research has demonstrated how greater air connectivity raises the productivity of an economy by opening up new business opportunities, and stimulating innovation and competition. The impact of higher connectivity benefits all parts of the economy, but one of the important observable outcomes is the tourism facilitated by the activities of the Airport. Therefore, as well as quantifying the overall connectivity impact, we also measure the economic footprint of tourism in the UK enabled by Gatwick Airport.
Drawing on historical data and projections from a wide range of sources, the modelling on which this report is based calculates the economic contribution of Gatwick in the 2016 calendar year, and then forecasts of the Airport’s expected impact through to the 2025 calendar year.
Further detail about the economic impact methodology is included in Appendix 2.
9
The economic impact of Gatwick Airport
2. GATWICK’S ECONOMIC IMPACT IN 2016
Gatwick Airport provided crucial transport services for 43.0 million passengers during 2016, a large rise from 40.2 million in 2015. The provision of these transport services involves far-reaching interactions between businesses on the Gatwick campus and the rest of the UK economy, not least in the Gatwick Diamond area. As passenger numbers continue to rise, the importance of this interaction is only likely to grow in future.
The Airport’s plans are to expand its services in the coming decade, based on increasingly efficient use of its current single runway. There is a range of potential outcomes for growth in traffic over this period—in chapter 3 we explore
the economic implications of one scenario in which passenger numbers rise by 20 percent in the period to 2025.
Tens of thousands of jobs are sustained directly on the Gatwick campus to deliver these services, with many thousands more supported indirectly across the country. The procurement expenditures that businesses at Gatwick Airport make with local suppliers support activity throughout supply chains in the Gatwick Diamond, the wider Coast to Capital LEP region, and the UK economy as a whole. Further activity is stimulated through workers at Gatwick Airport spending their wages, and the same is true of workers employed within its supply chains.
In this chapter we explore each of these effects, before turning to the catalytic benefits enjoyed by the UK as a result of Gatwick Airport’s operations. In particular, we explore Gatwick Airport’s contribution to connectivity through its role in linking the UK to airports across the globe, and the economic footprint of international visitors arriving in the UK through its terminals.
2.1 THE CORE IMPACT OF GATWICK AIRPORT
3 The gross profit measure noted here refers to earnings before interest, depreciation and amortisation (EBITDA)
2.1.1 Direct impact
Gatwick’s economic footprint can be quantified in terms of its contribution to UK economic output (as measured by GDP), the employment it supports, and the tax revenues it generates for the UK Government. The modelling for this study maps the complex and interwoven supply chains of the businesses that trade on the Gatwick campus. This allows us to quantify the full contribution of its activities, including how they spread throughout the regional and national economies.
GAL’s own activities lie at the heart of its impact on the economy.The Airport’s operator reported turnover of over £455 million in the six months to September 2016, earned from sources such as airport charges to airlines, rents and commissions from catering and retail establishments on the site, car parking and logistics fees. This turnover gave rise to around £265 million in gross profit.3 While these are important financial indicators, they do not capture the entire contribution of GAL to the UK economy. One common way of appraising a company’s contribution
to the economy is through its gross value added (GVA) contribution to GDP. This is quantified as the sum of incomes that providers of labour and capital accrue as a result of GAL’s activities.
On this measure, we estimate that GAL’s direct contribution to UK GDP reached £599 million in 2016. This sum is the combination of its gross profits (EBITDA), and the gross employment costs paid in the course of employing its 2,780 workers.
10
The economic impact of Gatwick Airport
4 For details on how this estimate is generated, see Appendix 2.5 Headcount basis means that all full- and part-time employees (and contractors) are counted as the employment of one person.6 Some airlines designate their aircrew as operating across Heathrow and Gatwick, rather than specifically at either. For these airlines, the number of aircrew counted towards Gatwick employment was based on the Gatwick share of aircraft movements across Heathrow and Gatwick together, multiplied by the total aircrew for each airline.
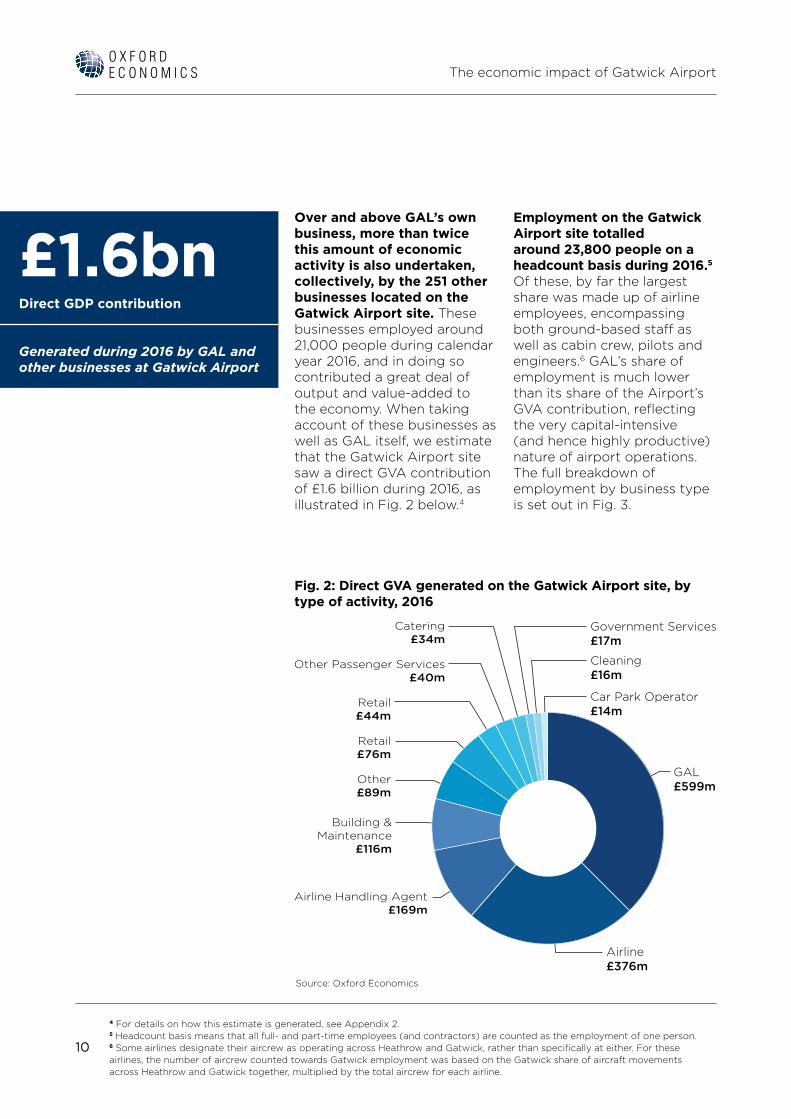
Over and above GAL’s own business, more than twice this amount of economic activity is also undertaken, collectively, by the 251 other businesses located on the Gatwick Airport site. These businesses employed around 21,000 people during calendar year 2016, and in doing so contributed a great deal of output and value-added to the economy. When taking account of these businesses as well as GAL itself, we estimate that the Gatwick Airport site saw a direct GVA contribution of £1.6 billion during 2016, as illustrated in Fig. 2 below.4
Employment on the Gatwick Airport site totalled around 23,800 people on a headcount basis during 2016.5 Of these, by far the largest share was made up of airline employees, encompassing both ground-based staff as well as cabin crew, pilots and engineers.6 GAL’s share of employment is much lower than its share of the Airport’s GVA contribution, reflecting the very capital-intensive (and hence highly productive) nature of airport operations. The full breakdown of employment by business type is set out in Fig. 3.
GAL£599m
Airline£376m
Car Park Operator£14m
Cleaning£16m
Government Services£17m
Airline Handling Agent£169m
Other£89m
Retail£76m
Retail£44m
Other Passenger Services£40m
Catering£34m
Building &Maintenance
£116m
Source: Oxford Economics
Fig. 2: Direct GVA generated on the Gatwick Airport site, by type of activity, 2016
£1.6bn Direct GDP contribution
Generated during 2016 by GAL and other businesses at Gatwick Airport

11
The economic impact of Gatwick Airport
This level of economic output at Gatwick Airport supports a large direct tax contribution. Considerable sums of labour taxes, in the form of income tax and National Insurance Contributions (NICs), are collected as a result of the tens of thousands of workers on the campus.7 Moreover, the businesses trading at the Airport pay corporation tax on their profits, National Non-Domestic Rates (business rates) on their premises, and certain product taxes such as fuel duties, import taxes, Air Passenger Duty, aggregates levy and others.8
7 Labour taxes are estimated using HMRC tax rates, and the distribution of salaries reported in Gatwick’s Employer Survey 2016.8 These are quantified by applying average ‘effective’ tax rates experienced by businesses, to the estimated level of output they generate at the Gatwick site. These rates are applied on an industrial basis, disaggregated by 28 broad industry types at Gatwick Airport.9 The APD generated at Gatwick is estimated using data on passenger departures from the airport, split between travel to destinations below and above 2,000 miles away; and the proportions of economy/non-economy passengers in each destination band.
We estimate that the activities on the Gatwick campus directly generated £1.2 billion in taxes for the UK’s public finances. The largest share of this contribution is an estimated £710 million raised through Air Passenger Duty.9 A further £191 million in labour taxes, around £24 million in corporation taxes, and a further £252 million in other taxes on products and production.
23,800Jobs in 2016
Directly supported on the Gatwick Airport site
Fig. 3: Employment at Gatwick Airport, by business type, 2016
9,0007,000 8,0006,000
8,400
2,900
2,780
2,200
2,000
1,200
1,100
1,100
700
700
500
300
5,0004,0003,0002,0001,0000PersonsSource: Oxford Economics
Airline
Airline Handling Agent
GAL
Retail
Catering
Other
Building & Maintenance
Government Services
Hotel
Other Passenger Services
Cleaning
Car Park Operator
12
The economic impact of Gatwick Airport
10 The industrial breakdown of GAL’s supply chain purchases was measured using Companies House information on the industrial codes of its supplier businesses. The equivalent breakdown of non-GAL supply chain purchases was estimated using the UK’s supply-use tables.11 This sum excludes the money that firms on the Gatwick site spent with other firms on the campus. This is to avoid double-counting: those revenues form part of the direct impact, as set out in section 2.1.1.
2.1.2 Indirect impact
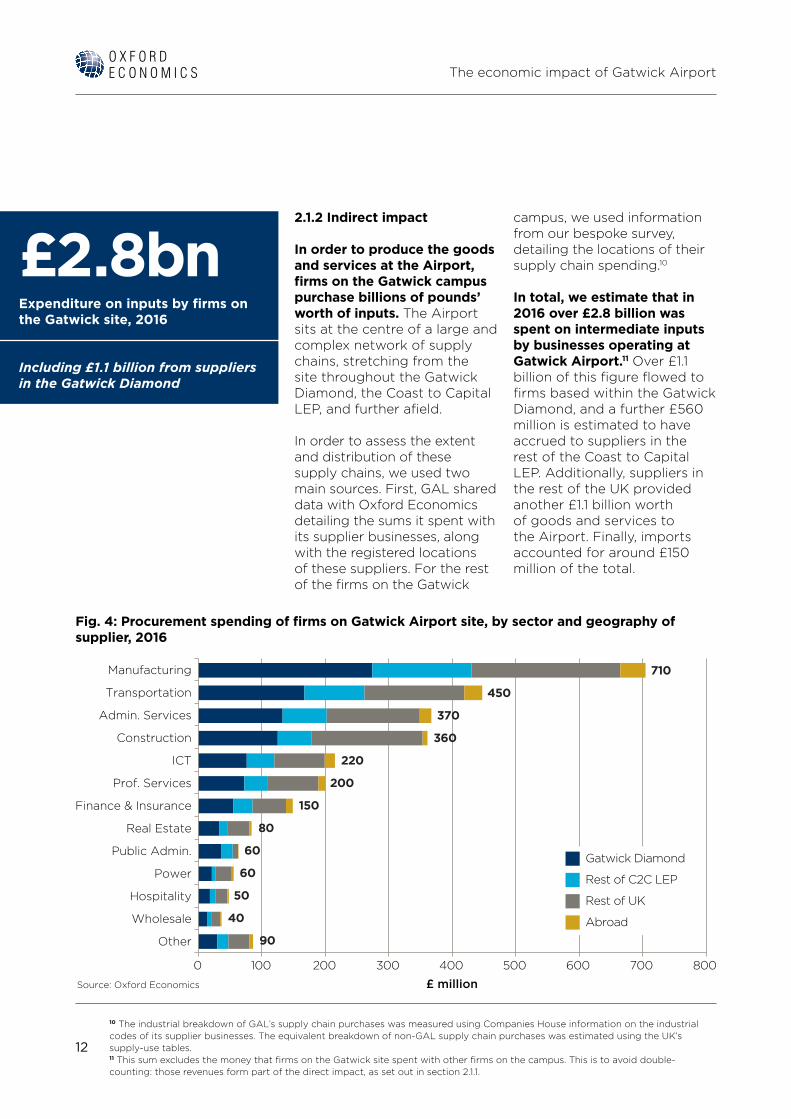
In order to produce the goods and services at the Airport, firms on the Gatwick campus purchase billions of pounds’ worth of inputs. The Airport sits at the centre of a large and complex network of supply chains, stretching from the site throughout the Gatwick Diamond, the Coast to Capital LEP, and further afield.
In order to assess the extent and distribution of these supply chains, we used two main sources. First, GAL shared data with Oxford Economics detailing the sums it spent with its supplier businesses, along with the registered locations of these suppliers. For the rest of the firms on the Gatwick
campus, we used information from our bespoke survey, detailing the locations of their supply chain spending.10
In total, we estimate that in 2016 over £2.8 billion was spent on intermediate inputs by businesses operating at Gatwick Airport.11 Over £1.1 billion of this figure flowed to firms based within the Gatwick Diamond, and a further £560 million is estimated to have accrued to suppliers in the rest of the Coast to Capital LEP. Additionally, suppliers in the rest of the UK provided another £1.1 billion worth of goods and services to the Airport. Finally, imports accounted for around £150 million of the total.
800700600
710
450
370
360
220
200
150
80
60
60
50
40
90
5004003002001000
£ millionSource: Oxford Economics
Other
Wholesale
Hospitality
Power
Public Admin.
Real Estate
Finance & Insurance
Prof. Services
ICT
Construction
Admin. Services
Transportation
Manufacturing
Gatwick Diamond
Rest of C2C LEP
Rest of UK
Abroad
£2.8bnExpenditure on inputs by firms on the Gatwick site, 2016
Including £1.1 billion from suppliers in the Gatwick Diamond
Fig. 4: Procurement spending of firms on Gatwick Airport site, by sector and geography of supplier, 2016
13
The economic impact of Gatwick Airport
These purchases represent the first stage in Gatwick Airport’s supply chain network, and the initial link to understanding its wider economic impact. The companies supplying goods to businesses at the Airport will make their own purchases, stimulating activity along the entire length of the Airport’s UK-based supply chains. Using Oxford Economics’ suite of regional input-output models, we assess how this impact was translated throughout the geographies in our study.
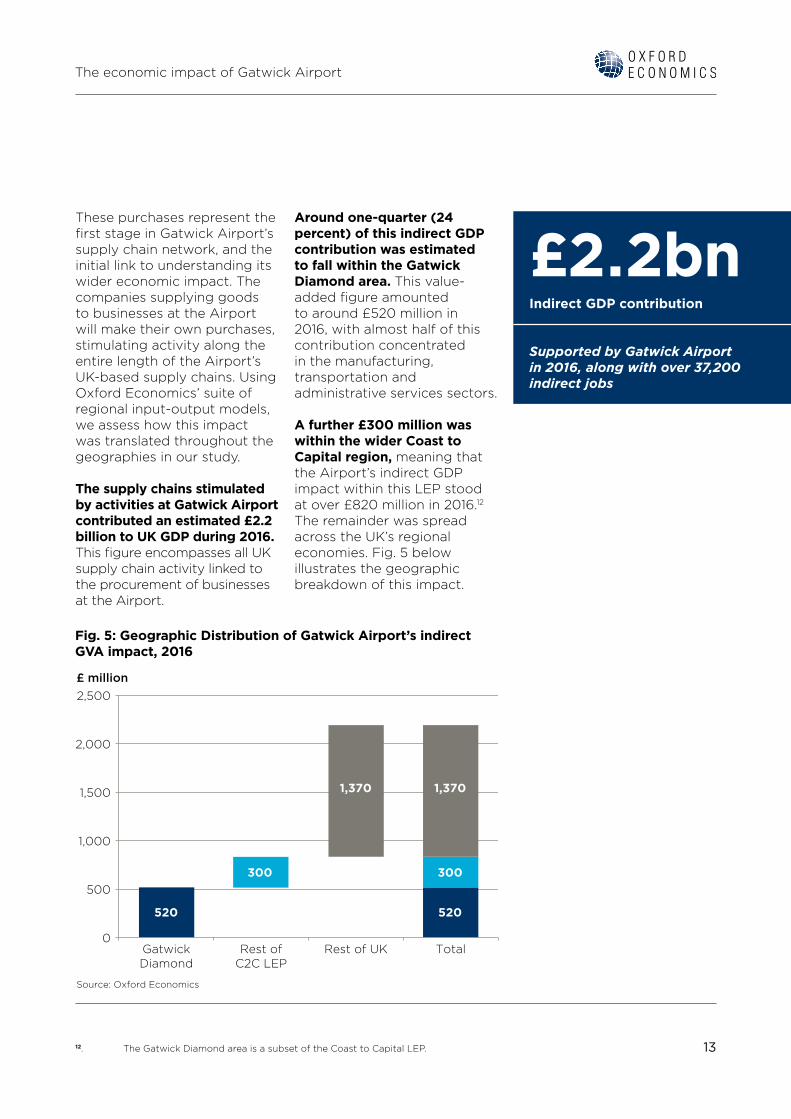
The supply chains stimulated by activities at Gatwick Airport contributed an estimated £2.2 billion to UK GDP during 2016. This figure encompasses all UK supply chain activity linked to the procurement of businesses at the Airport.
12. The Gatwick Diamond area is a subset of the Coast to Capital LEP.
Around one-quarter (24 percent) of this indirect GDP contribution was estimated to fall within the Gatwick Diamond area. This value-added figure amounted to around £520 million in 2016, with almost half of this contribution concentrated in the manufacturing, transportation and administrative services sectors.
A further £300 million was within the wider Coast to Capital region, meaning that the Airport’s indirect GDP impact within this LEP stood at over £820 million in 2016.12 The remainder was spread across the UK’s regional economies. Fig. 5 below illustrates the geographic breakdown of this impact.
Fig. 5: Geographic Distribution of Gatwick Airport’s indirect GVA impact, 2016
£2.2bnIndirect GDP contribution
Supported by Gatwick Airport in 2016, along with over 37,200 indirect jobs
0
500
1,000
1,500
2,000
2,500
GatwickDiamond
Rest ofC2C LEP
Rest of UK Total
£ million
Source: Oxford Economics
520 520
300 300
1,370 1,370
14
The economic impact of Gatwick Airport
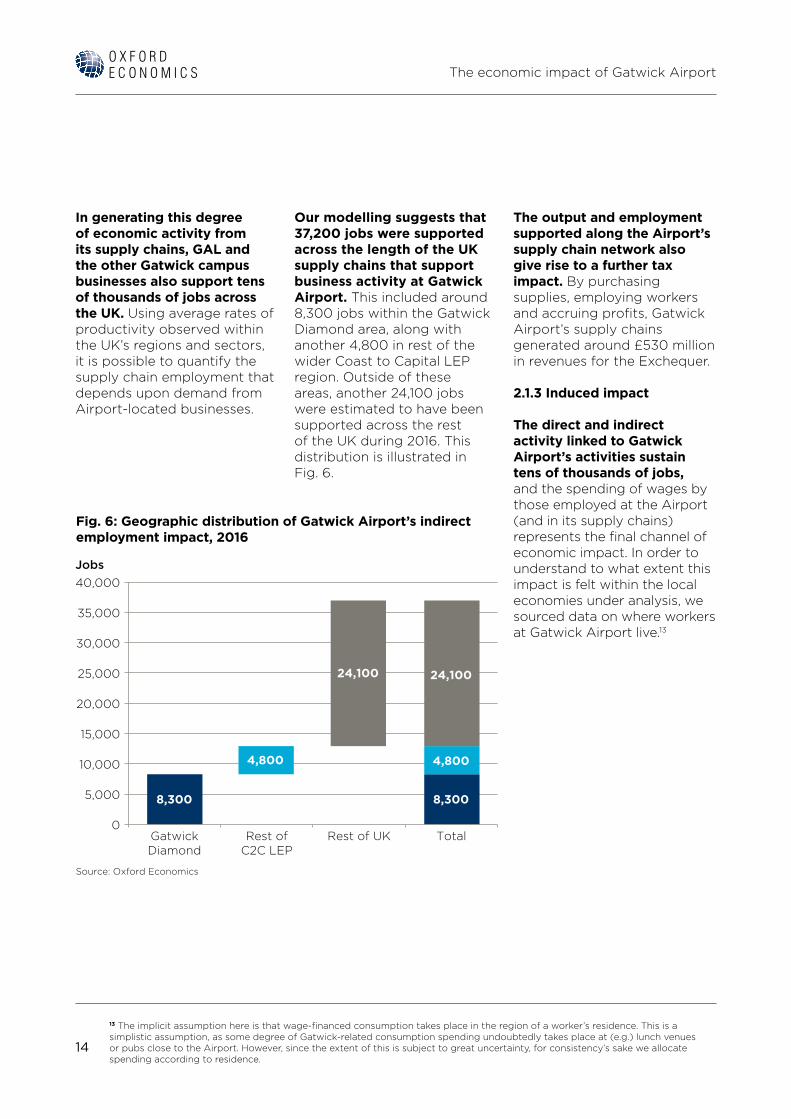
In generating this degree of economic activity from its supply chains, GAL and the other Gatwick campus businesses also support tens of thousands of jobs across the UK. Using average rates of productivity observed within the UK’s regions and sectors, it is possible to quantify the supply chain employment that depends upon demand from Airport-located businesses.
13 The implicit assumption here is that wage-financed consumption takes place in the region of a worker’s residence. This is a simplistic assumption, as some degree of Gatwick-related consumption spending undoubtedly takes place at (e.g.) lunch venues or pubs close to the Airport. However, since the extent of this is subject to great uncertainty, for consistency’s sake we allocate spending according to residence.
Our modelling suggests that 37,200 jobs were supported across the length of the UK supply chains that support business activity at Gatwick Airport. This included around 8,300 jobs within the Gatwick Diamond area, along with another 4,800 in rest of the wider Coast to Capital LEP region. Outside of these areas, another 24,100 jobs were estimated to have been supported across the rest of the UK during 2016. This distribution is illustrated in Fig. 6.
The output and employment supported along the Airport’s supply chain network also give rise to a further tax impact. By purchasing supplies, employing workers and accruing profits, Gatwick Airport’s supply chains generated around £530 million in revenues for the Exchequer.
2.1.3 Induced impact
The direct and indirect activity linked to Gatwick Airport’s activities sustain tens of thousands of jobs, and the spending of wages by those employed at the Airport (and in its supply chains) represents the final channel of economic impact. In order to understand to what extent this impact is felt within the local economies under analysis, we sourced data on where workers at Gatwick Airport live.13
Fig. 6: Geographic distribution of Gatwick Airport’s indirect employment impact, 2016
0
35,000
30,000
25,000
20,000
15,000
10,000
5,000
40,000
GatwickDiamond
Rest ofC2C LEP
Rest of UK Total
Jobs
Source: Oxford Economics
8,300 8,300
4,800
24,100 24,100
4,800
15
The economic impact of Gatwick Airport
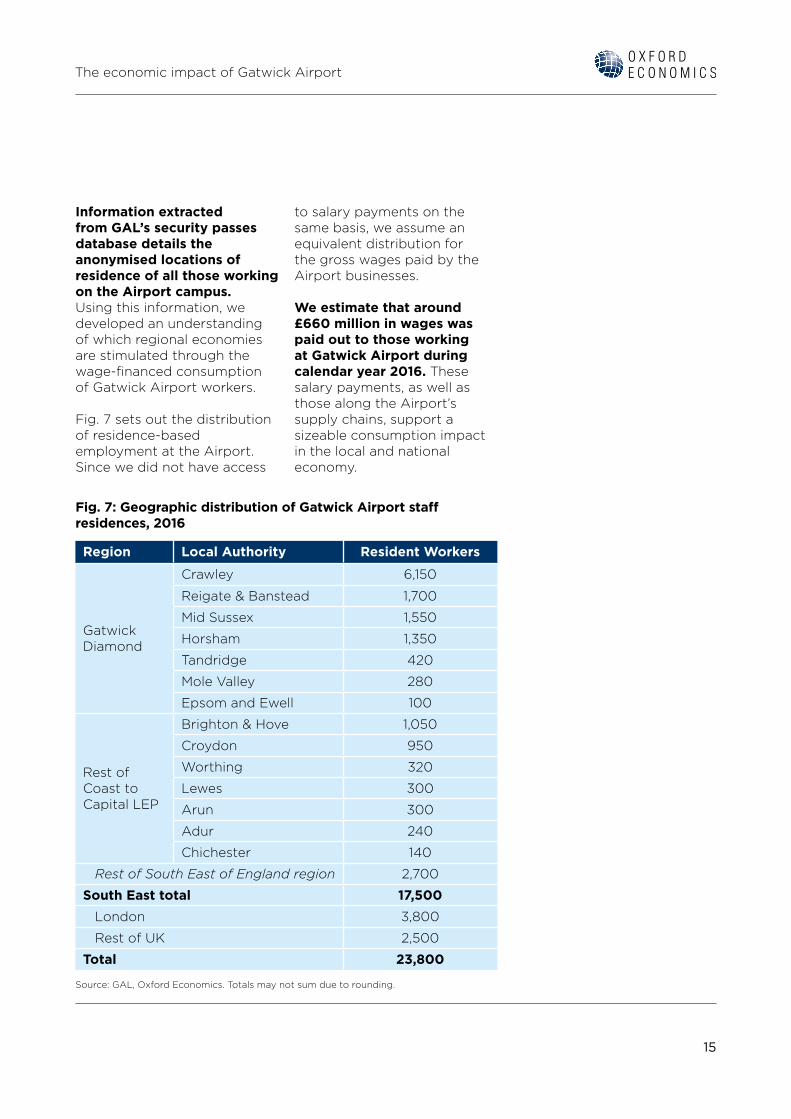
Information extracted from GAL’s security passes database details the anonymised locations of residence of all those working on the Airport campus. Using this information, we developed an understanding of which regional economies are stimulated through the wage-financed consumption of Gatwick Airport workers.
Fig. 7 sets out the distribution of residence-based employment at the Airport. Since we did not have access
to salary payments on the same basis, we assume an equivalent distribution for the gross wages paid by the Airport businesses.
We estimate that around £660 million in wages was paid out to those working at Gatwick Airport during calendar year 2016. These salary payments, as well as those along the Airport’s supply chains, support a sizeable consumption impact in the local and national economy.
Fig. 7: Geographic distribution of Gatwick Airport staff residences, 2016
Region Local Authority Resident Workers
Gatwick Diamond
Crawley 6,150
Reigate & Banstead 1,700
Mid Sussex 1,550
Horsham 1,350
Tandridge 420
Mole Valley 280
Epsom and Ewell 100
Rest of Coast to Capital LEP
Brighton & Hove 1,050
Croydon 950
Worthing 320
Lewes 300
Arun 300
Adur 240
Chichester 140
Rest of South East of England region 2,700
South East total 17,500 London 3,800
Rest of UK 2,500
Total 23,800
Source: GAL, Oxford Economics. Totals may not sum due to rounding.
16
The economic impact of Gatwick Airport
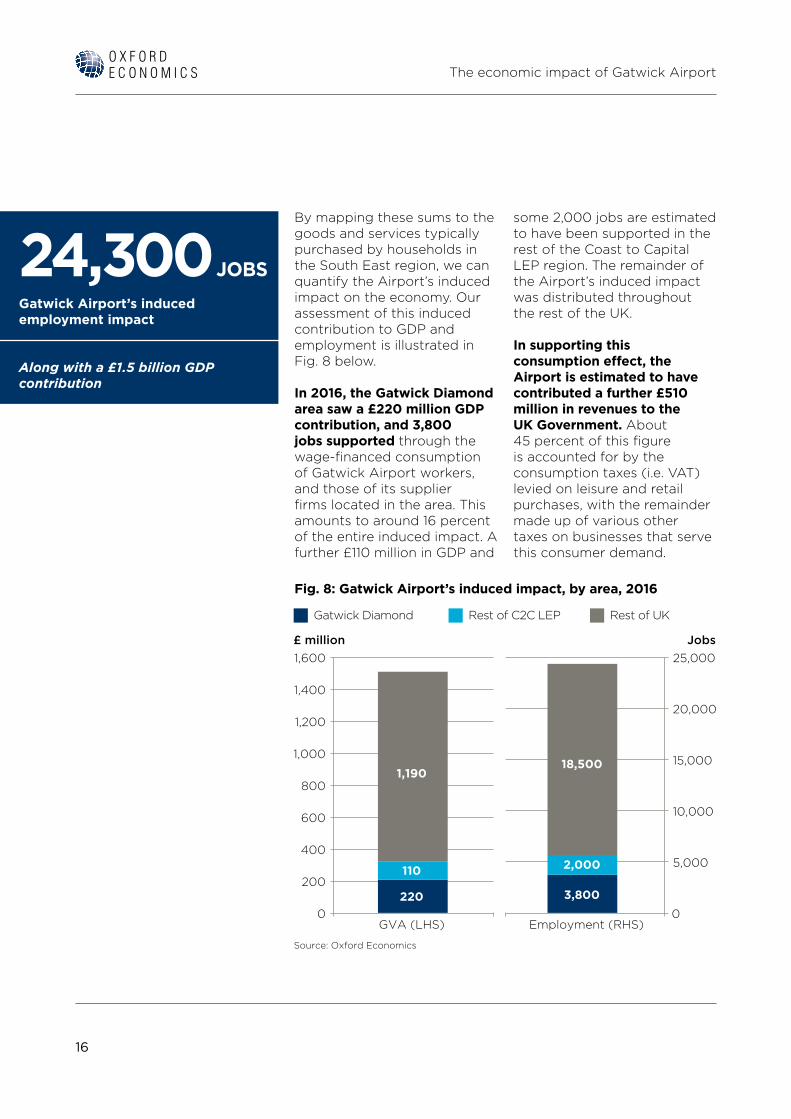
By mapping these sums to the goods and services typically purchased by households in the South East region, we can quantify the Airport’s induced impact on the economy. Our assessment of this induced contribution to GDP and employment is illustrated in Fig. 8 below.
In 2016, the Gatwick Diamond area saw a £220 million GDP contribution, and 3,800 jobs supported through the wage-financed consumption of Gatwick Airport workers, and those of its supplier firms located in the area. This amounts to around 16 percent of the entire induced impact. A further £110 million in GDP and
some 2,000 jobs are estimated to have been supported in the rest of the Coast to Capital LEP region. The remainder of the Airport’s induced impact was distributed throughout the rest of the UK.
In supporting this consumption effect, the Airport is estimated to have contributed a further £510 million in revenues to the UK Government. About 45 percent of this figure is accounted for by the consumption taxes (i.e. VAT) levied on leisure and retail purchases, with the remainder made up of various other taxes on businesses that serve this consumer demand.
Fig. 8: Gatwick Airport’s induced impact, by area, 2016
24,300 JOBSGatwick Airport’s induced employment impact
Along with a £1.5 billion GDP contribution
1,600 25,000
20,000
15,000
10,000
5,000
1,400
1,200
1,000
800
600
400
200
0 0GVA (LHS) Employment (RHS)
£ million Jobs
Source: Oxford Economics
1,190
220
110
18,500
2,000
3,800
Gatwick Diamond Rest of C2C LEP Rest of UK
17
The economic impact of Gatwick Airport
2.2 THE AIRPORT’S CATALYTIC IMPACT
14 This is Atlanta’s Hartsfield-Jackson International Airport, which handled 101.5 million passengers in 2015.
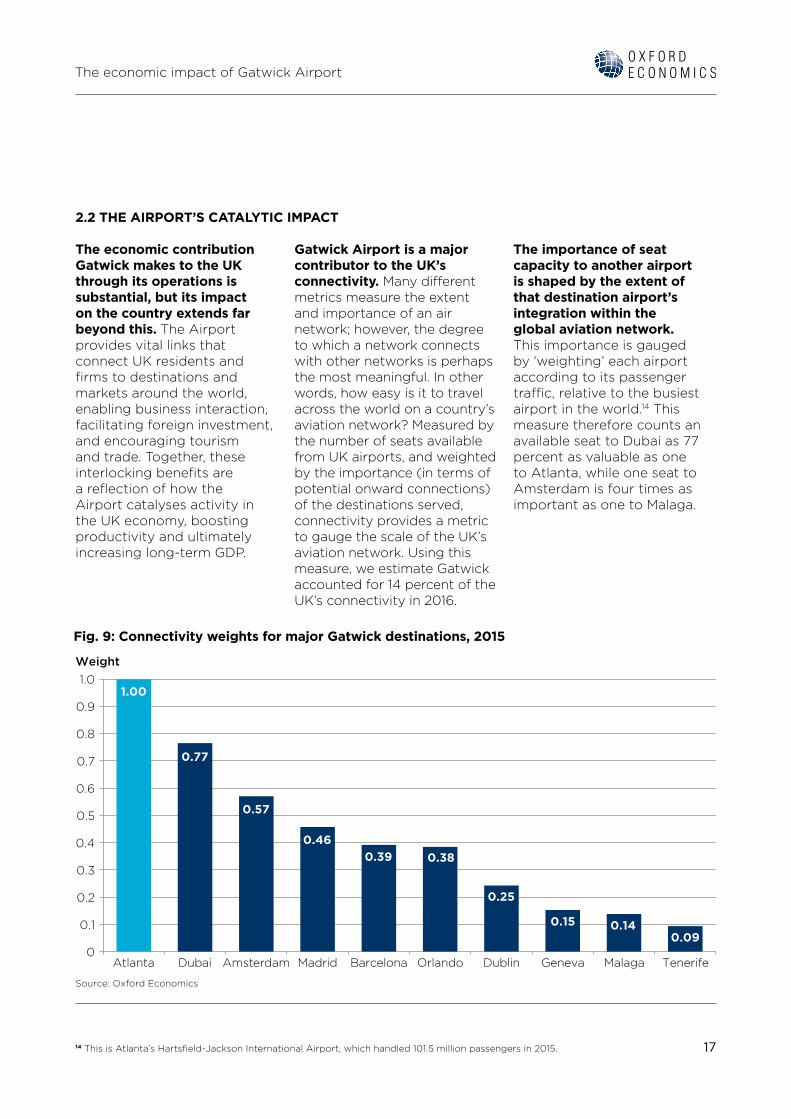
The economic contribution Gatwick makes to the UK through its operations is substantial, but its impact on the country extends far beyond this. The Airport provides vital links that connect UK residents and firms to destinations and markets around the world, enabling business interaction, facilitating foreign investment, and encouraging tourism and trade. Together, these interlocking benefits are a reflection of how the Airport catalyses activity in the UK economy, boosting productivity and ultimately increasing long-term GDP.
Gatwick Airport is a major contributor to the UK’s connectivity. Many different metrics measure the extent and importance of an air network; however, the degree to which a network connects with other networks is perhaps the most meaningful. In other words, how easy is it to travel across the world on a country’s aviation network? Measured by the number of seats available from UK airports, and weighted by the importance (in terms of potential onward connections) of the destinations served, connectivity provides a metric to gauge the scale of the UK’s aviation network. Using this measure, we estimate Gatwick accounted for 14 percent of the UK’s connectivity in 2016.
The importance of seat capacity to another airport is shaped by the extent of that destination airport’s integration within the global aviation network. This importance is gauged by ‘weighting’ each airport according to its passenger traffic, relative to the busiest airport in the world.14 This measure therefore counts an available seat to Dubai as 77 percent as valuable as one to Atlanta, while one seat to Amsterdam is four times as important as one to Malaga.
0
1.0
0.9
0.8
0.7
0.6
0.5
0.4
0.3
0.2
0.1
Atlanta Dubai Amsterdam Madrid Barcelona Orlando Dublin Geneva Malaga Tenerife
Weight
Source: Oxford Economics
1.00
0.77
0.57
0.460.39 0.38
0.25
0.15 0.140.09
Fig. 9: Connectivity weights for major Gatwick destinations, 2015
18
The economic impact of Gatwick Airport
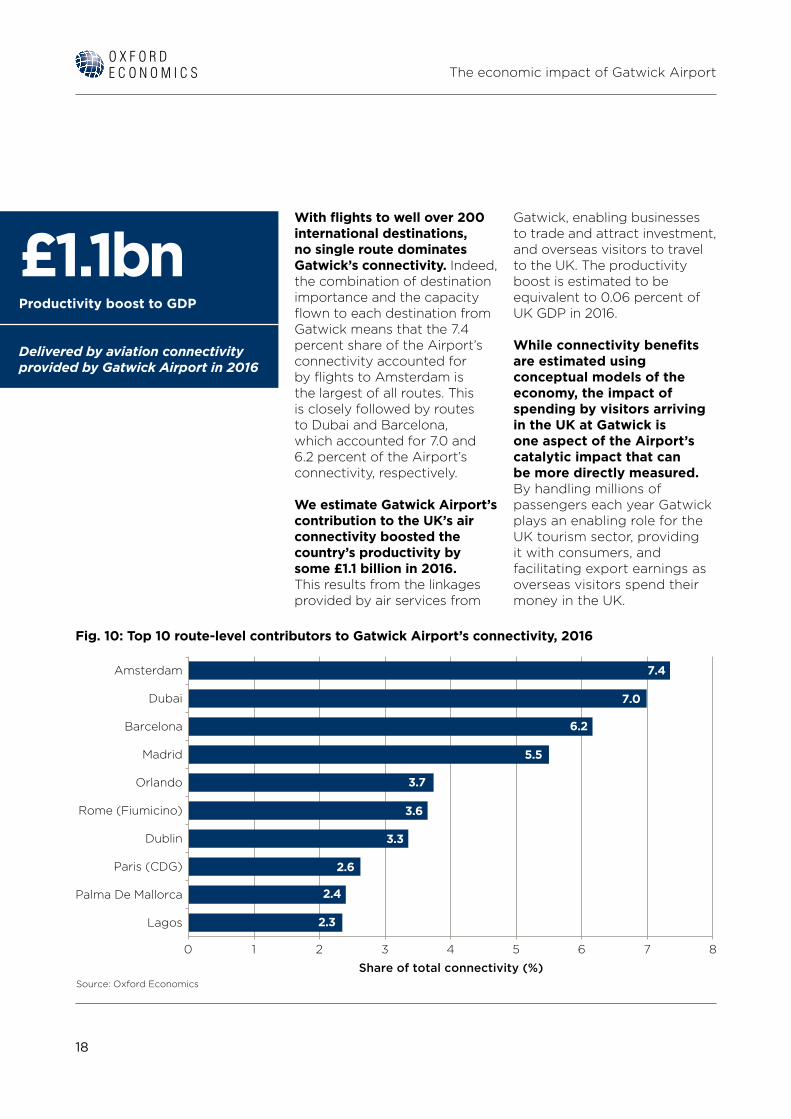
With flights to well over 200 international destinations, no single route dominates Gatwick’s connectivity. Indeed, the combination of destination importance and the capacity flown to each destination from Gatwick means that the 7.4 percent share of the Airport’s connectivity accounted for by flights to Amsterdam is the largest of all routes. This is closely followed by routes to Dubai and Barcelona, which accounted for 7.0 and 6.2 percent of the Airport’s connectivity, respectively.
We estimate Gatwick Airport’s contribution to the UK’s air connectivity boosted the country’s productivity by some £1.1 billion in 2016. This results from the linkages provided by air services from
Gatwick, enabling businesses to trade and attract investment, and overseas visitors to travel to the UK. The productivity boost is estimated to be equivalent to 0.06 percent of UK GDP in 2016.
While connectivity benefits are estimated using conceptual models of the economy, the impact of spending by visitors arriving in the UK at Gatwick is one aspect of the Airport’s catalytic impact that can be more directly measured. By handling millions of passengers each year Gatwick plays an enabling role for the UK tourism sector, providing it with consumers, and facilitating export earnings as overseas visitors spend their money in the UK.
876
7.4
7.0
6.2
5.5
3.7
3.6
3.3
2.6
2.4
2.3
543210
Share of total connectivity (%)Source: Oxford Economics
Amsterdam
Dubai
Barcelona
Madrid
Orlando
Rome (Fiumicino)
Dublin
Paris (CDG)
Palma De Mallorca
Lagos
Fig. 10: Top 10 route-level contributors to Gatwick Airport’s connectivity, 2016
£1.1bnProductivity boost to GDP
Delivered by aviation connectivity provided by Gatwick Airport in 2016
19
The economic impact of Gatwick Airport
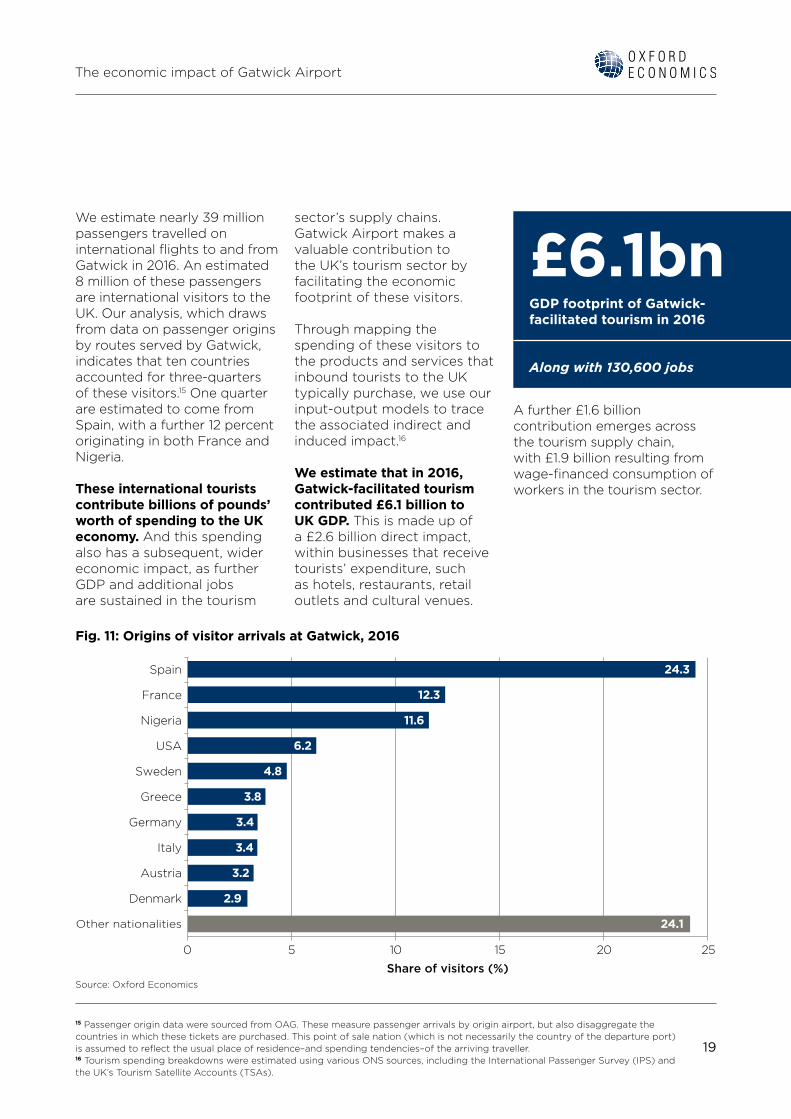
We estimate nearly 39 million passengers travelled on international flights to and from Gatwick in 2016. An estimated 8 million of these passengers are international visitors to the UK. Our analysis, which draws from data on passenger origins by routes served by Gatwick, indicates that ten countries accounted for three-quarters of these visitors.15 One quarter are estimated to come from Spain, with a further 12 percent originating in both France and Nigeria.
These international tourists contribute billions of pounds’ worth of spending to the UK economy. And this spending also has a subsequent, wider economic impact, as further GDP and additional jobs are sustained in the tourism
15 Passenger origin data were sourced from OAG. These measure passenger arrivals by origin airport, but also disaggregate the countries in which these tickets are purchased. This point of sale nation (which is not necessarily the country of the departure port) is assumed to reflect the usual place of residence–and spending tendencies–of the arriving traveller.16 Tourism spending breakdowns were estimated using various ONS sources, including the International Passenger Survey (IPS) and the UK’s Tourism Satellite Accounts (TSAs).
sector’s supply chains. Gatwick Airport makes a valuable contribution to the UK’s tourism sector by facilitating the economic footprint of these visitors.
Through mapping the spending of these visitors to the products and services that inbound tourists to the UK typically purchase, we use our input-output models to trace the associated indirect and induced impact.16
We estimate that in 2016, Gatwick-facilitated tourism contributed £6.1 billion to UK GDP. This is made up of a £2.6 billion direct impact, within businesses that receive tourists’ expenditure, such as hotels, restaurants, retail outlets and cultural venues.
A further £1.6 billion contribution emerges across the tourism supply chain, with £1.9 billion resulting from wage-financed consumption of workers in the tourism sector.
25
11.6
6.2
4.8
3.8
3.4
3.4
3.2
2.9
24.1
20151050
Share of visitors (%)Source: Oxford Economics
Spain
France
Nigeria
USA
Sweden
Greece
Germany
Italy
Austria
Denmark
Other nationalities
24.3
12.3
Fig. 11: Origins of visitor arrivals at Gatwick, 2016
£6.1bnGDP footprint of Gatwick-facilitated tourism in 2016
Along with 130,600 jobs
20
The economic impact of Gatwick Airport
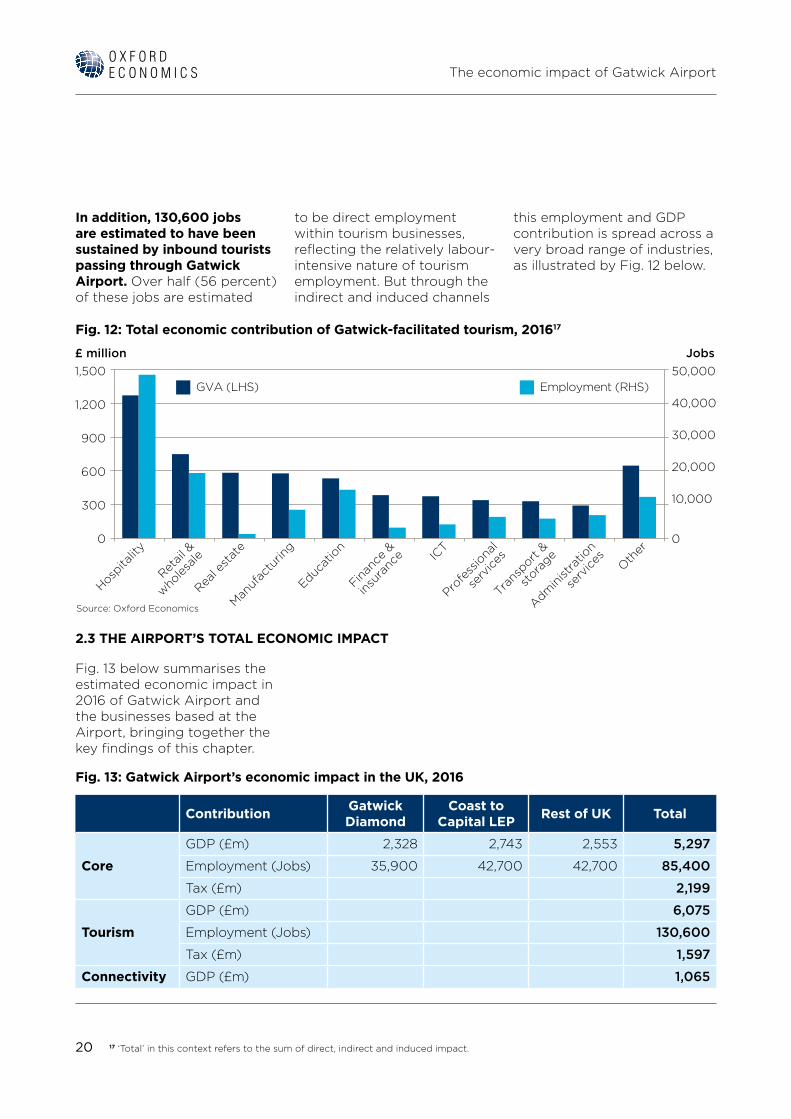
Fig. 12: Total economic contribution of Gatwick-facilitated tourism, 201617
17 ‘Total’ in this context refers to the sum of direct, indirect and induced impact.
In addition, 130,600 jobs are estimated to have been sustained by inbound tourists passing through Gatwick Airport. Over half (56 percent) of these jobs are estimated
to be direct employment within tourism businesses, reflecting the relatively labour-intensive nature of tourism employment. But through the indirect and induced channels
this employment and GDP contribution is spread across a very broad range of industries, as illustrated by Fig. 12 below.
2.3 THE AIRPORT’S TOTAL ECONOMIC IMPACT
Fig. 13 below summarises the estimated economic impact in 2016 of Gatwick Airport and the businesses based at the Airport, bringing together the key findings of this chapter.
Fig. 13: Gatwick Airport’s economic impact in the UK, 2016
Contribution Gatwick Diamond
Coast to Capital LEP Rest of UK Total
Core
GDP (£m) 2,328 2,743 2,553 5,297
Employment (Jobs) 35,900 42,700 42,700 85,400
Tax (£m) 2,199
Tourism
GDP (£m) 6,075
Employment (Jobs) 130,600
Tax (£m) 1,597
Connectivity GDP (£m) 1,065
0
300
600
900
1,200
1,500 50,000
40,000
30,000
20,000
10,000
0
Hospita
lity
Real e
stat
e
Man
ufac
turin
g
Educat
ion
ICT
Retail
&
who
lesale
Finan
ce &
insu
ranc
e
Profe
ssio
nal
serv
ices
Trans
port &
stora
ge
Admin
istra
tion
serv
ices
Other
£ million Jobs
Source: Oxford Economics
GVA (LHS) Employment (RHS)

22
The economic impact of Gatwick Airport
3.1 GATWICK’S CORE IMPACT IN 2025
18 For more detail on the forecasting method and assumptions and data underpinning them, see Appendix 2.
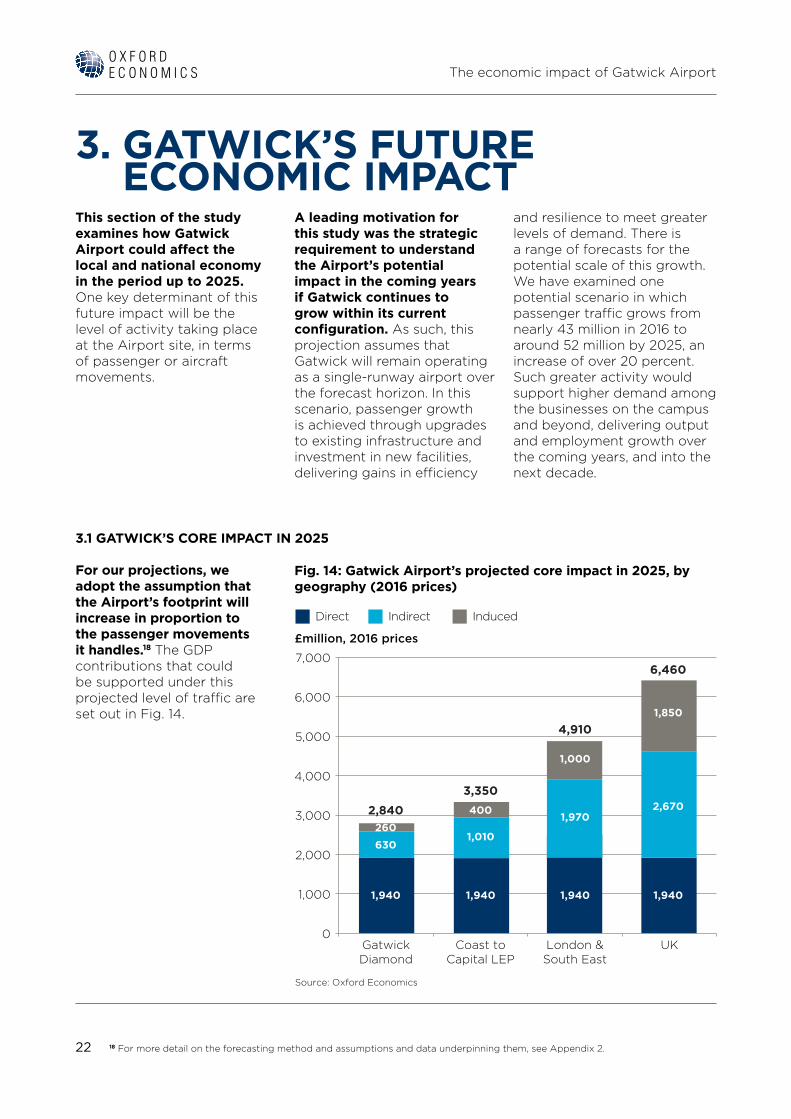
For our projections, we adopt the assumption that the Airport’s footprint will increase in proportion to the passenger movements it handles.18 The GDP contributions that could be supported under this projected level of traffic are set out in Fig. 14.
3. GATWICK’S FUTURE ECONOMIC IMPACT
This section of the study examines how Gatwick Airport could affect the local and national economy in the period up to 2025. One key determinant of this future impact will be the level of activity taking place at the Airport site, in terms of passenger or aircraft movements.
A leading motivation for this study was the strategic requirement to understand the Airport’s potential impact in the coming years if Gatwick continues to grow within its current configuration. As such, this projection assumes that Gatwick will remain operating as a single-runway airport over the forecast horizon. In this scenario, passenger growth is achieved through upgrades to existing infrastructure and investment in new facilities, delivering gains in efficiency
and resilience to meet greater levels of demand. There is a range of forecasts for the potential scale of this growth. We have examined one potential scenario in which passenger traffic grows from nearly 43 million in 2016 to around 52 million by 2025, an increase of over 20 percent. Such greater activity would support higher demand among the businesses on the campus and beyond, delivering output and employment growth over the coming years, and into the next decade.
Fig. 14: Gatwick Airport’s projected core impact in 2025, by geography (2016 prices)
0
6,000
5,000
4,000
3,000
2,000
1,000
7,000
GatwickDiamond
Coast toCapital LEP
London &South East
UK
£million, 2016 prices
Source: Oxford Economics
1,940
2,670
1,850
1,940
1,970
1,000
1,940
1,010
400
1,940
630260
6,460
4,910
3,3502,840
Direct Indirect Induced

23
The economic impact of Gatwick Airport
We estimate that 2025 could see firms on the Airport site directly generate over £1.9 billion in value-added contributions to GDP (measured in constant 2016 prices). This higher output would increase Gatwick Airport’s requirements from its supply chains, while supporting a greater level of wages and consumption. These broader linkages are projected to generate some £890 million in indirect and induced GDP contributions within the Gatwick Diamond, rising to £1.4 billion in the entire region of the Coast to Capital LEP.
We also estimate the numbers of jobs supported by the Airport in 2025. Our approach estimates the number of jobs required to deliver output necessitated by the passenger projections, after taking into account the likely productivity of the relevant workers in 2025.
We estimate Gatwick could see direct employment of around 26,800 people in 2025, on a headcount basis. Taking into account the supply chain activity and wage-financed consumption associated with the Airport, we estimate that the Gatwick Diamond could
see 41,000 jobs supported by Gatwick’s activities. The equivalent figures in the region of the Coast to Capital LEP and the entire UK are 49,000 and 98,000, respectively.
Fig. 15: Projected employment associated with Gatwick Airport, 2025
0
80,000
60,000
40,000
20,000
100,000
GatwickDiamond
Coast toCapital LEP
London &South East
UK
Persons
Source: Oxford Economics
26,800
43,000
28,000
26,800
29,000
14,000
26,800
15,000
7,000
26,800
9,000
4,000
98,000
70,000
49,000
41,000
Direct Indirect Induced
24
The economic impact of Gatwick Airport
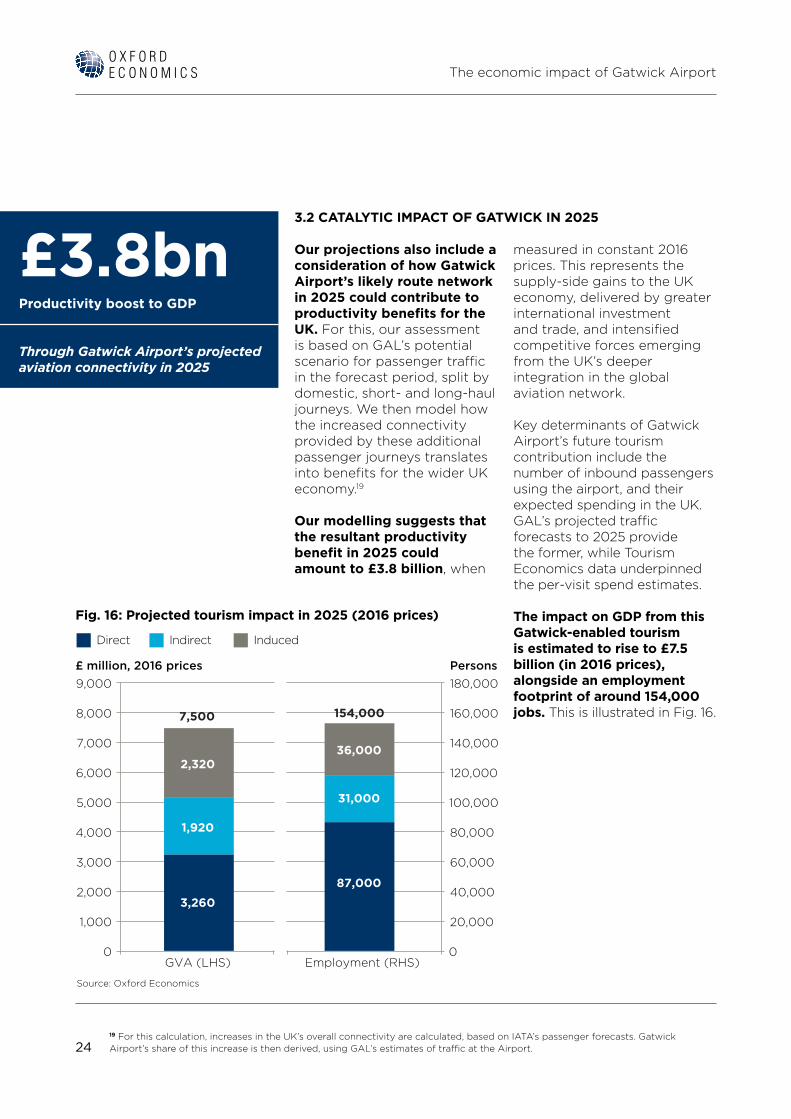
3.2 CATALYTIC IMPACT OF GATWICK IN 2025
19 For this calculation, increases in the UK’s overall connectivity are calculated, based on IATA’s passenger forecasts. Gatwick Airport’s share of this increase is then derived, using GAL’s estimates of traffic at the Airport.
Our projections also include a consideration of how Gatwick Airport’s likely route network in 2025 could contribute to productivity benefits for the UK. For this, our assessment is based on GAL’s potential scenario for passenger traffic in the forecast period, split by domestic, short- and long-haul journeys. We then model how the increased connectivity provided by these additional passenger journeys translates into benefits for the wider UK economy.19
Our modelling suggests that the resultant productivity benefit in 2025 could amount to £3.8 billion, when
measured in constant 2016 prices. This represents the supply-side gains to the UK economy, delivered by greater international investment and trade, and intensified competitive forces emerging from the UK’s deeper integration in the global aviation network.
Key determinants of Gatwick Airport’s future tourism contribution include the number of inbound passengers using the airport, and their expected spending in the UK. GAL’s projected traffic forecasts to 2025 provide the former, while Tourism Economics data underpinned the per-visit spend estimates.
The impact on GDP from this Gatwick-enabled tourism is estimated to rise to £7.5 billion (in 2016 prices), alongside an employment footprint of around 154,000 jobs. This is illustrated in Fig. 16.
Fig. 16: Projected tourism impact in 2025 (2016 prices)
Persons9,000 180,000
160,000
140,000
120,000
100,000
80,000
60,000
40,000
20,000
8,000
7,000
6,000
5,000
4,000
3,000
2,000
1,000
0 0GVA (LHS) Employment (RHS)
£ million, 2016 prices
Source: Oxford Economics
2,320
7,500 154,000
3,260
1,920
36,000
31,000
87,000
Direct Indirect Induced
£3.8bnProductivity boost to GDP
Through Gatwick Airport’s projected aviation connectivity in 2025
25
The economic impact of Gatwick Airport
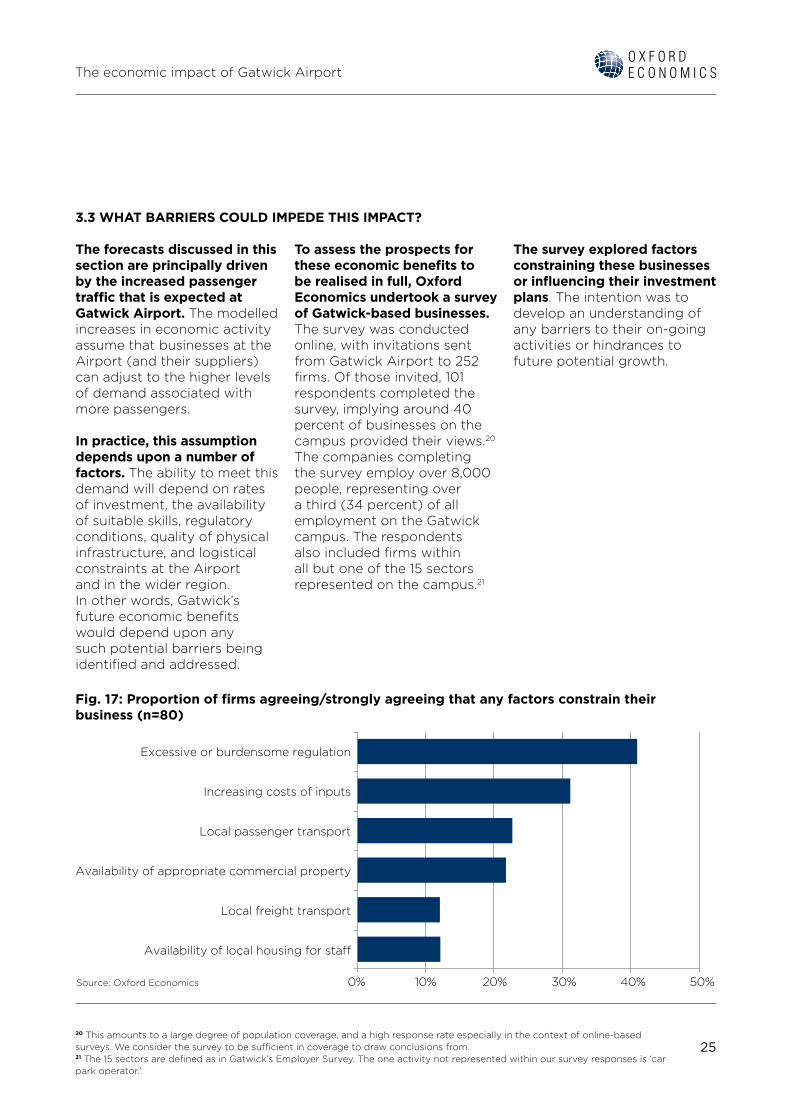
3.3 WHAT BARRIERS COULD IMPEDE THIS IMPACT?
20 This amounts to a large degree of population coverage, and a high response rate especially in the context of online-based surveys. We consider the survey to be sufficient in coverage to draw conclusions from. 21 The 15 sectors are defined as in Gatwick’s Employer Survey. The one activity not represented within our survey responses is ‘car park operator.’
The forecasts discussed in this section are principally driven by the increased passenger traffic that is expected at Gatwick Airport. The modelled increases in economic activity assume that businesses at the Airport (and their suppliers) can adjust to the higher levels of demand associated with more passengers.
In practice, this assumption depends upon a number of factors. The ability to meet this demand will depend on rates of investment, the availability of suitable skills, regulatory conditions, quality of physical infrastructure, and logistical constraints at the Airport and in the wider region. In other words, Gatwick’s future economic benefits would depend upon any such potential barriers being identified and addressed.
To assess the prospects for these economic benefits to be realised in full, Oxford Economics undertook a survey of Gatwick-based businesses. The survey was conducted online, with invitations sent from Gatwick Airport to 252 firms. Of those invited, 101 respondents completed the survey, implying around 40 percent of businesses on the campus provided their views.20 The companies completing the survey employ over 8,000 people, representing over a third (34 percent) of all employment on the Gatwick campus. The respondents also included firms within all but one of the 15 sectors represented on the campus.21
The survey explored factors constraining these businesses or influencing their investment plans. The intention was to develop an understanding of any barriers to their on-going activities or hindrances to future potential growth.
Fig. 17: Proportion of firms agreeing/strongly agreeing that any factors constrain their business (n=80)
0% 10% 20% 30% 40% 50%Source: Oxford Economics
Excessive or burdensome regulation
Increasing costs of inputs
Local passenger transport
Availability of appropriate commercial property
Local freight transport
Availability of local housing for sta�

26
The economic impact of Gatwick Airport
Two-thirds (67 percent) of respondents identified at least one factor constraining their business, with 66 percent seeing an issue that was limiting their expansion. A smaller proportion, 47 percent, identified at least one factor influencing their investment plans. However, there was significant variation in the typical barriers identified, depending on the type and size of business in question.
Our survey suggests that the experiences of Airport-based firms differ notably according to their size. One example of this trend is in recruitment behaviour, with four in five large businesses and about two-thirds (64 percent) of medium-sized businesses surveyed having recruited for expansion purposes in the last 12 months. Meanwhile small firms, which make up the majority (70 percent) of firms on the Gatwick campus, are far less likely to have sought to expand.
However, outside of one or two issues, there was broad disagreement that any of the listed options were causing general constraints to trading. The most significant factor constricting mid-sized and large firms was the availability of professional staff: a net balance of 15 and 33 percent saw this as a limiting factor. This is set out in Fig. 18.
Fig. 18: Net balance of medium-sized and large firms agreeing that factors are limiting expansion (n=16)22
22 ‘Net balance’ here refers to the proportion of responses indicating agreement, less the proportion indicating disagreement. To take account of the scale of response, responses indicating ‘strongly’ agreeing/disagreeing are weighted twice as heavily as those indicating agreement/disagreement.
–100%
–80%
–60%
–40%
–20%
0%
20%
40%
Availa
bility
of
profe
ssio
nal s
ta�
Leve
l of
deman
d/sale
s
Availa
bility
of
syst
ems c
apac
ity
Availa
bility
of
cleric
al st
a�
Domes
tic
com
petiti
on
Overs
eas
com
petiti
on
Ability
to
raise
fund
s
Jobs
Source: Oxford Economics
Medium Large

27
The economic impact of Gatwick Airport
In terms of the diversity of issues, respondents from medium-sized firms identified the most factors constraining the running of their businesses. The most significant was excessive/burdensome regulation, with a net balance of 10 percent and 14 percent of medium-sized and small firms, respectively, saying this was a constricting factor. Respondents from large businesses point out local passenger transport as their biggest constraint, with a net balance of 17 percent in agreement.
Building, development and maintenance contractors are more likely to have been seeking expansion than the average Gatwick business. These firms are the single most common business type at Gatwick Airport (accounting for 25 percent of campus firms but just five percent of non-GAL employment), and two-fifths (39 percent) have recruited for expansion purposes in the last 12 months. But they also identify more operational challenges than the average firm, including domestic competition and demand, excessive or burdensome regulation and increases in input costs.
Retail businesses, accounting for 13 percent of firms on the Gatwick campus and nine percent of Gatwick Airport’s employment, face unique challenges. In particular, respondents were particularly concerned by the quality of local passenger transport links, and the availability of commercial space.
Fig. 19: Net balance of building and maintenance contractors agreeing that factors are limiting expansion (n=23)
–40%
–20%
0%
20%
40%
–30%
–10%
10%
30%
Availa
bility
of
profe
ssio
nal s
ta�
Leve
l of
deman
d/sale
s
Availa
bility
of
syst
ems c
apac
ity
Availa
bility
of
cleric
al st
a�
Domes
tic
com
petiti
on
Overs
eas
com
petiti
on
Ability
to
raise
fund
s
Source: Oxford Economics
28
The economic impact of Gatwick Airport
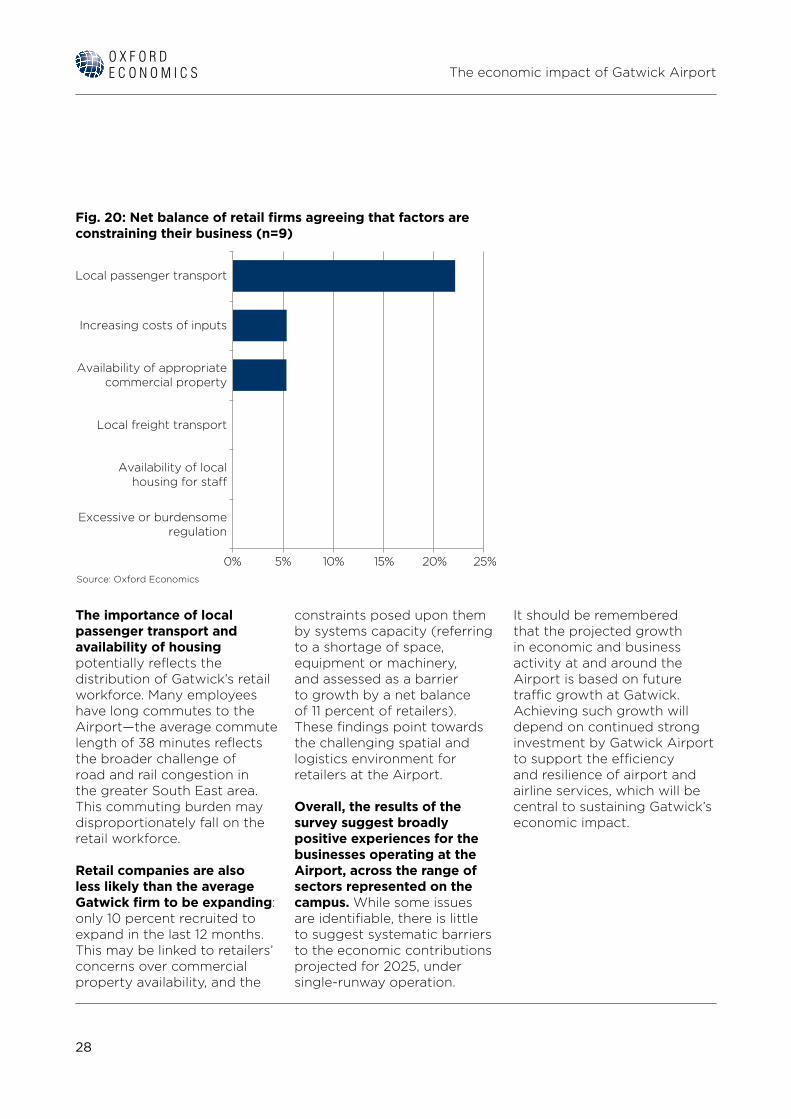
The importance of local passenger transport and availability of housing potentially reflects the distribution of Gatwick’s retail workforce. Many employees have long commutes to the Airport—the average commute length of 38 minutes reflects the broader challenge of road and rail congestion in the greater South East area. This commuting burden may disproportionately fall on the retail workforce.
Retail companies are also less likely than the average Gatwick firm to be expanding: only 10 percent recruited to expand in the last 12 months. This may be linked to retailers’ concerns over commercial property availability, and the
constraints posed upon them by systems capacity (referring to a shortage of space, equipment or machinery, and assessed as a barrier to growth by a net balance of 11 percent of retailers). These findings point towards the challenging spatial and logistics environment for retailers at the Airport.
Overall, the results of the survey suggest broadly positive experiences for the businesses operating at the Airport, across the range of sectors represented on the campus. While some issues are identifiable, there is little to suggest systematic barriers to the economic contributions projected for 2025, under single-runway operation.
It should be remembered that the projected growth in economic and business activity at and around the Airport is based on future traffic growth at Gatwick. Achieving such growth will depend on continued strong investment by Gatwick Airport to support the efficiency and resilience of airport and airline services, which will be central to sustaining Gatwick’s economic impact.
Fig. 20: Net balance of retail firms agreeing that factors are constraining their business (n=9)
0% 5% 10% 15% 20% 25%Source: Oxford Economics
Excessive or burdensomeregulation
Increasing costs of inputs
Local passenger transport
Availability of appropriatecommercial property
Local freight transport
Availability of localhousing for sta�

30
The economic impact of Gatwick Airport
4. CONCLUSIONGatwick Airport provides important economic benefits to the local, regional and national economy. The procurement of campus businesses, and the wage-spending multiplier impact, extends its ‘core’ economic footprint throughout south-east England and the wider UK.
Through these channels of impact, the Airport contributed £5.3 billion in GDP to the national economy in 2016, while sustaining 85,000 jobs. Moreover, the transactions, employment and profits associated with this economic activity saw the UK Government accrue around £2.2 billion in tax revenues.
This nationwide impact is concentrated in the Gatwick Diamond, made up of the local authorities surrounding the Airport. Over 11,500 workers at Gatwick reside within the Diamond, and firms within its boundaries accrued £1.1 billion in Airport-related procurement expenditure during 2016. About 43 percent of the Airport’s total output and employment footprint is felt within these seven boroughs, underlining the centrality of Gatwick to the local economy.
The Airport also provides wider benefits, thanks to its provision of infrastructure for aviation services. It enhances the UK’s productivity by integrating the economy with producers and consumers in markets around the world. Additionally, international visitors to the UK arriving via Gatwick are a major boost to the British tourism sector, supporting billions of pounds’ worth of GDP and hundreds of thousands of jobs.
These economic contributions have the potential to rise alongside Gatwick’s passenger traffic in the coming years. We estimate, under one scenario of passenger traffic growing by around 20% from 2016 to 2025, the Airport’s activity would facilitate an increased economic impact, reaching £6.5 billion in GDP terms (measured in 2016 prices) and around 98,000 jobs.
While there are a diversity of challenges facing firms operating at Gatwick Airport, our study suggests few substantial barriers to achieving this future impact. Businesses on the campus report generally positive experiences, and few fundamental impediments to their expansion. The more widespread constraints identified include the availability of professional staff for expansion, and issues with travelling to work for retail staff. These factors highlight the links between development at Gatwick, and the transport and housing infrastructure needs of the wider regional economy.
31
The economic impact of Gatwick Airport
5. APPENDIX 1: GLOSSARYCatalytic impacts: refer to the activity in the economy enabled and/or stimulated by aviation services. The impacts revolve around the benefits of air connectivity. The services provided by air transport connect people and businesses in one country with the rest of the world, facilitating a wide range of economic activity in both the local and global economy; from enabling business interaction to facilitating foreign investment, and encouraging tourism and trade. Ultimately, these inter-related ‘catalytic’ benefits act to boost the productivity of the economy and hence GDP.
Compensation of employees: gross wages of employees in employment (excluding the self-employed), including the value of employees’ and employers’ social contributions.
Connectivity: measures how well-connected a country is to the global air transport network. Defined as the number of seats available from an airport or country, weighted by the importance of the destinations served. The weights reflect how “connected” each destination is in terms of potential onward connections, and are approximated by the total number of passengers at each destination airport relative to Atlanta (the world’s largest airport in terms of annual traffic). The catalytic impacts of aviation are centered on the concept of connectivity and its benefits.
Core impacts: the economic ‘footprint’ of a company or sector within an economy, as measured by the activity relating to the operations and capital spending of the relevant company or sector. The metrics used in the measurement are usually GDP and employment.
Direct impact: The economic activity that relates to the company’s own operations.
Employment: the number of people employed, measured on a headcount basis.
GDP, or Gross Domestic Product: The total value of final goods and services produced in the economy within a given time period. The contribution of an individual producer, industry or sector to GDP can be understood as either: 1) the value of output (goods or services) less the value of intermediate inputs used in the production process; or 2) the sum of compensation of employees (gross wages) and gross operating surplus (profits).
Gross operating surplus: profits, defined as earnings before interest, taxes, depreciation and amortization (EBITDA).
Indirect impacts: The economic activity generated by the procurement of inputs of goods and services from local suppliers.
Induced impacts: The economic activity supported in the economy by staff (direct employment) and those employed in the company’s indirect supply chain spending their wage income, for example at retail and leisure outlets throughout the country.
Operational impacts: GDP and employment relating to the operations of the company or sector itself (direct impact) and the subsequent activity supported in the supply chain (indirect impact) and employees’ spending (induced impact).
Productivity: The ratio of GDP per person employed i.e., labour productivity.
Tourism/visitors’ spending: consumer spending by foreign visitors, principally on accommodation, catering, recreation, retail and other tourism-related goods/services.
Visitors: in the study visitors are foreign tourists or business travelers who are not normally resident in the country in question.
32
The economic impact of Gatwick Airport
6. APPENDIX 2: METHODOLOGY
23 United Nations, “Links between Business Accounting and National Accounting” (Report, United Nations, Department of Economics and Social Affairs, 2000), 29-33.24 Anthony T. Flegg and Timo Tohmo, “Estimating Regional Input Coefficients and Multipliers” (Working Paper, University of the West of England, Faculty of Business and Law, 2013), 5.
CORE IMPACT: DIRECT
In order to assess the direct economic impact of Gatwick Airport, we utilised separate methods for both GAL and non-GAL businesses.
For GAL, our estimate of GVA is the sum of its gross profit (EBITDA) and gross staff costs. This is a standard method consistent with the principles of national accounting.23 Its direct employment is stated as provided in the Gatwick Employer and Travel to Work Survey 2016 (hereinafter “Gatwick Employer Survey”).
For the non-GAL businesses, our starting point for estimating GVA was the Gatwick Employer Survey. These data provide salaries paid by each company to their workers, distributed across various wage bands. This breakdown allowed us to calculate the gross salary payments for Gatwick-related staff. We then utilised the Office for National Statistics’ (ONS) Regional Annual Business Survey (Regional ABS) to translate this into a direct GVA impact. This survey reveals, across hundreds of economic sectors in the South East region, the increment of GVA which typically accompanies each £1 of wage payments. Since this ratio varies depending on the type of activity a business undertakes, the calculation was performed at a detailed industrial level, for each of the 251 non-GAL businesses across 46 different business types.
For non-GAL direct employment, we utilised the Employer Survey data.
CORE IMPACT: INDIRECT
The first stage of the indirect impact calculation involved obtaining detailed information from GAL regarding the registered names and locations of their suppliers, and the sums spent with them. This was converted into an industrial breakdown, using Companies House data detailing the registered Standard Industrial Classification (SIC 2007) code of the relevant businesses. This was done in order to put the procurement data into a form consistent with Oxford Economics’ input-output (I-O) models.
For non-GAL businesses, a procurement total for each business was estimated using the Gatwick Employer Survey and Regional ABS. This allowed the estimation of how much output, value-added and hence procurement (“intermediate consumption”) is observed, given production levels among the various businesses. We then utilised a sectoral breakdown of supply chains drawn from the ONS’ published supply-use tables for the UK.
Once these procurement expenditures were computed, we then used I-O modelling to calculate the resultant impacts, over all subsequent rounds of the Airport’s supply chains. For this, we constructed a
suite of bespoke regional and sub-regional I-O models.
These models are based on the national UK input-output tables, as published by the ONS. Oxford Economics use official employment data to adjust these, in order to reflect the industrial structure and productive capacity in the Gatwick Diamond, Coast to Capital LEP, and South East of England. Our methodology utilises so-called ‘Flegg-adjusted Location Quotients (FLQs)’, which are consistent with the latest approaches and evidence in regional I-O modelling and regional science.24
These I-O models quantify the impact of Gatwick’s procurement demands over the entire length of its supply chain, including its suppliers’ suppliers, and so on. The regional modules estimate the extent to which these demands can be met within the Gatwick Diamond, the wider Coast to Capital LEP, the South East region, or elsewhere in the UK as a whole.
CORE IMPACT: INDUCED
For induced impact, the starting point is to understand the wages and salaries paid to workers at Gatwick Airport, and those of its supply chain. For Airport workers, the Employer Survey allowed the estimation of total salary payments during calendar year 2016. We were also able
33
The economic impact of Gatwick Airport
to distribute these salaries according to the home postcodes of workers on the Gatwick site, as recorded by campus security pass data. This allowed us to map consumption spending to the relevant local communities in which Airport workers reside. For workers in the Airport’s supply chains, we use our profiles of supply chain production as the starting point. To this, we apply average ratios of wage payments to overall output levels, cut by industry and region.
We then allocate these purchases to the industrial sectors providing goods and services to households (e.g., retail, restaurants, leisure outlets). The allocation follows the distribution of household spending in the UK’s national accounts, adjusted for the South East (and other relevant regions in the supply chain), in line with the ONS’ regional Family Spending survey. This demand was then inputted into our I-O based impact models, to calculate the total GDP and employment associated with this wage-financed consumption.
CATALYTIC IMPACT: CONNECTIVITY
Quantifying the wider ‘catalytic’ benefits linked to an airport’s facilitation of aviation services is not straightforward. The benefits of strong air transport
infrastructure emerge through its role in boosting competition, promoting international trade, facilitating tourism and encouraging inward investment. These are examples of catalytic benefits that Gatwick Airport delivers to the UK economy. But quantifying them is difficult, because many such effects materialize only over the long-term, and are hard to measure individually, or unpick them from wider economic trends.
Estimating Gatwick’s catalytic contribution requires us to disentangle connectivity’s overall contribution to long-term growth, from the many other factors that affect an economy’s performance. This is done by looking at how the economies of countries with faster-growing air connectivity perform relative to ones with slower-growing networks. Many studies have investigated the catalytic impact of aviation on GDP growth. A January 2015 econometric analysis by InterVISTAS deployed the most recent available data on connectivity, isolating its relationship to growth while controlling for other factors that may have an impact of GDP (such as education levels, R&D investment, capital spending, and institutional and regulatory factors).
This study used a definition of air connectivity developed by IATA, that counts the number of seats available from an airport or country, and weights
them by the importance of the destinations served from that airport or country. The weights reflect how ‘connected’ each destination is, in terms of potential onward connections, and is approximated comparing the total passengers at each airport to Atlanta (the world’s busiest airport in terms of passenger movements). As such, services to regional and global hubs therefore provide a greater boost to connectivity than flights to smaller airports. For example, one available seat to Schiphol will contribute more connectivity for the UK than an available seat to La Rochelle.
The research found that a 10 per cent increase in connectivity (relative to GDP) was associated with an increase in GDP per capita of 0.5 percent. As the relationship is expressed in growth terms, a base year must be chosen, from which to estimate connectivity impacts. In other words, the impact is the additional GDP since the base year, associated with the increase in connectivity that occurred over the relevant period.
Using data sourced from Diio, which records aviation services and their capacities, Oxford Economics applied this methodology to estimate connectivity’s contribution to the UK’s overall productivity growth since 2000 (chosen as base year since this is the earliest available data from Diio). An equivalent
34
The economic impact of Gatwick Airport
calculation was performed using flights and capacity data that excluded services from Gatwick Airport. The difference between these two estimates represents the contribution of Gatwick Airport to UK GDP, through connectivity effects.
CATALYTIC IMPACT: TOURISM
The approach employed to estimate the impact of Gatwick-facilitated tourism involved three main steps. First, foreign arrivals carried on inbound services were estimated, split by true origin. ‘True origin’ is the country in which the passenger is resident, and is not necessarily the same as the departure point of the flight. True origins are estimated using OAG data, detailing bookings by their points of sale (i.e. the nations in which passengers purchased their flights to Gatwick).
Passengers who are resident in the UK, who by definition do not contribute to tourism impacts, are excluded from the subsequent spending analysis. The second step involved applying International Passenger Survey (IPS) data on inbound spending per international arrival in the UK, by origin country/region.
The final step was then to convert the tourism spend into GDP, employment and tax impacts. This was
achieved by breaking down total tourism spending into specific tourism products (e.g. hotels, restaurants, transport, cultural attractions, etc.) using data from the ONS’ Tourism Satellite Accounts. The products were then allocated to industry sectors, consistent with Oxford Economics’ suite of I-O models for the UK. The I-O model then produced direct, indirect and induced GDP and employment impacts, resulting from tourism spending. This approach is akin to the methodology adopted in the core impact analysis.
FORECASTED IMPACT: CORE
For forecasting how Gatwick’s core contribution may change over future years, GAL provided estimates of passenger numbers in the years leading to 2025/26. Since we present forecasts in constant 2016 prices, we increased the Airport’s revenues by the same proportion (i.e. assuming a constant rate of earnings per passenger).
We then estimate the Airport’s direct GDP contribution, using the same GVA-to-revenues ratio as was observed in 2016. This is a conservative approach that assumes that there is no marked increase/ decrease in efficiency at the Airport (in other words, for businesses on the Airport site to net each £1 of revenues, the
same increment of bought-in goods and services are required).
For direct employment, our projection is based on the increases in campus staffing levels observed between the 2012 and 2016 editions of the Gatwick Employers’ Survey, along with growth in passenger movements over that time. We leverage this relationship, along with 2025 passenger forecasts, to derive an estimate for direct employment in that year.
FORECASTED IMPACT: INDIRECT & INDUCED
The GDP contribution emerging from Gatwick’s future activities was forecasted using the same methodology as the estimates pertaining to 2016. In this sense, the modelling does not attempt to capture any dramatic structural changes that may occur within the UK economy over the upcoming decade: purchasing and supply relationships are held constant.
For the wider indirect and induced employment footprint, our forecast uses the existing (2016) productivity of workers in Gatwick Airport’s supply chains as a starting point. We then uplift these over the forecast horizon, to the extent of Tourism Economics’ forecasts for productivity improvements in the tourism industries.
35
The economic impact of Gatwick Airport
FORECASTED IMPACT: CONNECTIVITY
To forecast how Gatwick Airport’s contribution to the UK’s connectivity may change in future, we first forecasted increases in the UK’s overall connectivity. This projection was based on IATA’s long-term forecasts for passenger arrivals in the UK. Gatwick Airport’s share of this increase was then derived using GAL’s estimates for traffic at the airport.
FORECASTED IMPACT: TOURISM
Tourism spending impacts were calculated using GAL’s estimates of traffic growth. We used these to increase the numbers of overseas arrivals to the UK, by nationality (holding constant the shares of each nation/region within the long-haul and short-haul markets at Gatwick). For spending per visit, we used the IPS-based 2016 figures as a starting point. We then applied forecasts for growth in spending per international arrival in the UK, by origin country/region. This uses Oxford Economics’ Tourism Decision Metrics (TDM) data.
36
The economic impact of Gatwick Airport
OXFORD ECONOMICSOxford Economics was founded in 1981 as a commercial venture with Oxford University’s business college to provide economic forecasting and modelling to UK companies and financial institutions expanding abroad. Since then, we have become one of the world’s foremost independent global advisory firms, providing reports, forecasts and analytical tools on 200 countries, 100 industrial sectors and over 3,000 cities. Our best-of-class global economic and industry models and analytical tools give us an unparalleled ability to forecast external market trends and assess their economic, social and business impact.
Headquartered in Oxford, England, with regional centres in London, New York, and Singapore, Oxford Economics has offices across the globe in Belfast, Chicago, Dubai, Miami, Milan, Paris, Philadelphia, San Francisco, and Washington DC. We employ over 230 full-time people, including more than 150 professional economists, industry experts and business editors—one of the largest teams of macroeconomists and thought leadership specialists. Our global team is highly skilled in a full range of research techniques and thought leadership capabilities, from econometric modelling, scenario framing, and economic impact analysis to market surveys, case studies, expert panels, and web analytics. Underpinning our in-house expertise is a contributor network of over 500 economists, analysts and journalists around the world.
Oxford Economics is a key adviser to corporate, financial and government decision-makers and thought leaders. Our worldwide client base now comprises over 1000 international organisations, including leading multinational companies and financial institutions; key government bodies and trade associations; and top universities, consultancies, and think tanks.
January 2017
All data shown in tables and charts are Oxford Economics’ own data, except where otherwise stated and cited in footnotes, and are copyright © Oxford Economics Ltd.
The modelling and results presented here are based on information provided by third parties, upon which Oxford Economics has relied in producing its report and forecasts in good faith. Any subsequent revision or update of those data will affect the assessments and projections shown.
To discuss the report further please contact:
Osman Ismail: [email protected]
Oxford EconomicsBroadwall House, 21 Broadwall, London, SE1 9PL, UK
Tel: +44 207 803 1400


Europe, Middle East,and Africa:
Global headquartersOxford Economics Ltd Abbey House 121 St Aldates Oxford, OX1 1HBUKTel: +44 (0)1865 268900
LondonBroadwall House 21 Broadwall London, SE1 9PL UKTel: +44 (0)20 7803 1418
BelfastLagan House Sackville Street LisburnCounty Antrim,BT27 4AB UKTel: + 44 (0)2892 635400
Paarl12 Cecilia StreetPaarl 7646South AfricaTel: +27(0)21 863-6200
FrankfurtMainzer Landstraße 4160329 Frankfurt am MainGermanyTel: +49 69 95 925 280
Paris3 Square Desaix75015 Paris FranceTel: +33 (0)1 78 91 50 52
MilanVia Cadorna 3 20080 Albairate (MI)ItalyTel: +39 02 9406 1054
DubaiJumeirah Lake Towers Dubai,UAE Tel: +971 56 396 7998
Americas:
New York5 Hanover Square, 19th Floor New York, NY 10004USATel: +1 (646) 786 1879
Philadelphia303 West Lancaster Avenue Suite 2e Wayne, PA 19087USATel: +1 (610) 995 9600
Mexico CityEmerson 150, Despacho 802Col. Polanco, Miguel HidalgoMéxico D.F., C.P. 11560Tel: +52 (55) 52503252
Boston51 Sawyer RoadBuilding 2 - Suite 220Waltham, MA 02453USATel: +1 (617) 206 6112
Chicago980 N. Michigan Avenue,Suite 1412 Chicago Illinois, IL 60611USATel: +1 (773) 372-5762
Los Angeles 2500 Broadway, Building F, Suite F-125Santa Monica, 90404Tel: +1 (424) 238-4331
Florida8201 Peters Road,Suite 1000Plantation,Miami 33324USATel: +1 (954) 916 5373
Toronto2425 Matheson Blvd East8th Floor Mississauga, OntarioL4W 5K4CanadaTel: +1 (905) 361 6573
Asia Pacific:
Singapore6 Battery Road#38-05Singapore 049909Tel: +65 6850 0110
Hong Kong30/F, Suite 3112Entertainment Building30 Queen’s Road CentralTel: +852 3103 1096
Tokyo4F Tekko Building1-8-2 MarunouchiTokyo100-0005Tel: +81 3 6870 7175
SydneyLevel 56, MLC Centre 19-21 Martin Place Sydney, NSWTel: +61 2 9220 1707
Email:[email protected]:www.oxfordeconomics.com