the economics of wireless data part 4: japan country view
TRANSCRIPT
www.morganmarkets.com
Asia Pacific Equity Research21 January 2013
The Economics of Wireless Data Part 4: Japan Country ViewDetailed Supply/Demand forecasts + Conclusions...
Asian Telecommunications
James R. Sullivan, CFA AC
(65) 6882-2374
J.P. Morgan Securities Singapore Private Limited
Hitoshi Hosoya AC
(81-3) 6736-8631
JPMorgan Securities Japan Co., Ltd.
Michelle Wei, CFA
(852) 2800-8562
J.P. Morgan Securities (Asia Pacific) Limited
Jesper J Koll
(81-3) 6736-8600
JPMorgan Securities Japan Co., Ltd.
See page 16 for analyst certification and important disclosures, including non-US analyst disclosures.J.P. Morgan does and seeks to do business with companies covered in its research reports. As a result, investors should be aware that the firm may have a conflict of interest that could affect the objectivity of this report. Investors should consider this report as only a single factor in making their investment decision.
Welcome to Part Four of our Economics of Wireless Data series. Parts 1-3 explored the impact of spectrum, population density, infrastructure, and technology choice on the new dynamics of data as a business model. Part Four consists of a series of country focused reports that updates and expands our wireless data supply / demand analysis. This edition focuses on Japan, the previous reports looked at Indonesia, Taiwan, China and Korea. Data capacity excel models are available for each market analyzed, please contact us for details.
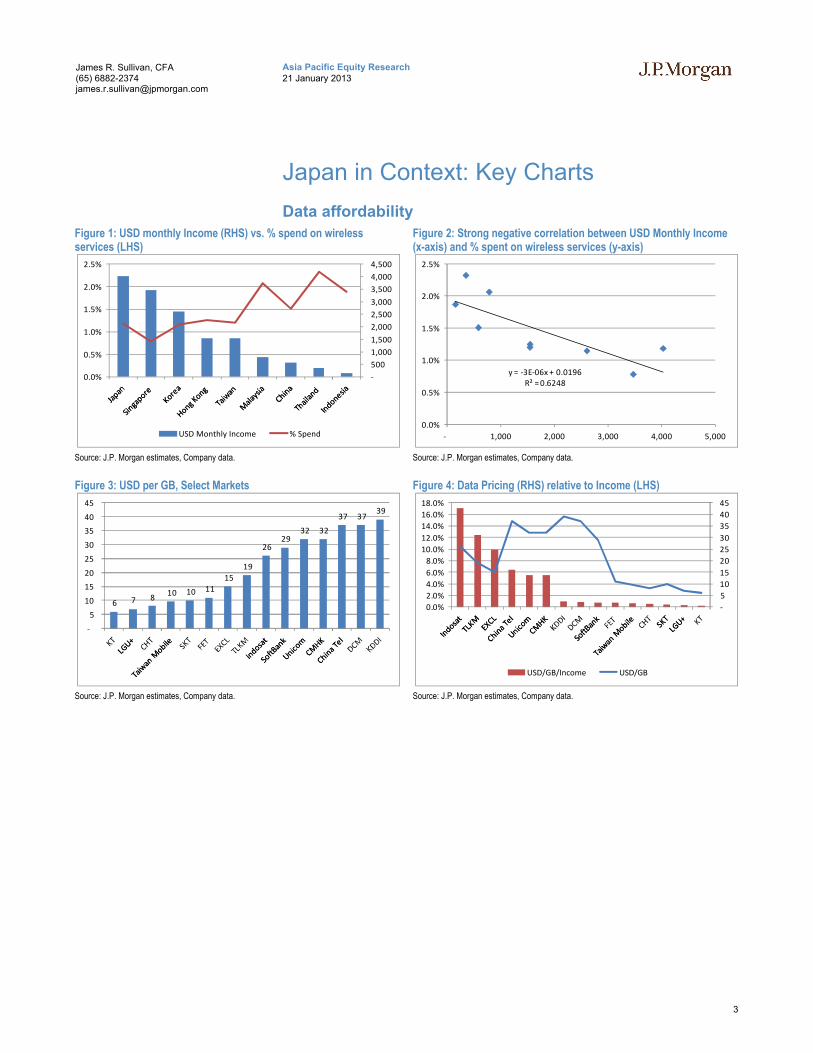
Japan, The Premier Asian Data Market. Japan presents very good elasticity (1.7x for DCM and SB, higher for KDDI), still high data prices (above USD30/GB, the highest in Asia, so still room for pricing cuts), and one of the best affordability outlooks (measured as ARPU / monthly income). Network utilization levels for KDDI and Softbank remain low, indicating the potential for significant revenue upside at minimum incremental expense. We see Softbank as the best investment into this theme, given their relatively low utilization rates (12% on 4G vs. DCM at 32% and KDDI at 5%), the lowest data unit pricing in Japan (USD29/GB vs. DCM at USD37/GB and KDDI at USD39/GB) and positive elasticity (1.7x, in line with DCM).
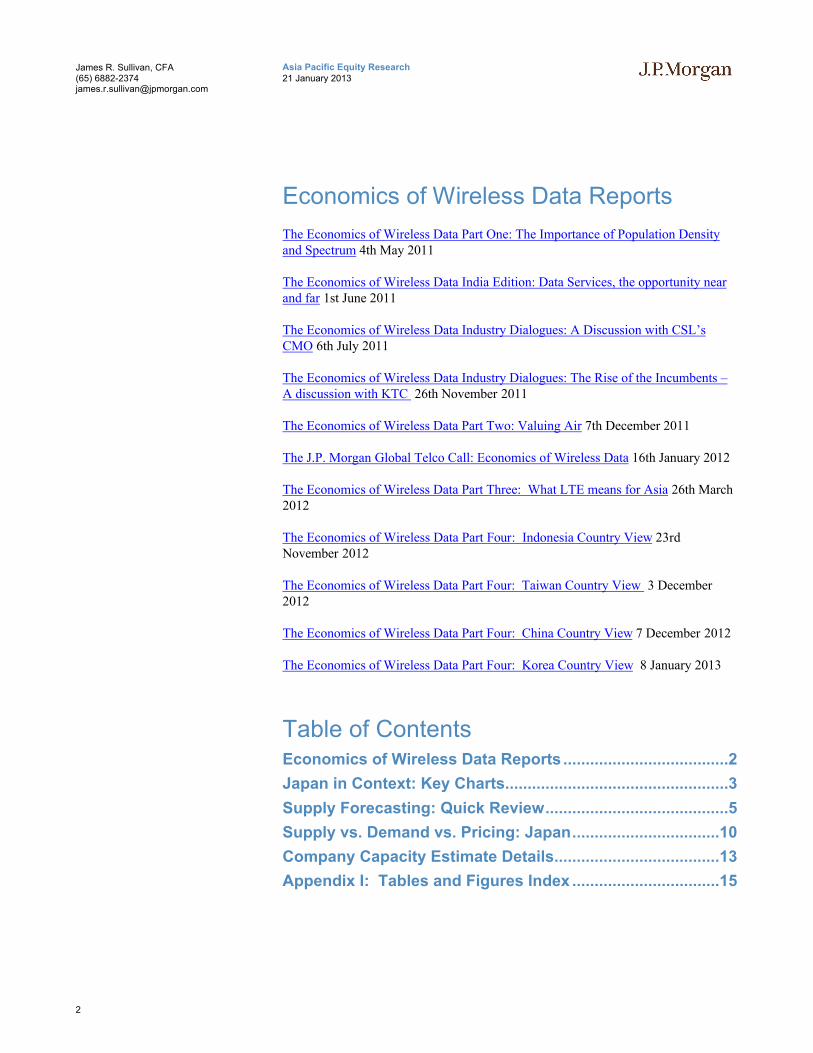
DM vs. EM? Japan’s positive data price elasticity of 1.7x compares well with Taiwan at 1.2x, vs. Emerging Asia at significantly below 1x. Korea appears to be an outlier with sub 1x elasticity, as Japan buttresses the DM vs. EM case. Emerging Market customers, who spend 2-3x more of their income (% basis) on wireless services already, lack the ability to spend an absolutely higher amount. We continue to suggest an investment strategy focused on Developed Market Integrated carriers over Emerging Market Wireless only carriers (please see our recent Telco/Internet strategy presentation slides here).
How much time will people spend using data? Aggressive network investments paired with still expensive data pricing and good elasticity make us bullish on monetizable data take up in Japan. The key limitation here will not be affordability nor network capacity, in our view, but the amount of time consumers will spend online. Voice usage levels maxed at 8.3 hours per month in almost every market in the world, which implies around 3.5GB/month (assuming 400MB per hour of streaming video and 200Meg for 1K MOU).
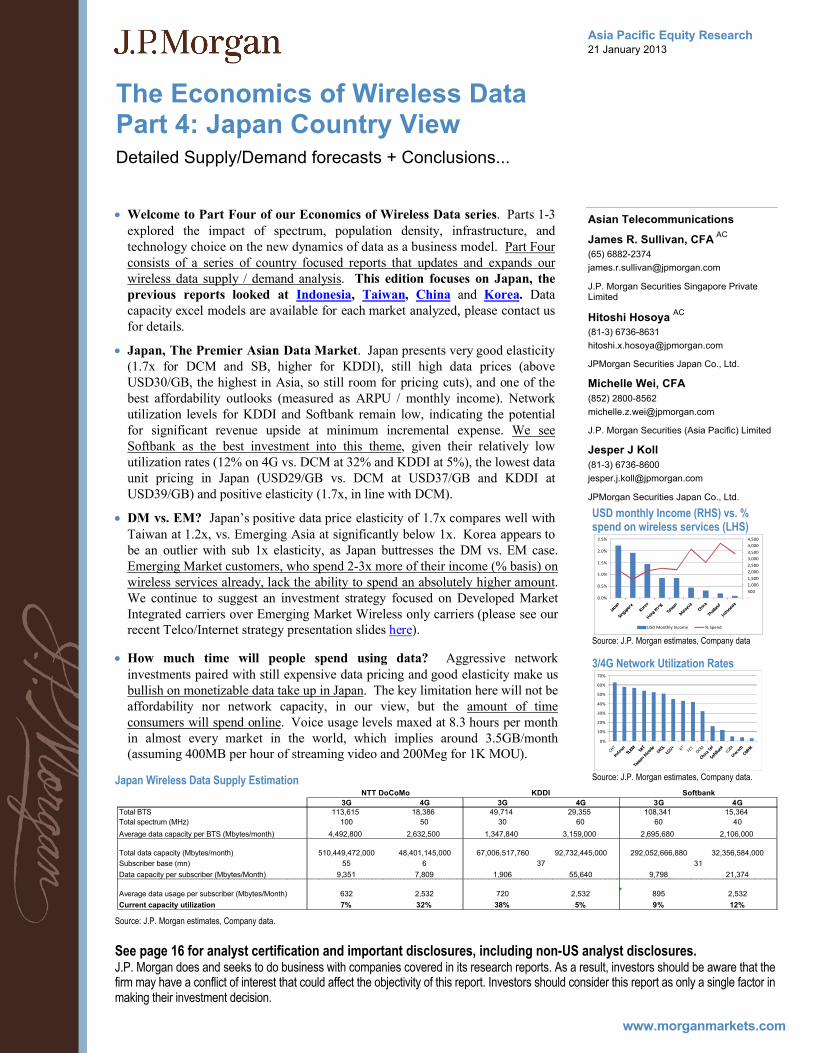
Japan Wireless Data Supply Estimation
Source: J.P. Morgan estimates, Company data.
3G 4G 3G 4G 3G 4GTotal BTS 113,615 18,386 49,714 29,355 108,341 15,364
Total spectrum (MHz) 100 50 30 60 60 40
Average data capacity per BTS (Mbytes/month) 4,492,800 2,632,500 1,347,840 3,159,000 2,695,680 2,106,000
Total data capacity (Mbytes/month) 510,449,472,000 48,401,145,000 67,006,517,760 92,732,445,000 292,052,666,880 32,356,584,000
Subscriber base (mn) 55 6
Data capacity per subscriber (Mbytes/Month) 9,351 7,809 1,906 55,640 9,798 21,374
Average data usage per subscriber (Mbytes/Month) 632 2,532 720 2,532 895 2,532
Current capacity utilization 7% 32% 38% 5% 9% 12%
KDDI Softbank
37 31
NTT DoCoMo
USD monthly Income (RHS) vs. % spend on wireless services (LHS)
Source: J.P. Morgan estimates, Company data
3/4G Network Utilization Rates
Source: J.P. Morgan estimates, Company data.
-
500
1,000
1,500
2,000
2,500
3,000
3,500
4,000
4,500
0.0%
0.5%
1.0%
1.5%
2.0%
2.5%
USD Monthly Income % Spend
0%
10%
20%
30%
40%
50%
60%
70%
2
Asia Pacific Equity Research21 January 2013
James R. Sullivan, CFA(65) [email protected]
Economics of Wireless Data Reports
The Economics of Wireless Data Part One: The Importance of Population Density and Spectrum 4th May 2011
The Economics of Wireless Data India Edition: Data Services, the opportunity near and far 1st June 2011
The Economics of Wireless Data Industry Dialogues: A Discussion with CSL’s CMO 6th July 2011
The Economics of Wireless Data Industry Dialogues: The Rise of the Incumbents –A discussion with KTC 26th November 2011
The Economics of Wireless Data Part Two: Valuing Air 7th December 2011
The J.P. Morgan Global Telco Call: Economics of Wireless Data 16th January 2012
The Economics of Wireless Data Part Three: What LTE means for Asia 26th March 2012
The Economics of Wireless Data Part Four: Indonesia Country View 23rdNovember 2012
The Economics of Wireless Data Part Four: Taiwan Country View 3 December 2012
The Economics of Wireless Data Part Four: China Country View 7 December 2012
The Economics of Wireless Data Part Four: Korea Country View 8 January 2013
Table of ContentsEconomics of Wireless Data Reports .....................................2
Japan in Context: Key Charts..................................................3
Supply Forecasting: Quick Review.........................................5
Supply vs. Demand vs. Pricing: Japan.................................10
Company Capacity Estimate Details.....................................13
Appendix I: Tables and Figures Index .................................15
3
Asia Pacific Equity Research21 January 2013
James R. Sullivan, CFA(65) [email protected]
Japan in Context: Key Charts
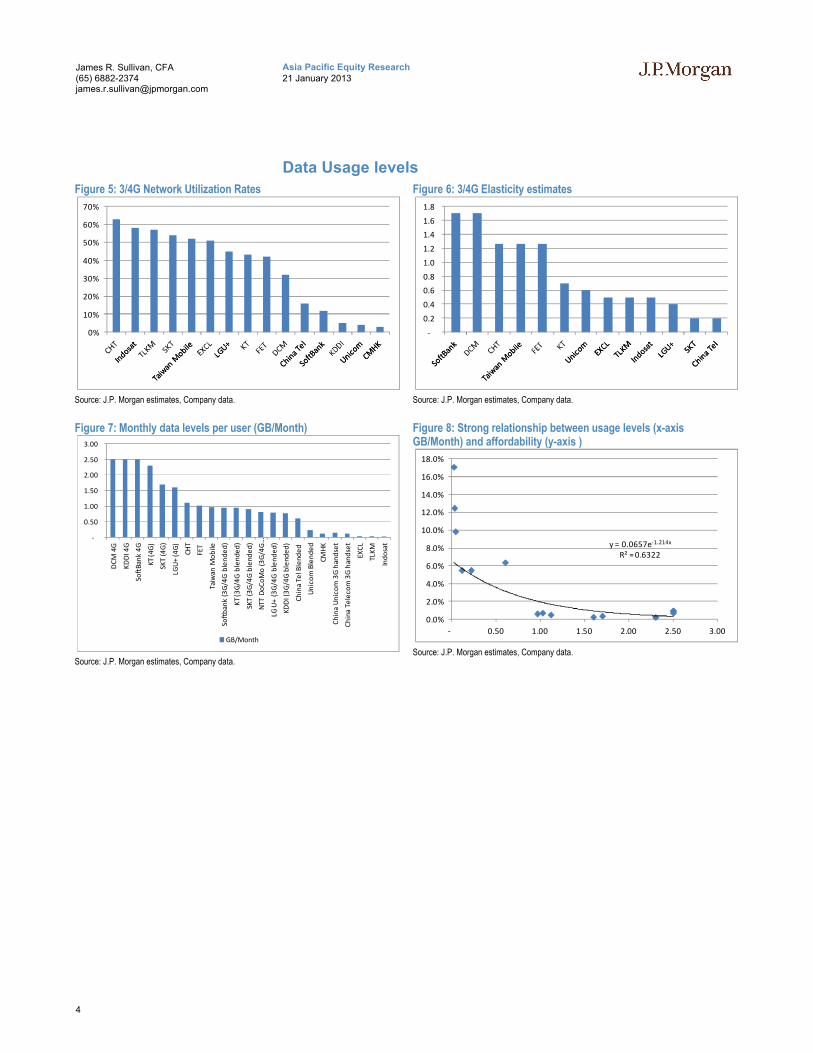
Data affordability
Figure 1: USD monthly Income (RHS) vs. % spend on wireless services (LHS)
Source: J.P. Morgan estimates, Company data.
Figure 2: Strong negative correlation between USD Monthly Income (x-axis) and % spent on wireless services (y-axis)
Source: J.P. Morgan estimates, Company data.
Figure 3: USD per GB, Select Markets
Source: J.P. Morgan estimates, Company data.
Figure 4: Data Pricing (RHS) relative to Income (LHS)
Source: J.P. Morgan estimates, Company data.
-
500
1,000
1,500
2,000
2,500
3,000
3,500
4,000
4,500
0.0%
0.5%
1.0%
1.5%
2.0%
2.5%
USD Monthly Income % Spend
y = -3E-06x + 0.0196R² = 0.6248
0.0%
0.5%
1.0%
1.5%
2.0%
2.5%
- 1,000 2,000 3,000 4,000 5,000
6 7 8 10 10 11
15
19
26 29
32 32
37 37 39
-
5
10
15
20
25
30
35
40
45
-
5
10
15
20
25
30
35
40
45
0.0%
2.0%
4.0%
6.0%
8.0%
10.0%
12.0%
14.0%
16.0%
18.0%
USD/GB/Income USD/GB
4
Asia Pacific Equity Research21 January 2013
James R. Sullivan, CFA(65) [email protected]
Data Usage levels
Figure 5: 3/4G Network Utilization Rates
Source: J.P. Morgan estimates, Company data.
Figure 6: 3/4G Elasticity estimates
Source: J.P. Morgan estimates, Company data.
Figure 7: Monthly data levels per user (GB/Month)
Source: J.P. Morgan estimates, Company data.
Figure 8: Strong relationship between usage levels (x-axis GB/Month) and affordability (y-axis )
Source: J.P. Morgan estimates, Company data.
0%
10%
20%
30%
40%
50%
60%
70%
-
0.2
0.4
0.6
0.8
1.0
1.2
1.4
1.6
1.8
-
0.50
1.00
1.50
2.00
2.50
3.00
DC
M 4
G
KD
DI 4
G
Soft
Ban
k 4
G
KT (4
G)
SKT
(4G
)
LGU
+ (4
G)
CHT
FET
Taiw
an M
ob
ile
Soft
ban
k (3
G/4
G b
len
de
d)
KT
(3G
/4G
ble
nde
d)
SKT
(3G
/4G
ble
nde
d)
NTT
Do
Co
Mo
(3
G/4
G …
LG U
+ (
3G
/4G
ble
nd
ed
)
KDD
I (3
G/4
G b
lend
ed
)
Chin
a Te
l Ble
nde
d
Un
ico
m B
len
de
d
CMH
K
Ch
ina
Un
ico
m 3
G h
and
set
Ch
ina
Tele
com
3G
han
dse
t
EXC
L
TLK
M
Ind
osa
t
GB/Month
y = 0.0657e-1.214x
R² = 0.6322
0.0%
2.0%
4.0%
6.0%
8.0%
10.0%
12.0%
14.0%
16.0%
18.0%
- 0.50 1.00 1.50 2.00 2.50 3.00
5
Asia Pacific Equity Research21 January 2013
James R. Sullivan, CFA(65) [email protected]
Supply Forecasting: Quick Review
Our Global Telecom research team has been doing work on data capacity estimation for several years, beginning in 2008 (The Power of Mobile Broadband, 2nd May 2008) and extending through our Economics of Wireless Data and J.P. Morgan Global Telco Call pieces of the past two years (please see links to relevant reports on Page 2 of this report).
The major conclusion of much of this work is that, finally, we Telco analysts can become "real" industry analysts for the first time. By that, we mean that we can run "normal" supply and demand analysis in order to take a view on the direction of pricing trends. This was next to impossible in a voice environment, given the scale-ability and fixed cost nature of voice networks. There is an explicit quality vs. quantity trade off available when running voice networks that makes capacity estimation something of a wild good chase. Data networks, as we've been saying for years now, work differently. Their lack of scale-ability (please see our The Economics of Wireless Data Part One: The Importance of Population Density and Spectrum for a detailed discussion of scale and data networks) implies a more variable cost nature, but also implies that for the first time in a very long time, we can estimate data capacity on a point estimate basis.
Data Estimation Equations
Data capacity estimation is actually a quite simple function…well, it can be. We initially began with a far more complex equation that included topography, population density, building density and the like, but found that for a rough estimate of overall network capacity, we did not learn much from these incremental data points. In the interests of simplicity (and the legacy of Ockham's razor: “among competing hypotheses, the one that makes the fewest assumptions should be selected”, or if you want to go way back, Numquam ponenda est pluralitas sine necessitate), we arrived at the following equation:
Figure 9: Wireless Data Capacity Supply Equation
Capacity = Constant x (Sectors x Carriers x Cell Rate x
Utilization) / Busy Hour
Source: J.P. Morgan.
Constant: simple numerical conversion factors to adjust Mbits to Mbytes and to adjust the per second calculation to a per month value.
Sectors: describes the number of sectors per base station. Sectors describe splitting a single base station into multiple directional base station sectors to reuse capacity. We take Sectors = 3 for all cases as this is the standard configuration for basestations. In a limited number of cases, further sectorisation might be undertaken, but we assume this will not be the usual case.
Carriers: describes the number of deployed 5Mhz carriers at each location. We assume the full 5Mhz is always available, however guard band requirements may reduce the incremental capacity available for the 2nd or 3rd carrier.
6
Asia Pacific Equity Research21 January 2013
James R. Sullivan, CFA(65) [email protected]
Cell Rate: describes whether the base station implements basic UMTS, HSPA, upgraded additional channels or an upgraded HSPA network in 700/900Mhz frequency range where indoor propagation characteristics are improved. CellRate should not be confused with peak data rate per user – instead it reflects the peak data rate the cell is capable of sustaining to all users in its coverage area.
Utilization: captures the maximum network utilization achieved in the busiest hour of the day. The network never operates at maximum capacity, despite some base stations operating near to 100% capacity, because traffic is unevenly distributed in time and place and individual base station upgrades add large incremental capacity. We expect base station capacity upgrades to occur when peak utilization surpasses 85%. We model utilization on a regional basis as per Table 1 which results in a network wide Utilization = 65%.
Table 1: Regional Distribution of network utilization
% sites 25% 30% 30% 15%Cell utilisation 85% 70% 55% 40%System utilisation 65%
Source: J.P. Morgan estimates, Company data.
Busy Hour Share: is a key sensitivity in the model, describing the percentage of daily traffic that occurs in the busiest hour of the day. We use operator data and set BusyHourShare = 15%. Note that BusyHourShare is lower than seen in mobile voice cases due to operator guidance that data usage is less ‘peaky’ than voice usage.
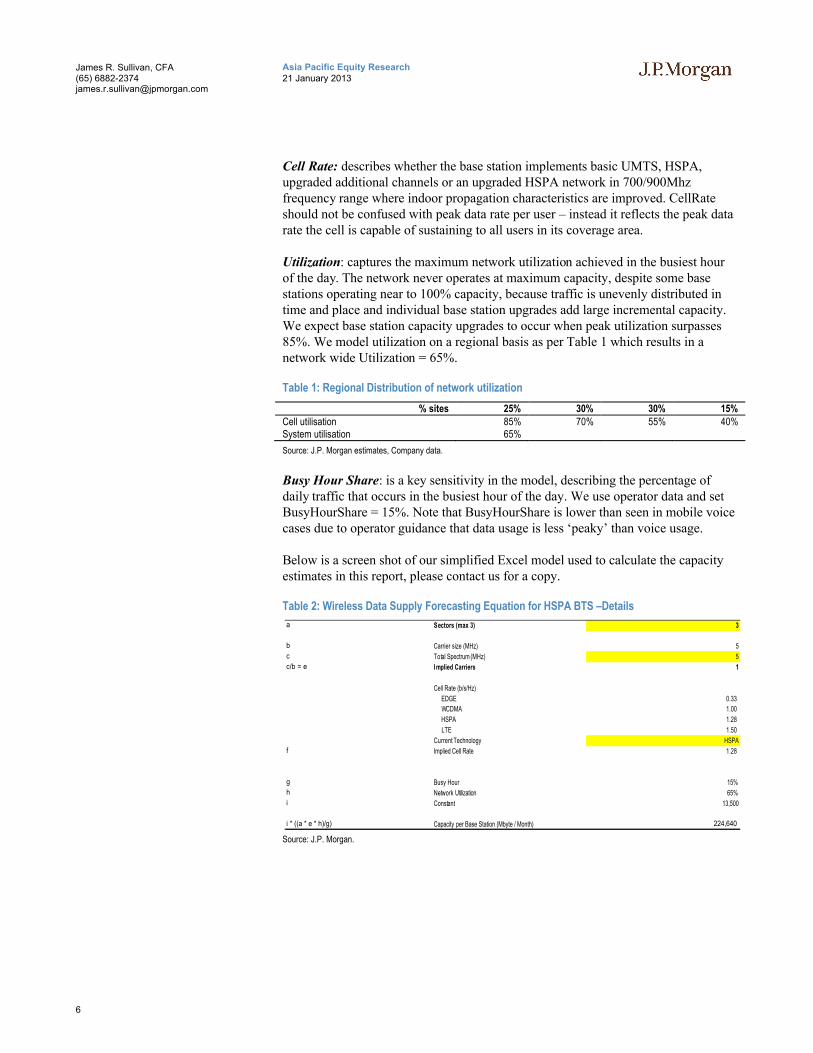
Below is a screen shot of our simplified Excel model used to calculate the capacity estimates in this report, please contact us for a copy.
Table 2: Wireless Data Supply Forecasting Equation for HSPA BTS –Details
Source: J.P. Morgan.
a Sectors (max 3) 3
b Carrier size (MHz) 5
c Total Spectrum (MHz) 5
c/b = e I mplied Carriers 1
Cell Rate (b/s/Hz)
EDGE 0.33
WCDMA 1.00
HSPA 1.28
LTE 1.50
Current Technology HSPA
f Implied Cell Rate 1.28
g Busy Hour 15%
h Network Utilization 65%
i Constant 13,500
i * ((a * e * h)/g) Capacity per Base Station (Mbyte / Month) 224,640
7
Asia Pacific Equity Research21 January 2013
James R. Sullivan, CFA(65) [email protected]
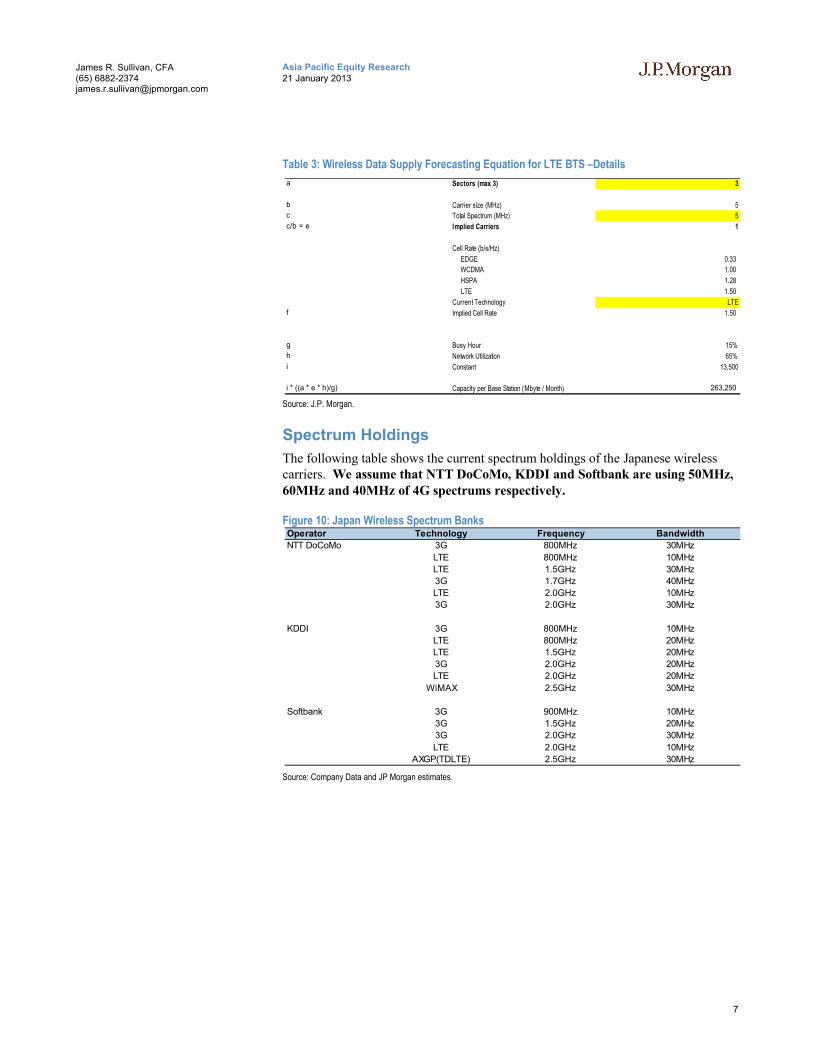
Table 3: Wireless Data Supply Forecasting Equation for LTE BTS –Details
Source: J.P. Morgan.
Spectrum Holdings
The following table shows the current spectrum holdings of the Japanese wireless carriers. We assume that NTT DoCoMo, KDDI and Softbank are using 50MHz, 60MHz and 40MHz of 4G spectrums respectively.
Figure 10: Japan Wireless Spectrum Banks
Source: Company Data and JP Morgan estimates.
a Sectors (max 3) 3
b Carrier size (MHz) 5
c Total Spectrum (MHz) 5
c/b = e Implied Carriers 1
Cell Rate (b/s/Hz)
EDGE 0.33
WCDMA 1.00
HSPA 1.28
LTE 1.50
Current Technology LTE
f Implied Cell Rate 1.50
g Busy Hour 15%
h Network Utilization 65%
i Constant 13,500
i * ((a * e * h)/g) Capacity per Base Station (Mbyte / Month) 263,250
Operator Technology Frequency Bandwidth
NTT DoCoMo 3G 800MHz 30MHz
LTE 800MHz 10MHz
LTE 1.5GHz 30MHz
3G 1.7GHz 40MHz
LTE 2.0GHz 10MHz
3G 2.0GHz 30MHz
KDDI 3G 800MHz 10MHz
LTE 800MHz 20MHz
LTE 1.5GHz 20MHz
3G 2.0GHz 20MHz
LTE 2.0GHz 20MHz
WiMAX 2.5GHz 30MHz
Softbank 3G 900MHz 10MHz
3G 1.5GHz 20MHz
3G 2.0GHz 30MHz
LTE 2.0GHz 10MHz
AXGP(TDLTE) 2.5GHz 30MHz
8
Asia Pacific Equity Research21 January 2013
James R. Sullivan, CFA(65) [email protected]
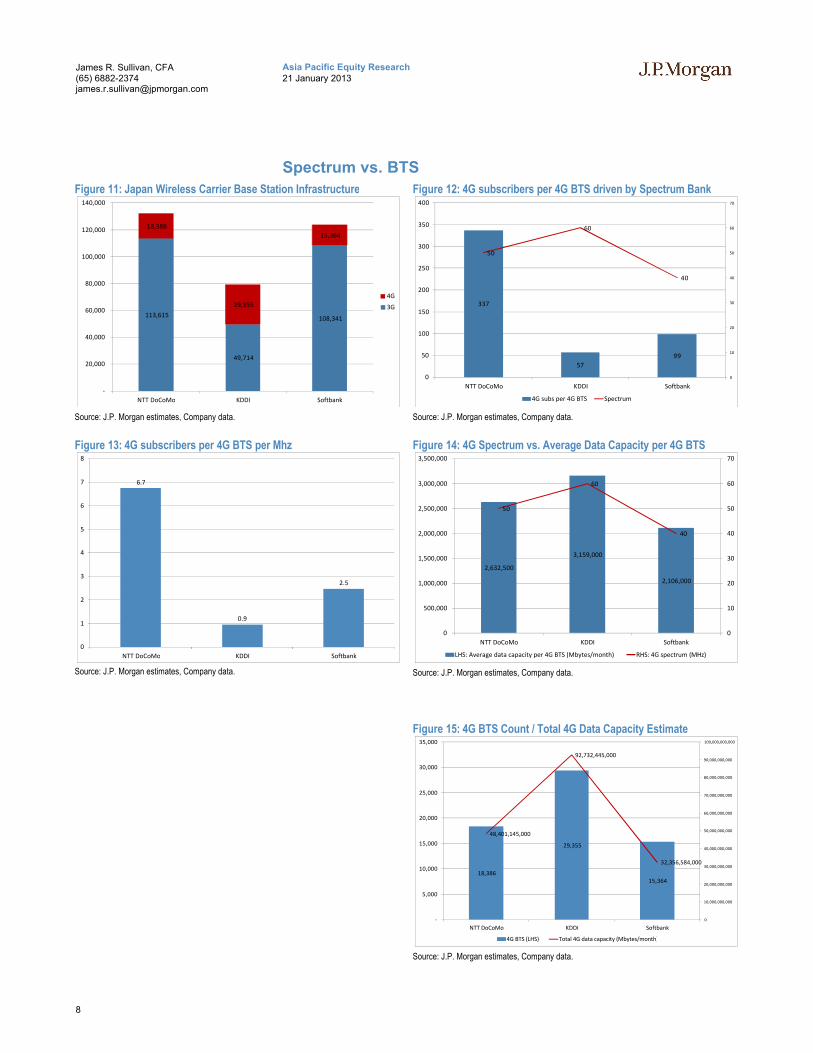
Spectrum vs. BTS
Figure 11: Japan Wireless Carrier Base Station Infrastructure
Source: J.P. Morgan estimates, Company data.
Figure 12: 4G subscribers per 4G BTS driven by Spectrum Bank
Source: J.P. Morgan estimates, Company data.
Figure 13: 4G subscribers per 4G BTS per Mhz
Source: J.P. Morgan estimates, Company data.
Figure 14: 4G Spectrum vs. Average Data Capacity per 4G BTS
Source: J.P. Morgan estimates, Company data.
Figure 15: 4G BTS Count / Total 4G Data Capacity Estimate
Source: J.P. Morgan estimates, Company data.
113,615
49,714
108,341
18,386
29,355
15,364
-
20,000
40,000
60,000
80,000
100,000
120,000
140,000
NTT DoCoMo KDDI Softbank
4G
3G 337
57
99
50
60
40
0
10
20
30
40
50
60
70
0
50
100
150
200
250
300
350
400
NTT DoCoMo KDDI Softbank
4G subs per 4G BTS Spectrum
6.7
0.9
2.5
0
1
2
3
4
5
6
7
8
NTT DoCoMo KDDI Softbank
2,632,500
3,159,000
2,106,000
50
60
40
0
10
20
30
40
50
60
70
0
500,000
1,000,000
1,500,000
2,000,000
2,500,000
3,000,000
3,500,000
NTT DoCoMo KDDI Softbank
LHS: Average data capacity per 4G BTS (Mbytes/month) RHS: 4G spectrum (MHz)
18,386
29,355
15,364
48,401,145,000
92,732,445,000
32,356,584,000
0
10,000,000,000
20,000,000,000
30,000,000,000
40,000,000,000
50,000,000,000
60,000,000,000
70,000,000,000
80,000,000,000
90,000,000,000
100,000,000,000
-
5,000
10,000
15,000
20,000
25,000
30,000
35,000
NTT DoCoMo KDDI Softbank
4G BTS (LHS) Total 4G data capacity (Mbytes/month)
9
Asia Pacific Equity Research21 January 2013
James R. Sullivan, CFA(65) [email protected]
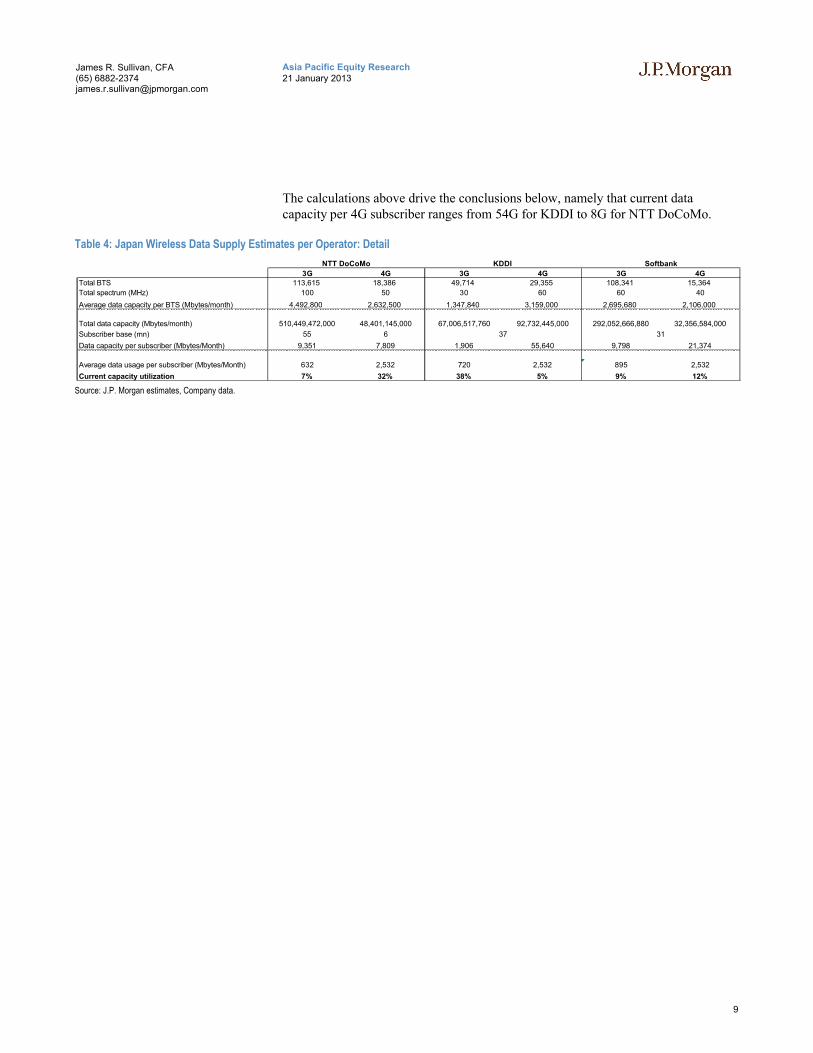
The calculations above drive the conclusions below, namely that current data capacity per 4G subscriber ranges from 54G for KDDI to 8G for NTT DoCoMo.
Table 4: Japan Wireless Data Supply Estimates per Operator: Detail
Source: J.P. Morgan estimates, Company data.
3G 4G 3G 4G 3G 4GTotal BTS 113,615 18,386 49,714 29,355 108,341 15,364
Total spectrum (MHz) 100 50 30 60 60 40
Average data capacity per BTS (Mbytes/month) 4,492,800 2,632,500 1,347,840 3,159,000 2,695,680 2,106,000
Total data capacity (Mbytes/month) 510,449,472,000 48,401,145,000 67,006,517,760 92,732,445,000 292,052,666,880 32,356,584,000
Subscriber base (mn) 55 6
Data capacity per subscriber (Mbytes/Month) 9,351 7,809 1,906 55,640 9,798 21,374
Average data usage per subscriber (Mbytes/Month) 632 2,532 720 2,532 895 2,532
Current capacity utilization 7% 32% 38% 5% 9% 12%
KDDI Softbank
37 31
NTT DoCoMo
10
Asia Pacific Equity Research21 January 2013
James R. Sullivan, CFA(65) [email protected]
Supply vs. Demand vs. Pricing: Japan
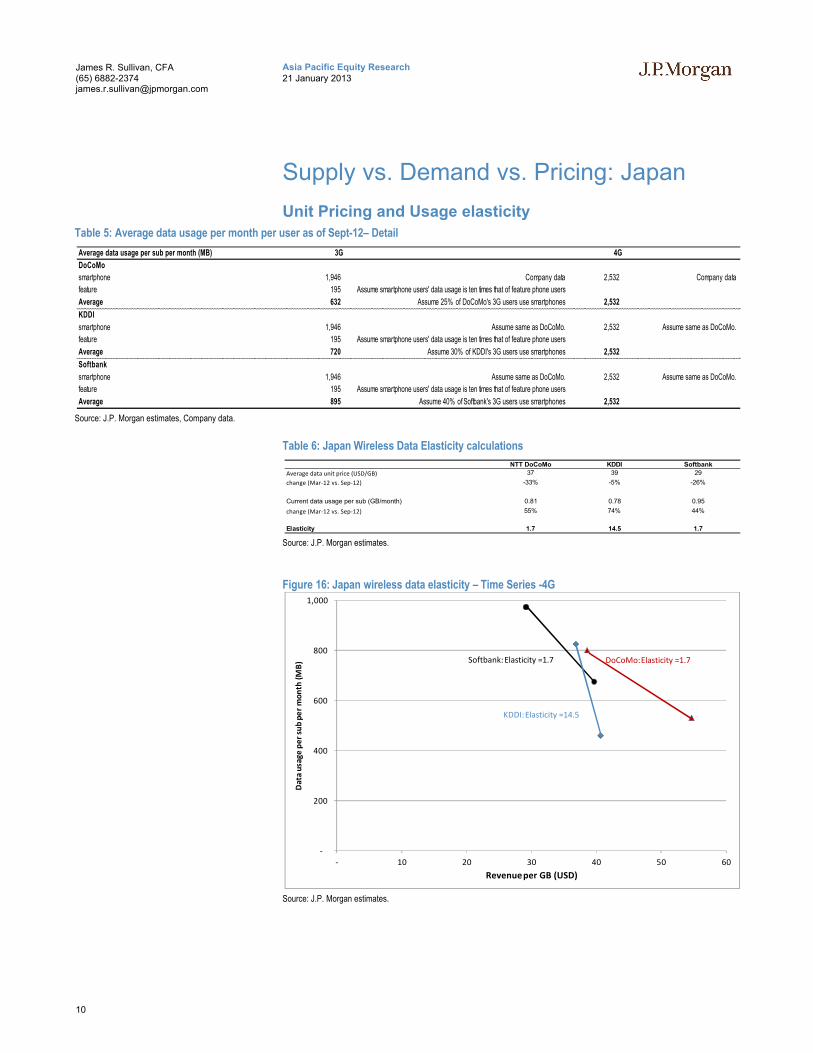
Unit Pricing and Usage elasticity
Table 5: Average data usage per month per user as of Sept-12– Detail
Source: J.P. Morgan estimates, Company data.
Table 6: Japan Wireless Data Elasticity calculations
Source: J.P. Morgan estimates.
Figure 16: Japan wireless data elasticity – Time Series -4G
Source: J.P. Morgan estimates.
Average data usage per sub per month (MB) 3G 4G
DoCoMo
smartphone 1,946 Company data 2,532 Company data
feature 195 Assume smartphone users' data usage is ten times that of feature phone users
Average 632 Assume 25% of DoCoMo's 3G users use smartphones 2,532
KDDI
smartphone 1,946 Assume same as DoCoMo. 2,532 Assume same as DoCoMo.
feature 195 Assume smartphone users' data usage is ten times that of feature phone users
Average 720 Assume 30% of KDDI's 3G users use smartphones 2,532
Softbank
smartphone 1,946 Assume same as DoCoMo. 2,532 Assume same as DoCoMo.
feature 195 Assume smartphone users' data usage is ten times that of feature phone users
Average 895 Assume 40% of Softbank's 3G users use smartphones 2,532
NTT DoCoMo KDDI Softbank
Average data unit price (USD/GB) 37 39 29
change (Mar-12 vs. Sep-12) -33% -5% -26%
Current data usage per sub (GB/month) 0.81 0.78 0.95
change (Mar-12 vs. Sep-12) 55% 74% 44%
Elasticity 1.7 14.5 1.7
-
200
400
600
800
1,000
- 10 20 30 40 50 60
Dat
a u
sage
pe
r su
b p
er
mo
nth
(M
B)
Revenue per GB (USD)
Softbank:Elasticity =1.7
KDDI:Elasticity =14.5
DoCoMo:Elasticity =1.7
11
Asia Pacific Equity Research21 January 2013
James R. Sullivan, CFA(65) [email protected]
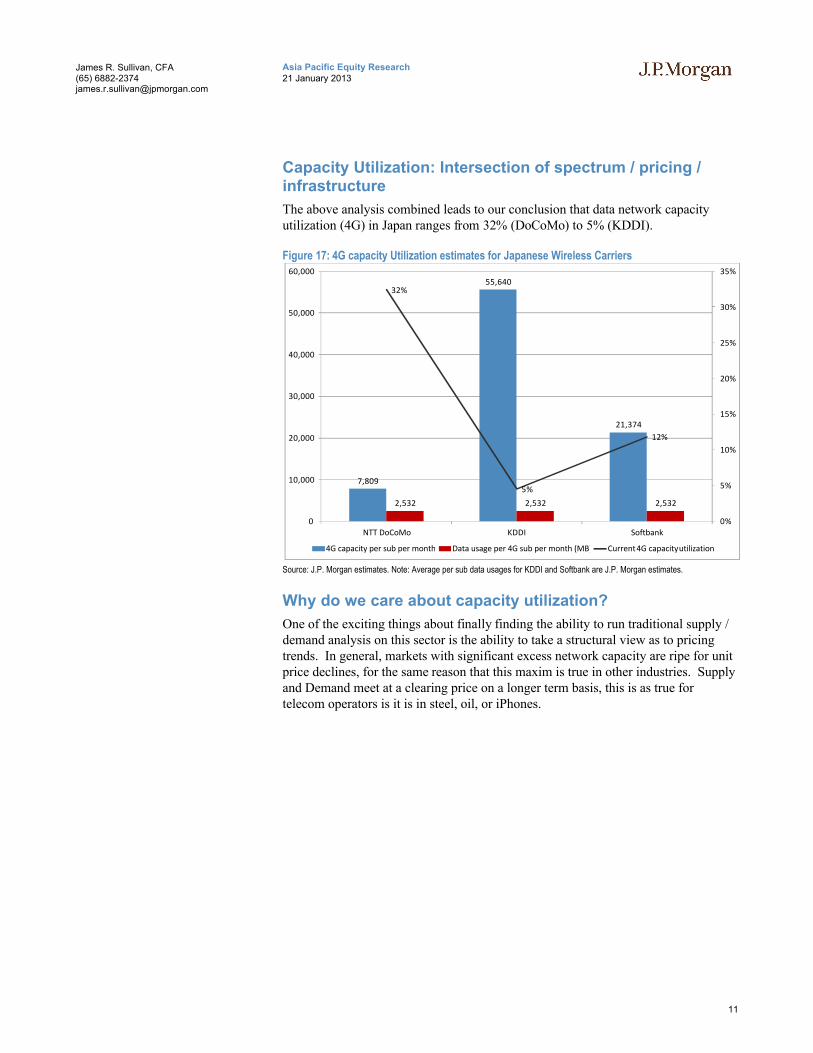
Capacity Utilization: Intersection of spectrum / pricing / infrastructure
The above analysis combined leads to our conclusion that data network capacity utilization (4G) in Japan ranges from 32% (DoCoMo) to 5% (KDDI).
Figure 17: 4G capacity Utilization estimates for Japanese Wireless Carriers
Source: J.P. Morgan estimates. Note: Average per sub data usages for KDDI and Softbank are J.P. Morgan estimates.
Why do we care about capacity utilization?
One of the exciting things about finally finding the ability to run traditional supply / demand analysis on this sector is the ability to take a structural view as to pricing trends. In general, markets with significant excess network capacity are ripe for unit price declines, for the same reason that this maxim is true in other industries. Supply and Demand meet at a clearing price on a longer term basis, this is as true for telecom operators is it is in steel, oil, or iPhones.
7,809
55,640
21,374
2,532 2,532 2,532
32%
5%
12%
0%
5%
10%
15%
20%
25%
30%
35%
0
10,000
20,000
30,000
40,000
50,000
60,000
NTT DoCoMo KDDI Softbank
4G capacity per sub per month Data usage per 4G sub per month (MB) Current 4G capacity utilization
12
Asia Pacific Equity Research21 January 2013
James R. Sullivan, CFA(65) [email protected]
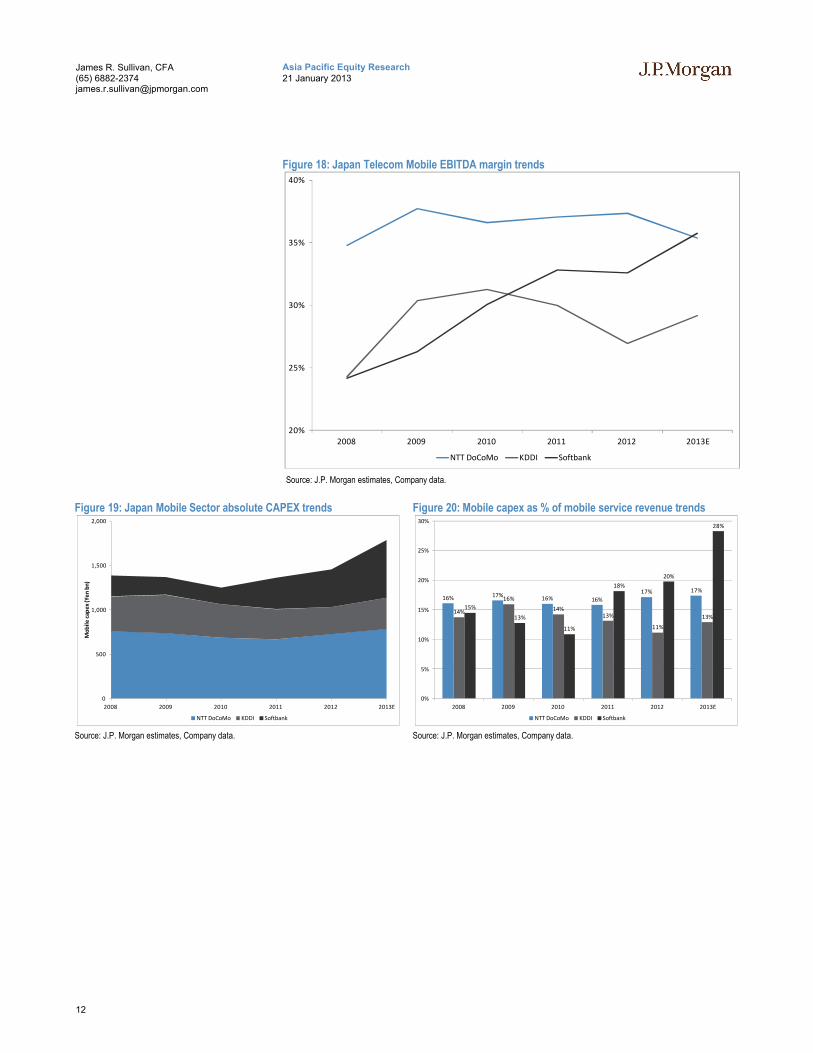
Figure 18: Japan Telecom Mobile EBITDA margin trends
Source: J.P. Morgan estimates, Company data.
Figure 19: Japan Mobile Sector absolute CAPEX trends
Source: J.P. Morgan estimates, Company data.
Figure 20: Mobile capex as % of mobile service revenue trends
Source: J.P. Morgan estimates, Company data.
20%
25%
30%
35%
40%
2008 2009 2010 2011 2012 2013E
NTT DoCoMo KDDI Softbank
0
500
1,000
1,500
2,000
2008 2009 2010 2011 2012 2013E
Mo
bil
e c
ape
x (Y
en
bn
)
NTT DoCoMo KDDI Softbank
16% 17%16% 16%
17% 17%
14%
16%
14%13%
11%
13%
15%
13%
11%
18%
20%
28%
0%
5%
10%
15%
20%
25%
30%
2008 2009 2010 2011 2012 2013E
NTT DoCoMo KDDI Softbank
13
Asia Pacific Equity Research21 January 2013
James R. Sullivan, CFA(65) [email protected]
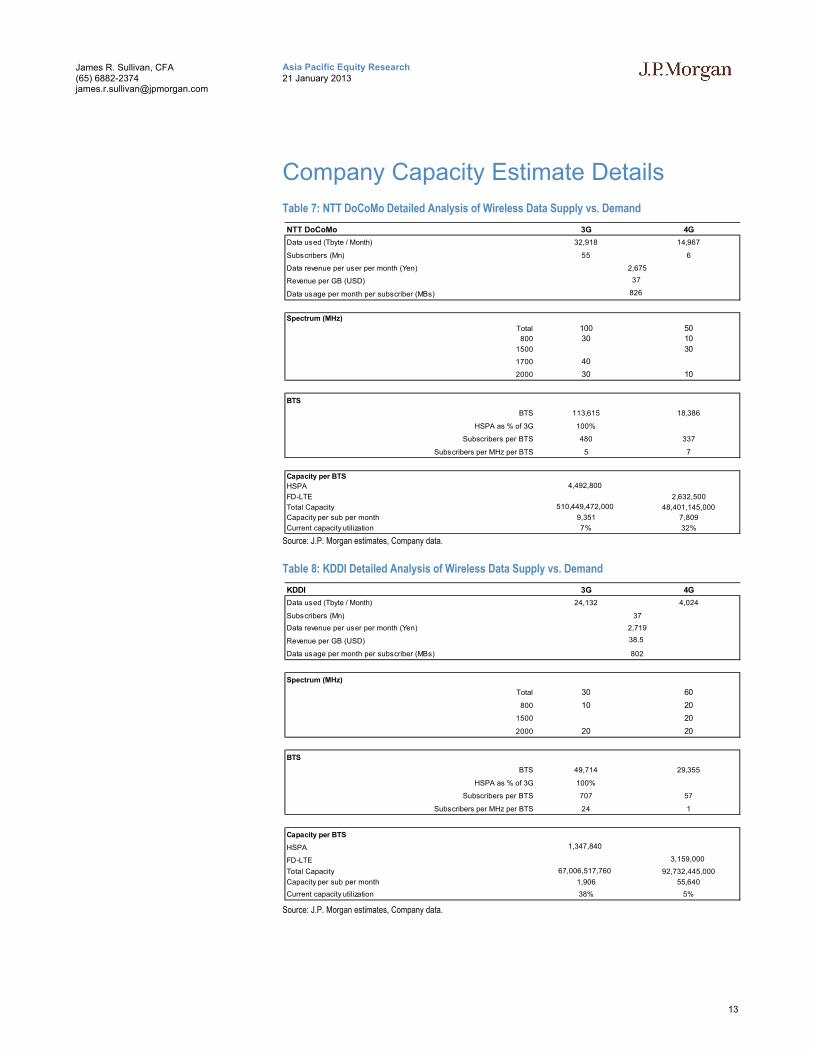
Company Capacity Estimate Details
Table 7: NTT DoCoMo Detailed Analysis of Wireless Data Supply vs. Demand
Source: J.P. Morgan estimates, Company data.
Table 8: KDDI Detailed Analysis of Wireless Data Supply vs. Demand
Source: J.P. Morgan estimates, Company data.
NTT DoCoMo 3G 4G
Data used (Tbyte / Month) 32,918 14,967
Subscribers (Mn) 55 6
Data revenue per user per month (Yen)
Revenue per GB (USD)
Data usage per month per subscriber (MBs)
Spectrum (MHz)
Total 100 50
800 30 10
1500 30
1700 40
2000 30 10
BTS
BTS 113,615 18,386
HSPA as % of 3G 100%
Subscribers per BTS 480 337
Subscribers per MHz per BTS 5 7
Capacity per BTS
HSPA 4,492,800
FD-LTE 2,632,500
Total Capacity 510,449,472,000 48,401,145,000
Capacity per sub per month 9,351 7,809
Current capacity utilization 7% 32%
2,675
37
826
KDDI 3G 4G
Data used (Tbyte / Month) 24,132 4,024
Subscribers (Mn)
Data revenue per user per month (Yen)
Revenue per GB (USD)
Data usage per month per subscriber (MBs)
Spectrum (MHz)
Total 30 60
800 10 20
1500 20
2000 20 20
BTS
BTS 49,714 29,355
HSPA as % of 3G 100%
Subscribers per BTS 707 57
Subscribers per MHz per BTS 24 1
Capacity per BTS
HSPA 1,347,840
FD-LTE 3,159,000
Total Capacity 67,006,517,760 92,732,445,000
Capacity per sub per month 1,906 55,640
Current capacity utilization 38% 5%
37
802
2,719
38.5
14
Asia Pacific Equity Research21 January 2013
James R. Sullivan, CFA(65) [email protected]
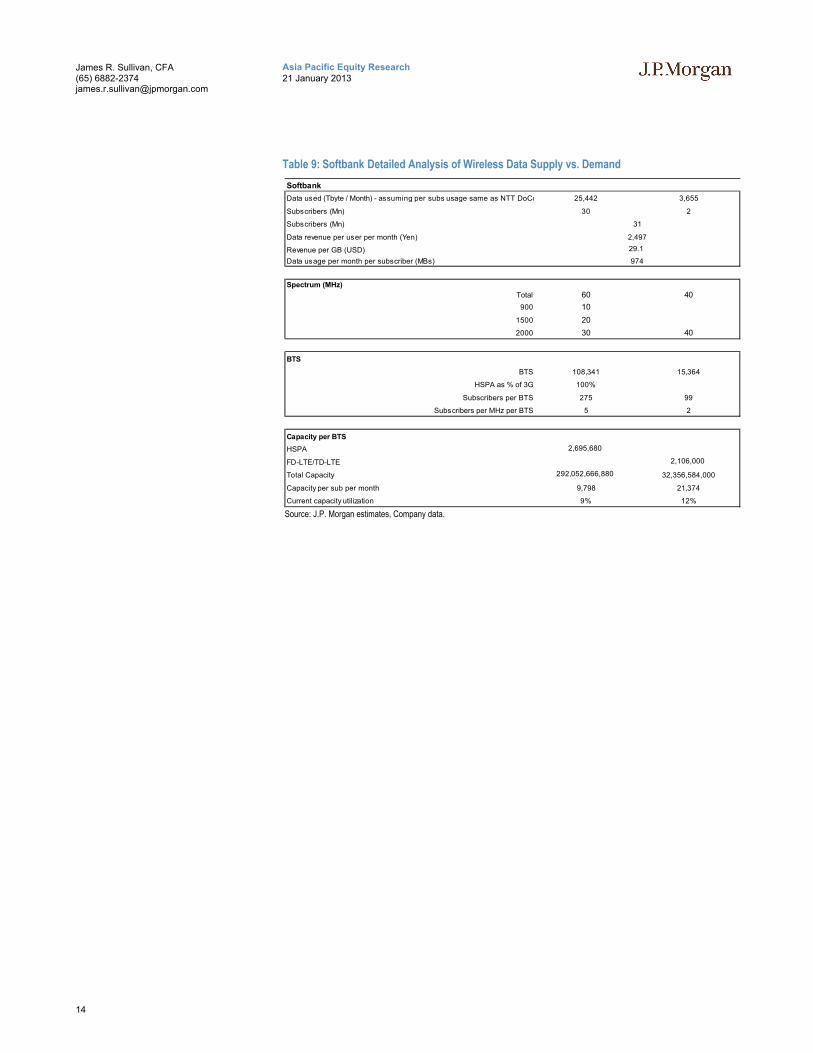
Table 9: Softbank Detailed Analysis of Wireless Data Supply vs. Demand
Source: J.P. Morgan estimates, Company data.
Softbank
Data used (Tbyte / Month) - assuming per subs usage same as NTT DoCoMo 25,442 3,655
Subscribers (Mn) 30 2
Subscribers (Mn)
Data revenue per user per month (Yen)
Revenue per GB (USD)
Data usage per month per subscriber (MBs)
Spectrum (MHz)
Total 60 40
900 10
1500 20
2000 30 40
BTS
BTS 108,341 15,364
HSPA as % of 3G 100%
Subscribers per BTS 275 99
Subscribers per MHz per BTS 5 2
Capacity per BTS
HSPA 2,695,680
FD-LTE/TD-LTE 2,106,000
Total Capacity 292,052,666,880 32,356,584,000
Capacity per sub per month 9,798 21,374
Current capacity utilization 9% 12%
29.1
974
2,497
31

15
Asia Pacific Equity Research21 January 2013
James R. Sullivan, CFA(65) [email protected]
Appendix I: Tables and Figures Index
TablesTable 1: Regional Distribution of network utilization...............................................6
Table 2: Wireless Data Supply Forecasting Equation for HSPA BTS –Details..........6
Table 3: Wireless Data Supply Forecasting Equation for LTE BTS –Details.............7
Table 4: Japan Wireless Data Supply Estimates per Operator: Detail........................9
Table 5: Average data usage per month per user as of Sept-12– Detail ...................10
Table 6: Japan Wireless Data Elasticity calculations ..............................................10
Table 7: NTT DoCoMo Detailed Analysis of Wireless Data Supply vs. Demand....13
Table 8: KDDI Detailed Analysis of Wireless Data Supply vs. Demand.................13
Table 9: Softbank Detailed Analysis of Wireless Data Supply vs. Demand.............14
FiguresJapan Wireless Data Supply Estimation ...................................................................1
Figure 1: USD monthly Income (RHS) vs. % spend on wireless services (LHS) .......3
Figure 2: Strong negative correlation between USD Monthly Income (x-axis) and % spent on wireless services (y-axis) ...........................................................................3
Figure 3: USD per GB, Select Markets ....................................................................3
Figure 4: Data Pricing (RHS) relative to Income (LHS) ...........................................3
Figure 5: 3/4G Network Utilization Rates ................................................................4
Figure 6: 3/4G Elasticity estimates ..........................................................................4
Figure 7: Monthly data levels per user (GB/Month) .................................................4
Figure 8: Strong relationship between usage levels (x-axis GB/Month) and affordability (y-axis ) ..............................................................................................4
Figure 9: Wireless Data Capacity Supply Equation ..................................................5
Figure 10: Japan Wireless Spectrum Banks..............................................................7
Figure 11: Japan Wireless Carrier Base Station Infrastructure ..................................8
Figure 12: 4G subscribers per 4G BTS driven by Spectrum Bank.............................8
Figure 13: 4G subscribers per 4G BTS per Mhz.......................................................8
Source: J.P. Morgan estimates, Company data. ........................................................8
Figure 14: 4G Spectrum vs. Average Data Capacity per 4G BTS..............................8
Figure 15: 4G BTS Count / Total 4G Data Capacity Estimate...................................8
Figure 16: Japan wireless data elasticity – Time Series -4G....................................10
Figure 17: 4G capacity Utilization estimates for Japanese Wireless Carriers...........11
Figure 18: Japan Telecom Mobile EBITDA margin trends .....................................12
Figure 19: Japan Mobile Sector absolute CAPEX trends ........................................12
Figure 20: Mobile capex as % of mobile service revenue trends .............................12
16
Asia Pacific Equity Research21 January 2013
James R. Sullivan, CFA(65) [email protected]
Companies Recommended in This Report (all prices in this report as of market close on 21 January 2013)KDDI (9433) (9433.T/¥6,200/Not Rated), NTT DOCOMO (9437) (9437.T/¥132,100/Neutral), SOFTBANK (9984) (9984.T/¥2,968/Overweight)
Analyst Certification: The research analyst(s) denoted by an “AC” on the cover of this report certifies (or, where multiple research analysts are primarily responsible for this report, the research analyst denoted by an “AC” on the cover or within the document individually certifies, with respect to each security or issuer that the research analyst covers in this research) that: (1) all of the views expressed in this report accurately reflect his or her personal views about any and all of the subject securities or issuers; and (2) no part of any of the research analyst's compensation was, is, or will be directly or indirectly related to the specific recommendations or views expressed by the research analyst(s) in this report.
Important Disclosures
Lead or Co-manager: J.P. Morgan acted as lead or co-manager in a public offering of equity and/or debt securities for NTT DOCOMO (9437) within the past 12 months.
Beneficial Ownership (1% or more): J.P. Morgan beneficially owns 1% or more of a class of common equity securities of KDDI (9433), NTT DOCOMO (9437).
Client: J.P. Morgan currently has, or had within the past 12 months, the following company(ies) as clients: SOFTBANK (9984), KDDI (9433), NTT DOCOMO (9437).
Client/Investment Banking: J.P. Morgan currently has, or had within the past 12 months, the following company(ies) as investment banking clients: KDDI (9433), NTT DOCOMO (9437).
Client/Non-Investment Banking, Securities-Related: J.P. Morgan currently has, or had within the past 12 months, the following company(ies) as clients, and the services provided were non-investment-banking, securities-related: SOFTBANK (9984), KDDI (9433), NTT DOCOMO (9437).
Client/Non-Securities-Related: J.P. Morgan currently has, or had within the past 12 months, the following company(ies) as clients, and the services provided were non-securities-related: SOFTBANK (9984), KDDI (9433).
Investment Banking (past 12 months): J.P. Morgan received in the past 12 months compensation for investment banking KDDI (9433), NTT DOCOMO (9437).
Investment Banking (next 3 months): J.P. Morgan expects to receive, or intends to seek, compensation for investment banking services in the next three months from KDDI (9433), NTT DOCOMO (9437).
Non-Investment Banking Compensation: J.P. Morgan has received compensation in the past 12 months for products or services other than investment banking from SOFTBANK (9984), KDDI (9433), NTT DOCOMO (9437).
J.P. Morgan is acting as financial advisor to KDDI Corporation in connection with its tender offer for shares of Jupiter Telecommunications Co., Ltd. with a company jointly held with Sumitomo Corporation as announced on October 24, 2012. The transaction is subject to necessary approvals by the regulatory authorities. This research report and the information herein is not intended to provide voting advice, serve as an endorsement of the proposed transaction or result in procurement, withholding or revocation of a proxy or any other action by a security holder.
Company-Specific Disclosures: Important disclosures, including price charts, are available for compendium reports and all J.P. Morgan–covered companies by visiting https://mm.jpmorgan.com/disclosures/company, calling 1-800-477-0406, or e-mailing [email protected] with your request. J.P. Morgan’s Strategy, Technical, and Quantitative Research teams may screen companies not covered by J.P. Morgan. For important disclosures for these companies, please call 1-800-477-0406 or e-mail [email protected].
17
Asia Pacific Equity Research21 January 2013
James R. Sullivan, CFA(65) [email protected]
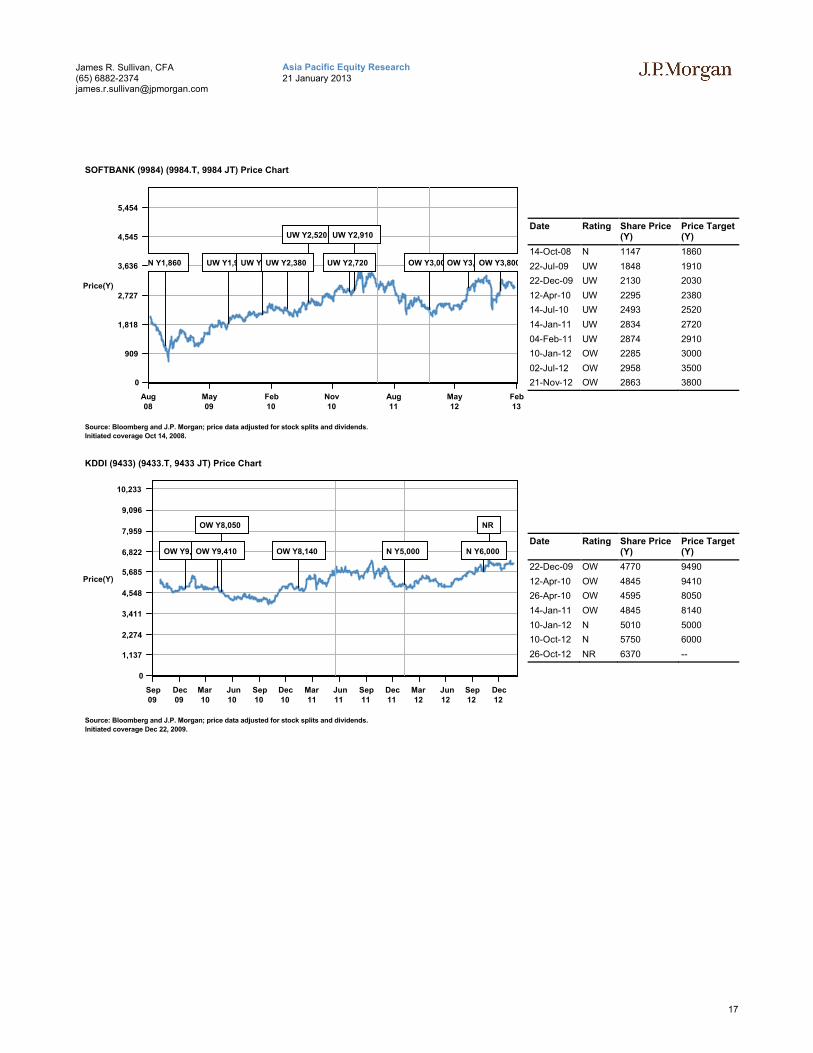
Date Rating Share Price (Y)
Price Target (Y)
14-Oct-08 N 1147 1860
22-Jul-09 UW 1848 1910
22-Dec-09 UW 2130 2030
12-Apr-10 UW 2295 2380
14-Jul-10 UW 2493 2520
14-Jan-11 UW 2834 2720
04-Feb-11 UW 2874 2910
10-Jan-12 OW 2285 3000
02-Jul-12 OW 2958 3500
21-Nov-12 OW 2863 3800
Date Rating Share Price (Y)
Price Target (Y)
22-Dec-09 OW 4770 9490
12-Apr-10 OW 4845 9410
26-Apr-10 OW 4595 8050
14-Jan-11 OW 4845 8140
10-Jan-12 N 5010 5000
10-Oct-12 N 5750 6000
26-Oct-12 NR 6370 --
0
909
1,818
2,727
3,636
4,545
5,454
Price(Y)
Aug08
May09
Feb10
Nov10
Aug11
May12
Feb13
SOFTBANK (9984) (9984.T, 9984 JT) Price Chart
UW Y2,520 UW Y2,910
N Y1,860 UW Y1,910UW Y2,030UW Y2,380 UW Y2,720 OW Y3,000OW Y3,500OW Y3,800
Source: Bloomberg and J.P. Morgan; price data adjusted for stock splits and dividends.
Initiated coverage Oct 14, 2008.
0
1,137
2,274
3,411
4,548
5,685
6,822
7,959
9,096
10,233
Price(Y)
Sep09
Dec09
Mar10
Jun10
Sep10
Dec10
Mar11
Jun11
Sep11
Dec11
Mar12
Jun12
Sep12
Dec12
KDDI (9433) (9433.T, 9433 JT) Price Chart
OW Y8,050 NR
OW Y9,490OW Y9,410 OW Y8,140 N Y5,000 N Y6,000
Source: Bloomberg and J.P. Morgan; price data adjusted for stock splits and dividends.
Initiated coverage Dec 22, 2009.
18
Asia Pacific Equity Research21 January 2013
James R. Sullivan, CFA(65) [email protected]
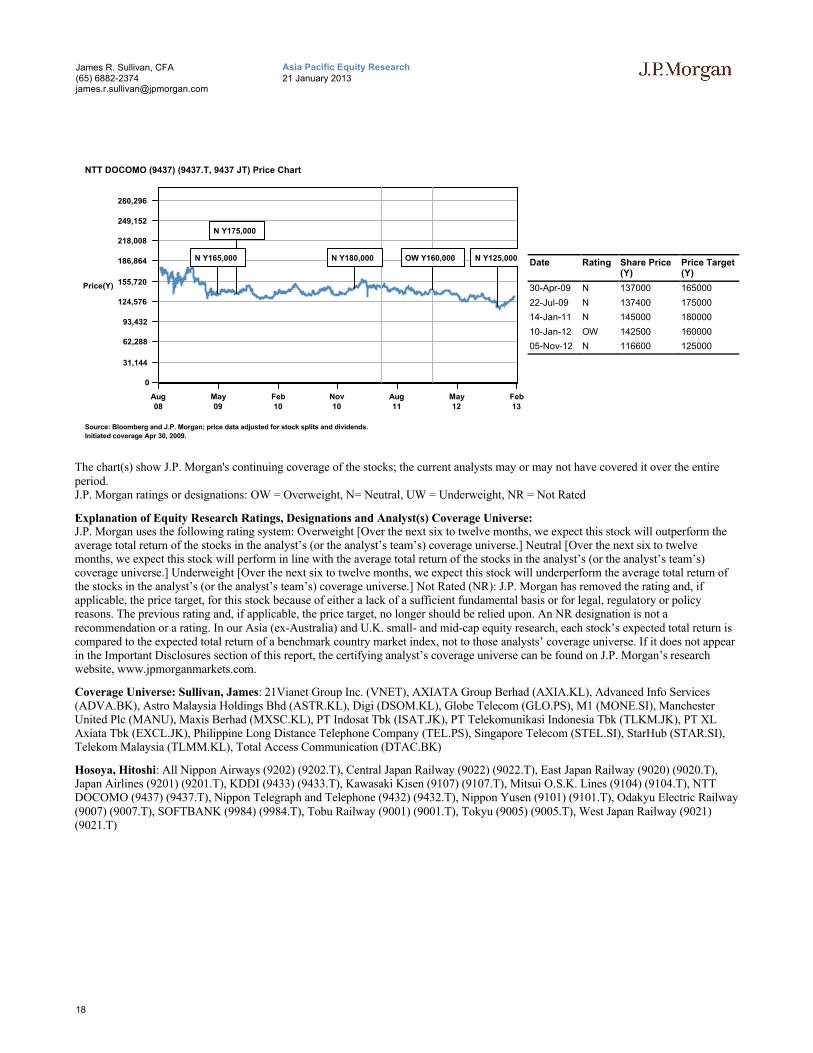
Date Rating Share Price (Y)
Price Target (Y)
30-Apr-09 N 137000 165000
22-Jul-09 N 137400 175000
14-Jan-11 N 145000 180000
10-Jan-12 OW 142500 160000
05-Nov-12 N 116600 125000
The chart(s) show J.P. Morgan's continuing coverage of the stocks; the current analysts may or may not have covered it over the entire period. J.P. Morgan ratings or designations: OW = Overweight, N= Neutral, UW = Underweight, NR = Not Rated
Explanation of Equity Research Ratings, Designations and Analyst(s) Coverage Universe: J.P. Morgan uses the following rating system: Overweight [Over the next six to twelve months, we expect this stock will outperform the average total return of the stocks in the analyst’s (or the analyst’s team’s) coverage universe.] Neutral [Over the next six to twelve months, we expect this stock will perform in line with the average total return of the stocks in the analyst’s (or the analyst’s team’s) coverage universe.] Underweight [Over the next six to twelve months, we expect this stock will underperform the average total return of the stocks in the analyst’s (or the analyst’s team’s) coverage universe.] Not Rated (NR): J.P. Morgan has removed the rating and, if applicable, the price target, for this stock because of either a lack of a sufficient fundamental basis or for legal, regulatory or policy reasons. The previous rating and, if applicable, the price target, no longer should be relied upon. An NR designation is not a recommendation or a rating. In our Asia (ex-Australia) and U.K. small- and mid-cap equity research, each stock’s expected total return is compared to the expected total return of a benchmark country market index, not to those analysts’ coverage universe. If it does not appear in the Important Disclosures section of this report, the certifying analyst’s coverage universe can be found on J.P. Morgan’s research website, www.jpmorganmarkets.com.
Coverage Universe: Sullivan, James: 21Vianet Group Inc. (VNET), AXIATA Group Berhad (AXIA.KL), Advanced Info Services (ADVA.BK), Astro Malaysia Holdings Bhd (ASTR.KL), Digi (DSOM.KL), Globe Telecom (GLO.PS), M1 (MONE.SI), Manchester United Plc (MANU), Maxis Berhad (MXSC.KL), PT Indosat Tbk (ISAT.JK), PT Telekomunikasi Indonesia Tbk (TLKM.JK), PT XL Axiata Tbk (EXCL.JK), Philippine Long Distance Telephone Company (TEL.PS), Singapore Telecom (STEL.SI), StarHub (STAR.SI), Telekom Malaysia (TLMM.KL), Total Access Communication (DTAC.BK)
Hosoya, Hitoshi: All Nippon Airways (9202) (9202.T), Central Japan Railway (9022) (9022.T), East Japan Railway (9020) (9020.T), Japan Airlines (9201) (9201.T), KDDI (9433) (9433.T), Kawasaki Kisen (9107) (9107.T), Mitsui O.S.K. Lines (9104) (9104.T), NTT DOCOMO (9437) (9437.T), Nippon Telegraph and Telephone (9432) (9432.T), Nippon Yusen (9101) (9101.T), Odakyu Electric Railway(9007) (9007.T), SOFTBANK (9984) (9984.T), Tobu Railway (9001) (9001.T), Tokyu (9005) (9005.T), West Japan Railway (9021) (9021.T)
0
31,144
62,288
93,432
124,576
155,720
186,864
218,008
249,152
280,296
Price(Y)
Aug08
May09
Feb10
Nov10
Aug11
May12
Feb13
NTT DOCOMO (9437) (9437.T, 9437 JT) Price Chart
N Y175,000
N Y165,000 N Y180,000 OW Y160,000 N Y125,000
Source: Bloomberg and J.P. Morgan; price data adjusted for stock splits and dividends.
Initiated coverage Apr 30, 2009.
19
Asia Pacific Equity Research21 January 2013
James R. Sullivan, CFA(65) [email protected]
J.P. Morgan Equity Research Ratings Distribution, as of January 1, 2013
Overweight(buy)
Neutral(hold)
Underweight(sell)
J.P. Morgan Global Equity Research Coverage 44% 44% 12%IB clients* 53% 46% 34%
JPMS Equity Research Coverage 42% 49% 9%IB clients* 71% 62% 51%
*Percentage of investment banking clients in each rating category.For purposes only of FINRA/NYSE ratings distribution rules, our Overweight rating falls into a buy rating category; our Neutral rating falls into a hold rating category; and our Underweight rating falls into a sell rating category. Please note that stocks with an NR designation are not included in the table above.
Equity Valuation and Risks: For valuation methodology and risks associated with covered companies or price targets for covered companies, please see the most recent company-specific research report at http://www.jpmorganmarkets.com, contact the primary analyst or your J.P. Morgan representative, or email [email protected].
Equity Analysts' Compensation: The equity research analysts responsible for the preparation of this report receive compensation based upon various factors, including the quality and accuracy of research, client feedback, competitive factors, and overall firm revenues.
Registration of non-US Analysts: Unless otherwise noted, the non-US analysts listed on the front of this report are employees of non-US affiliates of JPMS, are not registered/qualified as research analysts under NASD/NYSE rules, may not be associated persons of JPMS, and may not be subject to FINRA Rule 2711 and NYSE Rule 472 restrictions on communications with covered companies, public appearances, and trading securities held by a research analyst account.
Other Disclosures
J.P. Morgan ("JPM") is the global brand name for J.P. Morgan Securities LLC ("JPMS") and its affiliates worldwide. J.P. Morgan Cazenove is a marketing name for the U.K. investment banking businesses and EMEA cash equities and equity research businesses of JPMorgan Chase & Co. and its subsidiaries.
All research reports made available to clients are simultaneously available on our client website, J.P. Morgan Markets. Not all research content is redistributed, e-mailed or made available to third-party aggregators. For all research reports available on a particular stock, please contact your sales representative.
Options related research: If the information contained herein regards options related research, such information is available only to persons who have received the proper option risk disclosure documents. For a copy of the Option Clearing Corporation's Characteristics and Risks of Standardized Options, please contact your J.P. Morgan Representative or visit the OCC's website at http://www.optionsclearing.com/publications/risks/riskstoc.pdf
Legal Entities Disclosures U.S.: JPMS is a member of NYSE, FINRA, SIPC and the NFA. JPMorgan Chase Bank, N.A. is a member of FDIC and is authorized and regulated in the UK by the Financial Services Authority. U.K.: J.P. Morgan Securities plc (JPMS plc) is a member of the London Stock Exchange and is authorized and regulated by the Financial Services Authority. Registered in England & Wales No. 2711006. Registered Office 25 Bank Street, London, E14 5JP. South Africa: J.P. Morgan Equities South Africa Proprietary Limited is a member of the Johannesburg Securities Exchange and is regulated by the Financial Services Board. Hong Kong: J.P. Morgan Securities (Asia Pacific) Limited (CE number AAJ321) is regulated by the Hong Kong Monetary Authority and the Securities and Futures Commission in Hong Kong. Korea: J.P. Morgan Securities (Far East) Ltd, Seoul Branch, is regulated by the Korea FinancialSupervisory Service. Australia: J.P. Morgan Australia Limited (JPMAL) (ABN 52 002 888 011/AFS Licence No: 238188) is regulated by ASIC and J.P. Morgan Securities Australia Limited (JPMSAL) (ABN 61 003 245 234/AFS Licence No: 238066) is regulated by ASIC and is a Market, Clearing and Settlement Participant of ASX Limited and CHI-X. Taiwan: J.P.Morgan Securities (Taiwan) Limited is a participant of the Taiwan Stock Exchange (company-type) and regulated by the Taiwan Securities and Futures Bureau. India: J.P. Morgan India Private Limited, having its registered office at J.P. Morgan Tower, Off. C.S.T. Road, Kalina, Santacruz East, Mumbai - 400098, is a member of the National Stock Exchange of India Limited (SEBI Registration Number - INB 230675231/INF 230675231/INE 230675231) and Bombay Stock Exchange Limited (SEBI Registration Number - INB 010675237/INF 010675237) and is regulated by Securities and Exchange Board of India. Thailand: JPMorgan Securities (Thailand) Limited is a member of the Stock Exchange of Thailand and is regulated by the Ministry of Finance and the Securities and Exchange Commission. Indonesia: PT J.P. Morgan Securities Indonesia is a member of the Indonesia Stock Exchange and is regulated by the BAPEPAM LK. Philippines: J.P. Morgan Securities Philippines Inc. is a Trading Participant of the Philippine Stock Exchange and a member of the Securities Clearing Corporation of the Philippines and the Securities Investor Protection Fund. It is regulated by the Securities and Exchange Commission. Brazil: Banco J.P. Morgan S.A. is regulated by the Comissao de Valores Mobiliarios (CVM) and by the Central Bank of Brazil. Mexico: J.P. Morgan Casa de Bolsa, S.A. de C.V., J.P. Morgan Grupo Financiero is a member of the Mexican Stock Exchange and authorized to act as a broker dealer by the National Banking and Securities Exchange Commission. Singapore: This material is issued and distributed in Singapore by J.P. Morgan Securities Singapore Private Limited (JPMSS) [MICA (P) 088/04/2012 and Co. Reg. No.: 199405335R] which is a member of the Singapore Exchange Securities Trading Limited and is regulated by the Monetary Authority of Singapore (MAS) and/or JPMorgan Chase Bank, N.A., Singapore branch (JPMCB Singapore) which is regulated by the MAS. Malaysia: This material is issued and distributed in Malaysia by JPMorgan Securities (Malaysia) Sdn Bhd (18146-X) which is a Participating Organization of Bursa Malaysia Berhad and a holder of Capital Markets Services License issued by the Securities Commission in Malaysia. Pakistan: J. P. Morgan Pakistan Broking (Pvt.) Ltd is a member of the Karachi Stock Exchange and regulated by the Securities and Exchange Commission of Pakistan. Saudi Arabia: J.P. Morgan Saudi Arabia Ltd. is authorized by the Capital Market Authority of the Kingdom of Saudi Arabia (CMA) to carry out dealing as an agent, arranging, advising and custody, with respect to securities business under licence number 35-07079 and its registered address is at 8th Floor, Al-Faisaliyah Tower, King Fahad
20
Asia Pacific Equity Research21 January 2013
James R. Sullivan, CFA(65) [email protected]
Road, P.O. Box 51907, Riyadh 11553, Kingdom of Saudi Arabia. Dubai: JPMorgan Chase Bank, N.A., Dubai Branch is regulated by the Dubai Financial Services Authority (DFSA) and its registered address is Dubai International Financial Centre - Building 3, Level 7, PO Box 506551, Dubai, UAE.
Country and Region Specific Disclosures U.K. and European Economic Area (EEA): Unless specified to the contrary, issued and approved for distribution in the U.K. and the EEA by JPMS plc. Investment research issued by JPMS plc has been prepared in accordance with JPMS plc's policies for managing conflicts of interest arising as a result of publication and distribution of investment research. Many European regulators require a firm to establish, implement and maintain such a policy. This report has been issued in the U.K. only to persons of a kind described in Article 19 (5), 38, 47 and 49 of the Financial Services and Markets Act 2000 (Financial Promotion) Order 2005 (all such persons being referred to as "relevant persons"). This document must not be acted on or relied on by persons who are not relevant persons. Any investment or investment activity to which this document relates is only available to relevant persons and will be engaged in only with relevant persons. In other EEA countries, the report has been issued to persons regarded as professional investors (or equivalent) in their home jurisdiction. Australia: This material is issued and distributed by JPMSAL in Australia to "wholesale clients" only. JPMSAL does not issue or distribute this material to "retail clients". The recipient of this material must not distribute it to any third party or outside Australia without the prior written consent of JPMSAL. For the purposes of this paragraph the terms "wholesale client" and "retail client" have the meanings given to them in section 761G of the Corporations Act 2001. Germany: This material is distributed in Germany by J.P. Morgan Securities plc, Frankfurt Branch and J.P.Morgan Chase Bank, N.A., Frankfurt Branch which are regulated by the Bundesanstalt für Finanzdienstleistungsaufsicht. Hong Kong: The 1% ownership disclosure as of the previous month end satisfies the requirements under Paragraph 16.5(a) of the Hong Kong Code of Conduct for Persons Licensed by or Registered with the Securities and Futures Commission. (For research published within the first ten days of the month, the disclosure may be based on the month end data from two months prior.) J.P. Morgan Broking (Hong Kong) Limited is the liquidity provider/market maker for derivative warrants, callable bull bear contracts and stock options listed on the Stock Exchange of Hong Kong Limited. An updated list can be found on HKEx website: http://www.hkex.com.hk. Japan: There is a risk that a loss may occur due to a change in the price of the shares in the case of share trading, and that a loss may occur due to the exchange rate in the case of foreign share trading. In the case of share trading, JPMorgan Securities Japan Co., Ltd., will be receiving a brokerage fee and consumption tax (shouhizei) calculated by multiplying the executed price by the commission rate which was individually agreed between JPMorgan Securities Japan Co., Ltd., and the customer in advance. Financial Instruments Firms: JPMorgan Securities Japan Co., Ltd., Kanto Local Finance Bureau (kinsho) No. 82 Participating Association / Japan Securities Dealers Association, The Financial Futures Association of Japan, Type II Financial Instruments Firms Association and Japan Investment Advisers Association. Korea: This report may have been edited or contributed to from time to time by affiliates of J.P. Morgan Securities (Far East) Ltd, Seoul Branch. Singapore: JPMSS and/or its affiliates may have a holding in any of the securities discussed in this report; for securities where the holding is 1% or greater, the specific holding is disclosed in the Important Disclosures section above. India: For private circulation only, not for sale. Pakistan: For private circulation only, not for sale. New Zealand: This material is issued and distributed by JPMSAL in New Zealand only to persons whose principal business is the investment of money or who, in the course of and for the purposes of their business, habitually invest money. JPMSAL does not issue or distribute this material to members of "the public" as determined in accordance with section 3 of the Securities Act 1978. The recipient of this material must not distribute it to any third party or outside New Zealand without the prior written consent of JPMSAL. Canada: The information contained herein is not, and under no circumstances is to be construed as, a prospectus, an advertisement, a public offering, an offer to sell securities described herein, or solicitation of an offer to buy securities described herein, in Canada or any province or territory thereof. Any offer or sale of the securities described herein in Canada will be made only under an exemption from the requirements to file a prospectus with the relevant Canadian securities regulators and only by a dealer properly registered under applicable securities laws or, alternatively, pursuant to an exemption from the dealer registration requirement in the relevant province or territory of Canada in which such offer or sale is made. The information contained herein is under no circumstances to be construed as investment advice in any province or territory of Canada and is not tailored to the needs of the recipient. To the extent that the information contained herein references securities of an issuer incorporated, formed or created under the laws of Canada or a province or territory of Canada, any trades in such securities must be conducted through a dealer registered in Canada. No securities commission or similar regulatory authority in Canada has reviewed or in any way passed judgment upon these materials, the information contained herein or the merits of the securities described herein, and any representation to the contrary is an offence. Dubai: This report has been issued to persons regarded as professional clients as defined under the DFSA rules.
General: Additional information is available upon request. Information has been obtained from sources believed to be reliable but JPMorgan Chase & Co. or its affiliates and/or subsidiaries (collectively J.P. Morgan) do not warrant its completeness or accuracy except with respect to any disclosures relative to JPMS and/or its affiliates and the analyst's involvement with the issuer that is the subject of the research. All pricing is as of the close of market for the securities discussed, unless otherwise stated. Opinions and estimates constitute our judgment as of the date of this material and are subject to change without notice. Past performance is not indicative of future results. This material is not intended as an offer or solicitation for the purchase or sale of any financial instrument. The opinions and recommendations herein do not take into account individual client circumstances, objectives, or needs and are not intended as recommendations of particular securities, financial instruments or strategies to particular clients. The recipient of this report must make its own independent decisions regarding any securities or financial instruments mentioned herein. JPMS distributes in the U.S. research published by non-U.S. affiliates and accepts responsibility for its contents. Periodic updates may be provided on companies/industries based on company specific developments or announcements, market conditions or any other publicly available information. Clients should contact analysts and execute transactions through a J.P. Morgan subsidiary or affiliate in their home jurisdiction unless governing law permits otherwise.
"Other Disclosures" last revised January 1, 2013.
Copyright 2013 JPMorgan Chase & Co. All rights reserved. This report or any portion hereof may not be reprinted, sold or redistributed without the written consent of J.P. Morgan. #$J&098$#*P