the effect and mechanisms of ultrasound transducer ... · pdf filethe effect and mechanisms of...
TRANSCRIPT

Weigang, et al. Effects and Mechanisms
Page 1
The Effect and Mechanisms of Ultrasound Transducer Degradation on the Quality and Clinical Efficacy of Diagnostic Ultrasound Examinations
In diagnostic ultrasound studies the “health” of the transducer (also referred to as the probe or scan-head) is a key component to the overall clinical quality and efficacy of the study. Central to the transducer’s performance is the integrity of the acoustic stack, and specifically the viability of the individual elements that make up the transducer array. Modern ultrasound transducers often contain 128 and in some cases 288 or more elements. It is well known that with time and normal wear and tear, individual elements within the transducer array can cease working altogether (i.e., dead elements) or demonstrate significantly reduced sensitivity compared to their original specification. Further, these compromised elements (either “dead” or degraded) fundamentally affect the operation of the entire transducer, and therefore can have a negative impact on clinical results, and potentially, the efficacy of the entire ultrasound study. To investigate the potential of element degradation to affect clinical results, we evaluated a number of ultrasound transducers with selected elements disconnected, and compared those results with the same transducers with all elements functioning. We examined how dead elements affected: the transmitted ultrasound beams emitted by the probe, the surface temperature of the probe itself (patient contact area), various acoustic parameters of the probe, tissue mimicking phantom imaging, flow phantom testing (spectral and Color Flow), and lastly human imaging. The results show that as few as two consecutive dead elements in an array of 128 elements can have a noticeable impact on the acoustic beam propagated into the body. Four or more dead or degraded elements in an array have a markedly negative impact on the acoustic beam, resulting in reduced resolution, reduced depth of penetration (for both Doppler and imaging), image “blooming” at depth, a higher overall noise floor in imaging modes, and both peak velocity errors as well as directional ambiguities in spectral displays. We have also shown that the relative validity of the MI and TI values displayed on-screen may be compromised with defective arrays. We also show that tissue-mimicking phantoms are equivocal in determining element performance. We conclude that the overall health of the array is critical to obtaining a high quality and efficacious ultrasound study, and that the potential for misdiagnosis increases as array elements degrade.
Beate Weigang, B.Sc., G. Wayne Moore, B.Sc., M.A., James Gessert, B.Sc., Mark Schafer, Ph.D., Longmont, Colorado and Ulm, Germany
In diagnostic ultrasound studies the overall health of the transducer is a critical factor in contributing to the ultimate quality and efficacy of the examination. Unfortunately, the transducer is also the one component in the imaging chain that is subjected to the most potential for damage. Because even a compromised transducer can produce some level of B-mode image, spectral Doppler or Color Flow, highly skilled clinical users can sometimes be confused when an adequate study cannot seem to be performed, for example on a patient with a large body habitus, or even on a consistent basis across a large cross-section of patients. Often this results in unnecessary and expensive service calls, rescheduling of the patient, sending the patient to another facility for an additional examination, increased examination time, or, in the worst case, a potentially missed diagnosis.
From the Transducer Analysis and Repair Laboratory, Sonic Technology Laboratories, Sonora Medical Systems, Longmont Colorado Reprint requests; G. Wayne Moore, Sonora Medical Systems, 2021 Miller Drive, Longmont CO 80501

Weigang, et al. Effects and Mechanisms
Page 2
38 – 45 gauge coax
RF Shielding
CaseBacking Layer
Matching Layer
Piezoelectric Element
Acoustic Lens
38 – 45 gauge coax
RF Shielding
CaseBacking Layer
Matching Layer
Piezoelectric Element
Acoustic Lens
Figure 1 – Transducer Acoustic Stack
In our experience with transducer testing and repair1, data has indicated that as many as 25% of all ultrasound transducers currently in clinical use may have some form of undiagnosed performance-inhibiting or structural problem. The current number of installed ultrasound systems in the United States is more than 110,000 2, with an average of 3.6 probes per system. That means approximately 99,000 probes currently in use may have some form of structural, electrical or element related problem. We have also found that most probes are rarely tested on a consistent basis to ensure proper performance. Two of the most common performance compromising failures are lens delamination or some form of element damage in the array. In order to obtain optimal clinical results it is important to understand the relationship between proper probe performance and the resultant clinical study. This paper focuses on the mechanisms and affects that element damage has on the overall quality and efficacy of the ultrasound study. An acoustic stack, the performance heart of a transducer, is comprised of the following; backing material, piezo-electric ceramic and a matching layer (Figure 1). The backing material reduces the ring-down time of an excited element, a critical factor to ensuring optimal axial resolution and low noise. The matching layer matches the acoustic impedance of the piezo-electric array with body tissue. Proper matching minimizes the acoustic differences between the transducer face (i.e., the boundary layer) and the body tissue, thereby increasing the efficiency of sound transmission and reception. Both the matching layer and the backing material can detach from the array and create substantial signal drop out in the image. The piezo-electric ceramic is a block of material that is sub-diced into a row of some number of elements (e.g., 96,128). These elements are individually excited to create the ultrasound beam that is propagated into the body, and, in turn, each receives the returned “echoes”, converting them into electrical signals. The electrical signals are then processed by the ultrasound system producing the resultant B-mode image, Doppler signal or color flow image on the system display. Each of these elements is connected to the system via a 38 to 45 gauge coaxial wire that is bundled into the transducer cable.
The ultrasound system typically excites the piezo-electric elements (crystals) in the array with a short duration pulse of approximately 60 to 120V. To create a single acoustic beam a range of 32 to 64 elements are pulsed simultaneously. With linear and curved linear array transducers this process is repeated across the array until approximately 128 such acoustic “lines” are
created to form a B-mode image. Acoustic line density is a measure of the number of acoustic

Weigang, et al. Effects and Mechanisms
Page 3
lines of sight that comprise the resultant image. Line density is normally measured in terms of lines-per-degree in sector images and lines-per-millimeter in rectangular (e.g., linear array) images. With a linear phased array probe the entire array of elements are often used to create an acoustic line, and, through the use of delay lines, the beam is steered to create a “sector” display format. Although various manufacturers use different sequencing and pulsing techniques to create spectral Doppler signals as well as color flow imaging, they all operate under the same physical, mechanical and electrical constraints. To that end, it is essential that the clinical user have a fundamental understanding of the operation of an array and its interaction with the ultrasound system.
In order for an ultrasound system to display data accurately and completely it is important that all elements “fired” to form an acoustic line be operating at maximum efficiency, that is, according to manufacturer’s specifications. Many OEM transducer operators’ manuals cite various transducer performance specifications that the user can expect when the transducer is operating correctly. For example; (1) minimum penetration (expressed in cm), (2) axial resolution (expressed in millimeters at some centimeter of depth, e.g., 1.0 mm at 4cm) and (3) lateral resolution (expressed in millimeters at some centimeter of depth, e.g., 3.2mm at 4cm). These values can be confirmed using a tissue-mimicking phantom that contains various spatial targets (see Photo 2). At least one transducer operator’s manual states”…the probe that you select is the most important factor in image quality…”3. It follows then that the proper operation of that selected probe is the most important factor in image quality. Another less well-defined performance parameter relates to image artifacts. Artifacts can be seen as “speckle”, or “white” noise in the image, reverberations, missing data due to poor resolution or lack of depth of penetration, incorrect target location (due in part to increased side lobes or multi-path reflections), incorrect object size or object shape, again due in part to poor spatial resolution. OEM transducer operator’s manuals, for example, inform the clinical user that artifacts in the image may be the result of “…ultrasonic beam geometry and unusual changes in beam intensity…”4, these changes may occur as the result of element damage. A typical beam intensity profile can be seen in Figure 2. Changes in individual element performance will, among other things, change the overall beam geometry and increase side lobes (with the resultant increased image artifact). We have concluded that defective probes exacerbate naturally occurring artifact phenomenon. There are many circumstances in the normal use of a transducer that can result in damaged or dead elements in the array. For example an array element can be destroyed by a simple electrostatic discharge (ESD), also known as static shock, from the user to the transducer. Also probes are often dropped or banged against a table or other hard object.
Figure 2 – Beam Intensity Profile
Weigang, et al. Effects and Mechanisms
Page 4
Figure 4 Temperature Graph
Photo 1 – First Call Tester
Stepper Motor Arms
PVDF Hydrophone
Diagram 1 – API Test Tank
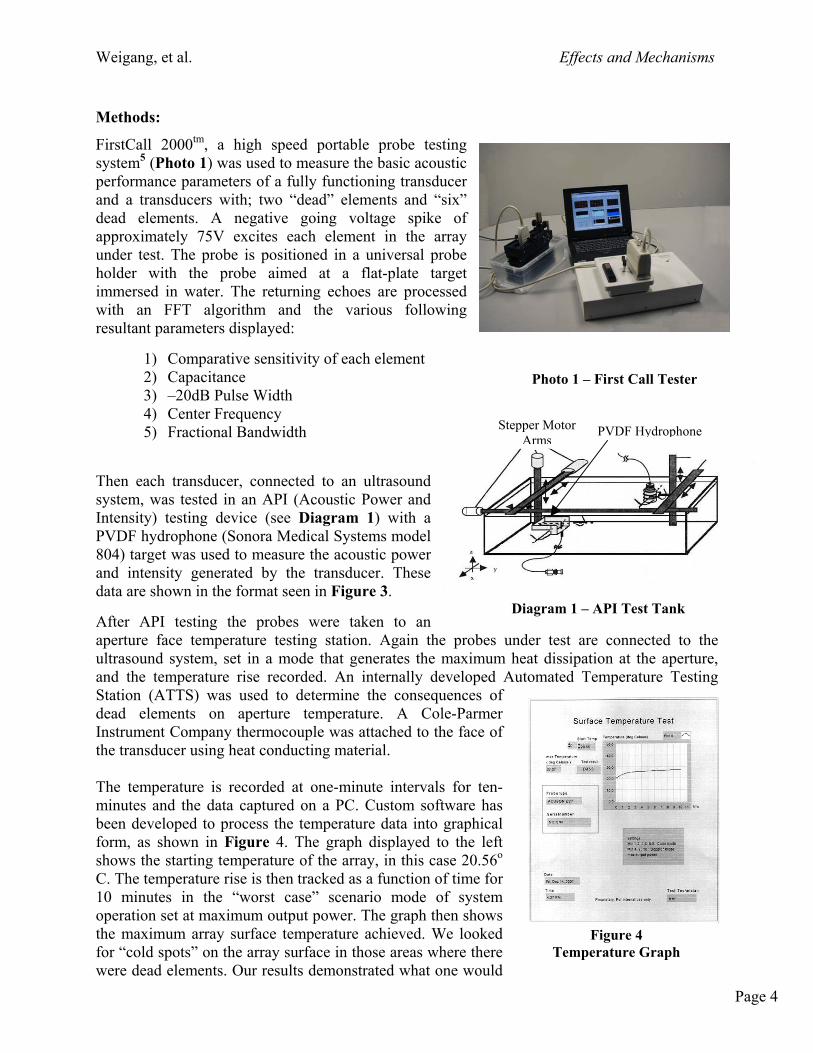
Methods:
FirstCall 2000tm, a high speed portable probe testing system5 (Photo 1) was used to measure the basic acoustic performance parameters of a fully functioning transducer and a transducers with; two “dead” elements and “six” dead elements. A negative going voltage spike of approximately 75V excites each element in the array under test. The probe is positioned in a universal probe holder with the probe aimed at a flat-plate target immersed in water. The returning echoes are processed with an FFT algorithm and the various following resultant parameters displayed:
1) Comparative sensitivity of each element 2) Capacitance 3) –20dB Pulse Width 4) Center Frequency 5) Fractional Bandwidth
Then each transducer, connected to an ultrasound system, was tested in an API (Acoustic Power and Intensity) testing device (see Diagram 1) with a PVDF hydrophone (Sonora Medical Systems model 804) target was used to measure the acoustic power and intensity generated by the transducer. These data are shown in the format seen in Figure 3. After API testing the probes were taken to an aperture face temperature testing station. Again the probes under test are connected to the ultrasound system, set in a mode that generates the maximum heat dissipation at the aperture, and the temperature rise recorded. An internally developed Automated Temperature Testing Station (ATTS) was used to determine the consequences of dead elements on aperture temperature. A Cole-Parmer Instrument Company thermocouple was attached to the face of the transducer using heat conducting material. The temperature is recorded at one-minute intervals for ten-minutes and the data captured on a PC. Custom software has been developed to process the temperature data into graphical form, as shown in Figure 4. The graph displayed to the left shows the starting temperature of the array, in this case 20.56o C. The temperature rise is then tracked as a function of time for 10 minutes in the “worst case” scenario mode of system operation set at maximum output power. The graph then shows the maximum array surface temperature achieved. We looked for “cold spots” on the array surface in those areas where there were dead elements. Our results demonstrated what one would

Weigang, et al. Effects and Mechanisms
Page 5
Manufacturer System Probe Type Element Test Status Element Test Status
Acuson (Siemens) 128XP10 L5 Linear Array 2 Dead 6 DeadAcuson (Siemens) 128XP10 V4 Phased Array 6 Dead
ATL (Philips) HDI 3000 C4-2 Curved Array 6 Dead
assume would occur; that is, in areas where there were dead elements the array surface was cooler than in areas where the elements were active. The basic resolution (axial and lateral) and penetration performance of these probes was then tested using a tissue-mimicking phantom6 (Figure 4a) with spatial resolution targets embedded
within the phantom. These images were then compared to the images obtained using probes with no “dead” elements. A zoomed tissue phantom image of a good array versus a defective array (six “dead” elements) is shown in Figure 5. The Doppler sensitivity of these probes was then tested using a calibrated flow phantom7 (Photo 3). The actual signals derived from the flow phantom are shown in Figure 6, these images compare a good array with a defective array (six “dead” elements).
To simulate the typical change experienced due to transducer damage in the field, several matched pairs of transducers were tested (see below) using the systems also seen below. One transducer type was used as a matched pair reference; the second was used to simulate damage to
specific elements of the array. In this study disconnecting the element from the array simulated the “dead” elements in the acoustic stack. The probes that were used in the study were; an Acuson L7 linear array, an Acuson V4 phased array and an ATL C4-2 curved. The systems used were an Acuson (Siemens) 128XP10 and an ATL (Philips) HDI 3000. The defects introduced were 2 dead elements and 6 dead elements as shown below.
Systems and Probes Used in Research
Lastly the probes with dead (i.e., open) elements were tested on a volunteer subject for actual imaging and Doppler comparisons. The images from these tests can be seen in Figures 8 and 8a (images in 8a were taken using a C4-2 curved array probe with an ATL HDI3000 ultrasound system).
Photo 2 – Tissue Mimicking Phantom
Photo 3 – Doppler Flow Phantom

Weigang, et al. Effects and Mechanisms
Page 6
Results:
As shown in Figure 3 the differences between the functional L5 array versus the defective array (2 “dead” elements) are quite pronounced in terms of increased side lobe levels. As discussed earlier, these increased side lobe levels result in more noise in the image, decreases lateral resolution and create flow direction confusion in the Doppler mode. Increased side lobe levels negatively impact the acoustic dynamic range, which, by definition, is the ratio between the main lobe (see above) signal strength and the average side lobe level signal strength. These side lobes therefore can contribute high levels of acoustic noise within the image. Also demonstrated in the diagrams to the right are the corresponding decreases in acoustic power available at depth. Note the functional array shows ~ 88mW/cm2 SPTA (spatial peak temporal average), while the defective array shows only 73mW/cm2. This reduction in power inhibits depth of penetration of the ultrasound signal, and reduces the levels of the returning signals, especially in any Doppler related mode. This reduced power would also indirectly affect the optimal depth of field of any given transducer. Depth of field is a measure of the range of optimal imaging characteristics as a function of depth. It can be expressed as the depth range where the lateral beam width does not exceed twice the beamwidth at the focal point. The combination of increased side lobe levels coupled with reduced power at depth will compromise effective penetration and gray level intensity as well as resulting in reduced lateral resolution in the image.
Figure 3 – API Testing and Display Format
Increased Side-Lobes Main Lobe

Weigang, et al. Effects and Mechanisms
Page 7
Attempts to use tissue-mimicking phantoms to differentiate functional transducers from non-functional transducers tended to be difficult, subjective, and often not repeatable. As is shown in Figure 5 the difference between the image on the left and the image on the right is not conclusive, even though the image on the right was obtained using an L5 transducer with six “dead” elements. In cases where there were a larger number of consecutive dead elements (>8) the tissue phantom could be used to demonstrate that a problem existed, but was not at all useful in determining if the problem was specifically with the elements, the cable, the lens, or the system transmitter. Tissue-mimicking phantoms were used in our study to determine if the measured the axial and lateral resolution produced by defective probes were a good indicator of dysfunction compared to the OEM’s specifications for new probes. Due in part to the averaging process that occurs in the ultrasound system when several elements are fired simultaneously to form an acoustic line we concluded that this measurement was not a reliable indicator of element damage, especially with 6 or fewer dead elements in a phased array probe. We next tested the Doppler performance of functional versus defective arrays. The actual images of these results are shown in Figure 6. These images were taken using a calibrated flow phantom. As is shown, the C4-2 array with six “dead” elements (bottom image) had significantly reduced sensitivity to flow, an increase in the noise floor (i.e., increased background or “white” noise) and even more troublesome, displayed a lower maximum flow velocity (~ 50cm/sec) than the actual velocity (~75cm/sec). The reduction in sensitivity and underestimation of flow velocity could potentially lead to a misdiagnosis or under diagnosis in a clinical circumstance where maximum Doppler and Color Flow sensitivity or accurate velocity measurements are required (e.g., when using the modified Bernoulli equation to calculate pressure gradients). Because of the beam averaging that occurs with
Figure 6 – Flow Phantom Results Functional Array Top, Defective Array Bottom
Figure 5 – Tissue Phantom Image Functional Array Left, Defective Array Right

Weigang, et al. Effects and Mechanisms
Page 8
a phased array probe (V4), the B-mode image really provided little clue relative to the six “dead” elements, but the Doppler results were quite conclusive. In clinical use we discovered that linear and curved linear array probes with as few as two “dead” elements can materially impact all Doppler based modality results. We believe, and will further investigate, these same types of negative results can be expected using standard two-dimensional imaging with contrast media where high dynamic range is absolutely essential to good clinical results, for example with myocardial perfusion imaging. Further, in the future when therapeutic agents may be encapsulated in contrast micro-bubbles, the ability to accurately predict the MI (mechanical index) level at which a micro-bubble will “pop”, thereby releasing the therapeutic agent, will rely on the assumption that the transducer is functioning properly and is producing the type of acoustic response indicated by the output values (MI/TI) displayed on-screen Because spectral Doppler data is processed using a quadrature detection technique to determine flow direction, the increases in side lobe levels observed with the API testing indicated that there might be a problem with the ability of an ultrasound system to adequately differentiate flow direction when probes have element damage. This concern was seen during live clinical imaging and is demonstrably shown in Figure 8 on Page 9. In clinical circumstances where flow direction, or the precise timing of flow direction, may be a differential in the diagnosis, this lack of adequately differentiated flow direction could lead to substantially increased examination time, or potentially, lead to a misdiagnosis or equivocal study.
Effect of two “dead” elements side-by-side: As shown in Figure 7 the FirstCall test show elements 64 and 65, the two “dead” elements, displaying zero sensitivity compared to the surrounding elements. The API test with the Acuson (Siemens) L5 transducer with two “dead” elements revealed an overall lowering of transmitted acoustic output power from a normal value of 88mW/cm2 (SPTA) to 73mW/cm2 (SPTA) (see Figure 3). In addition to the lower output power the side-lobes of the beam went up fairly dramatically also shown in Figure 3. Increased side-lobe levels results in higher artifact levels present in the image and in the Doppler waveform. An Acuson (Siemens) 128XP10 system was used in the testing. Figure 8 shows Pulsed Doppler spectral waveforms from an abdominal aorta. The image on the left was taken with a functional probe, the one on the right a probe with only two “dead” elements in the center of the array. As is clearly seen by the spectral waveform, shown in Figure 8, below, produced using the L5 array with two “dead” elements, the flow profile is ill defined, has increased background noise and is ambiguous relative to flow direction.
Figure 7 – FirstCall Test Results, Element-by-Element Test

Weigang, et al. Effects and Mechanisms
Page 9
Effect of six dead elements side-by-side: In Figure 8a above, the ATL (Philips) C4-2 curved array probe has six “dead” elements in the middle of the array. One can observe both a slight shadowing in the middle of the image and discernable loss of signal amplitude (drop in gray scale brightness). Another probe, an Acuson (Siemens) V4 128-element linear phased array probe with six “dead” elements was used for further testing.
As is shown in Figure 9 the FirstCall test shows elements 63 through 68 of the V4 probe with zero sensitivity. An Acuson (Siemens) 128XP10 system was used in the testing. The API test with the V4 probe revealed an overall lowering of transmitted acoustic output power from a normal value of ~ 103mW/cm2 (SPTA) to ~ 67mW/cm2 (SPTA) (see Table 3 below).
Measured Parameter Functional Probe Six Dead Elements In-water SPTA 103.2mW/cm2 67.2mW/cm2
Pa 248.3W/cm2 156.3W/cm2 Pr -1.88MPa -1.68MPa
Table 3 – Acoustic Parameters, Measured Results
Note to Table: SPTA = Spatial Peak Temporal Average, Pa = Derated Pulse Average intensity at the maximum MI, Pr = Derated peak rarefactional pressure
Figure 8 – Left Image Normal, Right Image 2 Dead Elements
Figure 8a – Left Image Normal, Right Image 6 Dead Elements

Weigang, et al. Effects and Mechanisms
Page 10 Figure 10 – Abdominal Aorta, Left Image Functional Probe,
Right Image, V4 probe with 6 Dead Elements
Figure 9 - FirstCall Test Results, Element-by-Element Test
In addition to the lower output power, the side-lobes of the beam, as with the L5, also went up fairly dramatically. Increased side-lobe levels results in higher artifact levels present in the image and in the Doppler waveform.
Figure 10 shows Pulsed Doppler spectral waveforms from an abdominal aorta. The image on the left was taken with the functional V4 probe, the one on the right with six “dead” elements in the center of the V4’s array. As is clearly seen in the spectral display obtained using the V4 array with six “dead” elements the waveform is ill defined (increased spectral broadening), has increased background noise and a lower peak velocity displayed.
Dead Elements
Weigang, et al. Effects and Mechanisms
Page 11
Conclusions: The clinical attractiveness of diagnostic ultrasound studies has always been that it is reliable, efficacious, painless, low risk (i.e., non-ionizing radiation) and cost effective. Our data has shown that to actualize these five benefits that not only the system, but the probes also must be functioning according to OEM specifications. We have shown that the main acoustic mechanisms at work in probe performance degradation are the changes in the power intensity pattern from that of a fully functional probe; loss of acoustic power at similar depths, reduced axial and lateral resolution due to increased ring-down time and increased side-lobe levels, and, lastly, loss of overall system dynamic range due to decreased summation gain8 from the beamformer. Our study indicates that as few as two consecutive dead elements in a 128- element array can negatively impact the overall quality and clinical efficacy of any given examination and that the ability to detect those dead elements with a tissue-mimicking phantom is equivocal. We have also shown that six or more consecutive dead elements will dramatically alter the power intensity pattern with a corresponding loss in image and Doppler sensitivity, peak velocity and flow directivity. Ultrasound examinations conducted on particularly difficult to image patients (e.g., large body habitus) or with modalities (e.g., CW Doppler and 2nd harmonic imaging) that require the maximum available dynamic range from an ultrasound system and optimal acoustic output power from the transducer to yield good results are the first to suffer from array degradation. Simply increasing the acoustic output power level via the system’s user interface does little to enhance the performance of an array with defective elements, as the increased power level further distorts the already deformed acoustic beam. This practice would also be contrary with the goal of using as little acoustic power as is needed (ALARA). Further, the MI and TI values, intended to guide the user in the prudent use of power, become increasingly irrelevant as a probe’s performance deteriorates. A good deal of attention has been given recently in the literature9 concerning the assumption of relative safety of diagnostic ultrasound in clinical use. Our study indicates that, at least in part, the safety and efficacy of an ultrasound examination, particularly Doppler, is predicated on the proper functioning of the transducer and the ultrasound system. We conclude, therefore, that the potential for misdiagnosis increases as array elements degrade.
Attention in the past has been focused on performing preventative maintenance on the ultrasound system itself, with often little regard to testing the attendant probes. To obtain optimal clinical results and to ensure patient safety all transducer in use should be tested at a minimum of once per year. As transducer technology becomes even more complex, with the introduction of 1.5d and 2d arrays, the need to accurately and quantitatively assess the functionality of these probes becomes even more pronounced. Newer processing technologies such as spatial compounding and phase aberration correction rely heavily on a fully functional array to produce high-resolution, artifact-free, images. A method and device now exists (FirstCall 2000) to cost effectively test the performance parameters of transducers in a repeatable, reliable, cost-effective and quantitative manner.

Weigang, et al. Effects and Mechanisms
Page 12
References/Notes to Text
1. Sonora’s probe laboratory has tested over 3,000 probes sent in from facilities throughout
the United States. Further, on-site testing and inspection of probes has been done by Sonora test engineers at several hospitals within the United States. The estimates of potentially damaged probes do not represent a classical statistical analysis, rather an empirically based approximation.
2. Klein, Havey, The Medical Diagnostic Ultrasound Market in the USA, Challenges &
Opportunities in the New Millennium, A Multiclient Report, 2000. KBC, Inc. Page IV-7 3. ATL/Philips, HDI 3000 Scanheads and Safety Manual, 4701-0015-05, Rev A, 5/98, Page
2-1
4. Ibid, Page 2-13 5. FirstCall is a high speed portable probe tester produced by Sonora Medical Systems
6. Tissue Phantom - RMI Model 403GS, Grammex RMI
7. Doppler Phantom – ATS Model 524, Peripheral Vascular Doppler Flow Phantom, ATS
Laboratories, Inc.
8. Summation gain in a digital beamformer is related to additional gain contribution (i.e., dynamic range) from the total number of A/D converters used in the receive mode. If that A/D converter is not receiving actual signals from an individual element it is effectively eliminated from the processing gain component.
9. Potential fetal brain damage from ultrasound use reported – European Intelligence Wire,
12/11/2001 – Study by the Karolinska Institute in Stockholm, Sweden, Professor Juni Palmgrem, et al.

Weigang, et al. Effects and Mechanisms
Page 13
About the Authors:
Beate Weigang – An engineering intern at Sonora, Ms. Weigang is completing her engineering degree at the University of Applied Sciences-Ulm in Germany. Her focus at Sonora during her internship has been on the effect of damaged arrays on beam geometry, performance, safety and acoustic output power changes. G. Wayne Moore – President and CEO of Sonora. A twenty-year veteran of the diagnostic ultrasound market Mr. Moore has held senior level positions with several major medical manufactures, including Director of Business Development for Siemens Medical Systems. Mr. Moore has an undergraduate degree in Electrical Engineering and a Masters in Business Administration from the University of Denver. Jim Gessert – Vice President of Engineering. Mr. Gessert’s ultrasound career spans twenty years and has included direct responsibility for bringing several technologically intensive diagnostic ultrasound systems to market. Mr. Gessert holds several important ultrasound patents and was awarded the H. W. Sweatt Award for engineering excellence from Honeywell Medical Systems. Mr. Gessert holds a Bachelor of Science Degree in Electrical Engineering from the University of Michigan and a Bachelor of Science Degree in Physics from Central Michigan University. Mark Schafer, PhD – Sonora’s Senior Acoustic Consultant. Dr. Schafer has been involved in diagnostic ultrasound since the mid 1980’s. He was a senior scientist at Interspec, an ultrasound company purchased by ATL in the mid-1990’s. Dr. Schafer is a leading expert in ultrasound and is a Fellow, American Institute of Ultrasound in Medicine (AIUM). He was also the President and Board Member of the Ultrasonic Industry Association. Dr. Schafer’s undergraduate degree is in electrical engineering (MIT) and his doctorate, in Biomedical Engineering, was awarded by Drexel University.