the effect of a universal basic income on life decisions
TRANSCRIPT

University of South Dakota University of South Dakota
USD RED USD RED
Honors Thesis Theses, Dissertations, and Student Projects
Spring 2019
The Effect of a Universal Basic Income on Life Decisions: The Effect of a Universal Basic Income on Life Decisions:
Evidence from a Student Lab Experiment Evidence from a Student Lab Experiment
Tyler Wenande University of South Dakota
Follow this and additional works at: https://red.library.usd.edu/honors-thesis
Recommended Citation Recommended Citation Wenande, Tyler, "The Effect of a Universal Basic Income on Life Decisions: Evidence from a Student Lab Experiment" (2019). Honors Thesis. 69. https://red.library.usd.edu/honors-thesis/69
This Honors Thesis is brought to you for free and open access by the Theses, Dissertations, and Student Projects at USD RED. It has been accepted for inclusion in Honors Thesis by an authorized administrator of USD RED. For more information, please contact [email protected].

THE EFFECT OF A UNIVERSAL BASIC INCOME ON LIFE DECISIONS:
EVIDENCE FROM A STUDENT LAB EXPERIMENT
by
Tyler Wenande
A Thesis Submitted in Partial Fulfillment
Of the Requirements for the
University Honors Program
________________________________________________________
Department of Political Science
The University of South Dakota
June 2019
iv
ABSTRACT
The Effect of a Universal Basic Income on Life Decisions: Evidence from a Student Lab
Experiment
Tyler Wenande
Director: Shane Nordyke, Ph.D.
A Universal Basic Income (UBI) is an unconditional cash transfer administered universally
regardless of employment or economic status. A UBI, while typically thought of as a response to
rising income inequality or threatening automation, has the potential to achieve a number of
effects, only some of which are economic. And while a UBI could have positive effects, there are
some critiques of UBI that warrant merit and will be examined in this paper after discussing the
potential positive effects. An experiment was designed to test some of the theories promoted by
UBI critics and proponents. Subjects, divided into two groups with the treatment group receiving
a UBI, played an economic game where they made decisions about work and leisure,
consumption, education, and savings. Subjects decisions were recorded and data was analyzed
using OLS multivariate regressions to reveal results that generally align with real-world pilots.
UBI recipients work less when they can use that time to achieve higher levels of education.
When there is no opportunity for education, there was no statistically significant difference in the
amount of time that subjects spent working. UBI recipients also had higher savings and
consumption levels.
KEYWORDS: Universal Basic Income (UBI), Economic Lab Experiment

iv
Table of Contents Introduction .................................................................................................................................................. 1
What is a Universal Basic Income? ............................................................................................................... 2
Effect on Combatting Automation ................................................................................................................ 7
Effect on Inequality and Democracy ........................................................................................................... 10
Effect on Poverty ......................................................................................................................................... 15
Effect on Health & Development ................................................................................................................ 21
Cost ............................................................................................................................................................. 23
Effect on Work ............................................................................................................................................ 25
Research Questions & Hypotheses ............................................................................................................. 34
Methods ...................................................................................................................................................... 35
Results ......................................................................................................................................................... 42
TABLE 6: Panel Data Variable Description ...................................................................................................................... 43
TABLE 7: Cross-Section Variable Description ................................................................................................................. 43
TABLE 8: Manipulated Variable Description ................................................................................................................... 45
TABLE 9: Summary Statistics ........................................................................................................................................... 45
TABLE 10: Regression 1 ................................................................................................................................................... 50
TABLE 11: Regression 2 ................................................................................................................................................... 52
TABLE 12: Regression 3 ................................................................................................................................................... 54
TABLE 13: Regression 4 ................................................................................................................................................... 56
TABLE 14: Regression 5 ................................................................................................................................................... 57
TABLE 15: Regression 6 ................................................................................................................................................... 59
TABLE 16: Regression 7 ................................................................................................................................................... 61
TABLE 17: Regression 8 ................................................................................................................................................... 62
TABLE 18: Regression 9 ................................................................................................................................................... 64
Discussion.................................................................................................................................................... 64
Conclusion ................................................................................................................................................... 67
Appendix: Player Manual ............................................................................................................................ 71
TABLE 1: Profile Table ..................................................................................................................................................... 73
TABLE 2: Random Event Table ........................................................................................................................................ 73
TABLE 3: Education Table ............................................................................................................................................... 73
TABLE 4: Scoring Table .................................................................................................................................................... 73
TABLE 5: Scoring Table .................................................................................................................................................... 73
Works Cited ................................................................................................................................................. 74

1
Introduction A universal basic income (UBI) is a universal, unconditional, cash payment regularly
distributed to all individuals in a geographic area regardless of employment or economic status.1
While it is not a new idea, UBI is receiving renewed attention on an international scale. Using
both theoretical arguments and results from real-world pilot programs, UBI proponents can draft
a strong case in support of a UBI, whose effects could include: reducing poverty, improving
health outcomes and child development, mitigating the negative effects of automation on
vulnerable workers, reducing rising economic inequality, promoting democratic participation,
and ultimately separating paid work from survival. Critics of UBI often claim that the policy
would be too expensive and would result in significant reductions in labor market participation,
which would create negative economic outcomes.
This experiment created a simulation in which subjects were split into a treatment and
control group and assigned one of four profiles with varying education levels and wages. The
treatment group received a $12,000 UBI, and the control group did not. Subjects then made
decisions about work, consumption, leisure, education, and savings for 10 rounds, with each
round being one year. Panel data was collected by treating each round from each subject as an
observation (n = 1020), while cross-sectional data was collected by aggregating each subject’s
decisions to treat each participant as an observation (n = 102). Both panel and cross-sectional
data were analyzed using multivariate OLS regressions to determine the effect of a universal
basic income on the in-game life decisions made by simulation participants. It is hypothesized
that UBI recipients would work slightly less, using most of that time to improve their education.
1 Philippe Van Parijs, Basic Income: a simple and powerful idea for the twenty-first century, (Politics & Society, 2004), 4

2
Further, UBI recipients are hypothesized to increase savings while maintaining a comparable
level of consumption to non-recipients. Finally, UBI recipients are hypothesized to use their
transfer to pursue productive activities, increasing their score by more than the nominal value of
the transfer.
What is a Universal Basic Income? While the term ‘universal’ may lead readers to believe that a UBI is one policy, there are
a number of policy options that UBI advocates may pursue within a universalist framework.2 So
while universal basic income policies are often discussed as if they are a singular policy, there
are actually a number of UBI or UBI-like policies that, because of their unique policy
construction, have unique effects. There are several dimensions along which UBI policies differ,
including universality, individuality, conditionality, uniformity, frequency, modality, and
adequacy.
While it would seem that universality is a rigid quality that would not change between
two ‘universal’ policies, there are a number of groups that may be excluded from various
‘universal’ policies. Non-citizens are commonly excluded from universal policies, for example.3
In this sense, universality can be defined as covering everyone in a perceived political in-group:
because non-citizens are not considered members of the society distributing universal benefits,
they are not included in the universal scheme. Universality also implies that the basic income is
not targeted.4 The UBI is paid to low-income earners, high-income earners, the jobless who seek
work, and the jobless who don’t seek work alike.
2 Jurgen De Wispelaere & Lindsay Stirton, The many faces of universal basic income, (The Political Quarterly, 2004), 266 3 Ibid., 267 4 Hilary W. Hoynes & Jesse Rothstein, Universal Basic Income in the US and Advanced Countries, (National Bureau of Economic Research, 2019), 1

3
Unlike traditional social programs, UBI payments are disbursed to individuals, not
households. Some proponents of UBI have argued that, to better fit with traditional approaches,
it would be acceptable to give benefits to households rather than individuals.5 This, however,
would compromise some of the benefits that UBI holds over traditional programs. Under a UBI
scheme, the amount of benefit an individual receives is independent of what type of household
they belong to.6 This is unlike a traditional scheme, where the benefit amount for a household is
less than what would be the aggregate sum of the benefits if the individuals lived separately. A
UBI, then, by not reducing benefits for households with more than one individual, passes on the
savings of shared accommodation to beneficiaries. Because of the program’s individual focus,
UBI removes isolation traps and incentivizes communal living.7
A universal basic income is also unconditional. Aside from the various exclusions that
result from one’s definition of universality, there are no conditions that prevent an individual
from receiving a universal basic income. This is unlike traditional social programs, which are
often accompanied by a requirement to work or seek work. There are also no conditions about
how a UBI is spent. It may be saved for a rainy day, spent frivolously, invested meticulously,
used to fund human capital investments like education, or any other purpose without restriction.8
The uniformity of a UBI concerns the level of benefit that each individual receives.9
There are two different ways to define uniformity: in absolute and adjusted terms. Absolute
uniformity is what is typically associated with UBI: each person receives the same check for the
same nominal amount, regardless of personal characteristics or location. This means that the UBI
5 De Wispelaere & Stirton, The many faces of universal basic income, 271 6 Van Parijs, Basic Income, 8 7 Ibid., 8 8 Ibid., 42 9 De Wispelaere & Stirton, The many faces of universal basic income, 269

4
is formally uniform, but would provide different beneficiaries with different amounts of
purchasing power due to differences in cost of living.10 Adjusted uniformity aims to distribute
equal amounts of purchasing power to beneficiaries: while not formally uniform (different
beneficiaries receive checks for different amounts), adjusted uniformity provides all beneficiaries
parity in purchasing power by adjusting the universal basic income to account for external
factors, like the regional cost of living.11
The frequency and timing of benefits can have a significant impact on the success of a
UBI. A UBI is distributed in regular payments as opposed to in a lump-sum.12 The timing of UBI
benefits – whether they are distributed weekly, monthly, or annually – does make a difference. 13
The timing of payments can be designed to incentivize or avoid certain behaviors: annual
payments, for example, may better promote larger investment than smaller, more frequent
payments. Alternatively, more frequent payments may be more practical if the policy’s goal is to
give individuals subsistence. The timing of benefits could also be determined by the surrounding
administrative or social frame: because traditional social program benefits and wages are
distributed bi-weekly, it may be desirable for UBI benefits to follow that scheme.14
The mode of a transfer refers to the shape that a transfer takes, namely whether the
transfer is a cash or in-kind transfer.15 A UBI, by definition, is a cash transfer, although some
social policies similar to a UBI advocate for in-kind transfers over cash. Additionally, modality
can be expanded to include the method of disbursing cash benefits. There may be differences in
10 De Wispelaere & Stirton, The many faces of universal basic income, 269 11 Ibid., 269 12 Van Parijs, Basic Income, 5 13 De Wispelaere & Stirton, The many faces of universal basic income, 270 14 Ibid., 270 15 Ibid., 270
5
behavior that result from receiving a monthly check compared to having benefits removed from
an individual’s year-end taxes, similar to a negative income tax (NIT).
A final aspect of a universal basic income is the policy’s adequacy to satisfy
beneficiaries’ basic needs.16 An adequate UBI should be large enough to cover an individual or
family’s basic needs without other sources of income.17 In most versions of UBI, the universal
benefit supplements existing income, in-kind transfers, and some cash transfers; UBI does not
phase out with new incomes and does not need to replace all existing social programs.18 While it
is possible that an adequately large UBI would be able to provide universal basic security
without additional social programs, the abolition of traditional social programs is not a hallmark
of a universal basic income. Some believe that a UBI does not need to be fixed at subsistence
level, arguing that UBI benefits could either exceed or fall short of covering basic necessities.1920
This author would argue that a universal basic income that does not cover necessities is not a
universal basic income at all, just a universal income. Any interpretation of the term ‘basic’ in
universal basic income ought to include affording basic security. If a UBI is not intended to
afford basic security, it is not a true universal basic income.
So, what would a universal basic income look like in the United States? While a UBI as
discussed above – universal, unconditional, and substantial enough to live on – has never been
implemented in a wealthy country like the United States or, for that matter, even in a large scale
pilot experiment.21 Clark (2003) has offered a model for a UBI in the U.S. Every person 18 years
16 De Wispelaere & Stirton, The many faces of universal basic income, 271 17 Hoynes & Rothstein, Universal Basic Income in the US and Advanced Countries, 1 18 Van Parijs, Basic Income, 14 19 Ibid., 271 20 Van Parijs, Basic Income, 4-5 21 Hoynes & Rothstein, Universal Basic Income in the US and Advanced Countries, 17

6
or older would receive a benefit equal to the poverty line for a single person living alone. This
model would provide a second level of benefits to people under 18, set below the poverty line
but high enough to guarantee that family income would be at least equal to the poverty line for a
family of a given size. In 2008, Joseph Kennedy, former chief economist at the U.S. Department
of Commerce, proposed a basic income of $1,250 per month.22
One concern shared by UBI advocates and opponents alike is the how a UBI would
interact with policies already in place. Two UBI policies that are similar in design may produce
very different outcomes because of how the policies interact with the existing social policy
framework.23 One way to minimize this problem would be to integrate a UBI into the existing
social policy framework as much as possible. This could include dispersing benefits in similar
intervals using similar or familiar means. Providing basic security through the use of a negative
income tax (NIT) could afford beneficiaries basic security through the use of a familiar
mechanism. An NIT, using refundable tax credits, would guarantee tax filers a minimum
income.24 Individuals with taxable income receive a benefit that is equal to the difference
between the tax credit and their tax liabilities. Filers with no income receive the full benefit in
cash, similar to a UBI. At the breakeven level, an individual’s tax liabilities are exactly equal to
the credit; no benefit is received, but no net taxes are paid. Individuals with an income exceeding
the credit would pay taxes, as the NIT credit is less than the amount of taxes owed. While an NIT
and UBI are capable of achieving the same levels of wealth redistribution, there are several
important dimensions along which an NIT varies from a UBI.25 These include the dispersal of
22 John Kay, The basics of basic income, (Intereconomics, 2017), 71 23 De Wispelaere & Stirton, The many faces of universal basic income, 271 24 Philip L. Harvey, The relative cost of a universal basic income and a negative income tax, (Basic Income Studies, 2006), 2 25 Ibid., 4

7
benefits only to those who file for taxes, as well as the distribution of benefits in the form of tax
credits as opposed to cash.
Having discussed what a UBI is and is not, the question arises: why does UBI warrant
study? UBI, after all, would be a drastic, potentially expensive, departure from traditional social
policy. But the adversarial policy approach – dismissing UBI purely because of its dissimilarities
with the traditional policy approach – does not provide a useful framework for decision
making.26 Analyzing and considering radical policy changes may be worthwhile in the face of
long-term risks associated with the continuation of the status quo.27 Refusing to modify the status
quo in the face of social, political, and economic pressure increases polarization and threatens
feelings of social solidarity, especially with younger generations.28
Effect on Combatting Automation The economic disruption resulting from automation is commonly cited as a reason to
institute a UBI. It is well established that automation, globalization, and other large-scale
economic shifts devalue and eventually eliminate established skills.29 And while opponents claim
that automation is not a new phenomenon, automation in the future has the potential to be more
disruptive than previous automation for two reasons. First, if technology advances at its current
pace and is adopted quickly, workers could be displaced at a faster rate than in past economic
shifts. Second, if many firms in different sectors adopt automation at the same time, the portion
of the workforce affected by automation could be higher than in the past. Put simply, 21st century
26 De Wispelaere & Stirton, The many faces of universal basic income, 272 27 Thomas Straubhaar, On the economics of a universal basic income, (Intereconomics, 2017), 80 28 Ibid., 80 29 Ugo Colombino, Basic income policies: theory and empirical evidence, (Focus, 2017), 21
8
automation could displace more workers at a faster rate than previous incidences of large-scale
automation and economic transition.30
Automation will play a large role in shaping the future of labor in developed countries
like the United States, where almost 25% (mid-point projection) to 45% (rapid adoption) of
current work could be automated by 2030.31 39% of all jobs in the United States will be lost or
destroyed while about 30% of those will be recovered through occupational switching and
demand from new industries. This means that 9% of all jobs will be lost (mid-point) while labor
markets will grow by about 15% due to new workers. Between 39 million (mid-point) and 73
million (rapid adoption) workers will be displaced, and between 13-16 million (mid-point) and
48-54 million (rapid adoption) workers will need to change occupations. Up to one-third of the
workforce may need to be retrained by 2030. A wide range of jobs in predictable environments
will be affected, including office support positions, assembly line positions, agricultural
positions, and some customer service positions. Less affected will be jobs that involve human
management, social interaction, and expertise.32
In the automated future, any available work will likely require more education and
different skills. Jobs that require only secondary education will be harmed by automation and
jobs that require at least a college education will benefit.33 Future jobs will require more social
skills, advanced cognitive and logical abilities, and creativity.34 The task, then, will be to take
individuals employed in predictable industries and give them the skills they need to succeed, like
30 James Manyika et. al, Jobs lost, jobs gained: Workforce transitions in a time of automation, (McKinsey Global Institute, 2017), vi 31 Ibid., 29 32 Ibid., 6 33 Ibid., 15 34 Ibid., 15
9
critical thinking and creativity. This will be a daunting task, as the performance of predictable,
monotonous tasks does not traditionally facilitate the development of critical thinking abilities or
creativity. Because any adjustment will likely be painful for workers, income support must be
provided to displaced workers to maintain their quality of life.35 Income support may also help
workers to get educated, re-train, or take other actions to foster labor market re-entry.36
Assisting such a large volume of displaced workers with re-training and re-entry will be a
challenge for which there are few successful examples.37 Labor markets will need to be more
fluid to adequately accommodate rapid changes, but labor markets in advanced economies,
particularly the United States, have become more rigid since the 1980s.38 Rigidities and
imperfections in labor markets will impede the workers’ transitions to new jobs, fueling rising
unemployment and falling wages. Because strong aggregate demand is essential to the new job
creation accounted for in the mid-point and rapid adoption scenarios, displaced workers must
have the means to maintain a decent standard of living, and therefore a decent standard of
consumption.39 Some of the benefits from automation, therefore, should be redistributed to
compensate displaced workers. A UBI would be an adequate way to compensate displaced
workers, giving them the means to maintain a decent standard of living and pursue labor market
re-entry.40
35 Hoynes & Rothstein, Universal Basic Income in the US and Advanced Countries, 3 36 Ibid., 16 37 Manyika et. al, Jobs lost, jobs gained, 124 38 Ibid., 114 39 Ibid., 4 40 Colombino, Basic income policies, 21

10
Effect on Inequality and Democracy If automation is not accompanied by a just redistribution of income, automation will
drive up already-worsening economic inequality. Both income and wealth inequality are on the
rise in the United States and other Western nations.41 In OECD countries, the richest decile make
nine times the income of the poorest decile, the highest level in 50 years.42 In the United States,
the pre-tax income of the bottom 50% of earners grew by 1% between 1980 and 2014 while
incomes in the 50-90th percentiles grew by 42% and incomes in the top decile grew by 121%.43
Indeed, since 1980, most developed economies have seen a higher share of income being
captured by capital as opposed to labor, due in large part to automation and technical change.44
21st century automation could increase the pace of already-growing economic inequality, and
there is already evidence that the benefits of automation are not being equitably distributed.4546
Without a significant policy intervention, the current trend of increasing economic
inequality will not be reversed. Most future job growth in the U.S. will be in jobs that are already
high-paying: the lowest-paying 30% of jobs will lose about 2% of wages, the 30-70th percentiles
will see wages depressed by 12%, and the highest-paying jobs will see incomes grow by 10%.47
These projections are averages of mid-point scenario outcomes, and rapid or widespread
adoption will further exacerbate this inequity. The demand for unskilled or uneducated labor will
decrease while the demand for educated and skilled workers will increase, threatening a
41 Nat O’Connor, Three Connections between Rising Economic Inequality and the Rise of Populism, (Irish Studies in International Affairs, 2017), 29 42 Elise Klein, Economic Rights and a Universal Basic Income, (Griffith Journal of Law & Human Dignity, 2018), 107 43 Hoynes & Rothstein, Universal Basic Income in the US and Advanced Countries, 4 44 Manyika et. al, Jobs lost, jobs gained, 17 45 Michael Dickson, Living with Robots: Automation and Income Inequality in the 21st Century, (2017), 7 46 Ugo Colombino, Is unconditional basic income a viable alternative to other social welfare measures?, (IZA World of Labor, 2019), 2 47 Manyika et. al, Jobs lost, jobs gained, 103
11
vulnerable section of the workforce.48 A UBI, because it would transfer income from the owners
of capital to laborers (and the non-working who do not own capital), would combat the economic
inequality amplified by automation.49 This would allow non-capital owners to maintain a decent
standard of living. Without a UBI, society will continue to be plagued by the harms of economic
inequality.
Economic inequality has psychological, social, economic, and political
consequences.50515253 Income inequality results in lower levels of life satisfaction, lower self-
esteem, more emotional distress, and risky coping behaviors for those on the unfavorable end of
the income distribution.5455 Income inequality at the national level is associated with a collapse
of trust, cohesion, and cooperation due to a perceived sense of unfairness and pervasive
competition for social status.5657 Cooperation and trust are critical to both individual well-being
and societal functions.58 A lack of cooperation also causes political efforts supporting vulnerable
populations to fall apart, reinforcing the psychological consequences of inequality.59 Further,
income inequality tends to reduce life expectancy for both women and men.60 In societies with
48 Manyika et. al, Jobs lost, jobs gained, 103 49 Hoynes & Rothstein, Universal Basic Income in the US and Advanced Countries, 4 50 Felix Cheung & Richard E. Lucas, Income inequality is associated with stronger social comparison effects: the effect of relative income on life satisfaction, (Journal of personality and social psychology, 2016), 5-6 51 Richard H. McAdams, Economic Costs of Inequality: The Role of Race in Law, Markets, and Social Structures, (2007), 4 52 Markus Brueckner & Daniel Lederman, Effects of income inequality on aggregate output, (The World Bank, 2015), 2 53 Terrence D. Hill & Andrew Jorgenson, Bring out your dead!: A study of income inequality and life expectancy in the United States, 2000-2010, (Health & Place, 2018), 2 54 Cheung & Lucas, Income inequality is associated with stronger social comparison effects, 4 55 Hill & Jorgenson, Bring out your dead!, 2 56 Cheung & Lucas, Income inequality is associated with stronger social comparison effects, 4 57 Hill & Jorgenson, Bring out your dead!, 3 58 Kela, Basic income recipients experienced less financial insecurity, (Kansanelakelaitos – The Social Insurance Institution of Finalnd, 2019) 59 Hill & Jorgenson, Bring out your dead!, 3 60 Ibid., 5
12
high levels of income inequality, the social effects of inequality may negate any benefits of
economic growth to disadvantaged groups: while they will receive a small gain to their absolute
income, the amplification of social effects may negate, or even outweigh, the effects of income
growth.61 Income inequality, especially when coupled with unemployment, increases crime and
other social unrest, which depresses economic productivity.6263 Inequality, then, is increasing
and, especially when coupled with unemployment, is associated with a host of personal and
social harms.
There is reason to believe that a universal basic income could mitigate the social harms of
income inequality. Because a UBI would be a large-scale redistribution of wealth, it is likely to
reduce income inequality. Preliminary evidence from a UBI pilot in Finland also shows that
receiving a basic income transfer caused beneficiaries to have more trust in other people (+8%)
as well as institutions, including politicians (+12%), political parties, the police (+4.5%), and
courts (+4.5%).6465 So not only would UBI reduce the level of income inequality, it could also
mitigate the negative social effects of the remaining inequality.
Income inequality also has troubling economic and political implications. Examining 104
countries between 1970 and 2010, Brueckner & Lederman (2015) find that income inequality has
a substantial negative effect on GDP per capita growth and long-run GDP per capita.66
Inequality also increases corruption: if there were no differences in individual wealth, no
politician would have an incentive to “be bought” buy any one person.67 The concentration of
61 Cheung & Lucas, Income inequality is associated with stronger social comparison effects, 12 62 McAdams, Economic Costs of Inequality, 4-12 63 Dickson, Living with Robots, 4 64 Kela, Basic income recipients experienced less financial insecurity 65 Trust was measured on a scale of 1-10 via a survey of both recipients and a control group. 66 Brueckner & Lederman, Effects of income inequality on aggregate output, 15 67 McAdams, Economic Costs of Inequality, 13

13
wealth and the ability to effectively exercise political power causes governments to turn their
backs on the interests of the non-elites by taking one or more of the following actions: cutting
progressive taxes, deregulating industries, eliminating environmental regulations, limiting or
reducing the amount of public resources that are dedicated to social services like education and
healthcare.68 These actions reinforce existing income inequality, fueling more corruption.
Societies, then, can be trapped in a cycle where income inequality causes corruption which, in
turn, creates more income inequality.69 Corruption also tends to reduce investment by members
of the non-elite, as the elites’ ability to exercise influence over the judiciary would lead a rational
individual to conclude that the elite will always prevail.70 The threat of redistribution and social
violence that accompany inequality also reduce the rate of return on all investments, chilling
total investment and slowing growth.71 Inequality also slows growth by limiting a population’s
access to education and other human capital, which tends to reinforce existing economic
inequality.72 Growth is critical to democratic societies because it promotes pluralism, diversity,
dissent, and commitment to democratic principles.73
Economic inequality can have significant negative effects on democracy and political and
economic freedom. Inequality is the primary factor in determining political instability, as
populist rhetoric commonly addresses the economic decline or uncertainty that restricts
68 Hill & Jorgenson, Bring out your dead!, 4 69 McAdams, Economic Costs of Inequality, 16-17 70 Ibid., 19 71 Ibid., 19 72 Ibid., 20 73 Ibid., 22
14
economic freedom.747576 Indeed, large changes in income or standards of living resulting from
economic shocks can create strong political reactions.77 Economic shocks that reinforce income
inequality – like automation – can jeopardize long-run growth.78 Reducing economic growth
increases the support for extreme political platforms, which historically tend to oppress or
marginalize minority groups.79 Women in particular have an acute stake in supporting
democratic systems, as restrictive authoritarian governments are generally hostile towards
women’s rights and gender equality.80
A UBI could improve economic growth by increasing aggregate demand, separate paid
work from survival, and strengthen democracy. Along with a just distribution of wealth, a UBI
would aid in achieving a just distribution of time and opportunity, allowing for more complete
freedom. This would ensure that, while people have access to basic necessities like food,
healthcare, and social services, they would also have the time to educate themselves and engage
in politics.81 In this sense, the freedom provided by a universal basic income is essential to
enabling democratic participation and protecting democratic principles. By supporting political
stability and promoting democratic participation, a UBI could strengthen the American
democracy.
74 Mark J. Roe & Jordan I. Siegel, Political instability: Effects on financial development, roots in the severity of economic inequality, (Journal of Comparative Economics, 2011), 6 75 O’Connor, Three Connections between Rising Economic Inequality and the Rise of Populism, 29 76 Tim Krieger & Daniel Meierrieks, Political capitalism: The interaction between income inequality, economic freedom and democracy, (European Journal of Political Economy, 2016), 21 77 Robert Grafstein, The Political Economy of Extremism and Moderation, (7th general conference of the European consortium for political research, Bordeaux, 2013), 34-35 78 Krieger & Meierrieks, Political capitalism, 21 79 Markus Brueckner & Hans Peter Gruner, Economic growth and the rise of political extremism: theory and evidence, (2010), 2 80 Patricia Schulz, Universal basic income in a feminist perspective and gender analysis, (Global social policy, 2017), 90 81 Klein, Economic Rights and a Universal Basic Income, 107

15
Effect on Poverty Along with income inequality, a universal basic income could significantly reduce
poverty. Before analyzing the potential of a UBI to reduce poverty, poverty must be defined.
There are two ways to define poverty: absolutely and relatively.82 Absolute poverty is defined as
a lack of resources to meet basic needs, while relative poverty is defined as possessing a level of
resources that, while possibly enough to meet basic needs, is less than a certain proportion of
resources possessed by others. Absolute poverty is measured by the poverty line, while relative
poverty has fewer concrete measures. An individual experiences relative poverty when they feel
less prosperous than those around them. For example, a single woman who makes $55,000 per
year is not impoverished in absolute terms. But, if she lives in a neighborhood or locality where
the average annual income is over $100,000, she may experience relative poverty by feeling
impoverished compared to her neighbors. Both absolute and relative poverty have negative
effects.
Absolute poverty has tangible effects in the United States. According to the U.S.
Department of Housing and Urban Development, more than 500,000 people are homeless on any
given night, more than 30% of which are unsheltered.83 More than 75,000 of these individuals
are chronically homeless, which HUD defines as an individual with a disability who has been
continuously homeless for at least 1 year or has experienced four or more episodes of
homelessness in the last 3 years that add up to at least 12 months.84 Poverty is associated with
less human capital accumulation, meaning that the impoverished have fewer time and resources
82 Karl Widerquist and Michael A. Lewis, An efficiency argument for the Basic Income Guarantee, (International Journal of Environment, Workplace and Employment, 2006), 2 83 U.S. Department of Housing and Urban Development (USHUD) Office of Community Planning and Development, The 2016 Annual Homeless Assessment Report (AHAR) to Congress, (USHUD, 2016), 1 84 Ibid., 1-2

16
to dedicate to acquiring new knowledge or skills.85 Because human capital is a driver of
economic growth, areas with higher poverty rates experience slower per capita growth on
average, ceteris paribus.86 Child poverty in the United States is particularly costly, with costs
totaling more than $1 trillion per year, or 5.4% of GDP in 2015.87 These costs are clustered
around the loss of economic productivity, increased healthcare costs, and costs stemming from
the maltreatment of homeless children.88 But, while reducing poverty may seem expensive, it is
more costly to allow poverty to persist. Estimates show that, for every dollar spent on reducing
child poverty, the U.S. could save at least seven dollars by reducing the economic costs of
poverty.89 Even disregarding the moral imperative to reduce poverty in a nation with more than
adequate means to do so, it is in the best interest of the U.S. economy to dedicate resources to
poverty reduction.
While it is clear that resources ought to be dedicated to reducing poverty, poverty
reduction strategies must be reevaluated. Traditional poverty relief programs have suffered from
significant drawbacks, including complexity, stigma, and poverty traps, that prevent the
programs from reaching their maximum effectiveness. The American approach to social policy,
as is the case with many developed nations with social safety nets, is comprised of a number of
targeted band-aid solutions that were created for problems as they arose.90 Taken together, these
policies depict an opaque, complicated, and makeshift system that is difficult for beneficiaries to
85 U.S. Government Accountability Office (GAO), Poverty in America: consequences for Individuals and the Economy, (Testimony before the Chariman, Committee on Ways and Means, House of Representatives, 2007) 86 Ibid. 87 Michael McLaughlin & Mark R. Rank, Estimating the economic cost of childhood poverty in the United States, (Social Work Research, 2018), 14 88 Ibid., 2 89 McLaughlin & Rank, Estimating the economic cost of childhood poverty in the United States, 19 90 Noah Zon, Would a universal basic income reduce poverty?, (Maytree Foundation, 2016), 10
17
navigate.91 Universal basic income has the potential to replace an arbitrary, bureaucratic system
with one that respects individuals’ dignity and agency. UBI could also cover the gaps in social
coverage that have arisen as a result of piecemeal policymaking while also responding to new
social safety gaps resulting from social and economic transitions.92
In addition to complexity, traditional poverty relief programs and their recipients are
dogged by stigma. Participating in means-tested and eligibility-restricted social programs de
facto reveals what many people consider to be sensitive, personal information, making
participants feel stigmatized.93 Even the least intrusive, least demeaning procedures for means-
tested programs suffer from stigma.94 Stigma reduces the rate at which eligible individuals utilize
services, decreasing the reach and impact of social programs.9596 A universal basic income,
because of its universality, would not suffer from such a problem; there is no stigma in receiving
a universal benefit.979899 Instead, a UBI could detangle the web of costly and demeaning factors
of low-income life, allowing individuals to make freer decisions.100 Removing humiliation and
stigma from low-income life may be perceived as a benefit in and of itself to those in poverty.101
This possibility has been confirmed by pilot results from India, Namibia, and Uganda, where
UBI-like transfers increased recipients’ sense of autonomy and responsibility while avoiding
stigmatization.102
91 Zon, Would a universal basic income reduce poverty?, 10 92 Ibid., 10 93 Hoynes & Rothstein, Universal Basic Income in the US and Advanced Countries, 17 94 Van Parijs, Basic Income, 9 95 Hoynes & Rothstein, Universal Basic Income in the US and Advanced Countries, 17 96 Van Parijs, Basic Income, 9 97 Colombino, Basic income policies, 16 98 Hoynes & Rothstein, Universal Basic Income in the US and Advanced Countries, 17 99 Van Parijs, Basic Income, 9 100 Hoynes & Rothstein, Universal Basic Income in the US and Advanced Countries, 5 101 Van Parijs, Basic Income, 9 102 Colombino, Is unconditional basic income a viable alternative to other social welfare measures?, 4

18
One of the biggest critiques of social programs put forward by economists is the ‘poverty
trap’ (‘welfare trap,’ ‘unemployment trap’). The poverty trap results when benefit phaseouts, in
combination with the marginal taxes on new earned income, result in the lack of substantive
monetary gains when beneficiaries pursue low-wage paid work as opposed to no work.103 Put
another way, the poverty trap results when benefit phaseouts incentivize program beneficiaries
not to work. Because working would require significant effort and adjustment without much (if
any) financial gain, beneficiaries are incentivized to abstain from paid work in order to maximize
their well-being. With a universal basic income, however, benefit payments are neither
interrupted nor reduced when accepting a job.104 Some authors argue that the imposition of a flat
tax on income would be necessary to eliminate the poverty trap.105 This, however, is untrue. The
poverty trap, by definition, is eliminated when basic security no longer depends on means-tested
programs. Because basic security is not threatened by taking on paid work under a UBI scheme,
work is not disincentivized. Even under a progressive tax system, there is no poverty trap
because there is no benefit phaseout. A universal basic income, even funded by a progressive tax
scheme, would not suffer from poverty traps.106
A universal basic income has incredible potential to reduce poverty more effectively than
traditional, in-kind, means-tested programs. While a smaller proportion of funds would go to
lower-income individuals than under the current system, a UBI would increase the absolute
amount of transfer payments, creating what could be a very large downward redistribution of
wealth.107 If a UBI comes entirely at the expense of existing programs, however, those in poverty
103 Van Parijs, Basic Income, 9-10 104 Ibid., 10 105 Harvey, The relative cost of a universal basic income and a negative income tax, 6 106 Colombino, Basic income policies, 16 107 Hoynes & Rothstein, Universal Basic Income in the US and Advanced Countries, 14
19
could be worse-off than they were before.108 It is important, then, when implementing a universal
basic income, to carefully target which social programs, if any, can be subsumed by the universal
basic income.
Trials in the developing world have revealed a strong positive effect of unconditional
cash transfers on low-income recipients.109 Even modest transfers have measurably improved
recipients’ standard of living.110 A pilot program in Namibia reduced food poverty by 60
percentage points, or almost 80%, benefitting both children and adults alike.111 In India,
unconditional transfers improved food security and reduced malnutrition, improving health
outcomes as a result.112 This is true in the developed world as well. Preliminary results from
Finland’s UBI trial revealed that recipients experienced less stress, fewer financial worries, and
described their financial situation more positively than non-recipients.113 Even UBI recipients
who did experience financial difficulties reported less stress than non-recipients. UBI recipients
also reported living more comfortably, coping better with life’s troubles, and were less likely to
find life difficult or very difficult.114 Unconditional cash transfers of even a modest amount can
contribute to long-term poverty reduction.115
A universal basic income could also be flexible enough to address a variety of needs that
the program wasn’t necessarily intended to address.116 The secondary benefits of UBI could be
108 Zon, Would a universal basic income reduce poverty?, 14 109 Ibid., 14 110 Ibid., 14 111 Dickson, Living with Robots, 15 112 Ibid., 17 113 Kela, Basic income recipients experienced less financial insecurity 114 Ibid. 115 Sudhanshu Handa et al., Can unconditional cash transfers lead to sustainable poverty reduction? Evidence from two government-led programmes in Zambia, (UNICF Office of Research, Florence, 2016), 10 116 Zon, Would a universal basic income reduce poverty?, 16
20
expansive, including but not limited to: greater school attendance, less food insecurity, less
economic crime, increased participation in communities, and improving health outcomes.117
Experimental results from Manitoba, Namibia, and Finland have confirmed that a UBI may have
numerous unintended secondary benefits.118119 Cash transfers given to low-income families
support basic needs and investments for children, including education.120 Further, there is
political value in the universality of UBI. Universal programs, like social security and Medicare,
are a signal of inclusion and social acceptance. Along these lines, a universal basic income could
be a way of expressing that all members of a society are valued and deserve basic economic
security, potentially increasing the political viability of the program.121
A publicized waste of transfer payments would be guaranteed to eliminate social and
political support for UBI. There could be no faster way for the program to become unpopular
than people “blowing their grants on cocaine or wild holidays.”122 But evidence from pilot
programs suggests that people do not waste their transfer. Quite the opposite: when you give
money to people who need it, no strings attached, it gets used well.123 In Namibia, citizens
prevented transfers from being wasted on alcohol. Entirely free of direction or guidance, the
Namibians self-organized and created a council that convinced alcohol sellers to close their
stores on the day that transfer benefits were received.124 Continual unconditional payments also
do not foster dependency. Again in Namibia, most of the transfer payment was spent on assets
117 Dickson, Living with Robots, 23 118 Ibid., 13-16 119 Kela, Basic income recipients experienced less financial insecurity 120 Zon, Would a universal basic income reduce poverty?, 14 121 Hoynes & Rothstein, Universal Basic Income in the US and Advanced Countries, 17 122 Jurgen De Wispelaere & José Antonio Noguera, On the political feasibility of universal basic income: An analytic framework, (Basic Income Guarantee and Politics, Palgrave Macmillan, New York, 2012), 31 123 Zon, Would a universal basic income reduce poverty?, 14 124 Dickson, Living with Robots, 18
21
that improved economic creativity, increasing households’ ability to earn, improving their
quality of life.125 In Kenya, researchers concluded that cash transfers have positive, sustained
effects, and the benefits are not “consumed away.”126 Exactly the opposite: by allowing
households to meet their needs, accumulate assets, and eventually diversify their livelihoods,
they can make a positive contribution to sustainable economic growth.127128
Effect on Health & Development Closely related to a UBI’s impact on poverty is its impact on health and development. A
UBI could help to reduce health inequities, defined by the World Trade Organization (WTO) as
avoidable inequalities in health outcomes, that have resulted in the wake of the 2008 financial
crisis.129 Income and income security are the most important social determinants of health,
meaning that a lack of or insecure income can have negative effects on health outcomes.130 By
increasing income security, a UBI could have positive long-run effects on health and
development, particularly for children.131 This theoretical possibility has been bolstered by data
from pilot projects. An NIT pilot in the United States found that receiving transfers improved
housing and health conditions.132 Unconditional transfers in Alaska and Manitoba have led to
improved birth outcomes.133134 Results from a Kenyan experiment showed that unconditional
transfers increased happiness, life satisfaction, and reduced stress, depression, and instances of
125Dickson, Living with Robots, 16 126 Johannes Haushofer & Jeremy Shapiro, The long-term impact of unconditional cash transfers: Experimental evidence from Kenya, (Busara Center for Behavioral Economics, Nairobi, Kenya, 2018), 3 127 Ibid., 30 128 Handa et al., Can unconditional cash transfers lead to sustainable poverty reduction?, 30 129 Arne Ruckert, Chau Huynh, & Ronald Labonté, Reducing health inequities: is universal basic income the way forward?, (Journal of Public Health, 2017), 3 130 Ibid., 3 131 Hoynes & Rothstein, Universal Basic Income in the US and Advanced Countries, 18 132 Ruckert, Huynh, & Labonté, Reducing health inequities, 3 133 Ibid., 3 134 Zon, Would a universal basic income reduce poverty?, 14
22
domestic violence.135 Pilot results from Manitoba and India found a notable reduction in
healthcare utilization and occurrences of common illnesses, respectively.136 Because low-income
individuals utilize a disproportionate amount of healthcare services in comparison to their high-
income counterparts, reducing healthcare utilization could create serious economic savings.137
In addition to improving health outcomes, a UBI could have positive effects for long-
term child development. Early development is critical for children: the early stages of
development influence children physically and behaviorally, affecting health and employment
outcomes later in life.138139 Increasing parents’ income can lead to improved school attendance
and better grades for children, which may translate into greater self-investments in human capital
and higher wages.140141 Indeed, a number of studies have provided a positive link between an
unconditional basic income and literacy rates, dropout rates, and grades. In an Indian UBI pilot,
many beneficiaries spent their transfer on school supplies for their children, boosting school
enrollment by 12%.142 In a Namibian pilot, 90% of the local school’s fees were paid in full,
which was described as an “unprecedented achievement” for the school.143 These effects hold
true for the developed world as well: pilot results from Manitoba, Canada revealed dramatic
increases in high school attendance while families were receiving unconditional transfers.144
Boosting school attendance and educational achievement improves health outcomes because
achieving higher levels of education leads to a healthier lifestyle and a lengthened life
135 Haushofer & Shapiro, The long-term impact of unconditional cash transfers, 2 136 Ruckert, Huynh, & Labonté, Reducing health inequities, 4 137 Ibid., 4 138 Hoynes & Rothstein, Universal Basic Income in the US and Advanced Countries, 16 139 Ruckert, Huynh, & Labonté, Reducing health inequities, 3 140 Ibid., 3 141 Hoynes & Rothstein, Universal Basic Income in the US and Advanced Countries, 16 142 Ruckert, Huynh, & Labonté, Reducing health inequities, 4 143 Ibid., 4 144 Dickson, Living with Robots, 15

23
expectancy.145A UBI, then, may have multigenerational effects that last for decades after the
transfer program is initially implemented. These effects, because they would not be immediately
revealed, will likely not be captured by pilot experiments. While their magnitude remains
unknown, the potential multigenerational effects of a universal basic income warrant
consideration.
Cost The most pervasive criticism of a universal basic income is the cost. The cost of a UBI
could vary widely among different proposals depending on policies’ benefit levels, funding
mechanisms and exclusions, as well as the programs that the UBI would replace.146 Some cost
estimates from developed UBI policy proposals with a benefit at the poverty level range from
$2-3 trillion.147148 This, obviously, would require a significant increase in government revenue
collections and spending. But before discussing possible UBI funding mechanisms, there are
several ways that the total cost of a UBI can be reduced. First, a full UBI would make obsolete
some federal programs like TANF and SNAP.149 Additionally, the universal basic income could
become a more targeted basic income: exclusions can be made for age or family income.
Excluding people from eligibility could reduce the cost of a UBI by 20% (although the program
would no longer be considered universal).150 Similarly, reducing the benefit to children 16 years
or younger by 50% could reduce the cost of a UBI by another 10-20%.151 Removing obsolete
programs will also bring cost savings, although to what extent is unknown. Excluding wealthy
145 Hoynes & Rothstein, Universal Basic Income in the US and Advanced Countries, 21 146 Zon, Would a universal basic income reduce poverty?, 14 147 Harvey, The relative cost of a universal basic income and a negative income tax, 6 148 Hoynes & Rothstein, Universal Basic Income in the US and Advanced Countries, 6 149 Ibid., 14 150 Ibid., 6 151 Kay, The basics of basic income, 72
24
households from transfers by creating an income requirement could significantly reduce the cost
of a UBI, as the cost of transferring cash to net-contributing families accounts for a notable
amount of the cost of a UBI.152 Eliminating existing transfer programs and creating eligibility
requirements, however, may have consequences that ultimately reduce the effectiveness of a
universal basic income-like policy.
While the absolute cost of a UBI may be daunting, there are a litany of funding
mechanisms available to policymakers that, together, are more than capable of raising the
required amount of revenue. New government programs can be funded by using new or existing
revenue. Programs funded by existing revenue do not require new taxes. Instead, existing funds
are reallocated to fund the new program. Programs funded with new revenue require new or
raised taxes. A UBI cannot be fully funded by existing revenue, but there is no reason that a UBI
can’t be partially funded by reallocating existing revenue. For example, the cost of a UBI could
be reduced by eliminating now-obsolete programs and reducing defense spending. A UBI could
also be partially funded by increasing appropriations to the Internal Revenue Service (IRS).
Increasing the IRS’s resources would improve compliance with tax laws, raising tax collections
without raising tax rates.153 Expanding enforcement options for the IRS would be an effective
way to reduce noncompliance and increase revenue collections without changing tax rates.154
There are also a number of changes in the tax code that could be made to fund a UBI.
Many UBI proposals propose adopting a flat tax rate. But, due to the effects of income
inequality, it may be desirable to fund a UBI through progressive taxation.155 Progressive
152 Zon, Would a universal basic income reduce poverty?, 19 153 U.S. Congressional Budget Office (CBO), Increase Appropriations for the Internal Revenue Service’s Enforcement Initiatives, (Options for Reducing the Deficit: 2019 to 2028, 2018) 154 Ibid. 155 Hoynes & Rothstein, Universal Basic Income in the US and Advanced Countries, 11
25
taxation would raise the breakeven point (the point where taxes owed is exactly equal to the
UBI) by raising taxes on higher-income earners. Raising the tax rate on corporate earnings and
incomes over $1 million could raise a significant amount of revenue. A wealth tax is another
option. Other authors have discussed a land or resource tax.156 Comparable to the Alaska
Permanent Fund, a dividend from all non-green energy production in the U.S. could be used to
fund a UBI. Alternatively, a tax on carbon emissions could be used to fund the UBI while
making marginal progress in the fight against irreversible climate change. Some have suggested
that a UBI, because it is a dividend on socially created wealth, be funded by the return on
publicly owned assets.157 Alternatively, a UBI could be funded by a tax on privately-owned
wealth created at the expense of larger society, like a tax on automation. Other modern tax
options include a value-added tax (VAT), taxes on speculative capital investment (Tobin taxes),
or taxes on transfers of information (bit taxes). One proposal raises nearly $2 trillion in new
revenue by using a combination of sources: eliminating some tax exemptions, eliminating
programs deemed by the proposal’s author to be made obsolete by the UBI, reducing defense
spending, reverting the tax code to the code in 1994 while adding a 20% “surcharge” to incomes
over $1 million, and extending the payroll tax to all earned income.158 While the cost of a UBI
may be large, it is clear that policymakers have the means to properly fund an adequate UBI.
Effect on Work The second primary obstacle to the institution of a universal basic income is the
perception that masses of people will exit the labor market to live on their UBI (known as free-
156 Van Parijs, Basic Income, 6 157 Ibid., 6 158 Dickson, Living with Robots, 9-10

26
riding or surfing), creating an immediate and total societal collapse. After outlining the argument
against surfing, it will be demonstrated that this concern is overblown and lacks moral authority.
Some of the biggest behavioral questions surrounding UBI involve work incentives and
labor market participation.159 Economic theory would predict that, because a UBI must be
funded with taxes, higher marginal tax rates would cause individuals to work less. Individuals
would have an incentive not to work because the monetary gain they would receive from
working an additional hour would be reduced.160 Some evidence has shown that a 10% increase
in unearned income will reduce earned income anywhere from 0.5% to 1%.161162 An analysis of
Alaska Permanent Fund transfer recipients found that part-time employment increased by 17%,
and there was no effect on overall employment.163 In the series of NIT experiments in the U.S.,
very few individuals exited the labor market after becoming eligible for the transfer.164 Those
who did leave the labor force were likely to be mothers or individuals who had been forced to
drop out of school because of financial difficulties.165 When given the ability to go back to
school to improve future outcomes, they chose to do so.
If there were a significant number of surfers who decided to drop out of the labor market,
a UBI may become economically infeasible due to the loss of necessary tax base.166 Even a small
number of surfers, opponents claim, may prove to be problematic, as the perception of surfing
will encourage others to surf, creating a snowball effect. Indeed, social factors have been
159 De Wispelaere & Noguera, On the political feasibility of universal basic income, 30 160 Colombino, Is unconditional basic income a viable alternative to other social welfare measures?, 7 161 Damon Jones & Ioana Marinescu, The labor market impacts of universal and permanent cash transfers: Evidence from the Alaska permanent fund, (National Bureau of Economic Research, 2018), 1 162 Hoynes & Rothstein, Universal Basic Income in the US and Advanced Countries, 19 163 Jones & Marinescu, The labor market impacts of universal and permanent cash transfers, 17 164 Ruckert, Huynh, & Labonté, Reducing health inequities, 5 165 Ibid., 5 166 De Wispelaere & Noguera, On the political feasibility of universal basic income, 30
27
revealed as a strong influencer of labor market decisions.167 While some microsimulations
suggest a UBI may have negative labor market effects, the question is far from answered.168169
Advances in behavioral economics have raised questions about the validity of the rational actor
(homo economicus) assumptions on which the negative labor market effects are based.170 The
traditional relationship between unearned income and work assumed by economic theory may
warrant question.
There are two primary reasons to question the assumption that unearned subsistence
would provide a significant disincentive to work. Not only does this assumption create an
unrealistic image of individuals’ aversion to work, it also ignores other incentives for businesses
and individuals.171 There are a number of reasons individuals might pursue paid work – income
is only one of a set of factors that determine labor market participation.172 Paid work can offer
social contact, rewarding activity, and social recognition or prestige in ways that cannot be
achieved without paid work.173174 Alternatively, people may choose to not pursue work not
because they are lazy, but because the available work does not provide these benefits.175
Therefore, higher marginal tax rates may have a lesser impact on individuals’ decisions to work
than working conditions and social factors.176
167 Ibid., 31 168 Colombino, Is unconditional basic income a viable alternative to other social welfare measures?, 8 169 De Wispelaere & Noguera, On the political feasibility of universal basic income, 31 170 Harvey, The relative cost of a universal basic income and a negative income tax, 16 171 Widerquist & Lewis, An efficiency argument for the Basic Income Guarantee, 25-26 172 Philippe Van Parijs, The universal basic income: Why utopian thinking matters, ad how sociologists can contribute to it, (Politics & Society, 2013), 177 173 Philippe Van Parijs, Why surfers should be fed: the liberal case for an unconditional basic income, (Philosophy & Public Affairs, 1991), 128 174 Van Parijs, The universal basic income, 177 175 Widerquist & Lewis, An efficiency argument for the Basic Income Guarantee, 14 176 Van Parijs, The universal basic income, 177

28
Often omitted from the conversation about unconditional income and work is the impact
of surfing on wages. If people were to drop out of the labor market en masse, employers would
raise wages to induce surfers back to work.177 Assuming that surfers can’t be enticed back into
the labor market is unrealistic: everyone has a price.178 Further, there is reason to believe that a
UBI would create incentives to enter work by removing the poverty trap.179 Additionally,
because workers with more human capital tend to work more and a UBI has been shown to
increase investments in human capital, a UBI may encourage recipients to enter the labor
market.180 A UBI, then, creates a disincentive to work in the fact that one’s ability to maintain
the bare minimum level of subsistence is not impacted by their decision to not pursue paid
work.181
A universal basic income could have a number of positive effects on the labor market and
economy by increasing entrepreneurship, human capital investments, and granting more
bargaining power to workers, all of which could encourage UBI recipients to pursue paid
work.182183184 A UBI could encourage entrepreneurial risk-taking by providing an income floor
that guarantees subsistence in the event of failure.185 A UBI, even if it is protected from creditors
(as it ought to be), will ease borrowing constraints, making it easier for beneficiaries to get loans
to pursue their entrepreneurial and educational goals.186187 This creates greater opportunities for
177 Widerquist & Lewis, An efficiency argument for the Basic Income Guarantee, 27 178 Ibid., 26 179 Ibid., 25 180 Hoynes & Rothstein, Universal Basic Income in the US and Advanced Countries, 16 181 Widerquist & Lewis, An efficiency argument for the Basic Income Guarantee, 25 182 Manyika et. al, Jobs lost, jobs gained, 121 183 Hoynes & Rothstein, Universal Basic Income in the US and Advanced Countries, 4 184 Van Parijs, The universal basic income, 178 185 Hoynes & Rothstein, Universal Basic Income in the US and Advanced Countries, 16 186 Van Parijs, Basic Income, 5 187 Hoynes & Rothstein, Universal Basic Income in the US and Advanced Countries, 16

29
UBI recipients.188 Pilot programs have revealed the impact of these incentives: most of the
unconditional transfer from a Ugandan program was used to acquire a new skill, raising their
incomes by 40%.189 A Namibian pilot found that unconditional cash transfers increased
economic creation activities by 25%.190 In India, unconditional transfers reduced household debt
and the use of predatory lenders. In addition to the financial and marketplace effects, this
allowed Indian transfer recipients to better access government programs for which they were
eligible even before receiving the transfer.191 The same idea holds true for switching jobs: UBI
encourages individuals to try out new ideas or train for new jobs.192193 A large number of UBI
recipients in experimental pilots have used their benefit to cover either new training or the costs
associated with changing jobs, like relocation.194 Further, because individuals with more human
capital tend to work more, the use of a UBI to improve human capital will naturally offset, to an
extent that is currently unknown, any potential reductions in labor supply.195 Ultimately, a
universal basic income gives individuals the financial ability, and possibly the motivation, to
invest in new skills or find new jobs, which eventually translates into higher wages.196197
The ability of laborers to more easily switch jobs or exit the labor market entirely will
improve the relative power of labor compared to capital. A guaranteed income floor would
provide the ability to leave a job without compromising basic security, giving low-wage workers
188 Colombino, Basic income policies, 16 189 Ibid., 38 190 Dickson, Living with Robots, 16 191 Ibid., 17-18 192 Klein, Economic Rights and a Universal Basic Income, 110 193 Hoynes & Rothstein, Universal Basic Income in the US and Advanced Countries, 16 194 Colombino, Is unconditional basic income a viable alternative to other social welfare measures?, 6 195 Hoynes & Rothstein, Universal Basic Income in the US and Advanced Countries, 16-17 196 Colombino, Is unconditional basic income a viable alternative to other social welfare measures?, 7 197 Hoynes & Rothstein, Universal Basic Income in the US and Advanced Countries, 16

30
the bargaining power to petition for higher wages.198 Bargaining power in the workplace and the
ability to take on non-market work will change employer-employee relations to benefit
workers.199200 Because employees will have more individual and collective power, employers
have greater incentives to acknowledge new and existing forms of workplace organization,
improving the quality of work.201202 This includes preventing the spread of “bullshit jobs”
(unskilled, unrewarding work) and, coupled with technical progress, could include eliminating
such unnecessary jobs altogether.203204205 Opponents of UBI may claim that the elimination of
low-skill, low-wage jobs will cause numerous goods and services to become unavailable.
Services, they may claim, become unavailable because workers are demanding wages that
prevent the good or service from being produced profitably. This argument, however, is morally
baseless. If goods and services can only be produced profitably by exploiting labor and paying
wages that do not supply a decent standard of living, the goods and services ought not exist;
consumption of goods and services produced via exploitation is unethical. If these goods and
services are essential to a functioning society but cannot be produced profitably, they ought to be
provided by the government. If the good or service truly provides social value, demand will be
substantive enough to support decent wages.
The ability to leave paid work without sacrificing security, however, may incentivize
individuals to take on work that isn’t valued by capitalist markets. There exists a litany of
198 Widerquist & Lewis, An efficiency argument for the Basic Income Guarantee, 14 199 Van Parijs, The universal basic income, 174 200 Erik Olin Wright, Two redistributive proposals – universal basic income and stakeholder grants, (Focus, 2006), 6 201 Ibid., 6 202 Van Parijs, The universal basic income, 174 203 Kay, The basics of basic income, 69 204 Van Parijs, Basic Income, 12 205 Wright, Two redistributive proposals, 6
31
valuable activities that people want to do but are badly organized by markets.206 A UBI could
enable individuals to engage in politics, take up fine arts, or perform other desirable but unvalued
activities. A UBI could also allow individuals to pursue paid work that better aligns with their
individual preferences. This gives workers more autonomy and leverage in the labor market,
reducing the class-based power imbalance inherent to capitalism.207 Indeed, capitalist concepts of
property and labor markets create persistent inequalities among groups that can be mitigated by
providing guaranteed subsistence.208 And while a UBI will not immediately rectify all grievances
against those marginalized by capitalism, it could contribute to institutional change, improving
long-term outcomes for workers.209
Closely related to this line of support is the feminist argument in favor of UBI. Women
have gained independence from their husbands only to become dependent on wage labor, which
often does not improve outcomes.210 Women, especially as heads of house, experience a notably
higher degree of poverty than men and are more stigmatized and marginalized than men, ceteris
paribus.211 In their working careers, women face disparities in pay, treatment, upward mobility,
and task diversity.212213214215 Outside of their working careers, women are responsible for a
206Wright, Two redistributive proposals, 6 207 Ibid., 6 208 Erik Olin Wright, Real utopian proposals for reducing income and wealth inequality, (Contemporary Sociology, 2000), 6 209 Ibid., 26-27 210 Erik Christensen, Feminist arguments in favor of welfare and basic income in Denmark, (Institut for Økonomi, Politik og Forvaltning, Aalborg Universitet, 2003), 24 211 Schulz, Universal basic income in a feminist perspective and gender analysis, 90 212 Ibid., 89 213 Wright, Real utopian proposals for reducing income and wealth inequality, 16 214 Rania Antonopoulos & Indira Hirway, Unpaid Work and the Economy: Linkages and Their Implications, (Levy Economics Institute, 2015), 5 215 Carol Pateman, Democratizing Citizenship: Some Advantages of a Basic Income, (POLITICS & SOCIETY, 2004), 98
32
majority of unpaid, but necessary, home and care work.216217218 While housework is continually
depicted as leisurely and enjoyable, those who perform care work describe it as a “labor of
sorrow and drudgery.”219 Unpaid care work places a regressive time-tax on women, reducing the
amount of time women can spend in the labor market or self-employment.220 Unpaid care work
also shapes the duration and type of paid work that women can pursue, remanding them to jobs
that are unskilled, have low pay, limited options for promotion, and few workplace
protections.221
Some feminists fear that a UBI would perpetuate the status quo, reinforcing existing
exploitative power structures and divisions of labor. Because of the power disparity in labor
market interactions and social attitudes towards “women’s work,” women may face pressure to
abandon the labor force to take on more home and care work.222223 Others argue that, when given
the option to pursue either paid or unpaid work, women simply tend to choose unpaid work.224 A
UBI, these critics say, would perpetuate gender norms by creating an incentive for women to
pursue “women’s work.” Other critics claim that a UBI would not be sufficient to enable female
labor market participation. Because care work is often discussed in a binary dichotomy (either
self-provide or purchase childcare), paid work is often discussed in a binary dichotomy (either
pursue paid work or perform care work). Real decisions of care, however, are not binary. Rather,
216Pateman, Democratizing Citizenship, 98 217 Antonopoulos & Hirway, Unpaid Work and the Economy, 1 218 Klein, Economic Rights and a Universal Basic Income, 110 219 Antonopoulos & Hirway, Unpaid Work and the Economy, 5 220 Ibid., 7 221 Ibid., 12 222 Pateman, Democratizing Citizenship, 100 223Anca Gheaus, Basic Income, Gender Justice, and the Costs of Gender-Symmetrical Lifestyles, (Basic Income Studies, 2008), 4-5 224 Ruckert, Huynh, & Labonté, Reducing health inequities, 5

33
choices exist on a spectrum and utilize a number of paid and unpaid networks.225 A UBI, these
critics argue, cannot account for the nuances of individual decisions of care.
Feminists who oppose UBI often do so because of a deeper contradiction in feminism
that can be explained by Wollstonecraft’s Dilemma. It goes as follows: feminism has worked, on
one hand, for a gender-neutral, equitable society. On the other hand, feminists have sought to
have their distinctions from men recognized.226 Feminism, then, is simultaneously seeking to
equate women with men while also differentiating women from men. UBI, however, can be a
solution, rather than a victim, to this dilemma. UBI can fulfill the desire for equality and
difference by creating a new kind of economic independence.227 Because benefits are distributed
to individuals and not households, wives’ benefits cannot be usurped by husbands, democratizing
citizenship and promoting self-government.228 Women, freed from coercive structures in the
home and workplace, will be free to pursue their ambitions as individuals. By effectively
providing a livable wage to care workers, a UBI would give each woman her own economic
freedom, breaking the link between income, employment, and survival and replacing it with a
link between citizenship, freedom, and the security to seek meaningful employment.229
Opponents of UBI claim there is a contradiction inherent in UBI proponents’ labor
arguments. If a UBI is intended to address labor issues like automation, then one might not be
concerned if individuals drop out of the labor market to pursue non-market work.230
Alternatively, critics claim, it is assumed in the funding mechanism of most proposals that
225 Jacqueline O’Reilly, Can a Basic Income Lead to a More Gender Equal Society?, (Basic Income Studies, 2008), 2 226 Christensen, Feminist arguments in favor of welfare and basic income in Denmark, 1-2 227 Ibid., 2-3 228 Pateman, Democratizing Citizenship, 101 229 Ibid., 97-98 230 Hoynes & Rothstein, Universal Basic Income in the US and Advanced Countries, 4-5
34
aggregate income would not decrease in the face of new taxes.231 This creates a conundrum: it
would be difficult for individuals to take on more non-market activities without exiting the labor
market, but increasing the prevalence of non-market activities (and therefore decreasing labor
market participation) would undermine the tax base that funds the UBI.232 But this argument
oversimplifies the complex effects of a multifaceted policy goal. Opponents wrongly assume that
the goal of a UBI is to make every person work more, less, or differently. Instead, the goal of a
UBI is to allow each person to more freely pursue their preferences. By aiming to create a new
kind of economic rights, a UBI avoids the contradiction claimed by opponents.
Research Questions & Hypotheses Panel and cross-sectional data collected from this experiment was analyzed using
multivariate OLS regressions to answer four questions: when controlling for education levels and
educational opportunities, do UBI recipients work less, and do they dedicate more time to leisure
activities? Do UBI recipients invest in education more often or at a faster rate than non-
recipients? Do UBI recipients dedicate more resources to savings or consumption, both year-to-
year and in total, than non-recipients? Does a UBI enable recipients to pursue productive
activities? That is, does a UBI have a multiplier effect? This author would hypothesize that UBI
recipients would work slightly less than non-recipients, dedicating more time to education (when
it is available) or leisure activities. UBI recipients are predicted to save more but consume at a
level comparable to non-recipients. Finally, this author would expect a UBI to have a multiplier
effect for subjects’ in-game scores. It should be noted, however, that the in-game multiplier
effect is not quite the same as the multiplier effect observed in real-world pilot projects. Instead
231 Harvey, The relative cost of a universal basic income and a negative income tax, 14 232 Ibid., 14

35
of through economic productivity, subjects would experience the multiplier effect if the UBI
enabled them to increase their education and pursue leisure activities. Although the real-world
and in-game multiplier effects are slightly different, observing the in-game multiplier effect can
be interpreted to mean that UBI recipients are making decisions that maximize their own well-
being.
Methods Subjects were assigned profiles with varying education levels (Appendix Table 1). After
reading the rules and mechanics of the game, subjects first chose how many hours to work in a
week (0-40). The hours spent working was multiplied by the subject’s wage and the number of
weeks in a year (52) to create an annual income. Any of the 40 hours not spent working became
leisure time, which could be used for either education or leisure activities. Subjects in the control
group only received income from working (and savings from past work) while subjects in the
treatment group received a $12,000 UBI in each of the ten rounds. Subjects’ income, UBI, and
savings were added to determine their total cash. Subjects then made decisions about
consumption. All subjects were required to spend exactly $11,500 on required consumption,
simulating money that must be spent on food, shelter, and other basic necessities in a year.
Subjects had the option to purchase any amount of additional consumption goods (“extra
goods”), with the upper limit being equal to their total cash. Subjects were not required to
purchase any extra goods. After making decisions about consumption, subjects faced the
possibility of a random event. Subjects rolled a ten-sided die and, if the ten-sided die landed on
anything but 1, subjects did not face a random event and moved on. But, if the ten-sided die
landed on 1, subjects rolled a six-sided die to determine the outcome of their random event.
Random events could involve a low positive payout, a medium-sized spending requirement, or a

36
large spending requirement and could involve either cash or extra goods (Appendix Table 2).
Random events were intended to simulate the costs that would accompany unexpected life
events. Any unmet spending requirement penalized subjects’ scores by three times the unmet
requirement.
After moving on from the random event, subjects had the opportunity to contribute to
education. The game contained three levels of education (no education, level one education, level
two education). Subjects began with either no education or level one education, meaning that all
subjects had the opportunity to achieve at least one higher level of education. The requirements
for obtaining level one and level two education were different: level one education necessitated
only 25 leisure hours while level two education required 40 leisure hours and $30,000 (Appendix
Table 3). Contributions to education could be spread over time so long as the contributions were
continuous and remained above a minimum amount. Achieving a higher level of education
earned subjects a wage increase in addition to points. Once a subject had achieved level two
education, they could not become more educated. At that point, subjects could only use leisure
time for leisure activities.
After determining contributions to education, any remaining leisure time was
automatically dedicated towards leisure activities. At that point, the “year” was considered to be
over. Subjects were able to view the points and penalties they earned in each round, their
cumulative score, and their cumulative cash savings. Subjects would repeat this process for 10
rounds. It is a common practice in experiments to have subjects make decisions over several
periods, as it allows researchers to collect more data over a shorter period of time.233 The
233 Gary Charness, Uri Gneezy, and Brianna Halladay, Experimental methods, pay one or pay all, (Journal of Economic Behavior & Organization, 2016), 141
37
collection of data from the same decisions made repeatedly over time also allows researchers to
discern causes for decision-making changes over time, including fixed individual effects and
learning.234
Different actions taken by subjects yielded different amount of in-game points (Appendix
Table 4). Subjects received one point for every dollar spent on mandatory consumption up to the
$11,500 requirement. Subjects could not spend any more than $11,500 on mandatory
consumption and, as such, could not receive more than 11,500 points from mandatory
consumption in any round. If the consumption requirement was not met, subjects’ scores were
penalized by three times the unsatisfied requirement. For example, if a subject only spent
$11,000 on mandatory consumption, their score would be penalized by 1500 points ($500 unmet
requirement * 3). Penalties for random events were scored in the same manner.
Subjects received 0.75 points for every dollar spent on extra goods. While extra
consumption was the lowest-scoring decision in terms of points per dollar, subjects were still
incentivized to purchase extra goods to offset potential penalties resulting from random events.
Any extra consumption past what it would take to satisfy the largest random penalty would be an
inefficient use of resources based on the in-game scoring criteria.
Subjects received 1.2 points for every dollar spent on education. Time contributed to
education was scored using the dollar value of leisure time which is equal to the amount the
subject would have earned if they had worked. For example, if a subject earned $1,000 for 10
hours of work, the dollar value of 10 hours of leisure time would be $1,000. The dollar value of
leisure time contributed to education is scored the same way as cash spent on education: subjects
234 Charness, Gneezy & Halladay, Experimental methods, pay one or pay all., 141

38
receive 1.2 points for every dollar value of leisure time spent on education. Education points
were not awarded until a new education level was obtained; students who do not finish their
education do not reap the benefits. Increasing their level of education raised subjects’ wages by
about 10%, simulating the personal gain that results from getting a real-world education.
Education was scored higher than consumption or savings to simulate the real-world societal
pressure to get an education.
Leisure activities were also scored using the dollar value of leisure time. Subjects
received 1.2 points for every dollar value of leisure time spent on leisure activities. Because
subjects’ wages increased with their education, leisure time became more valuable as subjects
increased their level of education. Subjects received 0.95 points for every dollar of savings, but
only after the completion of the final round. Leisure activities were scored higher than
consumption or savings to simulate the disutility of work. Subjects, to maximize their score,
would have rather spent all their time on leisure and none on work. But subjects were required to
spend some money on consumption and, if they were risk averse, spent additional money on
extra consumption. Subjects, therefore, faced competing incentives concerning work and leisure.
Subjects could determine a dominant strategy the information they were given. A subject
who recognized the dominant strategy would achieve level two education as fast as possible,
dedicating all time and discretionary resources to this objective. After obtaining level two
education, the subject would work as little as possible to maximize leisure activities while
continuing to pay the mandatory consumption requirement. For a subject in the treatment group,
this would entail not working at all. The dominant strategy assumes that there are no random
events so a subject pursuing this strategy would not purchase any extra consumption goods.
Risk-averse subjects could alter the dominant strategy and work to have enough extra goods and
39
savings to offset a potential random event. By utilizing this strategy, a subject would maximize
the resources dedicated to the highest point-earning decisions while minimizing the resources
dwindled on lower point-earning decisions.
After completing the experiment, subjects received compensation in the form of an
Amazon gift card, the amount of which varied depending on subjects’ in-game scores (Appendix
Table 5). While it is common for economic experiments to make use of financial incentives,
payouts are typically awarded in cash.235236 Cash payments are common for two reasons: cash is
universally valued and nonsatiable.237 Everyone values money (unlike grade-related payouts,
which would only hold value to certain students in certain classes) and more cash is always
better. Amazon gift cards make a suitable proxy for cash payouts in this scenario. Because
Amazon gift cards can be used to purchase a practically infinite number of goods (over 506
million in 2018238), it can be assumed that everyone values something that is sold on Amazon.
This means that Amazon gift cards can be considered to have universal value. Further, because
Amazon gift cards hold value in a manner comparable to cash, it can be assumed that Amazon
gift cards are also nonsatiable.
Economic experiments use financial incentives to determine the impact of incentives on
decision-making. A meta-analysis from Camerer and Hogarth (1999) found that financial
incentives have a significant effect on judgement and decision-making tasks.239 Further, Smith
and Walker (1993) found that decision-dependent payouts reduce the variance of decision-
235Charness, Gneezy, & Halladay, Experimental methods, pay one or pay all, 141 236 Rachel Croson, The method of experimental economics, (International Negotiation, 2005), 134 237 Ibid., 134 238 Tim Ranzetta, Question of the Day: Amazon is called the ‘Everything Store.’ How many products do they carry?, (Next Gen Personal Finance, 2018) 239 Croson, The method of experimental economics, 135
40
making around the predicted outcome.240 In other words, subjects follow incentives when it
determines their payout. Economic theory presupposes a complete understanding of the
relationship between an individual’s actions and their payoffs.241 This assumption is not
irrational in the context of this experiment: each subject was given material detailing the
requirements of the game, the different scoring mechanisms for different actions, and the
financial incentive to take actions that score more points. It can be assumed that subjects
understood the relationship between their actions and payoffs because they were given all the
information necessary to make such a determination. Providing incentives encourages subjects to
make decisions honestly, and non-arbitrary decision-making accurately reveals subjects’
preferences.242 Financial incentives have become essential to the internal validity of economic
experiments and the value of using experiments to test economic theory.243
In order to accurately reveal subjects’ preferences, incentives must be large enough to
compensate subjects for their time. To do so, the average payoff should be comparable to the
income potential subjects could have earned from working at a campus job.244 Additionally,
subjects must be compensated for thinking costs.245 This experiment had four potential payouts:
$5, $10, $15, and $25. The expected payout for any one subject would be equal to $11.25 for
approximately 30 minutes of their time. This translates to an approximate payout of $22.50 per
hour, more than twice the wage of undergraduate student research positions at the University of
South Dakota. Because the payout from the experiment is large enough to compensate subjects
240 Ibid., 135 241Croson, The method of experimental economics, 133 242 Charness, Gneezy, & Halladay, Experimental methods, pay one or pay all, 141 243 Croson, The method of experimental economics, 134 244 Ibid., 134 245 Ibid., 134
41
for their time, the incentives utilized in the experiment could accurately reveal subjects’
preferences.
Traditionally, psychology experiments use a compensation scheme that is not dependent
on the decisions that subjects make; each subject receives the same compensation. Economic
experiments, however, use the concept of induced valuation to test economic theory, making
subjects’ compensation dependent on the decisions they make.246 This allows researchers to test
specific hypotheses against economic theories. Induced valuation was utilized to create a false
utility function for subjects. The false utility function incentivized subjects to value leisure,
education and vital consumption over work, savings, and non-vital consumption. Any deviation
from the false utility function can be interpreted as a subject’s real utility function not aligning
with the false utility function. In other words, if subjects do not pursue the optimal in-game
strategy, the false utility function is not an accurate depiction of a subject’s true preferences.
There is also concern that a common subject pool for economic lab experiments,
university students, do not act in a manner that is comparable to the general population.247
Exadaktylos, Espin, and Garza (2015) examined the decision-making differences between self-
selected students and non-students in five different experiments, each using the exact same
procedure for both subject groups, and found that self-selected students behave “in a very similar
manner” with every other group tested.248 This held true in both individual comparisons (students
versus other specific demographic groups) and larger comparisons (students versus the non-
246Croson, The method of experimental economics, 133-134 247 Filippos Exadaktylos, Antonio M. Espín, and Pablo Branas-Garza, Experimental subjects are not different, (Scientific reports, 2013), 1 248 Ibid., 4

42
student group at large).249 The authors conclude that a sample of “self-selected college
students… produces qualitatively and quantitatively accurate results.”250
Subjects’ decisions were analyzed using both panel and cross-sectional data. Panel data
was created by treating every round from each subject as an individual observation. Panel data
includes observations like the number of hours a subject worked in a particular round and a
subject’s wage and education level for a particular round. Each subject, then, created ten
observations in the panel dataset. This helped to reveal how subjects’ decisions changed over
time in response to dynamic in-game factors like education and wage. Cross-sectional data was
created by aggregating a subject’s ten individual observations to create data that could describe
differences between two subjects’ large-scale decision making. Observations in the cross-
sectional data include the number of times a subject improved their education over ten rounds, a
subject’s average contributions to education over ten rounds, and the average amount of time a
subject dedicated to work or leisure over ten rounds. These observations do not show how
subjects’ individual decisions changed in response to every in-game shift, but do reveal more
generally the patterns in subjects’ aggregated decision-making.
Results Before discussing results, it is pertinent to define and discuss the variables and statistical
tests used. Data was collected in each round for each subject’s profile, wage, education level,
whether or not they received a UBI, and a number of other variables. Those variables are shown
below in Table 6.
249 Ibid., 4 250 Ibid., 4

43
TABLE 6: Panel Data Variable Description
Variable Description
rd Round, 1-10
profile1-4 Four separate dummy variables for the four different profiles
UBI Dummy variable for UBI, =1 if receive UBI
wage Wage
someeduc Dummy variable, =1 if subject has more than no education
hrswrk Hours spent working per week, 0-40
excon Dollar amount spent on extra consumption goods
randevnt Dummy variable, =1 if there was a random event in the round
eductime Time contributed to education, hours
educcash Cash contributed to education, dollars
leisact Hours spent on leisure activities
cashrd Amount of cash at the end of each round, dollars
Data from individual rounds was then aggregated to create variables to control for the
number of levels of education a subject achieved, their average contributions to education,
average time spent working, and total score. Those variables are shown in table 7 below.
TABLE 7: Cross-Section Variable Description
Variable Description
deltaeduc Number of times a subject improved their education
avgeduccash Average of educcash by subject
avgeductime Average of eductime by subject
avgexcon Average of excon by subject
avgwork Average of hrswrk by subject
avgleisact Average of leisact by subject
totgoods Total goods purchased by each subject, dollars
endcash Amount of cash at the conclusion of ten rounds
totscore Total score at the conclusion of ten rounds
edudrop Dummy variable, =1 if subject abandoned contributions to education
For statistical purposes, some variables were manipulated to create interaction terms and
lagged variables. Interaction terms are created by multiplying the values of two variables to see if
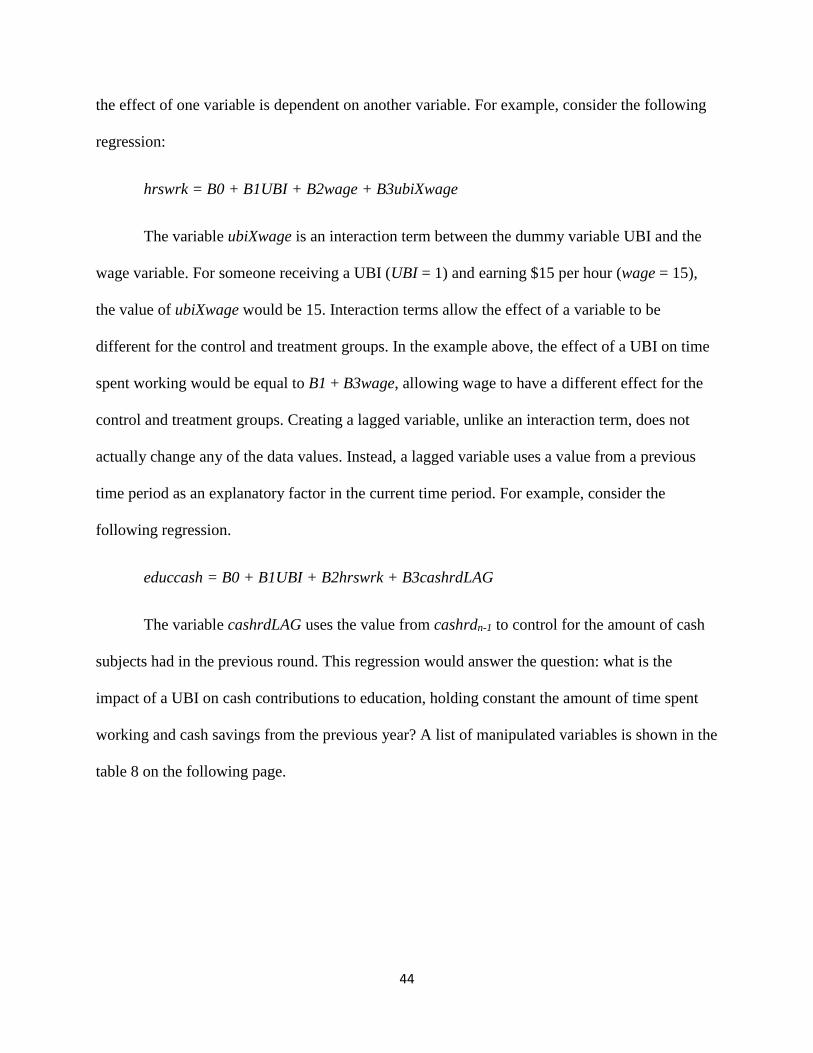
44
the effect of one variable is dependent on another variable. For example, consider the following
regression:
hrswrk = B0 + B1UBI + B2wage + B3ubiXwage
The variable ubiXwage is an interaction term between the dummy variable UBI and the
wage variable. For someone receiving a UBI (UBI = 1) and earning $15 per hour (wage = 15),
the value of ubiXwage would be 15. Interaction terms allow the effect of a variable to be
different for the control and treatment groups. In the example above, the effect of a UBI on time
spent working would be equal to B1 + B3wage, allowing wage to have a different effect for the
control and treatment groups. Creating a lagged variable, unlike an interaction term, does not
actually change any of the data values. Instead, a lagged variable uses a value from a previous
time period as an explanatory factor in the current time period. For example, consider the
following regression.
educcash = B0 + B1UBI + B2hrswrk + B3cashrdLAG
The variable cashrdLAG uses the value from cashrdn-1 to control for the amount of cash
subjects had in the previous round. This regression would answer the question: what is the
impact of a UBI on cash contributions to education, holding constant the amount of time spent
working and cash savings from the previous year? A list of manipulated variables is shown in the
table 8 on the following page.
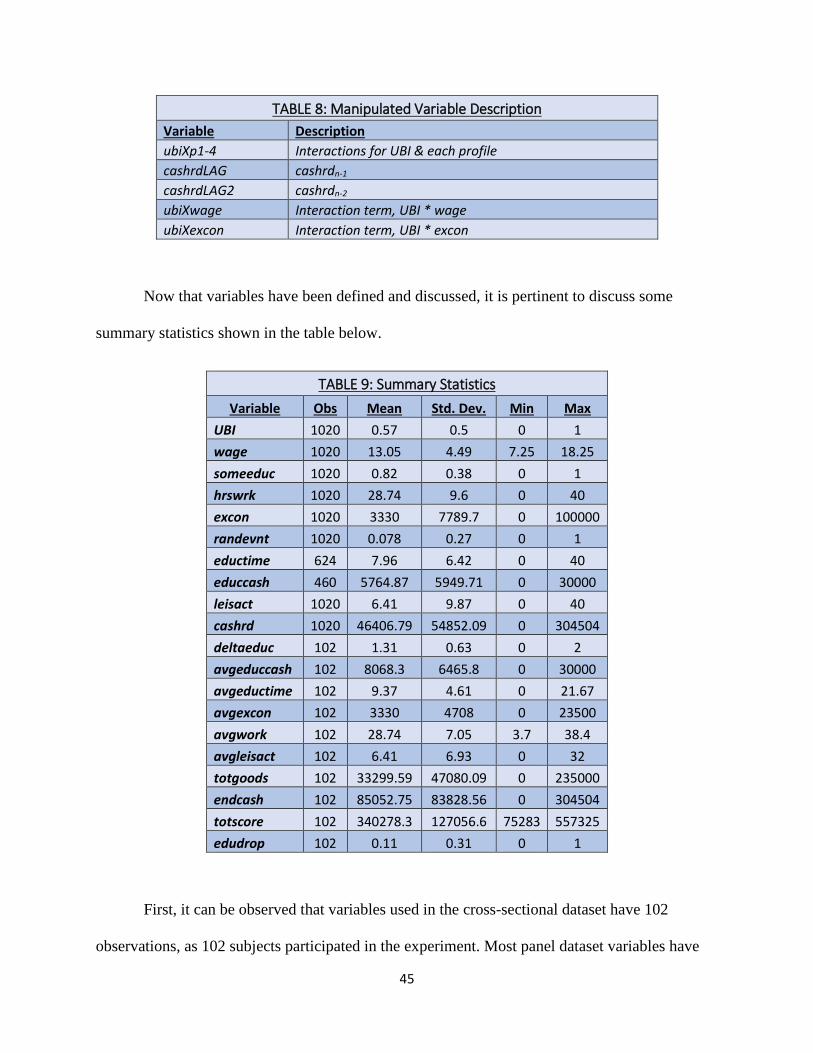
45
TABLE 8: Manipulated Variable Description
Variable Description
ubiXp1-4 Interactions for UBI & each profile
cashrdLAG cashrdn-1
cashrdLAG2 cashrdn-2
ubiXwage Interaction term, UBI * wage
ubiXexcon Interaction term, UBI * excon
Now that variables have been defined and discussed, it is pertinent to discuss some
summary statistics shown in the table below.
TABLE 9: Summary Statistics
Variable Obs Mean Std. Dev. Min Max
UBI 1020 0.57 0.5 0 1
wage 1020 13.05 4.49 7.25 18.25
someeduc 1020 0.82 0.38 0 1
hrswrk 1020 28.74 9.6 0 40
excon 1020 3330 7789.7 0 100000
randevnt 1020 0.078 0.27 0 1
eductime 624 7.96 6.42 0 40
educcash 460 5764.87 5949.71 0 30000
leisact 1020 6.41 9.87 0 40
cashrd 1020 46406.79 54852.09 0 304504
deltaeduc 102 1.31 0.63 0 2
avgeduccash 102 8068.3 6465.8 0 30000
avgeductime 102 9.37 4.61 0 21.67
avgexcon 102 3330 4708 0 23500
avgwork 102 28.74 7.05 3.7 38.4
avgleisact 102 6.41 6.93 0 32
totgoods 102 33299.59 47080.09 0 235000
endcash 102 85052.75 83828.56 0 304504
totscore 102 340278.3 127056.6 75283 557325
edudrop 102 0.11 0.31 0 1
First, it can be observed that variables used in the cross-sectional dataset have 102
observations, as 102 subjects participated in the experiment. Most panel dataset variables have
46
1,020 observations, 10 observations for each of the 102 subjects. The eductime and educcash
variables, because of the experiment’s design, were left null when subjects were not allowed to
contribute time or money to education. When subjects had no education, they could not
contribute cash because the first level of education only requires time contributions. Further,
after subjects had achieved the highest level of education, no more contributions could be made,
and both eductime and educcash were considered null. This allowed the true values of the
variables to be used and the true effects to be revealed; including zeroes where the subject could
not choose a number other than zero would obfuscate the true values and effects of these
variables. Because of this, some regressions will be run in triplicate: once for when subjects
could contribute to both education time and cash, once for when subjects could only contribute to
education time, and once for when education was no longer a possibility.
Further, just over 50% of subjects received the UBI, creating a sizeable treatment and
control group. The average wage was $13.05, although no subject ever earned that exact wage
because wages were fixed at predetermined levels based on profile and education level. A
subject in an average round spent about 28 hours working, spending about $3,330 on extra
goods. This is less than the amount of extra goods it would take to offset the most serious
random penalty, but this amount of consumption is capable of offsetting a moderate negative
event. Subjects, in an average round, would contribute almost 8 hours to education and
contribute about $5,800. About 11% of subjects would start an education that they did not
complete. Only one of those subjects would be a UBI recipient. Lastly, there was a notable
amount of variation in the excon, educcash, leisact, and totgoods variables, as the standard
deviations of the mentioned variables all exceed the means.
47
Because this research is primarily interested in determining the effect of UBI on life
decisions, the primary variables of interest are UBI and any interaction terms created with UBI.
While the presence of the other variables is important to avoid omitted variable bias, their
coefficients and statistical significance are less important for the purposes of this research.
Regressions were also tested for heteroskedasticity and functional form misspecification.
Heteroskedasticity occurs when a regression’s error term is not constant for all values of X.
Because heteroskedasticity causes bias in the coefficients, it must be corrected by using
heteroskedasticity-robust standard errors (robust SEs). By using standard errors that are
calculated slightly differently, heteroskedasticity, and the resulting bias, can be avoided.
Regressions are tested for functional form misspecification to reveal if any linear trends are
forced onto nonlinear data (or vice versa). To test for functional form misspecification (FFM),
the squared and cubed predicted values of a model were included as explanatory variables in the
original regression. If the squared or cubed predicted values are individually or jointly
significant, the model suffers from functional form misspecification. Misspecification, however,
does not cause bias in the coefficients or restrict the use of inferential statistics like t- and F-
statistics. Finally, each regression included a time trend variable (rd) to avoid spurious
regression.
Regressions 1A, 1B, and 1C were designed to answer the question: when controlling for
education levels and educational opportunities, do UBI recipients work less? Regression 1 was
run in triplicate to account for the three educational scenarios mentioned above: no education
(regression 1A), some education (regression 1B) and maximum education (regression 1C)
obtained.

48
Regression 1A explains about 80% of the variation in time spent working and did not
suffer from heteroskedasticity or functional form misspecification. Shown in regression 1A, UBI
recipients work about twelve hours less than non-recipients when they have the opportunity to
contribute both time and money to education, an effect that is statistically significant at the 1%
level. Further, the positive coefficient on the interaction term ubiXwage can be interpreted to
mean that increasing the wage of a UBI recipient by one dollar will lead the UBI recipient to
work an additional 0.22 hours per week. This effect is statistically significant at the 5% level.
Consumption of extra goods, while statistically significant with a positive effect on work for
non-recipients, was associated with slight reductions in work but was not statistically significant.
Regression 1B explains slightly less variation in time spent working (76%) and was run
using robust standard errors to correct for heteroskedasticity. Regression 1B also suffers from
functional form misspecification, although this will not cause bias in the variable coefficients.
UBI recipients, when they have the opportunity to contribute only time to education, work about
14 hours less than non-recipients. As in regression 1A, this effect is statistically significant at the
1% level. Further, the effect of wage on UBI recipients is nearly doubled to result in recipients
working 0.43 hours more per week for each dollar that is added to their wage. This effect is
significant at the 1% level. Finally, consuming extra goods is associated with a statistically
significant reduction in time spent working for UBI recipients, a possible manifestation of the
“surfing”. Non-recipients, on the other hand, tend to work more when they consume extra goods,
likely because the consumption must be funded by wages earned from work.
Regression 1C explains almost 90% of the variation in time spent working and, like
regression 1B, was run with robust standard errors and suffers from functional form
misspecification. When UBI recipients have achieved the highest level of education, they work

49
about 2 hours less than non-recipients, an effect that is not statistically significant at the 10%
level. The effect of wage on UBI recipients in regression 1C is the opposite of in regressions 1A
and 1B: increasing the wage of a UBI recipient is associated with a statistically significant 0.5
hour reduction in time spent working per week. This may be an example of subjects responding
to in-game incentives: as subjects wages increased, the value of their leisure time increased,
providing a stronger incentive for subjects to stop working. The effect of extra consumption on
UBI recipients also changes when recipients do not have the ability to contribute to education.
Extra consumption is associated with spending more time working for UBI recipients, an effect
that is statistically significant and also practically significant: increasing extra consumption by
one standard deviation, while holding other factors constant, would be associated with a 1.5 hour
increase in time spent working for UBI recipients. The full results of regressions 1A-C are shown
on the following page.
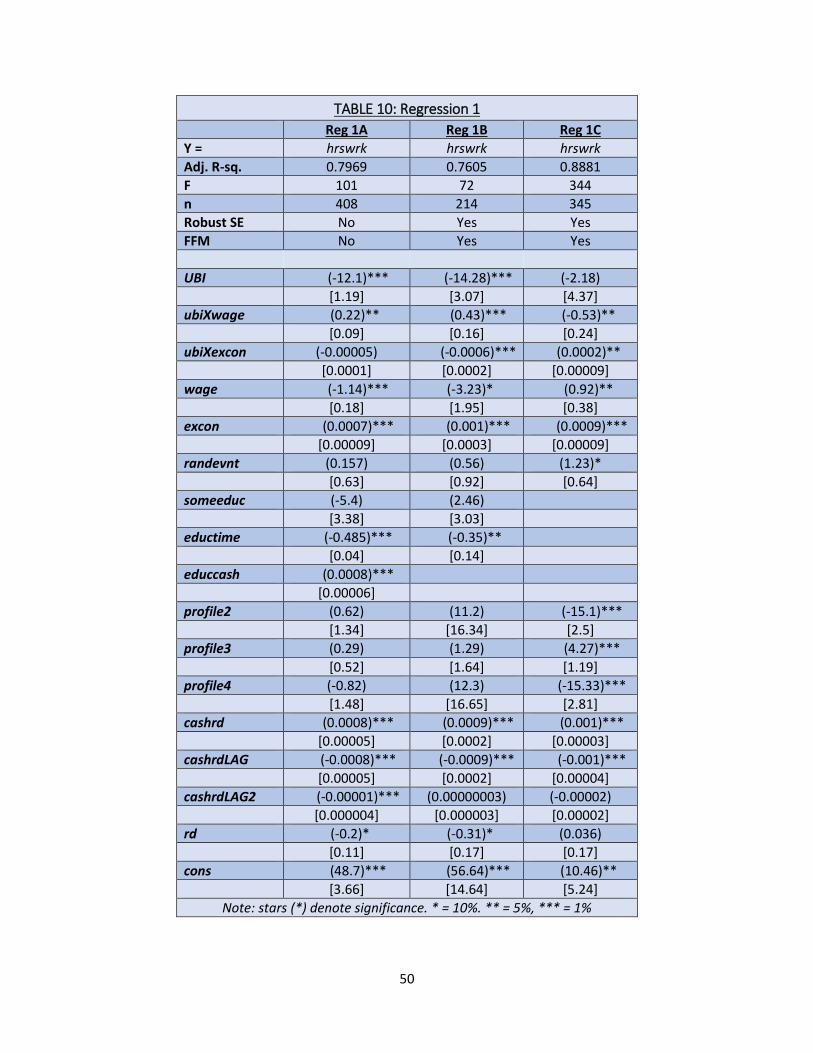
50
TABLE 10: Regression 1
Reg 1A Reg 1B Reg 1C
Y = hrswrk hrswrk hrswrk
Adj. R-sq. 0.7969 0.7605 0.8881
F 101 72 344
n 408 214 345
Robust SE No Yes Yes
FFM No Yes Yes
UBI (-12.1)*** (-14.28)*** (-2.18)
[1.19] [3.07] [4.37]
ubiXwage (0.22)** (0.43)*** (-0.53)**
[0.09] [0.16] [0.24]
ubiXexcon (-0.00005) (-0.0006)*** (0.0002)**
[0.0001] [0.0002] [0.00009]
wage (-1.14)*** (-3.23)* (0.92)**
[0.18] [1.95] [0.38]
excon (0.0007)*** (0.001)*** (0.0009)***
[0.00009] [0.0003] [0.00009]
randevnt (0.157) (0.56) (1.23)*
[0.63] [0.92] [0.64]
someeduc (-5.4) (2.46) [3.38] [3.03] eductime (-0.485)*** (-0.35)** [0.04] [0.14] educcash (0.0008)*** [0.00006] profile2 (0.62) (11.2) (-15.1)***
[1.34] [16.34] [2.5]
profile3 (0.29) (1.29) (4.27)***
[0.52] [1.64] [1.19]
profile4 (-0.82) (12.3) (-15.33)***
[1.48] [16.65] [2.81]
cashrd (0.0008)*** (0.0009)*** (0.001)***
[0.00005] [0.0002] [0.00003]
cashrdLAG (-0.0008)*** (-0.0009)*** (-0.001)***
[0.00005] [0.0002] [0.00004]
cashrdLAG2 (-0.00001)*** (0.00000003) (-0.00002)
[0.000004] [0.000003] [0.00002]
rd (-0.2)* (-0.31)* (0.036)
[0.11] [0.17] [0.17]
cons (48.7)*** (56.64)*** (10.46)**
[3.66] [14.64] [5.24]
Note: stars (*) denote significance. * = 10%. ** = 5%, *** = 1%
51
Regressions 2A and 2B reveal the effect of a UBI on time spent on leisure activities.
Regression 2A explains just over half of the variation in time dedicated to leisure activities and
suffers from serious functional form misspecification (F = 94.37). According to regression 2A,
UBI recipients dedicate almost 12 more hours to leisure time per week, holding all other factors
constant, an effect that is statistically significant at the 1% level. Interestingly, the effect of wage
on leisure activity is negative for UBI recipients when given the opportunity to dedicate time and
money to education, suggesting that UBI recipients, as their wages increase, may dedicate more
resources to their education. The effect of a UBI on contributions to education will be discussed
further below.
Regression 2B explains just under half of the variation in time dedicated to leisure
activities when subjects could only contribute time to education. Regression 2B suffers from
functional form misspecification (F = 27.75), and was run using robust standard errors. Similar
to regression 2A, UBI recipients dedicate about 14 more hours to leisure time per week than non-
recipients, ceteris paribus. Extra consumption is associated with a statistically significant
increase in leisure activity for UBI recipients, opposite of the effect on non-recipients. The effect
of wage on UBI recipients, interestingly, was negative in regressions 2A and 2B while positive
for non-recipients. UBI recipients, then, dedicated less time to leisure activities as their wages
increased, while non-recipients opted to take more leisure time as their wages increased.
Regression 2 did not need to be run when subjects had achieved the highest level of education.
Because once education was achieved the work-leisure decision became a binary dichotomy,
running regression 2 when subjects had achieved the maximum level of education would reveal
the exact same effects as regression 1C, just in the opposite direction.
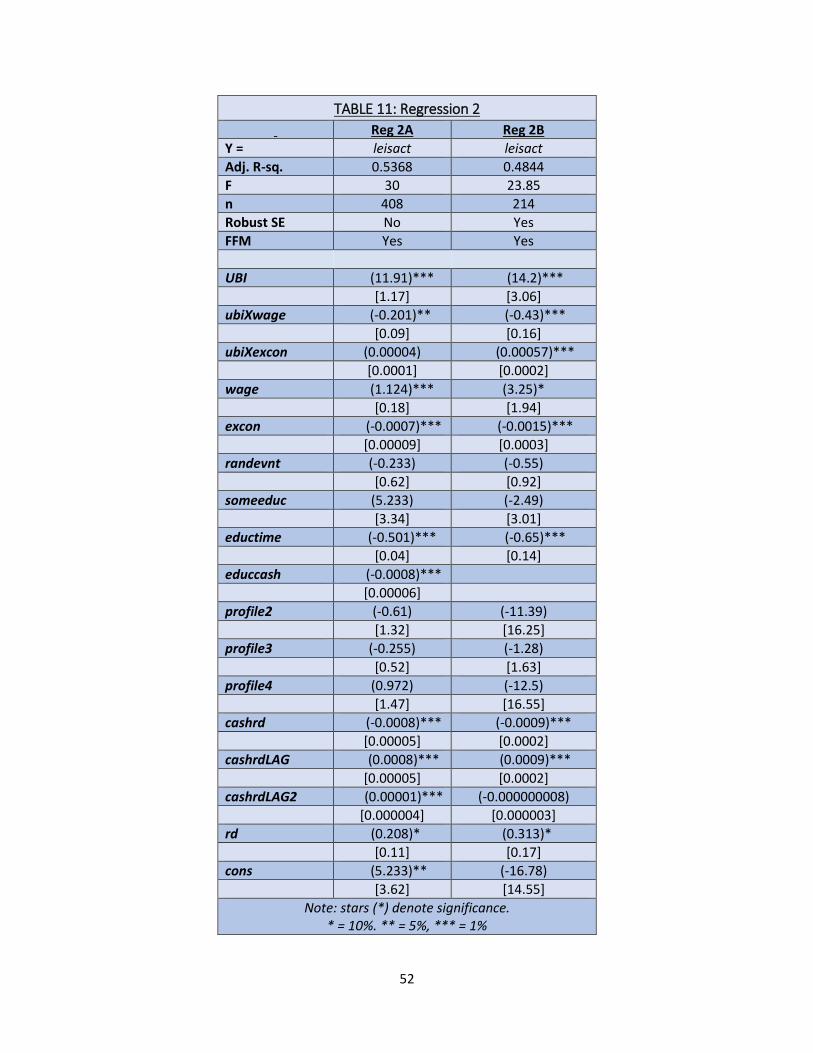
52
TABLE 11: Regression 2
Reg 2A Reg 2B
Y = leisact leisact
Adj. R-sq. 0.5368 0.4844
F 30 23.85
n 408 214
Robust SE No Yes
FFM Yes Yes
UBI (11.91)*** (14.2)***
[1.17] [3.06]
ubiXwage (-0.201)** (-0.43)***
[0.09] [0.16]
ubiXexcon (0.00004) (0.00057)***
[0.0001] [0.0002]
wage (1.124)*** (3.25)*
[0.18] [1.94]
excon (-0.0007)*** (-0.0015)***
[0.00009] [0.0003]
randevnt (-0.233) (-0.55)
[0.62] [0.92]
someeduc (5.233) (-2.49)
[3.34] [3.01]
eductime (-0.501)*** (-0.65)***
[0.04] [0.14]
educcash (-0.0008)*** [0.00006] profile2 (-0.61) (-11.39)
[1.32] [16.25]
profile3 (-0.255) (-1.28)
[0.52] [1.63]
profile4 (0.972) (-12.5)
[1.47] [16.55]
cashrd (-0.0008)*** (-0.0009)***
[0.00005] [0.0002]
cashrdLAG (0.0008)*** (0.0009)***
[0.00005] [0.0002]
cashrdLAG2 (0.00001)*** (-0.000000008)
[0.000004] [0.000003]
rd (0.208)* (0.313)*
[0.11] [0.17]
cons (5.233)** (-16.78)
[3.62] [14.55]
Note: stars (*) denote significance. * = 10%. ** = 5%, *** = 1%

53
Regressions 3, 4, and 5 aim to discern the effect of a universal basic income on money
and time dedicated to education. Regression 3 will utilize panel data to examine each year as an
individual observation while regressions 4 and 5 will utilize cross-sectional data to analyze the
aggregated decisions of each subject. Looking first at regression 3A, UBI recipients contribute
more than $6,000 more to their education than non-recipients when controlling for other factors,
an effect that is statistically significant at the 1% level. Turning to regression 3B, UBI recipients
dedicate 8.6 hours more to their education per week when controlling for other factors, an effect
that is again statistically significant at the 1% level.
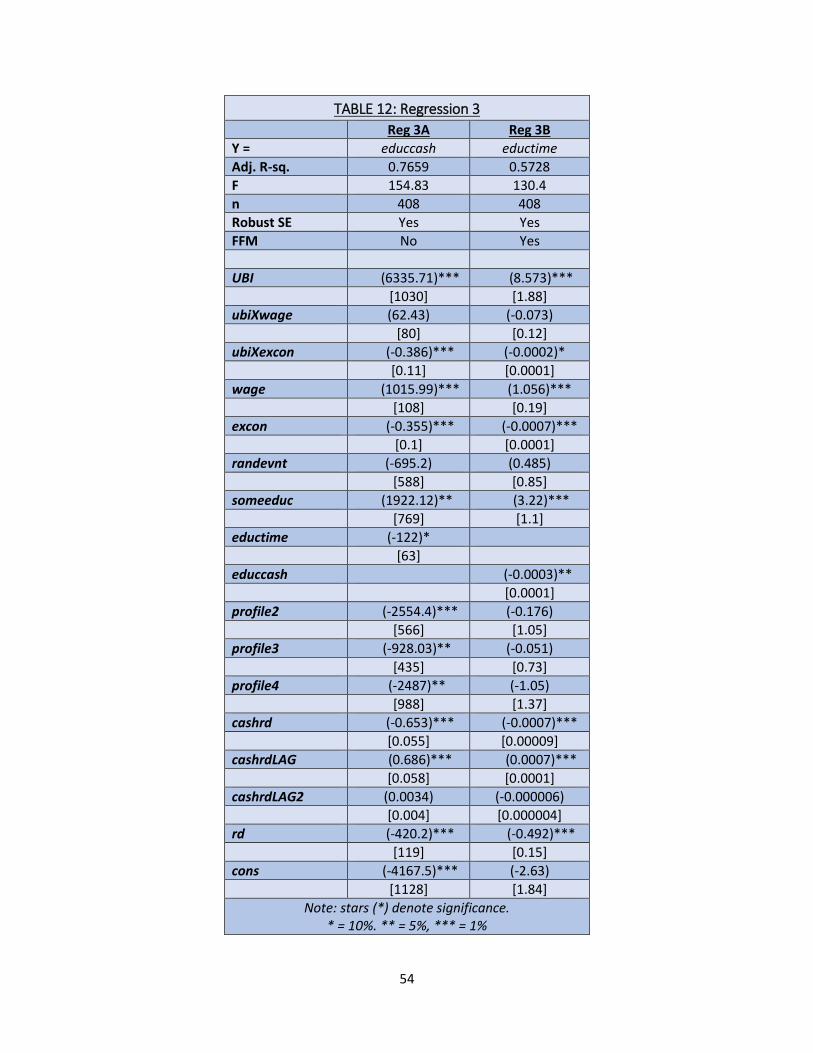
54
TABLE 12: Regression 3
Reg 3A Reg 3B
Y = educcash eductime
Adj. R-sq. 0.7659 0.5728
F 154.83 130.4
n 408 408
Robust SE Yes Yes
FFM No Yes
UBI (6335.71)*** (8.573)***
[1030] [1.88]
ubiXwage (62.43) (-0.073)
[80] [0.12]
ubiXexcon (-0.386)*** (-0.0002)*
[0.11] [0.0001]
wage (1015.99)*** (1.056)***
[108] [0.19]
excon (-0.355)*** (-0.0007)***
[0.1] [0.0001]
randevnt (-695.2) (0.485)
[588] [0.85]
someeduc (1922.12)** (3.22)***
[769] [1.1]
eductime (-122)*
[63]
educcash (-0.0003)**
[0.0001]
profile2 (-2554.4)*** (-0.176)
[566] [1.05]
profile3 (-928.03)** (-0.051)
[435] [0.73]
profile4 (-2487)** (-1.05)
[988] [1.37]
cashrd (-0.653)*** (-0.0007)***
[0.055] [0.00009]
cashrdLAG (0.686)*** (0.0007)***
[0.058] [0.0001]
cashrdLAG2 (0.0034) (-0.000006)
[0.004] [0.000004]
rd (-420.2)*** (-0.492)***
[119] [0.15]
cons (-4167.5)*** (-2.63)
[1128] [1.84]
Note: stars (*) denote significance. * = 10%. ** = 5%, *** = 1%

55
Regression 4A shows the effect of a UBI on cash contributions to education while
holding constant a subject’s starting profile. Profile 1 has been excluded from the regression to
avoid collinearity and, as such, the coefficients on profile2, profile3, and profile4 are interpreted
in comparison to profile1. If the coefficient on a profile variable is positive, that profile gave
larger cash contributions to education than profile 1, and vice versa. If another profile variable
were to have a coefficient of zero, the two profiles would be associated with the same level of
cash contributions to education. Additionally, interaction terms between UBI and the profile
variables were created to reveal differing effects of a UBI on different socioeconomic groups.
Profiles 2 and 4 made the largest cash contributions to education, which is reasonable
considering that these profiles started with higher wages. Profiles 1 and 3 made notably smaller
cash contributions to education. Profile 1 benefitted the most from a UBI in terms of cash
contributions to education, although all profiles who received a UBI increased their cash
contributions to education at some level, ranging from about $1,800 for profile 4 (initially the
highest-paid, most educated profile) to almost $10,000 for profile 1 (initially the lowest-paid,
least educated profile). Even when controlling for aggregate decisions about consumption, work,
and leisure in regression 4B, UBI recipients make statistically significantly larger cash
contributions to education. These results align with results from real-world pilot projects,
suggesting that a UBI is used to acquire human capital, especially by the most disadvantaged.

56
TABLE 13: Regression 4
Reg 4A Reg 4B
Y = avgeduccash avgeduccash
Adj. R-sq. 0.5371 0.5211
F 14.95 14.52
n 102 102
Robust SE Yes Yes
FFM Yes Yes
UBI (9854.24)*** (7096.49)***
[2243] [2114]
ubiXp2 (-3405) (-1431.62)
[3017] [2709]
ubiXp3 (-6239.55)* (-3363.97)
[3263] [2922]
ubiXp4 (-8084.1)*** (-4487.88)
[3052] [2784]
profile2 (5368.3)** (3667.42)*
[2291] [2094]
profile3 (1078.84) (2450.22)
[2415] [2133]
profile4 (4953.14)** (6847.23)***
[2202] [2043]
avgexcon (-0.27)**
[0.11]
avgwork (-1890.33)***
[399]
avgleisact (-1813.92)***
[404]
cons (1812.4) (68719.7)***
[1620] [14212]
Note: stars (*) denote significance. * = 10%. ** = 5%, *** = 1%
Regression 5 uses the same method as regression 4 to determine the impact of a UBI on
time spent on education. UBI recipients, regardless of their profile, dedicated more time to
obtaining their education. Like in regression 4, the most well-off profiles tend to make the largest
contributions to education and, as such, benefit the least from receiving a universal basic income.

57
The effect of a UBI on average contributions to education time, however, cannot be confirmed to
vary by profile: while two of the three UBI/profile interaction terms were statistically significant
in regression 4, none are significant in regression 5. This can be interpreted to mean that the
effect of a UBI on the average amount of time contributed to education does not vary by profile.
When other in-game decisions are controlled for in regression 5B, the effect of a UBI on average
contributions to education time loses its statistical significance and all interaction terms remain
insignificant, suggesting that decisions about work and leisure may be stronger determinants than
the presence of a universal basic income. A UBI, however, by enabling subjects to work less,
may allow subjects to dedicate more time, on average, to education.
TABLE 14: Regression 5
Reg 5A Reg 5B
Y = avgeductime avgeductime
Adj. R-sq. 0.111 0.5709
F 4.15 20.2
n 102 102
Robust SE No No
FFM Yes No
UBI {3.26)*** (1.75)***
[0.87] [0.65]
profile2 (1.19) (0.11)
[1.2] [0.86]
profile3 (-0.28) (3.02)***
[1.3] [0.97]
profile4 (0.92) (3.2)***
[1.2] [1]
avgexcon (-0.0001)
[0.00007]
avgwork (-1.96)***
[0.25]
avgleisact (-1.68)***
[0.25]
cons (6.97)*** (74.37)***
[1] [8.6]
Note: stars (*) denote significance. * = 10%. ** = 5%, *** = 1%
58
Regression 6 aims to reveal the effect of a UBI on year-to-year cash savings. Regression
6, like regression 1, was run in triplicate to account for the effect of a UBI when recipients have
no education (6A), some education (6B), and the highest level of education (6C). Looking at
regression 6A, a UBI, when controlling for savings in the previous two periods, contributions to
education, and consumption, among other factors, is associated with a more than $7,000 increase
in annual savings. As would be expected, increasing extra consumption for both the treatment
and control groups reduces savings, although to a lesser magnitude for the treatment group. This
suggests that UBI recipients could increase their extra consumption while still receiving net
savings, creating the potential for increases in aggregate demand and general economic
equilibrium effects. Regression 6B yields comparable results to regression 6A: UBI recipients
save almost $10,000 more per year than non-recipients when controlling for the abovementioned
factors and continue to experience the negative effects of extra consumption on savings at a
lower magnitude than non-recipients. When subjects have no opportunity to improve their
education (regression 6C), the effect of UBI on cash savings loses its statistical significance. The
ability of subjects to achieve an education (or more broadly the ability to acquire human capital),
then, appears to be an important determinant in the effect of a universal basic income.
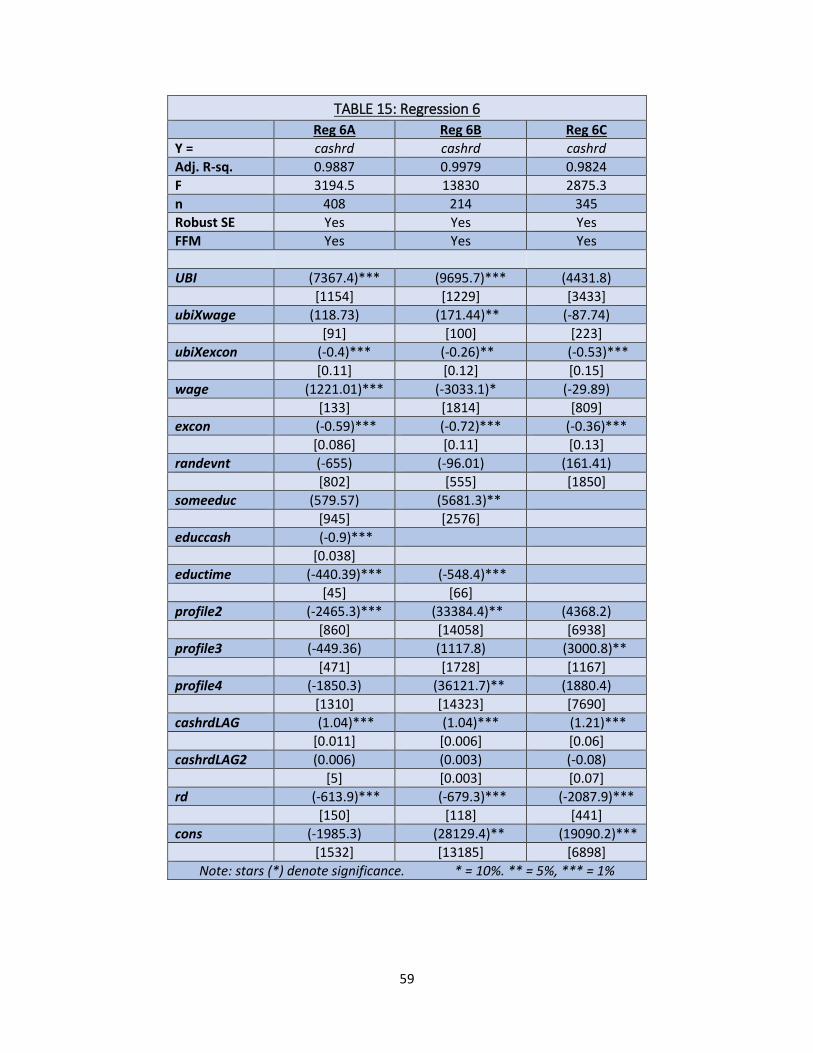
59
TABLE 15: Regression 6
Reg 6A Reg 6B Reg 6C
Y = cashrd cashrd cashrd
Adj. R-sq. 0.9887 0.9979 0.9824
F 3194.5 13830 2875.3
n 408 214 345
Robust SE Yes Yes Yes
FFM Yes Yes Yes
UBI (7367.4)*** (9695.7)*** (4431.8)
[1154] [1229] [3433]
ubiXwage (118.73) (171.44)** (-87.74)
[91] [100] [223]
ubiXexcon (-0.4)*** (-0.26)** (-0.53)***
[0.11] [0.12] [0.15]
wage (1221.01)*** (-3033.1)* (-29.89)
[133] [1814] [809]
excon (-0.59)*** (-0.72)*** (-0.36)***
[0.086] [0.11] [0.13]
randevnt (-655) (-96.01) (161.41)
[802] [555] [1850]
someeduc (579.57) (5681.3)**
[945] [2576]
educcash (-0.9)***
[0.038]
eductime (-440.39)*** (-548.4)***
[45] [66]
profile2 (-2465.3)*** (33384.4)** (4368.2)
[860] [14058] [6938]
profile3 (-449.36) (1117.8) (3000.8)**
[471] [1728] [1167]
profile4 (-1850.3) (36121.7)** (1880.4)
[1310] [14323] [7690]
cashrdLAG (1.04)*** (1.04)*** (1.21)***
[0.011] [0.006] [0.06]
cashrdLAG2 (0.006) (0.003) (-0.08)
[5] [0.003] [0.07]
rd (-613.9)*** (-679.3)*** (-2087.9)***
[150] [118] [441]
cons (-1985.3) (28129.4)** (19090.2)***
[1532] [13185] [6898]
Note: stars (*) denote significance. * = 10%. ** = 5%, *** = 1%

60
Regression 7 shows the effect of a UBI on total cash savings at the conclusion of the final
round when controlling for other in-game factors. Only controlling for profile, UBI recipients
ended the simulation with about $75,000 more than non-recipients. Even when controlling for a
number of in-game factors, including profile, the number of times the subject improved their
education, and their average time spent working, the effect of a UBI on endcash is large
($46,000) and statistically significant.
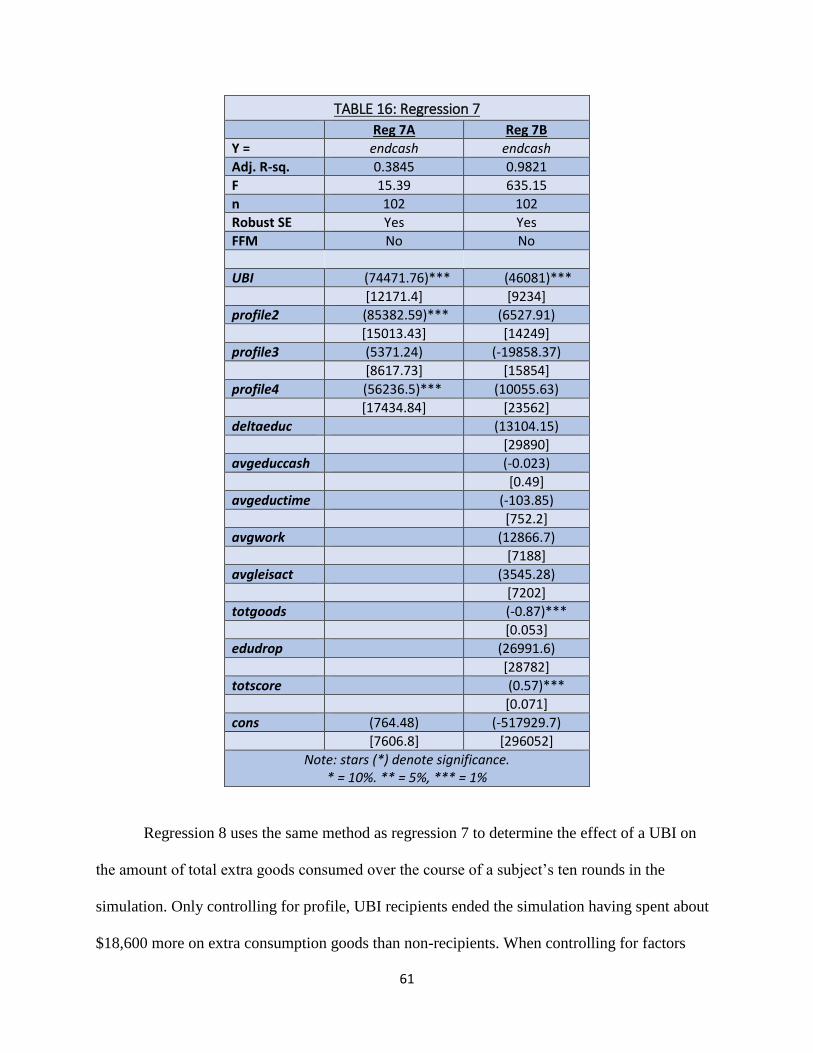
61
TABLE 16: Regression 7
Reg 7A Reg 7B
Y = endcash endcash
Adj. R-sq. 0.3845 0.9821
F 15.39 635.15
n 102 102
Robust SE Yes Yes
FFM No No
UBI (74471.76)*** (46081)***
[12171.4] [9234]
profile2 (85382.59)*** (6527.91)
[15013.43] [14249]
profile3 (5371.24) (-19858.37)
[8617.73] [15854]
profile4 (56236.5)*** (10055.63)
[17434.84] [23562]
deltaeduc (13104.15)
[29890]
avgeduccash (-0.023)
[0.49]
avgeductime (-103.85)
[752.2]
avgwork (12866.7)
[7188]
avgleisact (3545.28)
[7202]
totgoods (-0.87)***
[0.053]
edudrop (26991.6)
[28782]
totscore (0.57)***
[0.071]
cons (764.48) (-517929.7)
[7606.8] [296052]
Note: stars (*) denote significance. * = 10%. ** = 5%, *** = 1%
Regression 8 uses the same method as regression 7 to determine the effect of a UBI on
the amount of total extra goods consumed over the course of a subject’s ten rounds in the
simulation. Only controlling for profile, UBI recipients ended the simulation having spent about
$18,600 more on extra consumption goods than non-recipients. When controlling for factors
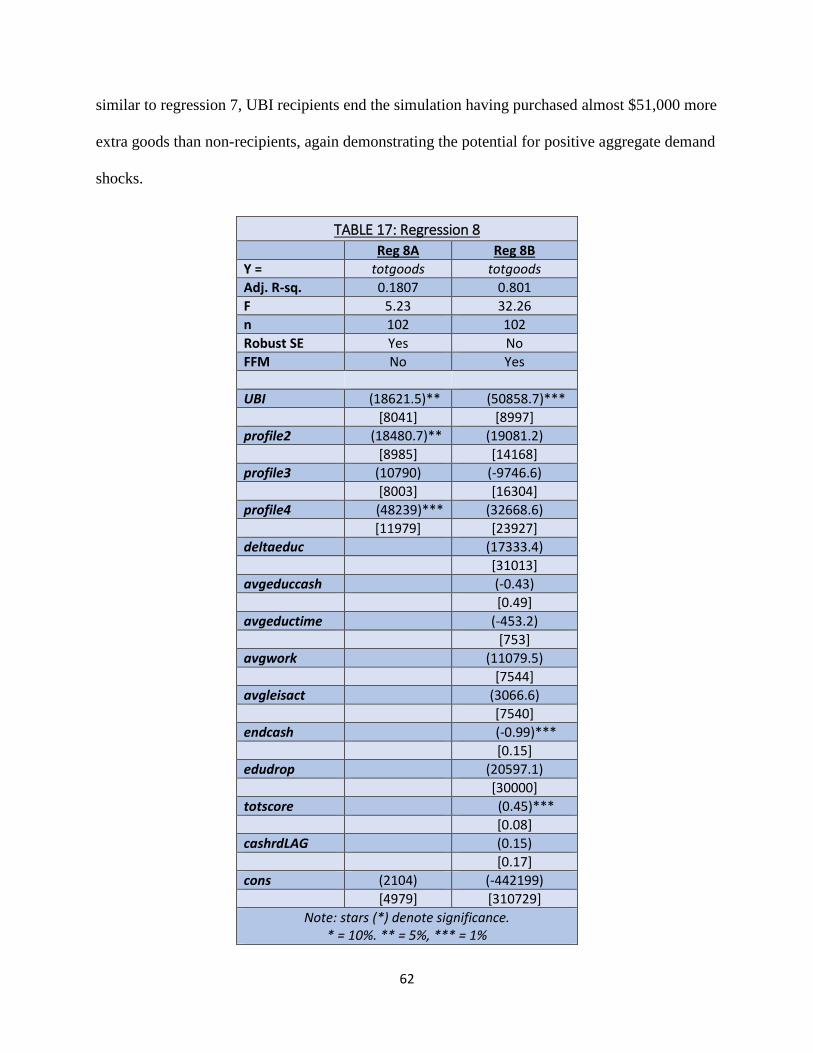
62
similar to regression 7, UBI recipients end the simulation having purchased almost $51,000 more
extra goods than non-recipients, again demonstrating the potential for positive aggregate demand
shocks.
TABLE 17: Regression 8
Reg 8A Reg 8B
Y = totgoods totgoods
Adj. R-sq. 0.1807 0.801
F 5.23 32.26
n 102 102
Robust SE Yes No
FFM No Yes
UBI (18621.5)** (50858.7)***
[8041] [8997]
profile2 (18480.7)** (19081.2)
[8985] [14168]
profile3 (10790) (-9746.6)
[8003] [16304]
profile4 (48239)*** (32668.6)
[11979] [23927]
deltaeduc (17333.4)
[31013]
avgeduccash (-0.43)
[0.49]
avgeductime (-453.2)
[753]
avgwork (11079.5)
[7544]
avgleisact (3066.6)
[7540]
endcash (-0.99)***
[0.15]
edudrop (20597.1)
[30000]
totscore (0.45)***
[0.08]
cashrdLAG (0.15)
[0.17]
cons (2104) (-442199)
[4979] [310729]
Note: stars (*) denote significance. * = 10%. ** = 5%, *** = 1%

63
Regression 9, the final model that will be examined individually before piecing the
models together to create a more holistic vision of the effects of a UBI, reveals the presence or
absence of a “multiplier effect” observed in some real-world pilot projects. A multiplier effect is
observed when a recipient uses their UBI to improve their financial well-being by an amount that
is greater than the value of the UBI. In pilot projects, the multiplier effect is observed when
recipients use their UBI to acquire human capital, raising their long-term earnings by more than
the amount of the UBI; recipients invest $1 to earn $2 more dollars. In the simulation, each
subject was given $120,000 over the course of ten rounds. If $115,000 was spent on basic
necessities over the course of ten rounds and the other $5,000 was saved, a UBI would be
expected to add 119,750 points to a subject’s in-game score. If the presence of a UBI is
associated with an increase in score that exceeds 119,750 points, recipients took actions that
improved their well-being by an amount that exceeds the value of the UBI; the multiplier effect
is observed. Regression 9 reveals that the presence of a UBI is associated with a score increase of
over 135,000, indicating that subjects used their UBI beneficially. This results in a multiplier
effect of 1.14: UBI recipients were able to turn each dollar given to them into 1.14 points.

64
TABLE 18: Regression 9
Reg 9A Reg 9B
Y = totscore totscore
Adj. R-sq. 0.8829 0.9034
F 191.37 135.98
n 102 102
Robust SE No No
FFM No No
UBI (137108.6)*** (121992.5)***
[8745] [9810]
profile2 (185729.5)*** (178768.3)***
[12014] [12292]
profile3 (11054.3) (34823)**
[13130] [15647]
profile4 (210807.1)*** (221108.3)***
[12337] [16064]
endcash (-0.01)
[0.061]
deltaeduc (25834.8)*
[13718]
edudrop (-33653.2)
[20907]
cons (147789.6)*** (121547.3)***
[10149] [25486]
Note: stars (*) denote significance. * = 10%. ** = 5%, *** = 1%
Discussion It is appropriate, now, to aggregate the answers to individual questions to create a more
holistic picture of the effects of a UBI on life decisions. According to the models above, UBI
recipients work less than non-recipients and do dedicate some of that time to leisure activity.
However, UBI recipients also dedicate more resources (in terms of both time and money) to
education in any given round. The same effect holds true across subjects when decisions are
aggregated. Even though they tend to work less, UBI recipients had higher levels of year-to-year
saving in addition to more savings at the conclusion of the simulation. And while UBI recipients
65
saved more than non-recipients, they also spent more on consumption goods. This could
represent potential aggregate demand and general equilibrium effects, but it could also represent
a less-than-optimal use of UBI resources. All in all, however, UBI recipients use their UBI to
increase their in-game score by more than the amount of the UBI they were given by 14%.
The results of this experiment align imperfectly with the results of real-world pilots. The
effect on work, for the most part, aligns with most pilot results. In pilot projects, some small
reductions in work have been observed. In many pilots, this time was used by subjects to
improve their education or acquire human capital. The same holds true of this experiment. Larger
reductions in time spent working were observed in the simulation, possibly due to the
simulation’s inability to account for complex social factors that have been shown to influence
work decisions. UBI recipients did, however, achieve higher levels of education at a faster rate
than non-recipients, regardless of their wage or education level at the beginning of the
simulation. After subjects had achieved the highest level of education, the effect of a UBI on
work shrunk dramatically and became statistically insignificant. This is consistent with several
trials that have found no large-scale aggregate reduction in time spent working. The acquisition
of human capital by UBI recipients in the simulation contributed to a multiplier effect, similar to
the multiplier effect observed in some pilot projects where UBI recipients have improved their
financial security by more than the nominal amount of the cash transfer. The acquisition of
human capital, in addition to positive aggregate demand shocks and general equilibrium effects,
helps offset the large-scale effect of a UBI on work. As mentioned above, individuals with more
human capital tend to work more. So, by enabling individuals to acquire human capital, a UBI
may also enable future labor market participation. Further, the ability of individuals to increase
their consumption may create a positive shock to aggregate demand, enabling economic growth.
66
There are, however, a number of shortcomings to using simulations in general to
predicting real-world effects of a policy. First, there are a number of factors and effects that
interact with each other and cannot be simultaneously captured by a simulation. For example,
while this experiment revealed that a UBI did have a notable impact on education, the effect of
this educational attainment on improving health outcomes or child developments would be
difficult to model. Additionally, the effect on democracy would be difficult to measure due to the
social components of democratic decision making.
There are several aspects of this specific model that could be improved to create a more
realistic simulation. First, the question of funding and taxes was not addressed in this simulation.
Adding taxes to the model could affect individual decision making as recipients would have to
pay taxes, some of whose taxes would exceed their UBI payment. This would likely affect
individuals’ work and consumption decisions. Further, taxes could have a serious effect on
overall economic conditions, which were also not controlled for in this simulation. Taxes, as well
as individual decisions about work, would have a significant effect on economic growth and
could either bolster or erode the support and feasibility of a UBI.
Another aspect of this simulation that could be improved is the scoring mechanism. The
weighted scoring could be changed to more accurately reflect the desirability of or individual
utility gained from certain outcomes. By creating a model that more accurately reflects how
subjects truly feel about certain decisions or outcomes, future researchers could observe effects
that would be more comparable and applicable to the real world. By creating a model that
encouraged subjects to take socially undesirable outcomes, researchers could test to what extent
subjects respond to incentives. This could have two outcomes: first, if subjects respond to
incentives, incentives could be constructed to accompany the UBI to achieve socially desirable
67
outcomes. Further, by measuring subjects’ responsiveness to incentives, researchers could gain a
more realistic understanding of the relative value of outcomes to individuals.
One final addition that could improve this experiment would be to collect data from
participants via a survey at the conclusion of the simulation. There would be a number of ways to
collect data on a number of different topics, ranging from a quantitative 1-to-5 measurement of
how well subjects understood the simulation and the consequences of their actions to a
qualitative, open-ended questions concerning how they felt about receiving the UBI and whether
or not they felt like it improved their outcome. This, in addition to improving model design,
could provide additional insight into the psychological effects of an unconditional cash transfer.
Conclusion A universal basic income (UBI) is a universal, unconditional, cash payment regularly
distributed to all individuals in a geographic area regardless of employment or economic status.
While a UBI is discussed as a singular policy, there are a number of ways in which UBI and
UBI-like policies are different from each other, each with its own unique construction and
effects. A UBI may have a number of simultaneous primary effects, including but not limited to:
improving economic security, achieving a just distribution of wealth, reducing poverty,
combatting the negative effects of automation on labor, and ultimately separating paid work from
survival. By providing unconditional security, UBI could reduce the uncertainty in the future of
work while also reducing economic inequality. Equity, equality, and security are three important
determinants of economic growth, which has a significant impact on politics and democracy. By
mitigating wealth inequality and promoting equitable economic growth, a UBI could strengthen
democratic principles while reducing support for extreme political platforms that marginalize
minority groups. In addition to supporting marginalized groups, a UBI could support the

68
impoverished by providing income support that is simple, free of stigma, and without poverty
traps. Because poverty is merely a cash shortage, not a symptom of personal irresponsibility or
inferiority, a UBI has the potential to reduce absolute poverty. This would have two effects on
the economy: first, the costs of poverty to the economy mentioned above (healthcare utilization,
economic crime, maltreatment of homeless children, etc.) would be reduced. Second, because
unconditional cash transfers in pilots and this simulation have not been wasted, UBI enables
human capital accumulation, labor market participation, and entrepreneurship. This increases the
economic productivity of recipients, resulting in a multiplier effect. A UBI could, then, have
multigenerational effects that have not been captured by simulations or pilot projects. The
positive effects of a cash transfer may continue to be realized for years, or possibly even decades.
While there are a number of reasons to support a UBI, there are also some criticisms.
First, a UBI would be very expensive and would necessitate a substantial increase in government
revenue collections and spending. However, there are ways to both reduce the cost of the policy
(reducing the transfer amount for children under 16, excluding some based on age or family
income) and raise revenue for the program (eliminate obsolete programs, reduce defense
spending, new taxes). While these policy options all have their tradeoffs, it is clear that a full
UBI could, with ample political will, be funded in the United States. Other critics of UBI claim
that “Malibu surfers and welfare hippies” will stop working, creating negative labor market and
economic effects.251 This, however, does not seem to be true. While the full labor market effects
of a nationwide UBI have yet to be observed, evidence from pilot projects and this simulation
have found only small to moderate reductions in work. This time was used, in part, to acquire
human capital, which may have enabled transfer recipients to re-enter the labor market. The total
251 Van Parijs, Why surfers should be fed, 130
69
effect of a UBI on work, then, appears to be minimal, especially when accounting for the
increased demand for labor that would accompany a positive shock to aggregate demand.
In this experiment, subjects played a game in which they were assigned profiles with
varying education levels and wages. About half of all subjects received a UBI. Subjects made
decisions about work, consumption, education, and leisure, and savings while also having to be
prepared for random events. The weighted scoring mechanisms provided different rewards for
different actions, incentivizing subjects to improve their education and then maximize their
leisure time. Both panel and cross-sectional data were analyzed using multivariate OLS
regressions to answer four questions: when controlling for education levels and educational
opportunities, do UBI recipients work less, and do they dedicate more time to leisure activities?
Do UBI recipients invest in education more often or at a faster rate than non-recipients? Do UBI
recipients dedicate more resources to savings or consumption, both year-to-year and in total, than
non-recipients? Does a UBI result in a multiplier effect? It was hypothesized that UBI recipients
would work slightly less, dedicating that time mostly to education and partially to leisure
activities. It was further hypothesized that a multiplier effect would be observed, and that UBI
recipients would save more but consume at a similar level to non-recipients. These hypotheses
turned out to be partially correct: UBI recipients worked marginally less than anticipated and
dedicated a larger-than-expected share of their leisure time to leisure activities. However, the
effect of a UBI on work once education was no longer available shrunk dramatically and became
statistically insignificant. This aligns with real-world pilots, where the effect of a UBI on work at
large has been small. Also like real-world pilots, a multiplier effect was observed. This implies
that simulation participants used their UBI to achieve outcomes that improved their well-being
by an amount that exceeded the nominal value of the cash transfer. Finally, UBI recipients did

70
save more than non-recipients, but also consumed more than non-recipients. While this does not
align with the author’s hypothesis, it does align with some real-world pilot results where an
unconditional cash transfer created a positive shock to aggregate demand, resulting in positive
general economic equilibrium effects.
While this experiment has provided some weight to the arguments of UBI proponents,
there are tradeoffs to using simulations as opposed to pilot projects to predict the real-world
effects of public policy. Especially with a universal basic income, there are a number of complex
social, psychological, and economic interactions that are difficult to model simultaneously.
Without controlling for or being able to observe these interactions, the full potential effects of a
UBI, positive or negative, may never be completely revealed. Future researchers can improve the
value of this model by modifying the scoring mechanisms to test hypotheses, adding controls for
taxes or economic conditions, and collecting data from participants after completing the survey.
Taking these actions could help researchers to reveal some of the many potential effects of a UBI
that were not captured in this model.
A universal basic income would no doubt represent a significant departure from
traditional social policy. However, in an era of costly poverty, rising economic inequality, and
threatening automation, the costs of defending the status quo could be remarkable. A UBI is a
forward-looking social policy that respects personal autonomy, promotes agency and self-
government, and reinforces democratic principles. Universal basic income, by separating paid
work from survival, enables individuals to pursue a more prosperous life, resulting in positive
outcomes for both the recipient and society. The positive results observed in real-world pilots
and this experiment warrant further study. Policymakers should continue to consider UBI as an
alternative to the traditional approach to social policy.

71
Appendix: Player Manual PURPOSE
The purpose of the game is to maximize your score. The higher your score, the more you will be compensated at the end of the
game. You earn points by buying goods, improving your education, participating in leisure activities, and saving money. Each
action is scored differently, so how you use your money and time have a significant impact on your final score. After 10 rounds,
your score will be totaled, and you will be compensated. After reading the player manual, you can see how each action is
scored by viewing the SCORING table.
PROFILE
Before beginning the game, you will receive one of four profiles. Your profile contains important characteristics like education
and income level. Your profile will be either low-income (LI) or medium-income (MI), and either educated or uneducated. Your
income level and education are used to determine your wage. You will have the opportunity to improve your education, which
will provide a boost to your wage. To see the characteristics of your profile, see: PROFILE table.
INCOME
Your income is your money that can be saved or used to buy goods or education. Your income is determined by your wage and
the number of hours you choose to work in a week. You can work up to 40 hours a week (in 5-hour increments), or you could
choose to not work. To view your profile’s potential incomes, see: INCOME table.
UNIVERSAL BASIC INCOME (UBI)*252
Each round you will receive $12,000, called a Universal Basic Income, in addition to any income you may choose to earn. There
are no requirements to receive a Universal Basic Income, and there are no conditions on spending the money. As with the rest
of your income, you are free to spend your Universal Basic Income how you please (keeping in mind the rules of the game).
LEISURE TIME
Any time not spent working is leisure time.
LEISURE TIME = 40 – HOURS WORKING/WK.
Leisure time can be used to improve education or spent on leisure activities. In either scenario, leisure time is scored by finding
the dollar value of leisure time. The dollar value of leisure time is the income that you would have earned if you had used your
leisure time to work. The dollar value of leisure time can be found using the INCOME table. Go to the INCOME table and, using
your leisure time for the number of hours and your wage, find the dollar value of your leisure time.
DOLLAR VALUE OF LEISURE TIME = # HOURS * WAGE
GOODS REQUIREMENT
You are required to purchase $11,500 of goods each round (things you absolutely need to get through the year, like housing,
food, etc.) or face a penalty to your score. For every $1 spent on goods up to the $11,500 requirement, you will be awarded 1
point. If you fail to meet the goods requirement, your score will be penalized by three times the remaining requirement.
PENALITY = 3 * ($11,500 - $ OF PLAYER GOODS CONTRIBUTED)
* This section was only included for individuals in the treatment group.

72
EXTRA GOODS
After satisfying the $11,500 requirement, you can continue to purchase extra goods (things you don’t need to get through the
year, but enjoy having, like videogames, bicycles, makeup, etc.). For every $1 spent on extra goods after the $11,500
requirement, you will be awarded 0.75 points. Purchasing additional goods after the requirement may be important, as random
events may require you to forfeit goods or face a penalty to your score.
RANDOM EVENT
Each round there will be a 1-in-10 chance that a random event will occur. In the case of a random event, one of six scenarios
may occur. Scenarios may involve cash or goods and may be positive or negative. Negative events may be large or small. If the
random event is positive, the goods or cash are awarded. If the event is negative, you will be required to forfeit cash or goods.
If you don’t have the cash or goods to pay the requirement, you will be penalized by three times the remaining payment.
PENALTY = 3 * (REQUIRED PAYMENT – PLAYER CONTRIBUTION)
EDUCATION
As mentioned above, your education impacts your wage. If you began as uneducated, you can ‘get educated’ and receive a
boost to your wage at the beginning of the next round. After you are educated, you can invest in higher education to receive
another boost to your wage. To see the requirements of obtaining education and the reward for doing so, see the EDUCATION
table and your Education Scorecard. Contributions to education carry over between rounds, so long as you contribute at least 5
hours (and $5,000 for higher ed) per year.
Education is scored after finishing a new level of education. If contributions to education are abandoned before completing the
requirements, no points are awarded. For every $1 spent on education, 1.2 points will be awarded. Leisure time spent on
education is scored by calculating the dollar value of leisure time. For every $1 value of leisure time, 1.2 points will be awarded.
The points earned from achieving each level of education are shown on your Education Scorecard.
LEISURE ACTIVITY
Time not spent working can be spent on leisure activities (concerts, hiking, traveling, and other experiences). Leisure time can
only be utilized for education or leisure activities. Leisure activities are scored by finding the dollar value of leisure time. For
every $1 value of leisure activity, 1.2 points will be awarded.
SAVINGS
Saved cash carries over between rounds. Savings may be important, as random events may require you to pay a fee or face a
penalty to your score (see: RANDOM EVENT section). After ten rounds, your savings will be scored. For every $1 of savings after
10 rounds, 0.95 points will be awarded.
THE SCORECARD
Along with the player manual, you should have scorecards and gameplay instructions. The gameplay instructions contain step-
by-step instructions that correspond with the numbered on the blanks on the scorecard. Filling out your scorecard correctly is
essential to receiving proper compensation. After you have completed the game, return your scorecards and all other
materials. Once all materials have been returned and scorecards have been checked, you will be compensated according to
your final score.

73
TABLE 1: Profile Table PROFILE INCOME EDUCATION WAGE
Profile 1 Low Uneducated $7.25
Profile 2 Medium Uneducated $15
Profile 3 Low Educated $8
Profile 4 Medium Educated $16.50
TABLE 2: Random Event Table SCENARIO OUTCOME CATEGORY
Scenario 1 Christmas Bonus, +$600 Monetary (Positive)
Scenario 2 Fired from Job, -$5,800 Monetary (High Negative)
Scenario 3 Temporarily Laid Off, -$2,900 Monetary (Low Negative)
Scenario 4 Inheritance, +$600 of goods Goods (Positive)
Scenario 5 Natural Disaster, -$5,800 of goods Goods (High Negative)
Scenario 6 Contaminated Food, -$2,900 of goods Goods (Low Negative)
TABLE 3: Education Table EDUCATION LEVEL HR REQ $ REQ REWARD
Uneducated - - -
Educated 25 HRS - LI: $0.75; MI $1.50
Higher Education 40 HRS $30,000 LI: $1; MI: $1.75
TABLE 4: Scoring Table ACTION SCORE (PER $1 OR HR) CARRY OVER?
Savings 0.95 at conclusion of Rd. 10 Yes
Goods 1 up to $11,500; 0.75 afterward No
Leisure time $ VALUE of LEISURE * 1.2 No
Education Cash & $ VAL of LEISURE * 1.2 Yes, if continuous
TABLE 5: Scoring Table SCORE REWARD
Less than 200,000 pts. $5
200,000 – 374,999 pts. $10
375,000 – 524,999 pts. $15
525,000+ pts. $25

74
Works Cited Antonopoulos, Rania and Indira Hirway.”Unpaid Work and the Economy: Linkages and Their
Implications.” Levy Economics Institute (May 2015). Retrieved from
http://www.levyinstitute.org/pubs/wp_838.pdf
Brueckner, Markus, and Daniel Lederman. “Effects of income inequality on aggregate output.”
The World Bank (2015). Retrieved from
https://elibrary.worldbank.org/doi/abs/10.1596/1813-9450-7317
Brueckner, Markus, and Hans Peter Gruner. "Economic growth and the rise of political
extremism: theory and evidence." (2010). Retrieved from
https://www.aeaweb.org/conference/2011/retrieve.php?pdfid=39
Charness, Gary, Uri Gneezy, and Brianna Halladay. "Experimental methods: Pay one or pay
all." Journal of Economic Behavior & Organization 131 (2016): 141-150. Retrieved from
https://rady.ucsd.edu/docs/pay-one.pdf
Cheung, Felix, and Richard E. Lucas. "Income inequality is associated with stronger social
comparison effects: The effect of relative income on life satisfaction." Journal of
personality and social psychology 110, no. 2 (2016): 332. Retrieved from
https://www.ncbi.nlm.nih.gov/pmc/articles/PMC4718872/
Christensen, Erik. “Feminist arguments in favor of welfare and basic income in Denmark.”
Institut for Økonomi, Politik og Forvaltning, Aalborg Universitet (2003). Retrieved from
http://citeseerx.ist.psu.edu/viewdoc/download?doi=10.1.1.583.5057&rep=rep1&type=pdf
Colombino, Ugo. "Basic income policies: theory and empirical evidence." Focus 10 (2017): 11-
30. Retrieved from
https://www.researchgate.net/profile/Ugo_Colombino/publication/320402858_Basic_inc
ome_policies_theory_and_empirical_evidence/links/59e23230a6fdcc7154d80dab/Basic-
income-policies-theory-and-empirical-evidence.pdf
Colombino, Ugo. "Is unconditional basic income a viable alternative to other social welfare
measures?." IZA World of Labor (2019). Retrieved from https://wol.iza.org/articles/is-
unconditional-basic- income-viable-alternative-to-other-social-welfare-measures/long
Croson, Rachel. "The method of experimental economics." International Negotiation 10, no. 1
(2005): 131-148. Retrieved from
https://econlab.uaa.alaska.edu/iasc2013/IASC2013/Readings_files/Croson2005.pdf
De Wispelaere, Jurgen, and José Antonio Noguera. "On the political feasibility of universal basic
income: An analytic framework." Basic Income Guarantee and Politics, pp. 17-38.
Palgrave Macmillan, New York, 2012. Retrieved from
https://www.researchgate.net/profile/Jurgen_Wispelaere/publication/304799382_On_the
_Political_Feasibility_of_Universal_Basic_Income_An_Analytic_Framework/links/5782
bd8208ae01f7 36e8f0fe/On-the-Political-Feasibility-of-Universal-Basic-Income-An-
Analytic-Framework.pdf

75
De Wispelaere, Jurgen, and Lindsay Stirton. "The many faces of universal basic income." The
Political Quarterly 75, no. 3 (2004): 266-274. Retrieved from
https://s3.amazonaws.com/academia.edu.documents/1012775/DeWispelaereStirton2004_
PQ75_3_.pdf?AWSAccessKeyId=AKIAIWOWYYGZ2Y53UL3A&Expires=155156079
0&Signature=%2Bok Io3BmDZ0VhvXpJYtrSvYBYlE%3D&response-content-
disposition=inline%3B%20filename%3DThe_Many_Faces_of_Universal_Basic_Income.
Dickson, Michael. "Living with Robots: Automation and Income Inequality in the 21st Century."
(2017). Retrieved from
https://digitalcommons.tacoma.uw.edu/cgi/viewcontent.cgi?article=1043&context=gh_th
eses
Exadaktylos, Filippos, Antonio M. Espín, and Pablo Branas-Garza. "Experimental subjects are
not different." Scientific reports 3 (2013): 1-6. Retrieved from
https://www.nature.com/articles/srep01213.pdf
Gheaus, Anca. "Basic Income, Gender Justice, and the Costs of Gender-symmetrical Lifestyles."
Basic Income Studies 3, no. 3 (December 2008). Retrieved from
https://philarchive.org/archive/GHEBIG
Grafstein, Robert. "The Political Economy of Extremism and Moderation." In 7th general
conference of the European consortium for political research, Bordeaux, vol. 6. 2013.
Retrieved from
https://ecpr.eu/filestore/paperproposal/1d16040d-8d2d-48f5-a805-22fdaefc6eae.pdf
Handa, Sudhanshu, Luisa Natali, David Seidenfeld, Gelson Tembo, and Benjamin Davis. "Can
unconditional cash transfers lead to sustainable poverty reduction? Evidence from two
government-led programmes in Zambia." UNICEF Office of Research, Florence 21
(2016). Retrieved from
http://www.sitesideas.org/public/ideas/files/F30M2_1_Handa_et_al.pdf
Harvey, Philip L. "The relative cost of a universal basic income and a negative income
tax." Basic Income Studies 1, no. 2 (2006). Retrieved from https://njfac.org/wp-
content/uploads/2018/05/The-Relative-Cost-of-a-UBI-and-NIT-2006-1.pdf
Haushofer, Johannes, and Jeremy Shapiro. "The long-term impact of unconditional cash
transfers: Experimental evidence from kenya." Busara Center for Behavioral Economics,
Nairobi, Kenya (2018). Retrieved from
https://www.povertyactionlab.org/sites/default/files/publications/The-long-term-impact-
of-conditional-cash-tranfer_Kenya_Haushofer_Shapiro_January2018.pdf
Hill, Terrence D., and Andrew Jorgenson. "Bring out your dead!: A study of income inequality
and life expectancy in the United States, 2000–2010." Health & place 49 (2018): 1-6.
Retrieved from https://www.sciencedirect.com/science/article/pii/S1353829217306573
76
Hoynes, Hilary W., and Jesse Rothstein. “Universal Basic Income in the US and Advanced
Countries.” National Bureau of Economic Research No. w25538 (February 2019).
Retrieved from https://eml.berkeley.edu/~jrothst/workingpapers/w25538.pdf
Jones, Damon, and Ioana Marinescu. “The labor market impacts of universal and permanent cash
transfers: Evidence from the Alaska permanent fund.” National Bureau of Economic
Research No. w24312. (2018).
https://www.econstor.eu/bitstream/10419/177160/1/dp11356.pdf
Kay, John. "The basics of basic income." Intereconomics 52, no. 2 (2017): 69-74. Retrieved from
https://www.econstor.eu/bitstream/10419/172804/1/069-074-Forum-Kay.pdf
Kela. “Basic income recipients experienced less financial insecurity.” Kansanelakelaitos – The
Social Insurance Institution of Finalnd (April 4, 2019) Retrieved from
https://www.kela.fi/web/en/news-archive/-/asset_publisher/lN08GY2nIrZo/content/basic-
income-recipients-experienced-less-financial-insecurity
Klein, Elise. "Economic Rights and a Universal Basic Income." Griffith Journal of Law &
Human Dignity 6, no. 1 (2018). Retrieved from
https://griffithlawjournal.org/index.php/gjlhd/article/download/1056/932
Krieger, Tim, and Daniel Meierrieks. "Political capitalism: The interaction between income
inequality, economic freedom and democracy." European Journal of Political
Economy 45 (2016): 115-132. Retrieved from
https://www.econstor.eu/bitstream/10419/128383/1/cesifo1_wp5681.pdf
Manyika, James, Susan Lund, Michael Chui, Jacques Bughin, Jonathan Woetzel, Parul Batra,
Ryan Ko, and Saurabh Sanghvi. "Jobs lost, jobs gained: Workforce transitions in a time
of automation." McKinsey Global Institute (2017).
McAdams, Richard H. "Economic Costs of Inequality: The Role of Race in Law, Markets, and
Social Structures." (2007). Retrieved from
https://chicagounbound.uchicago.edu/cgi/viewcontent.cgi?referer=https://scholar.google.
com/&httpsredir=1&article=1506&context=law_and_economics
McLaughlin, Michael, and Mark R. Rank. "Estimating the economic cost of childhood poverty in
the United States." Social Work Research 42, no. 2 (2018): 73-83. Retrieved from
https://academic.oup.com/swr/article/42/2/73/4956930
Orange accent 2 darker 50% - O'Connor, Nat. "Three Connections between Rising Economic
Inequality and the Rise of Populism." Irish Studies in International Affairs 28 (2017): 29-
43. Retrieved from
https://www.jstor.org/stable/10.3318/isia.2017.28.5?seq=1#page_scan_tab_contents
O’Reilly, Jacqueline. “Can a Basic Income Lead to a More Gender Equal Society?” Basic
Income Studies 3, no. 3 (December 2008). Retrieved from

77
Pateman, Carol. “Democratizing Citizenship: Some Advantages of a Basic Income.” POLITICS
& SOCIETY, 32, no. 1 (March 2004): 89-105. Retrieved from
http://www.sscnet.ucla.edu/polisci/faculty/pateman/Democratizing.pdf
Ranzetta, Tim. “Question of the Day: Amazon is called the “Everything Store.” How many
products do they carry?” Next Gen Personal Finance (October 2018). Retrieved from
https://www.ngpf.org/blog/current-events/question-of-the-day-amazon-is-called-the-
everything-store-how-many-products-do-they-carry/
Roe, Mark J., and Jordan I. Siegel. "Political instability: Effects on financial development, roots
in the severity of economic inequality." Journal of Comparative Economics 39, no. 3
(2011): 279-309. Retrieved from
https://dash.harvard.edu/bitstream/handle/1/12019047/SSRN-id963214.pdf?sequence=1
Ruckert, Arne, Chau Huynh, and Ronald Labonté. "Reducing health inequities: is universal basic
income the way forward?." Journal of Public Health 40, no. 1 (2017): 3-7. Retrieved
from https://academic.oup.com/jpubhealth/article-pdf/40/1/3/24372631/fdx006.pdf
Schulz, Patricia. "Universal basic income in a feminist perspective and gender analysis." Global
social policy 17, no. 1 (2017): 89-92. Retrieved from
https://journals.sagepub.com/doi/full/10.1177/1468018116686503
Straubhaar, Thomas. "On the economics of a universal basic income." Intereconomics 52, no. 2
(2017): 74-80. Retrieved from https://www.ceps.eu/system/files/IEForum22017_2.pdf
U.S. Congressional Budget Office (CBO). “Increase Appropriations for the Internal Revenue
Service’s Enforcement Initiatives.” Options for Reducing the Deficit: 2019 to 2028,
(December 2018). Retrieved from https://www.cbo.gov/budget-options/2018/54826
U.S. Department of Housing and Urban Development (USHUD) Office of Community Planning
and Development. “The 2016 Annual Homeless Assessment Report (AHAR) to
Congress.” USHUD (November 2016). Retrieved from
https://www.hudexchange.info/resources/documents/2016-AHAR-Part-1.pdf
U.S. Government Accountability Office (GAO). “Poverty in America: consequences for
Individuals and the Economy.” Testimony before the Chariman, Committee on Ways and
Means, House of Representatives, (January 2007). Retrieved from
https://www.gao.gov/assets/120/115212.pdf
Van Parijs, Philippe. "Why surfers should be fed: the liberal case for an unconditional basic
income." Philosophy & Public Affairs (1991): 101-131. Retrieved from
https://cdn.uclouvain.be/public/Exports%20reddot/etes/documents/1991l.Surfers.pdf
Van Parijs, Philippe. "Basic income: a simple and powerful idea for the twenty-first
century." Politics & Society 32, no. 1 (2004): 7-39. Retrieved from
https://www.ssc.wisc.edu/soc/faculty/pages/wright/RUP-vol-V.pdf#page=6
78
Van Parijs, Philippe. "The universal basic income: Why utopian thinking matters, and how
sociologists can contribute to it." Politics & Society 41, no. 2 (2013): 171-182. Retrieved
from https://www.ssc.wisc.edu/~wright/929-utopias-
2013/Real%20Utopia%20Readings/Politics%20&%20Society-2013-Van%20Parijs-171-
82.pdf
Widerquist, Karl, and Michael A. Lewis. "An efficiency argument for the Basic Income
Guarantee." International Journal of Environment, Workplace and Employment 2, no. 1
(2006): 21-43. Retrieved from
http://www.widerquist.com/karl/Articles--scholarly/Efficiency_Argument--IJEWE.pdf
Wright, Erik Olin. "Real utopian proposals for reducing income and wealth inequality." To
appear in Contemporary Sociology (2000). Retrieved from
http://citeseerx.ist.psu.edu/viewdoc/download?doi=10.1.1.22.599&rep=rep1&type=pdf
Wright, Erik Olin. "Two redistributive proposals–universal basic income and stakeholder
grants." Focus 24, no. 2 (2006): 5-7. Retrieved from
https://www.aacademica.org/erik.olin.wright/21.pdf
Zon, Noah. “Would a universal basic income reduce poverty?” Maytree Foundation (2016).