the effect of covid-19 on macroeconomic stability in ethiopia
TRANSCRIPT
1 | P a g e
THE EFFECT OF COVID-19 ON MACROECONOMIC
STABILITY IN ETHIOPIA
(Uncertainty Shock Impact, Transmission Mechanism and the Role of Fiscal
Policy)
Habtamu Girma Demiessie1
August, 2020
Jigjiga, Ethiopia
1Assistant Professor of Economic Policy Analysis at Jigjiga University (JJU), Ethiopia. He can be reached at
Email: [email protected] or [email protected]

2 | P a g e
Acknowledgment
The author would like to extend his sincere regard to Jigjiga University Vice President Office for
Research and Community Service (JJU-VPRCS) for financing this study. A special gratitude
goes to my colleagues at JJU-VPRCS: Dr. Tesfu Mengistu, Dr. Elyas Abdulahi, Mr. Muyhedin
Mohammed, Dr. Solomon Yared and Dr. Binyam Bogale for their amenable managerial services
from the very start of the study. I also owe my friend Mr. Miler Teshome, whose encouragement
was a positive energy in the process of undertaking the research. I also benefited from Mr.
Wubeshet Gezahegne and Mr. Moges Tufa, who unreservedly extended their professional
expertise in reviewing the manuscript to come up with invaluable comments and suggestions

3 | P a g e
Abstract
This study investigated the impact of COVID-19 pandemic uncertainty shock on the
macroeconomic stability in Ethiopia in the short run period. The World Pandemic Uncertainty
Index (WPUI) was used a proxy variable to measure COVID-19 Uncertainty shock effect. The
pandemic effect on core macroeconomic variables like investment, employment, prices (both
food & non-food prices), import, export and fiscal policy indicators was estimated and forecasted
using Dynamic Stochastic General Equilibrium (DSGE) Model. The role of fiscal policy in
mitigating the shock effect of coronavirus pandemic on macroeconomic stability is also
investigated.
The finding of the study reveals that the COVID-19 impact lasts at least three years to shake the
economy of Ethiopia. Given that the Ethiopian economy heavily relies on import to supply the
bulk of its consumption and investment goods, COVID-19 uncertainty effect starts as supply
chain shock, whose effect transmitted into the domestic economy via international trade channel.
The pandemic uncertainty shock effect is also expected to quickly transcend to destabilize the
economy via aggregate demand, food & non-food prices, investment, employment and export
shocks.
The VAR estimate indicates that COVID-19 uncertainty shock results a massive rise in import in
the six months following the outbreak of the pandemic. The finding in this regard is expected, as
the pandemic triggers massive demand in food and pharmaceuticals, for which Ethiopia is import
dependent on both items. In the next two years, however, the import bill of Ethiopia shows a
decline. Reduction in aggregate demand (both consumption & investment expenditures) is one
explanation for decline in import size in 2013 and 2014 E.C.
The price dynamics as forecasted in the upcoming three years in Ethiopia tells the direction of
impacts of COVID-19 uncertainty shock to shake the macroeconomic order. The findings in this
regard revealed the structural breakups of Ethiopian economy, characterized by its inability to
withstand shocks. As signaled in forecasted price dynamics on both food and non-food price
indices, COVID-19 was a supply shock in its first time impact, but quickly trans-passes to
demand shock. And in the next few years the demand shock outweighs the supply shock.

4 | P a g e
The results of estimations indicate that food prices to sky rocketed at least until the end of 2014
E.C (2021/22 E.F.Y). On the other hand, except communication & hotel & restaurant prices,
other components of non-food price indices show a slump. The decline in non-food price level is
a clear showcase of under-consumption characterizes the economic order in Ethiopia in the
coming three years.
COVID-19 uncertainty shock puts huge loss in the investment sector in Ethiopia at least in the
coming two years 2013 and 2014 E.C (2020/21-2021/22). In this regard, the pandemic effect
transmitted to shake investment expenditure via the length of the pandemic period itself and
export performances, both of which are exogenous shocks.
The study identified that general under consumption features the Ethiopian economy in the next
couple of years. Therefore, the government is expected to enact incentives/policy directions
which can boost business confidence. A managed expansionary fiscal policy is found to be key
to promote investment, employment and to stabilize food & non-food prices. A particular role of
fiscal policy was identified to stabilizing food, transport and communication prices. More
importantly, price stabilization policies of the government can have spillover effects in boosting
aggregate demand by spurring investments (and widening employment opportunities) in
transport/logistics, hotel & restaurant, culture & tourism and export sectors in particular.

5 | P a g e
1. INTRODUCTION
1.1.Background & Justification
Quiet unprecedented in the world history in memory, all corners of the globe is living at a
standstill following the outbreak of coronavirus pandemic. A highly contagious viral disease,
Cvid-19 (the scientific name of the disease) has stopped virtually every human activity at global
scale, as people`s movement curbed;; by way of controlling the spread of the pandemic (Fetzer,
T. et al, March 2020, Politico, March 19/2020).
Expertise commentaries on Covid-19 dub the disease an economic pandemic, to signify counting
the cost of the cure is getting dear than the problem itself. The size of the shock will be
determined mostly by the measures taken to avoid large scale contagion and to limit the area of
spread. Thus, the containment measures – the disruption to work processes, the limitations on
meetings and travel – will be a larger negative supply shock than the number of deaths, even if
the latter could still turn out to be large. Full or partial lockdown, like in China, is one of the
most extreme measures and can bring production and consumption almost to a standstill. Such
extreme measures are likely to remain restricted to certain areas and will be difficult to maintain
for a long time (Baldwin, R. and Weder di Mauro, B., 2020).
On the most extreme case, the economic cost of COVID-19 to the world is predicted to be close
2.5 trillion USD, a size of GDP of Britain. The global financial market is also losing massively
day by day. As has been reported from the world stoke exchange markets, the three weeks of
damages of covid-19 is even worse than the three years of great depression of 1930`s, and the
2008 financial crisis (later economic crisis) (Bloomberg Economic Study).
While those costs are incurred at the starting days of the outbreak, one can imagine how the cost
would surge as corona-days count. In the years after the pandemic, the world has to expect the
biggest economic challenge ever. African economies already small enough to shake by the
shocks of global economy, the continent should also prepare for the worst economic hit (Africa
News, March 31/2020; REUTERS, March 24/2020).
6 | P a g e
For many analysts, COVID-19 is dismantling not just the economy, but also changing the way
all sorts of human transactions hold, locally and globally. Indeed we are witnessing COVID-19`s
staggering impacts in changing the way political business functions; also in its effect of
reshaping intra-personal & inter-personal communications too. Scholars are also predicting for
its impact in restructuring the global order by triggering for global actions forward, something
the world has been missing in the past decades or so.( Politico, March 19/2020)
Ethiopia announced the first case of coronavirus on March 13 2020. Since then Coronavirus has
taken the single most topic grabbing the dialogue among the Ethiopian society. The government
of Ethiopia has also considered the issue a number one national agenda, where a number of
measures and actions taken to fight the spread of the disease. (Africa News, REUTERS)
In a bid to curb the spread of the disease thereby limiting the movement of people, the
government announced for schools & universities to shut-down; also large portion of personnel
in the public service were set to stay home.
So far, the government of Ethiopia has allotted 5 billion birr for expenses on COVID-19
emergency activities. The private & public sector entities, and the general public have also been
contributing in terms of monetary capital, equipment and residential also in response to the
national call for assistances as waged by the government of Ethiopia later March/2020 (FBC).
While massive actions and many actors are preparing for the inevitable war against the
coronavirus in Ethiopia, it is also wise to set aside resources to make for life after COVID-19.
As we note from history, deadly pandemics are inherent to human civilizations, where disease
outbreaks comes and go leaving their legacies & scars. The same holds to COVID-19 too.
Hence, while mobilizing all our efforts to the inevitable war, it also important to design how we
may ease the hard times we are awaited after COVID-19.
At least at this point in time, COVID-19 is much a media issue than an academic topic. In fact
the problem is newer and it takes time to deal it with empirics, but that does not mean there is no
scope for academic interventions. Indeed, the academic circle can (should) look the matter on
table for expertise treatise, and come up with sound way forward that can be used by
governments in the fight against coronavirus.

7 | P a g e
So far pioneering works on the topic were undertaken by think thank groups and professional
institutions working in Ethiopia. In this regard, the policy researches by Ethiopian Economics
Association and Policy Institute has produced two policy papers on COVID-19 economic wide
impact on Ethiopia. A study by EEA2, titled, The economy wide impact of the COVID-19 in
Ethiopia: Policy and Recovery options’, investigated the short, medium and long term impacts of
COVID-19 on the Ethiopian economy. Using a dynamic Computable Equilibrium (CGE) model,
the study captured the impact of the pandemic on productivity growth of labor and capital the
impacts on Foreign Direct Investments and Remittances, export demand, import supply,
transaction costs and the anticipated government interventions. The study reported the pandemic
effect under mild and severe case scenario. Accordingly, under amplified (or severe) pandemic
scenario, the total loss on the economy as a result of COVID-19 shock is estimated at 310 billion
birr in FY 2020/21, whose effect downgraded the forecast estimate on economic growth in
2020/21 to 0.6%3.
A study by FDRE Policy Institute (PI) aimed at identifying key policy alternatives to tackle the
social and economic impacts of CIVID-19 on Ethiopia. An exploratory study investigated
determinant factors on effectiveness and implications of public health measures aimed at
mitigating the effect of COVID-19. Accordingly, factors related to demographic, economic and
social settings are important in determining the economic damages associated with the public
health measures to contain or suppress the virus. The study recommended targeted and combined
social and economic policy measures to overcome COVID – 19 effects on the economy4.
Another policy research, which was authored by Alemayehu Geda5, investigated the dynamic
impact of the pandemic on the Ethiopian economy. Using auto-regressive distribution lag model
(ADL) model, the study focused on the COVID-19 effect on the service sector of Ethiopia.
Finding from this study reveal that a ten percent increase in confirmed weekly cases in Ethiopia
is found to lead to a 1.1 and 6.8 percent reduction in demand for hotels in the long and short run,
respectively This reduction becomes 8.5% and 3.7 % for restaurants and air travel services in the
short run. The study further estimated that demand for services in the tourism sector to decline
2 Tadele Ferede, Getachew Diriba and Lulit Mitik Beyene. 2020
3 The pre-pandemic growth projection for Ethiopian economy was 9% in the year 2020/21.
4 Alebel Bayrau Weldesilassie and Tassew Woldehanna. 2020.
5 Alemayehu Geda. 2020

8 | P a g e
by about 15 to 17 percent for a ten percent increase in confirmed weekly cases in the short run.
In the other hand, the estimation from the study indicated COVID-19 shock results in an increase
in the demand for communication services, where a 10% increase in weekly cases estimated to
increase the demand for Zoom software demand (a proxy variable to communication service) by
5.6 percent both in the short run and the long run.
Empirical evidences so far on the effect of COVID-19 on Ethiopian economy did not address the
dynamic impact through the channel of uncertainty impact of the pandemic on macroeconomic
stability. Therefore, this study tries to fill this gap. As such, analysis and inferences were made
on COVID-19 uncertainty shock effect on the pillars of macroeconomic stability: Investment,
Employment, Export expenditure, Import demand, Price Indices (both food and Non-Food
prices) and Government Expenditures. Moreover, the role of fiscal policy to mitigate the effect
of the pandemic in the short run period is also investigated.
1.2.Objectives
The general objective of this study is to identify, measure and interpret the impact of COVID-19
uncertainty shock on the macroeconomic stability in Ethiopia in the short run.\
Specific Objectives
Diagnose into the transmission mechanism of the COVID-19 uncertainty shock effect
into the Ethiopian economy
Estimate and forecast uncertainty shock effect on real variables in the macroeconomic
order: Investment expenditure, export, import, food & non-food prices, level of
employment and government expenditure.
Investigate the role of fiscal policy measures to ease the potential shock effects of
COVID-19 pandemic on macroeconomic instability
1.3.Significance of the Study
This study can provide valuable evidences for macroeconomic policy interventions aimed at
mitigating the shock effects of coronavirus pandemic on Ethiopian economy in the short run
period. The significance of the study can also be in invigorating expert discussions and/or
initiating further inquiry on the subject.

9 | P a g e
2. COVID-19 PANDEMICS: HEALTH AND ECONOMIC IMPACTS
As we note from history, deadly pandemics have always been inherent to human civilizations. In
the past two centuries alone, the world has seen a total of eight major pandemics. In the 20th
century three outbreaks recorded as global pandemic: the historic ‗Spanish Influenza‘ of 1918,
(killed over 100 Million people): the ‗Asian flu‘ of 1957 (killed 1.1 million people) and the
‗Hong Kong flu‘ of 1968 (killed 1 million people worldwide)
The 21st century has seen five pandemic outbreaks: N1H1 in 2009 (‗575,400 killed), Severe
Acute Respiratory Syndrome – SARS (with 7 to 17% fatality rate) in 2002, Middle East
Respiratory Syndrome – MERS (with 35% fatality rate) in 2012, and Ebola which peaked in
2013-14 (with 25% to 90% fatality rate).
Currently the world is struggling with the fifth pandemic in 21st century, the coronavirus
pandemic- COVID-19.
Table 1: Record on World`s Major Pandemics in History (14th
-21st Century)
Event Start Year End Year Total Deaths
Black Death 1347 1352 75,000,000
Italian Plague 1623 1632 280,000
Great Plague of Sevilla 1647 1652 2,000,000
Great Plague of London 1665 1666 100,000
Great Plague of Marseille 1720 1722 100,000
First Asia Europe Cholera Pandemic 1816 1826 100,000
Second Asia Europe Cholera Pandemic 1829 1851 100,000
Russia Cholera Pandemic 1852 1860 1,000,000
Global Flu Pandemic 1889 1890 1,000,000
Sixth Cholera Pandemic 1899 1923 800,000
Encephalitis Lethargica Pandemic 1915 1926 1,500,000
Spanish Flu 1918 1920 100,000,000
Asian Flu 1957 1958 2,000,000
Hong Kong Flu 1968 1969 1,000,000
1N1 Pandemic 2009 2009 203,000
Source: Alfani and Murphy (2017), Taleb and Cirillo (2020),
https://en.wikipedia.org/wiki/List_of_epidemics and references there
10 | P a g e
2.1. COVID-19 – EPIDEMOLOGICAL TIMELINE
In late December 2019, a new pneumonia of unknown cause was identified in Wuhan pro,
People‘s Republic of China (PRC). In subsequent days and weeks, massive laboratory studies
undertaken on the cause of the newer pneumonia. On 11 February 2020, World Health
Organization officiate the disease outbreak in China as caused by coronavirus, naming the
disease COVID-19.
Earlier medical investigations about COVID-19 reported the disease ‗an extremely contagious
but not especially fatal, and that in the majority of cases, it is no worse than the seasonal flu’. As
medical studies goes on, however, the diseases can causes serious respiratory infections that
would lead to death. Subsequent medical studies then reported the risk of death from COVID-19
between 1 and 4 per cent.
As of early March 2020, the COVID-19 epidemic was very much centered in China, with over
90% of reported cases located there. In late January, the disease had begun spread out of China.
In the mentioned period, the two hardest hit nations outside China were Japan and Korea. The
World Health Organization declared the outbreak a Public Health Emergency of International
Concern on 30 January 2020. As of 31 January 2020, COVID-19 had spread to 19 countries with
106 confirmed cases.
By Mid February 2020, the WHO has reported 68,584 COVID-19 cases and 1666 confirmed
death in China. The spread of the disease went up to 26 countries in the world, where WHO
report on February 16 recorded 355 COVID-19 cases outside China with no death report. By 28
February, 2020, COVID-19 affected countries mount to 50; with global COVID-19 cases were
83,631, with 2858 deaths recorded.
The spread of the disease even mounting day on day, and on March 11, 2020 WHO declared the
disease a global pandemic. By March 31, 2020 WHO reported 693,224 confirmed COVID-19
cases and 33,106 deaths across the world. On the turn of April, on April 2, 2020 global COVID-
19 cases top one million, with death tolls surge 51,000. As of April 5, 2020 COVID-19 cases
tally 1.22 million and 65,711 death tolls reported worldwide.

11 | P a g e
2.2.COVID-19 PANDEMIC - AN ECONOMIC PANDEMIC?
As a matter of fact, the nature of the disease extremely detrimental on human life, with its toll on
the economic and psycho-social lives of people is severe. This is because containment measures
required the disruption to work processes, the limitations on meetings and travel. Bloomberg
economics, in its March issue, dubbed COVID-19 an economic pandemic, to signify counting
the cost of the cure is getting dear than the problem itself. A glimpse into the world economic
order in the past six months has been telling that COVID-19 is a global economic pandemic.
The crisis caused by the coronavirus pandemic is plunging the world economy to depths
unknown since the Second World War, adding to the woes of an economy that was already
struggling to recover from the pre-2008 crisis. Beyond its impact on human health (materialized
by morbidity and mortality), COVID-19 is disrupting an interconnected world economy through
global value chains, which account for nearly half of global trade, abrupt falls in commodity
prices, fiscal revenues, foreign exchange receipts, foreign financial flows, travel restrictions,
declining of tourism and hotels, frozen labor market, etc.
In the European Union, where tourism accounts for some 4% of GDP, the number of people
travelling by plane fell from 5m to 50,000; on April 19th less than 5% of hotel rooms in Italy and
Spain were occupied. In USA, businesses in all sectors have lost substantial revenue.
Restaurants, bars and recreational businesses have been badly hit: revenues have declined some
two-thirds since March 15th. Travel and tourism may suffer the worst losses.
According to calculations made on behalf of The Economist by Now-Casting Economics, a
research firm that provides high-frequency economic forecasts to institutional investors, the
world economy shrank by 1.3% year-on-year in the first quarter of 2020, driven by a 6.8% year-
on-year decline in China‘s GDP6.
The United Nations African Union Economic Commission for Africa (UN-ECA) has identified
the major economic challenges attributed to COVID-19 in Africa as endogenous and
exogenous7. The exogenous effects come from direct trade links between affected partner
6 The Economist Magazine, The 90% Economy that Lockdowns will leave Behind, April 30, 2020.
7 African Union (AU), Impact of The Coronavirus (COVID-19) on the African Economy, March 2020

12 | P a g e
continents such as Asia, Europe and the United States; tourism; the decline in remittances from
African Diaspora; Foreign Direct Investment and Official Development Assistance; illicit
financing flows and domestic financial market tightening, etc. The endogenous effects occur as a
result of the rapid spread of the virus in many African countries.
Ethiopia announced the first case of coronavirus on March 13 2020. Since then Coronavirus has
taken the single most topic grabbing the dialogue among the Ethiopian society. The possible
impact of COVID-19 has been the topic of discussions, researchers and print and digital media
reportages. The government of Ethiopia has also considered the issue a number one national
agenda, where a number of measures and actions taken to fight the spread of the disease.
In a bid to curb the spread of the disease thereby limiting the movement of people, the
government announced for schools & universities to shut-down; also large portion of personnel
in the public service were set to stay home. Despites those steps, many still fear Ethiopia is yet to
count the cost of this global pandemic.
This chapter tries to shade light to readers on the overall picture of Ethiopia, with an aim to
emphasize on state of nature of the economic, demographic and socioeconomic contexts of the
country. The intent is to evoke readers imagine the breadth and depth of COVID-19 impacts on
Ethiopians across the board from the life of an average citizen to private businesses to the
government sector in general.
OECD estimated the economic cost of Covid-19 to the world to be close 2.7 trillion USD, a size
of GDP of Britain. Reports on world stoke exchange markets depicted the three weeks of
damages of covid-19 is even worse than the three years of great depression of 1930`s, and the
2008 financial crisis (later economic crisis).
While those costs are incurred at the starting days of the outbreak, one can imagine how the cost
would count as corona-days count.
13 | P a g e
2.3.ETHIOPIA`S PREPAREDENESS TO WITHSTAND COVID-19 SHOCK
Ethiopia is facing one of its biggest hurdles in the economic front, the COVID-19 pandemic
shock. And, it takes to review on the country`s overall performance and states of affairs before
trying to estimate the impact of the pandemic on its economy. Hence, this chapter puts forward
the overall economic, social, political and demographic reality of Ethiopia in the past couple of
years. Doing so, it tries to shade light on how better/ill prepared the country is to facing the
negative outcomes of the COVID-19 pandemic.
2.3.1. COVID-19 Info-graphic Note on Ethiopia (March 2020- July 2020)
Ethiopia announced the first case of coronavirus on March 13 2020. Since then Coronavirus has
taken the single most topic grabbing the dialogue among the Ethiopian society. The government
of Ethiopia has also considered the issue a number one national agenda, where a number of
measures and actions taken to fight the spread of the disease.
In a bid to curb the spread of the disease thereby limiting the movement of people, the
government announced for schools & universities to shut-down; also large portion of personnel
in the public service were set to stay home. Despites those steps, many still fear Ethiopia is yet to
count the cost of this global pandemic.
By April 5, 2020, Ethiopia has recorded the first COVID-19 deaths (two deaths), and the total
cases in the country reached 43. With the tally of COVID-19 cases incessantly increasing, the
problem is likely to surge and last longer. And the government of Ethiopia already told its people
to remain at home & protect themselves from the virus, sending clear message to Ethiopians
across the board to prepare for the worst.

14 | P a g e
Figure 1: Trend of COVID-19 New Cases in Ethiopia (April 18-July 22, 2020)
(Source: Based on Data from Wikipedia)

15 | P a g e
2.3.2. How Prepared Ethiopia to Withstand COVID-19 Shock Effect:?
2.3.2.1.Political Context
For the past more than 15 years, Ethiopia has been on growth trajectory, where the annual
economic growth rate averaged at 10%. Throughout this period, the country is able to extricate
… million populations from poverty. Pertaining to its fast growing economy, the country has
been praised a growth model in the realm of developing world.
Despite the step forward in the economic arena, the case in the political development has been
otherwise. The government of Ethiopia has been widely condemned for its suppressions of
opposition voices, the media and civil society groups.
A dominant feature of Ethiopian political system is polarized interests on the stream, giving
political shocks key variables determining the performance of the economy. In the decade
preceding the outbreak of COVID-19, the EPRDF led government has been trying to contain
those political shocks not to ‗disrupt‘ the economic progress. The containment, however, faded
away starting the year 2015, when political unrest began raging Ethiopia. Consequent public
rallies gave EPRDF led government undertake massive political reforms, where Abiy Ahmed
(PhD came to the apex of state leadership. As package of reforms was widening the political
space.
Given polarized interests featuring the political spectrum of the country, the newer development
has given political shocks to reappear again to twist and turn the whole fabrics of Ethiopian
society, including the economy.
The economic outlook in the pre-COVID-19 years is a showcase how political shocks
downplayed the economic performance of the country. Since the political upheaval began in
2015, investment massively affected; youth unemployment in its spike;‘ foreign debt made the
economy a headache; staggering decline of remittance flows; decline in export.
According to International Monetary Fund (IMF) report in 2018, political factors coupled with
external shocks8 explains the slowdown of the economy from the normal trend of double digit
8 Decline in commodity prices in international markets for which Ethiopian economy is highly dependent in export
earnings

16 | P a g e
growth for years to slow down to 7.7 percent in 2017/18 due to political headwinds and external
shocks (IMF, 2018)
It is amidst those political contexts and consequent shocks posing economic uncertainty that
COVID-19 shock appeared to affect the economy in the years ahead.
17 | P a g e
2.3.2.2.Macroeconomic Context
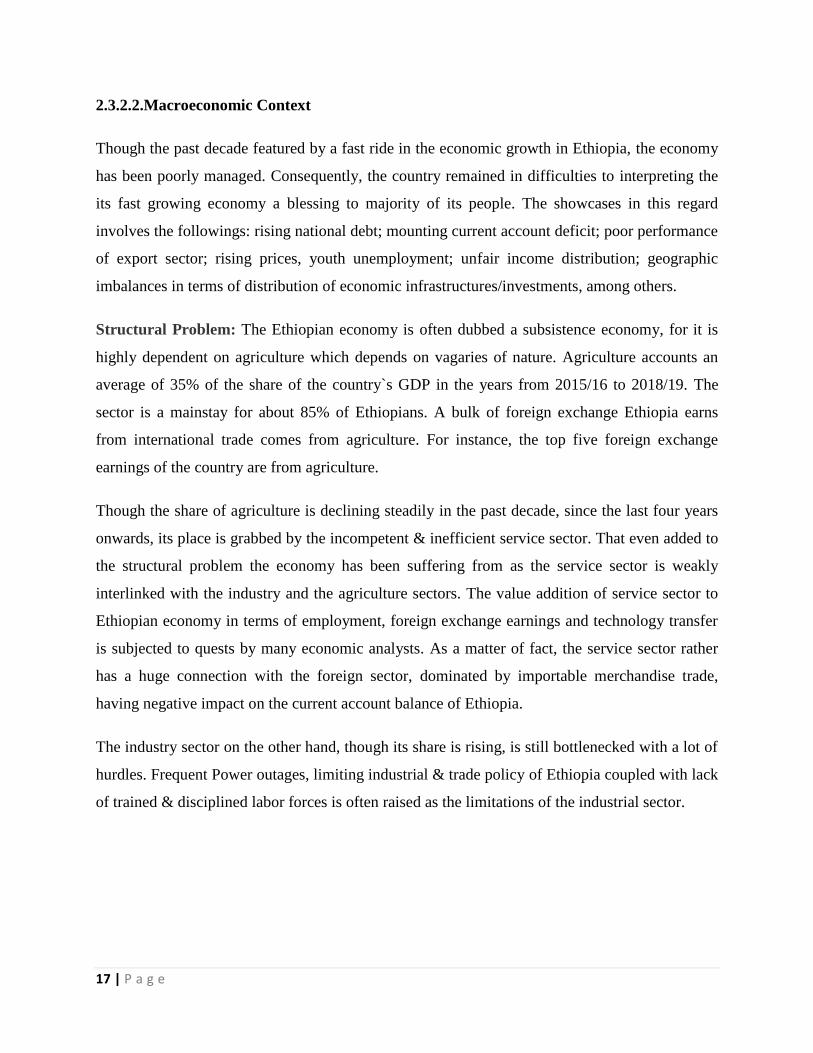
Though the past decade featured by a fast ride in the economic growth in Ethiopia, the economy
has been poorly managed. Consequently, the country remained in difficulties to interpreting the
its fast growing economy a blessing to majority of its people. The showcases in this regard
involves the followings: rising national debt; mounting current account deficit; poor performance
of export sector; rising prices, youth unemployment; unfair income distribution; geographic
imbalances in terms of distribution of economic infrastructures/investments, among others.
Structural Problem: The Ethiopian economy is often dubbed a subsistence economy, for it is
highly dependent on agriculture which depends on vagaries of nature. Agriculture accounts an
average of 35% of the share of the country`s GDP in the years from 2015/16 to 2018/19. The
sector is a mainstay for about 85% of Ethiopians. A bulk of foreign exchange Ethiopia earns
from international trade comes from agriculture. For instance, the top five foreign exchange
earnings of the country are from agriculture.
Though the share of agriculture is declining steadily in the past decade, since the last four years
onwards, its place is grabbed by the incompetent & inefficient service sector. That even added to
the structural problem the economy has been suffering from as the service sector is weakly
interlinked with the industry and the agriculture sectors. The value addition of service sector to
Ethiopian economy in terms of employment, foreign exchange earnings and technology transfer
is subjected to quests by many economic analysts. As a matter of fact, the service sector rather
has a huge connection with the foreign sector, dominated by importable merchandise trade,
having negative impact on the current account balance of Ethiopia.
The industry sector on the other hand, though its share is rising, is still bottlenecked with a lot of
hurdles. Frequent Power outages, limiting industrial & trade policy of Ethiopia coupled with lack
of trained & disciplined labor forces is often raised as the limitations of the industrial sector.
18 | P a g e
Figure 2: Sectorial Share of GDP (2015/16-2018/19)
As of recent years in particular, the Ethiopia economy experienced volatilities. That was
pertaining to a number of shocks, which can be categorized as natural and human made. Natural
shocks, which appeals to the agriculture sector, were drought in past three years in the country
affecting agriculture yields.
As agriculture in Ethiopia is highly a rain fed, the sector is already exposed to natural shocks,
where seasons of droughts almost comes and go roughly every five years. Those challenges were
added up by a locust swarm affecting large tract of cultivations on the field as of last years and
continuing this year too.
Recent Developments in Macroeconomic Management: Home Grown Economic Reform Plan.
The growth episode of Ethiopia is largely explained by massive public investment in
infrastructural development. The state-led development model of the country though cannot be
totally discredited, had a number of flaws. For one, servicing public investments was entirely on
foreign debt. While the stock of the external debt growing fast, poor project execution along with
disappointing export performance prompted the IMF and World Bank to rate Ethiopia‘s external
debt burden as a high risk of distress. That greatly undermined the country‘s credit standing and
borrowing ability.
Sectorial Share (as %of GDP) between2015/16-2018/19
Agriculture
Industry
Service

19 | P a g e
Though the economy has been on a rise in the last decade, it was far less inclusive in a sense that
the role of domestic private sector where crowd-out effect of public investment on the scene.
The public sector failure is characterized by growing caps on the scope of economic growth
where the public sector, the major driver of the economy, faced up with required financial and
institutional/bureaucratic fallouts.
As a reflection of the aforementioned macroeconomic distortions, sovereign debt rose to an
estimated 58% of GDP; government budget deficit of 3.7% of GDP; trade deficit of 12.4% of
GDP and a current account deficit of 4.5% of GDP in 2018.
In light of addressing those macroeconomic problems, a new leadership installed in 2018, which
is led by Abiy Ahmed Ali (PhD) enacted stringent fiscal and/or financial measures, where the
monetary policy tightened and public sector credit policies were introduced. According to IMF
(2018), those tight macroeconomic policy directions and reforms being made to open up the
economy by Ethiopian government may have slowing down effect on the growth of the
economy, but enables to control inflation, enhance the optimal usage of foreign currency.
Those policy reforms of the newer government in Ethiopia were complemented by a recently
introduced Home Grown Economic Reform Plan. The home grown economic reform plan is
set to tackle the cumulated problems of Ethiopian economy in the past plus decade years. A three
years plan commencing 2019, this reform plan costs the country 10 billion USD.
According to IMF (2018), those recent policy developments in Ethiopian economy sustains the
economy by helping fix key structural bottlenecks that hamper the economic growth in the
medium to long term period.by spurring private investment and productivity gains and reduce
external and domestic vulnerabilities. In addition, the proposed policies would substantially
reduce the risk of sudden financial and real economic disruptions— hence fostering domestic
private sector development and FDI (IMF, 2018)
However, the COVID-19 appeared at this critical time where Ethiopia has started implementing
those hosts of policy reforms aimed at healing the cumulated fractures of the economy in the past
decade or so.

20 | P a g e
Indeed, the COVID-19 pandemic inevitably poses bleak future, even adding to the woes of
Ethiopian economy, let alone realizing the reform plan
2.3.2.3.Socio-economic Context
The immediate requirements to endure in times of COVID-19 are worryingly low in Ethiopia.
The larger segment of the population lives on a daily starving income level. A sizable portion of
the population struggles with limited access to food, water and housing provisions. 58% of the
population lack access to clean water, 89% live without safe toilets, and 55.7% survive without
electricity and 48 million people live further than 2Km from all-weather road.
Moreover, the country`s health care system is too primitive and fragile to cope up the preventive
methods prescribed by the World Health Organization (WHO). The per capita hospital bed is
3150. The nurse to population ratio is 1 to 1624.
Worse of all, the major segment of the population to the pandemic, the urbanites, are very ill
prepared to fight the virus. In urban areas, provisions on basic amenities to prevent the disease
like water is even below the national average.
With the existing poor socio-economic status of the people, it would be far-fetched for Ethiopia
to withstand tremendous shocks posed by COVID-19. .
Table 2: Major Indicators on Socio-economic Status of Ethiopians
Socio-economic Indicator 2011 E.C
Health Indicators
People : Hospital Beds 3150:1
People : Nurse 1 1624:1
Access to Safe Drinking Water
Country level (in %) 76
Urban population 66
Rural Population 79
Access to Housing
Number of Rooms Per National Average Households size9 0.88
Based on NBE (2019) and CSA (2016)
9Average National Household Size in Ethiopia

21 | P a g e
2.3.2.4.Demographic Context
Ethiopia is the second largest country in Africa, with population size estimated 120 million in the
year 2020. Ethiopia can be regarded as a country of youths. The fertility rate in the country is
about 3.45 children per woman (mother). And the natural rate of population increase10
in
2018/19 was 2.07 per cent. The age structure shows that nearly 60% of Ethiopians are within the
working age bracket, necessitating the country to look for absorbing this large section of society
into productive means like provision of access to education and/or provide job.
Though Ethiopian society is much rural (with percentage of rural population to urban population
is 79: 21), the urban population is fast growing pertaining to pushing and pulling factors which
speed up the rural-urban migration. The influx of people into the urban centers is largely driven
by pushing factors in the rural areas
In this regard, the major pushing factor is limited scope of rural economies to diversified
livelihoods beyond farming/animal husbandry, leaving the ever rising youth without farm land.
As a result, the rural youth is forced to destine to towns and cities in search of employment
opportunities. Worse for rural migrants in cities is a dire working conditions is not just far below
their expectations but also below the standards. Industrial employments are with a starving wage,
and the working condition is too unsafe and undignified. That in turn pushes the rural-urban
migrants to look for crossing borders of Ethiopia, often eying their destinations to be Arab states
in the Gulf and the European countries.
The pain and stress of Ethiopian migrants to Arab countries has been reported by international
and local agencies. Many youth remained sunken in seas and oceans. For those who crossed
dangerous sea/ desert voyages and reached the host countries, life is far below their expectations.
The tragic reality is that the working condition and payments for those crossed borders is next to
slavery. This particularly appeals to Ethiopian economic migrants destined to Middle Eastern
Arab countries.
A recent showcase on that is the grief of Ethiopians in Yemen, Saudi Arabia, Qatar, United Arab
Emirates (UAE) and Lebanon. In connection to COVID-19 pandemic, Ethiopian migrants in
10
Natural Rate of Population Increase is computed as crude death rate less crude birth rate

22 | P a g e
those countries, many of them dubbed ‗illegal, have been left helpless on streets in bad days,
while they have been exploited in good days (pre-corona days). Too many of them were set to
live and get deported in this pandemic days, where too many of them were forced to survive in
dangerous conditions that would exposed to COVID-19. This is a recent memory grabbing the
international media to the disgrace of the country, Ethiopia.
Those tragic showcases of massive unemployment and youth migration are the tragedy of
mismanaged socio-economic and political governance in Ethiopia in the past decades or so.
Circumstantial evidences from the profile of the country in the past five years are boldly telling
the price of those mismanagements. The youth movement that forced the incumbent EPRDF to
undertake reforms, but it seems too little too late.
At this juncture at least, unresolved youth quests cannot be underestimated as socio-economic or
political problems, but goes beyond risking the national security of the Ethiopia. For a country
which is already trapped in economic and political woes, COVID-19 pandemic is only added on
those complexities.
Table 3: Major Demographic Indicators on Ethiopia
Demographic Indicator 2011 E.C
Population (In Millions) 97.6
Working age Population
Urban 10.1
Rural 49.8
Total 59.9
Age Dependency Ratio 69
Natural Rate of Population Increase (in %) 2.07
Total Fertility Rate 3.45 Chil:W
Average Household Size 6.07
Based on NBE (2019) Chil: W refers an average children a mother gives
birth
The intent of such analysis is not motivated by a blind judgment or pessimistic mindset of the
author, but triggered by a pragmatic concern to investigate the breadth and width of the problem
sparked by COVID-19 pandemic in Ethiopia.

23 | P a g e
3. METHODOLOGY OF THE STUDY
This part of the study locates on key methodological elements that the study used while making
analysis and inferences pertaining to its objectives already defined under chapter one. The core
aspects subject of discussions of this section would be the following two components of analysis
and inferences:
Data Sources, tools and Techniques of Data Collection
Method of analysis and Inference
3.1.Data Types, Data Sources and Tools of Data Collection
The study relied on both primary and secondary data sources to making analysis and inferences.
As the study encompasses both qualitative and quantitative elements, the data used to draw
inferences were based on qualitative and quantitative data sources.
3.1.1. Primary Data
The primary sources will be expert analytics given for media outlets (both local & international)
on the impact of Covid-19 on Ethiopian and the African economy. The author is also looking for
in-depth interviews from senior economists at the helms of economic research and economic
policy on Ethiopia.
3.1.2. Secondary Data Sources
The quantitative data relies from secondary data sources. The secondary sources of study are
latest reports on Ethiopian economy from broader local and international sources: Like National
Bank of Ethiopia (NBE), Ethiopian Development Research Institute, Ethiopian economics
Association, Ministry of Finance and Economic Cooperation (MoFEC), Ethiopian Planning
Commission, among others.
3.2.Conceptual Framework and Techniques of Analysis and Inferences
The study integrates both qualitative and quantitative techniques to analyze the data and make
inferences. The whole set of analysis and inference made in this study relies on circular flow of
economy. For this study, linkage in economic sectors/factors of productions/agents is based on

24 | P a g e
framework of World Bank Group that was used to construct the latest Input-output Matrix or
SAM matrix for Ethiopia (Andualem et al, 2020)
Figure 3: The Transmission Mechanism of COVID-19 Uncertainty shock
3.3. Techniques of Analysis and Inferences
The study employs both descriptive and econometrics techniques to analyze the data. The study
relies on the essentials of macroeconomic policy approach to draw of inferences to best address
the core objectives outlined. As such, narratives integrate positive and normative approach while
making analysis and inferences. Positive approach of making analysis involves making a
diagnostic look on the scale of damage of COVID-19 uncertainty shock on Ethiopian economy.
The normative aspect of analysis is meant to propose a viable policy options to mitigate the
macroeconomic instabilities as result of the pandemic shock effect.
By way of organizing and reporting the results of data analysis, the study adopted a framework
proposed by UNCTAD (2020) and UN-ECA (2020) (UNCTD, 202). Accordingly, narratives on
impact of COVID-19 on the Ethiopian economy are analyzed on three dimensions: The Domestic
Sector, The Foreign Sector and the policy circle.

25 | P a g e
Econometrics Model
To estimate on the seize and dimensions of effect of COVID-19 shock on macroeconomic
stability, the study relied on Dynamic stochastic general equilibrium models (DSGE) or
Bayesian Vector Auto-regressions (BVAR).
Bayesian Vector Auto-regressions (VARs) are linear multivariate time-series models able to
capture the joint dynamics of multiple time series (Miranda-Agrippin, S. and Ricco, G.; 2018)
The earliest studies employing Bayesian VARs (BVARs) to macroeconomic forecasting are
found in Letterman (1979) and Doan et al. (1984) Since then, VARs and BVARs have been a
standard macro-econometric tool routinely used by scholars and policy makers for structural
analysis, forecasting and scenario analysis in an ever growing number of applications.
Empirical evidences on the uncertainty shock effect of COVID-19 on macroeconomic stability
increasingly suggest Dynamic stochastic general equilibrium models (DSGE) or BVAR produces
produce sound results (For instance see Leduc and Liu (2020); Watanabe (2020); Ozili (2020)
and PINSHI (2020); Alemayehu G. (2020); Kiku, Oscar (2020)
The BVAR model to be estimated in this study is defined as follows:
∑( )
Where:
= Vector of Macroeconomic & Fiscal Policy Indicators and World Pandemic Uncertainty
Index (WPUI)
= Vector of residuals of reduced form at time t.

26 | P a g e
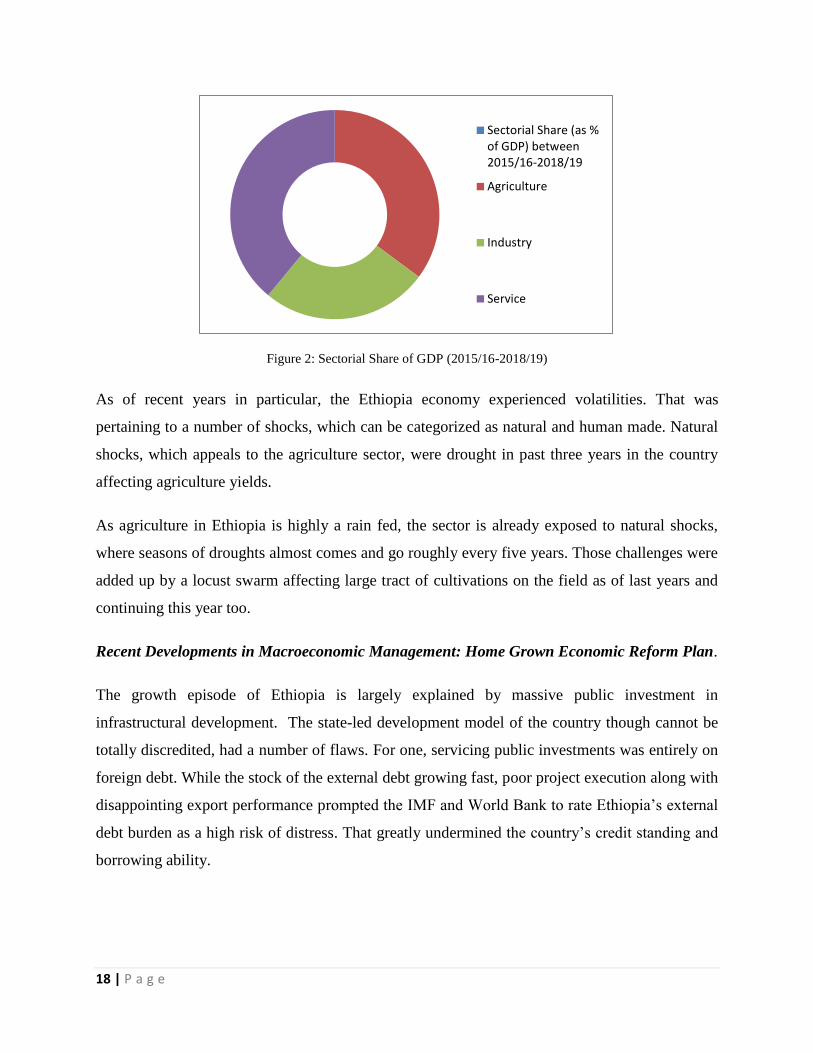
3.3.1. Definition of Model Variables
The COVID-19 first time shock and uncertainty shock is estimated and forecasted using data on
core macroeconomic variables defined in the preceding section. Time series data set consists 46
quarters (Qs), where data on macroeconomic variables gathered spanning in the period between
2008/09 Q1 and 2019/20 Q2 was considered. In time series regressions, high frequency data set
is preferred over low frequency data set is preferred because to remove seasonality of variables
and to reduce the impact of high frequency measurement errors (Baker, Scott R. et al, 2020)
The BVAR model is structured by variables indicating all aspects of the economy: the aggregate
demand, aggregate supply, Genera Price Level, current account balance, policy and economic
uncertainty indicators.
Aggregate Demand Indicators: Aggregate Investment Expenditure (domestic and
foreign direct investments).
Aggregate Supply Indicators: Employment
General Price Level Indicators: Food Price Index (CPIF), Non-food Price Index
(CPINF), Transport Interest Rate and Exchange Rate (of Birr against USD).
Current Account Indicators: Export earnings and Import expenditures
Fiscal Policy Indicator: Government Expenditure (sum total of recurrent & capital
expenditures)
COVID-19 Shock Indicator: the uncertainty impact of COVID-19 is tapped by the
World Pandemic Uncertainty Index on Ethiopia (WPUI) a proxy variable. The data on
WPUI is accessed from www.worlduncertainityindex.com,. The study employed the
WPUI estimates from 2008 Q3 (2008/09 Q1 in E.F.Y) to 2020 Q1 (2019/20 Q3 in
E.F.Y).
27 | P a g e
Table 4: Definition of Model Variables:
S/No Variable Definition Measurement Time Period
(In Ethiopian Fiscal Year)
Number of
Observations
1 World Pandemic
Uncertainty Index
(WPUI)
A Proxy Measure of CIVID-
19 Uncertainty Shock Impact
The index is
constructed by
counting the number of times a word related
to pandemics is
mentioned in the Economist Intelligence
Unit country reports.
Specifically, the index is the percent of the
words related to
pandemic episodes in EIU country reports,
multiplied by 1,000. A
higher number means
higher discussion
about pandemics and
vice versa.
2008/09 Q1-
2019/20 Q2
Uncertainty is associated to total
count of five pandemics namely:
SARS, Avian Flu, Swine Flu, MERS, Bird Flu, Ebola and
Coronavirus between 1996Q1 to
2020Q2
2 Import Quarterly Value of Imports,
by Major Commodity Groups
In Million USD 2008/09 Q1-
2019/20 Q2
3 Non-Food Price Indices
(COMMUNICATIO
N;TRANSPORT; EDUCATION;
HOTELREST
Quarterly National Non-Food Consumer Price Index,
Indexed 2008/09 Q1-2019/20 Q2
Quarterly average price index for the following list of products:
Communication, Transport,
Education, Health, Hotel & Restaurant
4 Food Price Index
(CPIF)
Quarterly National Food
Consumer Price Index,
Indexed 2008/09 Q1-
2019/20 Q2
Quarterly average price index for
the following list of products:
Bread and Cereals; Meat; Fish & Sea Food; Milk, Cheese & Egg;
Oils & Fats; Fruits; Vegetables;
Sugar, Jam, Honey, Chocolate & Confectionery; Food Products;
Non-Alcoholic Beverages
5
Investment
(INVST)
Investment Capital of
Domestic and Foreign
Projects Approved by agriculture, industry, and
service Sectors in the quarter
In Million Birr
2008/09 Q1-
2019/20 Q2
6 Export Quarterly Value of Exports,
by Major Commodity Groups
In Million Birr 2008/09 Q1-
2019/20 Q2
7
Employment (EMPLOYPG)
Number of Employment (Permanent and Temporary)
opportunities Created by
Approved Domestic and Foreign Investment Projects
with more than 250,000 birr
registered capital in the quarter
In number
Consumer Price Index
2008/09 Q1-2019/20 Q2
9 Government Expenditure
(GOVTEXPEND)
Quarterly Government expenditure (on recurrent &
capital expenditures and
regional transfers)
In Millions of Birr 2008/09 Q1-2019/20 Q2

28 | P a g e
Harmonizing the Data Set
All quarterly dataset but World Pandemic Uncertainty Index (WPUI) was secured from the local
sources. In Ethiopian context, there is difference between fiscal year and calendar year. The
fiscal year starts in the month of July (HAMLE 1, in Ethiopian Calendar), while calendar year
begins in month of September (MESKEREM 1). For obvious reason, fiscal year is considered in
the time series dataset. The four quarters of the Ethiopian fiscal year are: Quarter One: July,
August and September; Quarter Two: October, November and December; Quarter Three:
January, February and March; Quarter Four: April, May and June
Quarterly data on WPUI is secured from foreign sources, based on Gregorian calendar. The
months/quarters of the fiscal year as in Gregorian calendar are as follows: Quarter One: January,
February and March; Quarter Two: April, May and June; Quarter Three: July, August and
September; and Quarter Four: October, November and December.
Hence, the first and last quarters of all data sets on WPUI was customized to Ethiopian fiscal
year. As such, in the data used for regression on WPUI variable, observation in the third quarter
of 2008 in the Gregorian calendar was taken to hold the first quarter (first observation) of start
year for time series data i.e.2008/09. The data on WPUI from the source as i.e.2020 Q1 was
taken as the last observation in the data set i.e. 2019/20 Q2 in Ethiopian fiscal year.
All observations on model variables except World Pandemic Uncertainty Index (WPUI) were
transformed into logarithmic value before regression was made.
BVAR Statistical Tests
Before undertaking VAR estimation and prediction, each model variables were subjected to
seasonality and Unit Root Tests.
Seasonality Test
When a time series data is measured for high frequency series, like monthly or quarterly, they
may contain pronounced seasonal variations. The seasonal component in time series refers to
patterns that are repeated over a period and that average out in the long run. The patterns that do
not average out are included in the constant and the trend components of the model; whereas the

29 | P a g e
trend is of importance in the long term forecasting, the seasonal component is very important in
short term forecasting as it is the main source of short run fluctuations.. In this study, all model
variables are seasonally adjusted before estimation in VAR was made.
Unit Root Test
Spurious regression problem is common in time series regressions. Hence, setting the right order
of integration of each time series data has to be made before VAR regression. The unit root test
helps to set the order of selection, hence to detect and avoid spurious regression problem. To that
end, the order of integration of each time series variable was made.
There are different Unit Root Test criteria. The most widely used selection criteria is Augmented
Dickey-Fuller (ADF) test. Summary of Unit Root Test for model variables is depicted under
table below
Table 5: Summary of Unit Root Test for model variables
S/No Variable Variable (Seasonally
Adjusted and Log
Transformed)
ADF, I(1) 1%
(Critical
Values)
5%
(Critical
Values)
10%
(Critical
Values)
1 Import LNIMPORT* -7.973821 -3.5889 -2.9303 -2.6030
2 Export LNEXPORT** -7.530118
-3.5930
-2.9320
-2.6039
3 Food Price Index LNCPIF* -3.634257 -3.5889 -2.9303 -2.6030
4
Communication Price
Index
LNCOMMUNICATIO
N*
--6.224109
-3.5889
-2.9303
-2.6030
5 Education Price Index LNEDUCATION* -3.617568
-3.5889 -2.9303 -2.6030
6 Employment LNEMPLOYG* -6.375550
-3.5889 -2.9303 -2.6030
7 Government
Expenditure
LNGOVTEXPEND* -4.967246
-3.5889 -2.9303 -2.6030
8 Health Price Index LNHEALTH* -5.328321
-3.5889 -2.9303 -2.6030
9 Transport Price Index LNTRANSPORT* -4.741770
-3.5889 -2.9303 -2.6030
10 Hotel & Restaurant
Price Index
LNHOTELREST** -5.839783
-3.5930
-2.9320
-2.6039
11 Investment LNINVST* -5.396353 -3.5889 -2.9303 -2.6030

30 | P a g e
12 World Pandemic
Uncertainty Index
WPUI***
-2.701929
-3.5850
-2.9286
-2.6021
*Variable Qualify for Regression with first Order of Integration, I(1) with 1% level of significance
**Variable Qualify for Regression with second Order of Integration, I(1) with 1% level of significance
***Variable Qualify for Regression at level Order, I(0) with 10% level of significance
The ADF test shows that the order of integration for all model variables except World Pandemic
Uncertainty Index (WPUI) is one i.e. I (1). The result on ADF Test shows that all variables
qualifies for regression at order one I(1); and the WPUI qualifies at level i.e. I (0).

31 | P a g e
Ordering of Model Variables
A Cholesky decomposition requires the variables to be ordered in a particular fashion, where
variables placed higher in the ordering have contemporaneous impact on the variables which are
lower in the ordering, but the variables lower in the ordering do not have contemporaneous
impact on the variables those are higher in the ordering.
In essence, ordering of variables in VAR model estimation dictated by theoretical and/or
empirical evidences on the subject of analysis. Contextual factors are also key aspect of ordering
of model variables. In this study, both theoretical/empirical and contextual factors pertaining the
COVID-19 shock and particular feature of Ethiopian economy were integrated to conceptualize
the ordering of model variables.
As a matter of fact, COVID-19 uncertainty shook is an exogenous variable, and its effect on the
economy, at least in the short run, is interpreted in its effect on macroeconomic stability. In
essence, COVID-19 shock direct and immediate effect on the economy is via distorting the
supply chain. Supply chain distortion effect in return spills over in to the domestic economy by
distorting import sector. Distortions in import quickly transmitted into the economy by affecting
transport/logistics sectors. As Ethiopian domestic supply chain is largely dependent on
importable for consumption and investment goods, COVID-19 impact on macroeconomic
stability of Ethiopia is felt at the earliest via import and transport/logistics shocks.
The effect of the pandemic via supply chain shocks is quickly transmitted into disturbing the
aggregate demand.
As such, both aspects of aggregate demand i.e. consumption and investment demands
(expenditures) affected by supply chain distortions. In this regard, while prices on basic
consumption items (like food and medical/pharmaceuticals) are expected to sky rocketed as
people rush to hold for uncertain future. On the other hand, demand for investment goods is
expected to decline, whose effect would be in dwindling down prices on investment goods.
Supply chain distortions also have upward pressures on the cost of doing businesses by soaring
key inputs (soft and hard inputs) in investment undertakings. While supply chain shock effect is
translated into demand side shocks via consumption & investment expenditures price volatilities

32 | P a g e
is expected in the process. As Ethiopian investment sector is growing to be export oriented, the
effect of the pandemic on investment is quickly translated into affecting export earnings
(performance of export sector).
The combined effects of supply chain and demand distortions takes its toll into the economy by
affecting real variables mainly the employment creation capacity of the economy.
To mitigate the COVID-19 pandemic shock effect on the pillars of the economy, government
interventions in the economy is expected to grow. Indeed, one of the legacies of COVID-19, as
depicted in many studies so far, is reminding for the crucial role of government sector. In
Ethiopian context too, as depicted in COVID-19 recovery package, the government is set to
intervene to mitigate the effect of virus by indulging in massive fiscal stimulus plan.
In lieu of the illustrations made in the previous paragraphs, the order of variables in the VAR
estimation in this study assumes the following:
WPUI IMPORT TRANSPORT FOOD & NON-FOOD PRICES INVESTMENT EXPORT
EMPLOYMENT GOVERNMENT EXPENDITURE (FISCAL POLICY)
Predicting COVID-19 Shock Impact Using BVAR Model: Impulse Response Function (IRF)
Impulse response functions can be used to produce the time path of the dependent variables in
the VAR, to shocks from all the explanatory variables. If the system of equations is stable any
shock should decline to zero, an unstable system would produce an explosive time path.
In this study, COVID-19 uncertainty shock impact is estimated instrumenting World Pandemic
Uncertainty Index on Ethiopia (WPUI) over macroeconomic indicators integrated in BVAR
model. Hence, the Impulse Response Function (IRF) is generated from BVAR estimation. The
result on Impulse Response Function (IRF) of each endogenous variables of the model in
response to one standard deviations of WPUI is presented in graphs.
The span of prediction period is set to be 14 quarters or Three years and two months since
January 2020 (or MEGABIT, 2012 E.C)

33 | P a g e
The COVID-19 Shock Transmission Mechanism into the Economy Using BVAR
To depict on the transmission mechanism of the pandemic uncertainty shock, the BVAR
Variance Decomposition was estimated. Variance Decomposition is an alternative method to the
impulse response functions for examining the effects of shocks to the dependent variables. This technique
determines how much of the forecast error variance for any variable in a system, is explained by
innovations to each explanatory variable, over a series of time horizons. Usually own series shocks
explain most of the error variance, although the shock will also affect other variables in the system.
In this study, the result of Variance Decomposition on each endogenous variables of the model in
response to one standard deviations of WPUI is made is presented in tables.
Investigating the Role of Fiscal Policy for Macroeconomic Stability
In this study, the role of fiscal policy to mitigate COVID-19 driven macroeconomic instability on
Ethiopian economy is examined by instrumenting fiscal policy shocks against key
macroeconomic variables integrated in VAR model used. Expansionary fiscal policy instruments
examined in this study are increasing government expenditure and reducing import tariffs. By
way of illustration, impulse response of key macroeconomic stability indicators to COVID-19
shock (the disturbance factor) and the expansionary fiscal policy shocks (counter disturbance
factors) is presented.

34 | P a g e
4. RESULTS AND DISCUSSION
For over a decade, Ethiopian economy has been on a rise, with average growth rate 10.1%
between 2003 and 2019, the country`s economy is still unable to put structural transformation
that would withstand shocks attributed to natural and non-natural shocks. Rain fed agriculture is
the major pillar of the economy in terms of employment, foreign trade and domestic supply
chain.
It is amidst those prevailing real economic shocks that the country is faced with another more
turbulent shock, this time COVID-19 pandemic shock. The effect of COVID-19 to Ethiopia
further adds up to the woes of the mentioned structural problem and susceptibility of the shock.
But how deep would the COVID-19 pandemic be in the short run period? How would COVID-
19 shock impact the Ethiopian economy? Where is the transmission mechanism of the economic
pandemic? This chapter tries to address on those and related topics.
35 | P a g e
4.1.COVID-19 SHOCK EFFECT ON MACROECONOMIC STABILITY IN ETHIOPIA
The finding of the study reveals that the COVID-19 impact lasts at least three years to shake the
economy of Ethiopia.
Essentially the COVID-19 immediate impact is on international transactions of the country,
hence the supply chain distortions. As Ethiopia relies heavily on import to supply on basic items
for consumption and investment demands, the immediate damage effect of COVID-19 would be
distorting supply chain. The study result reveals that pandemic Shock on supply chain quickly
transmitted into aggregate demand, where a slum in aggregate demand expected to prevail at
least in the coming three years since 2020.
4.1. COVID-19 Uncertainty Shock Effect on Import Demand in Ethiopia (2013-2015 E.C)
The VAR estimate indicates that COVID-19 uncertainty shock results a massive rise in import in
the second half of 2019/20 Ethiopian Fiscal Year (E.F.Y) or (2019/20 Q3 and Q4). In the period
between months of January-June 2020 (TIR-SENE 2012 E.C), import demand is expected to
grow by 4.17 billion birr. The finding in this regard is expected, as the pandemic triggers
massive demand in food and pharmaceuticals, for which Ethiopia is import dependent on both
items.
The magnitude & direction of COVID-19 shock effect on import demand in the last two quarters
of 2019/20 E.F.Y is not the same. In the months from TIR-MEGABIT 2012 E.C. (i.e. the third
quarter of 2019/20 E.F.Y) import demand will decline by 1.71 billion birr. This reduction is
expectedly due to immediate restrictive measures taken by countries worldwide (including
countries where Ethiopia depends for its imports) after World Health Organization declared
COVID-19 outbreak a Public Health Emergency of International Concern on 30 January 2020.
However, the decline in import in the period TIR-MEGABIT 2012 E.C is expected to be off-
settled by a massive increase in the next quarter i.e. MIAZIA-SENE 2020 E.C), where forecast
estimate puts an increase of import demand by 5.89 billion birr in this period.
This overwhelming in import demand between the months of MIAZIA- SENE/ 2012 E.C may be
attributed to two interrelated factors: the momentum effect and the inelasticity nature of
Ethiopian import items.

36 | P a g e
Figure 4: Dynamic Response of Import to COVID-Uncertainty Shock
The momentum effect captures the pressure of a reduction of import in the first quarter puts on
import in the second quarter. COVID-19 triggered major import partner countries of Ethiopia to
remain in shut down for over three months so. And a halt in import in the first quarter is
expected to have momentum effect on the second quarter. On top of that, Ethiopia is net
importer on two basic commodities required to deal with coronavirus pandemic days:
pharmaceuticals and food items. That explains why import shows a rise in the second quarter of
forecast period.
Figure 5: Estimated Effect of COVID-19 Uncertainty Shock on Import (Millions of Birr)
(Author`s Computation based on VAR Forecast via Impulse Response Function)
In the year 2013 E.C, as a result of COVID-19 uncertainty effect, import declines by 2.68 billion
birr. Decline in import continues in 2014 E.C too, with an estimated decline in import values by
2.06 billion birr. A decline in imports in the successive years (2013-2014 E.C) is explained by
-0.3
-0.2
-0.1
0.0
0.1
0.2
0.3
1 2 3 4 5 6 7 8 9 10 11 12 13 14
Response of Import
to One S.D. WPUI Innovation
-6000
-4000
-2000
0
2000
4000
6000
Estimated Effectof COVID-19UnceretaintyShock on Import(Millions of Birr)
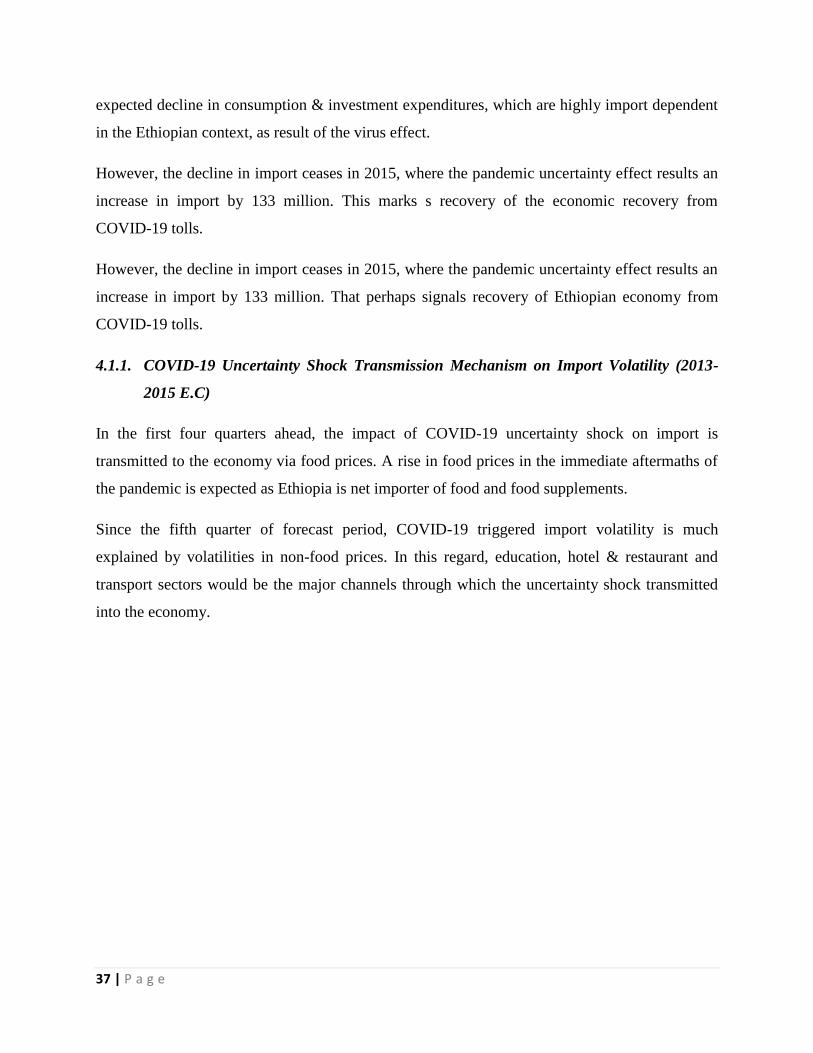
37 | P a g e
expected decline in consumption & investment expenditures, which are highly import dependent
in the Ethiopian context, as result of the virus effect.
However, the decline in import ceases in 2015, where the pandemic uncertainty effect results an
increase in import by 133 million. This marks s recovery of the economic recovery from
COVID-19 tolls.
However, the decline in import ceases in 2015, where the pandemic uncertainty effect results an
increase in import by 133 million. That perhaps signals recovery of Ethiopian economy from
COVID-19 tolls.
4.1.1. COVID-19 Uncertainty Shock Transmission Mechanism on Import Volatility (2013-
2015 E.C)
In the first four quarters ahead, the impact of COVID-19 uncertainty shock on import is
transmitted to the economy via food prices. A rise in food prices in the immediate aftermaths of
the pandemic is expected as Ethiopia is net importer of food and food supplements.
Since the fifth quarter of forecast period, COVID-19 triggered import volatility is much
explained by volatilities in non-food prices. In this regard, education, hotel & restaurant and
transport sectors would be the major channels through which the uncertainty shock transmitted
into the economy.

38 | P a g e
4.2.Forecasting COVID-19 Uncertainty Shock Effect on Export Earnings (2013-2015)
The uncertainty impact of COVID-19 on export is another focus of inquiry of this study. The
dynamic time path of forecast effect of COVID-19 on export earnings of Ethiopia is depicted in
Impulse Response Graph below.
Figure 6: Dynamic Response of Export Earnings to COVID-Uncertainty Shock
As we learn from IRF graph, export thoroughly declines in all forecast periods. The loss in
export earning is massive three months starting TIR- MEGABIT 2012 E.C, where export
earnings declines by 5.85 Billion birr.
Figure 7: Forecast Effect of COVID-19 on Export Earning (Millions of Birr)
(Author`s Computation based on VAR Forecast via Impulse Response Function)
In the first six months since January 2020 (TIR/2012), an estimated 6.5 billion birr will be lost as
a result of COVID-19 uncertainty shock effect. The study forecasts export to decline by 597.7
-30
-25
-20
-15
-10
-5
0
5
1 2 3 4 5 6 7 8 9 10 11 12 13 14
Response of Export
to One S.D. WPUI Innovation
-8000 -6000 -4000 -2000 0 2000
2019/20 Q4
2020/21 Q2
2020/21 Q4
2021/22 Q2
2021/22 Q4
2022/23 Q2
2022/23 Q4
ForecastEffect ofCOVID-19on ExportEarning(Millions ofBirr)

39 | P a g e
million birr April-June 2020 (MIAZIA-SENE 2012 E.C). This finding fits (only with forecast
error of 3.5%) the forecast estimate made by Ministry of Finance of Ethiopia in April 2020,.
According to Ministry of Finance of Ethiopia, export earnings are expected to fall by 30% (576
million birr) between March and June 2020 compared to earnings from exports in the same
period in 2019 (which was 19.2 billion birr) (FDRE Ministry of Finance, 2020)
The decline in export keeps between July and September 2020 (HAMLE 2012-MESKEREM
2013 E.C).
In the year 2013, export loss due to COVID-19 shock is estimated to reach 4.8 billion birrs. The
total loss in export in the first six months of 2013 E.C will be 3.5 billion birr. In next half year
following, the predicted loss in export earnings in estimated at 1.34 billion birr. The impact of
the pandemic on export earnings of Ethiopia shows a progressive decline in 2014 E.C. The total
loss as a result of pandemic shock effect in 2014 E.C. is forecasted to reach 709.71 million birr.
In the year 2015, the damage cost of COVID-19 on export earnings of Ethiopia is estimated at
557 million birr.
The pandemic uncertainty effect on export, though shows a steep decline, remains to be felt up
until 2017 E.C.
4.2.1. COVID-19 Uncertainty Shock Transmission Mechanism on Export Expenditure
Volatility (2013-2015 E.C)
The pandemic effect on export earnings of Ethiopia, at least in the coming three years, is largely
explained by the duration of the pandemic period itself. As such, pandemic shock explains an
average of 65.66% of variation (decline) in export earnings. A result from variance
decomposition result also reveals that transport and investment shocks another mechanisms
COVID-19 uncertainty effect transmitted into the export sector between the years 2012-2015
E.C.

40 | P a g e
4.3.Forecasting COVID-19 Uncertainty Shock Effect on Investment Expenditure
One of the impacts of COVID-19 is its toll in downsizing key components of aggregate demand,
consumption and investment expenditures. In uncertain times like our days, both households and
firms prefer to withhold their cash. Households would set aside cash in their hands for food and
basic amenities. Firms too, refrain from spending to build-up their capital stock. Overall, both
consumption and investment demands are expected to slump in the pandemic period.
In this study, the impacts of COVID-19 on the aggregate demand in Ethiopian economy is
investigated through the pandemic`s effect on investment expenditure, one component of The
study found out that COVID-19 driven investment volatility lasts three years. To examine on
investment expenditure dynamics between TIR/2012 and SENE 2015, changes to Investment
expenditure to one standard deviation of World Pandemic Uncertainty Index is generated using
VAR Impulse Response Function (IRF).
Figure 8: Dynamic Response of Employment to COVID-Uncertainty Shock
According to forecast estimate made, the total damage on investment expenditures from TIR
2012- SENE 2015 will be 1.9 billion birr (63.95 Million USD). The finding further reveals that,
in the coming three years at least, investment performance is largely determined by the length of
the pandemic period (pandemic uncertainty effect), explaining on average 56% of loss in
investment expenditure. The result is in compatible with investment theories and empirics, where
uncertainty what so ever is the major shock variable affecting investment. Next to pandemic
uncertainty factor, transport and export sectors are also the major shock variables in 2012-2014
-5
-4
-3
-2
-1
0
1
1 2 3 4 5 6 7 8 9 10 11 12 13 14
Response of Investment
to One S.D. WPUI Innovation
41 | P a g e
E.C. In 2015, investment is largely affected by hotel & restaurant prices and government
expenditure shocks.
The size of investment expenditure losses and the dynamic impacts of major determinants of
investment performances vary across different quarters/years in the prediction period (in the next
three years). Investment expenditure steeply declines in the upcoming two years since TIR 2013.
The biggest loss forecasted to hold between months of January (TIR) and (MEGABIT) 2012
E.C., where an estimated 443.82 million birr worth of investment expenditure decline is
expected.
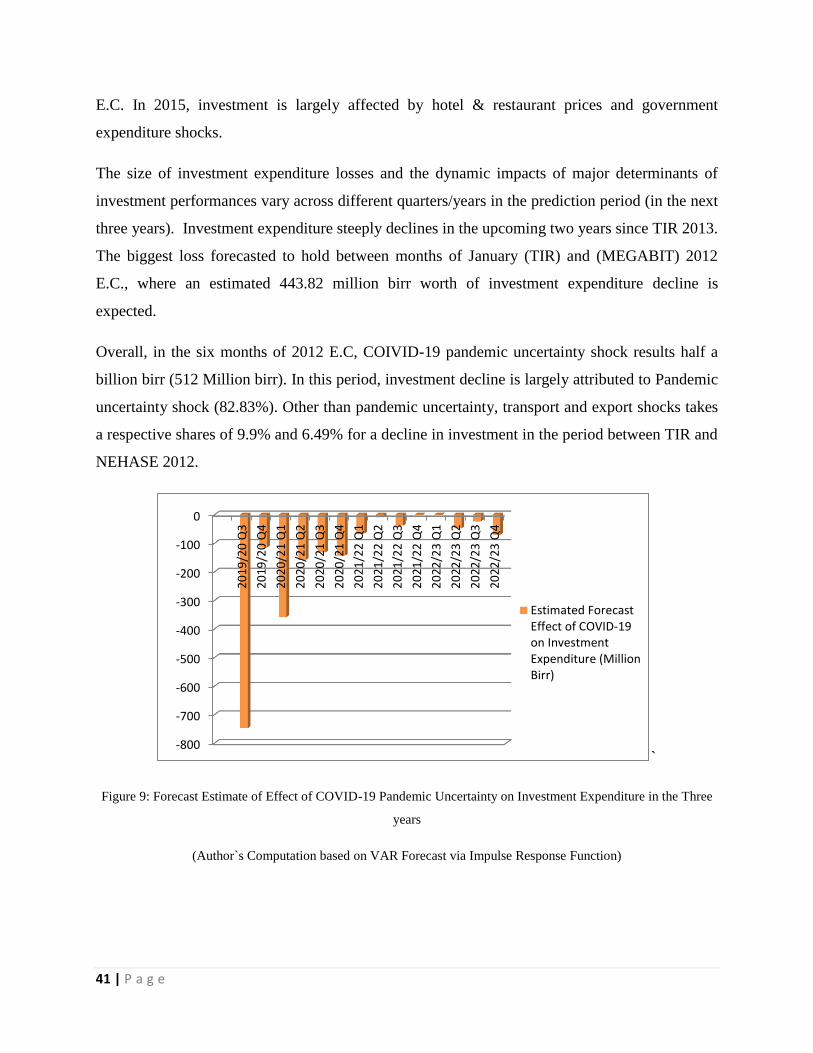
Overall, in the six months of 2012 E.C, COIVID-19 pandemic uncertainty shock results half a
billion birr (512 Million birr). In this period, investment decline is largely attributed to Pandemic
uncertainty shock (82.83%). Other than pandemic uncertainty, transport and export shocks takes
a respective shares of 9.9% and 6.49% for a decline in investment in the period between TIR and
NEHASE 2012.
`
Figure 9: Forecast Estimate of Effect of COVID-19 Pandemic Uncertainty on Investment Expenditure in the Three
years
(Author`s Computation based on VAR Forecast via Impulse Response Function)
-800
-700
-600
-500
-400
-300
-200
-100
0
20
19
/20
Q3
20
19
/20
Q4
20
20
/21
Q1
20
20
/21
Q2
20
20
/21
Q3
20
20
/21
Q4
20
21
/22
Q1
20
21
/22
Q2
20
21
/22
Q3
20
21
/22
Q4
20
22
/23
Q1
20
22
/23
Q2
20
22
/23
Q3
20
22
/23
Q4
Estimated ForecastEffect of COVID-19on InvestmentExpenditure (MillionBirr)

42 | P a g e
In 2013 E.C too, the effect of the virus keeps on its damage on investment climate in Ethiopia. In
this regard, the total cost of pandemic uncertainty is estimated to be 391.77 million birr. Though
the pandemic uncertainty shock effect shows a progressive decline, it still remains the major
factor determining the performance of investment sector in 2013, contributing on average for
62.32% of investment volatility. In the mentioned period, transport and export shocks remain on
top spot of affecting investment performance, with respective the average shares in explaining
investment expenditure is predicted to be 8.39% and 4.87%.
The effect of the pandemic on investment shows a relative decline in 2014 E.C, whose estimated
effect on loss in the investment expenditure predicted at 68.7 Million birr. This is largely
attributed to a decline in pandemic uncertainty shock, whose effect declines to 49.12%.
Transport prices and export shocks remain major variables in 2014 where COVID-19 uncertainty
shock effect takes its toll on investment performance in Ethiopia. The finding from VAR
estimation shows transport price shocks are forecasted to explain 8.63% of volatilities in
investment expenditure. In 2013 E.C the role of export performance in explaining investment
volatilities is averaged at 4.12%.
In the year 2015 E.C, the damage of the pandemic on investment expenditure will be and 84.2
Million birr respectively. In this period, the relative importance of pandemic uncertainty,
transport and export shocks progressively declines in affecting investment expenditures. In this
regard, the share of each shock in affecting investment stability is predicted to be 43.1%, 7.96%
and 3.79% respectively. On the other hand, the importance of hotel & restaurant and
government expenditure shocks appeared on the scene to shake investment sector. The Impulse
Response results from VAR estimation predicts that hotel & restaurant prices & government
spending explain on average 7.14% and 6.01% of changes in investment expenditures
respectively.
The forecast estimate on investment expenditure shows that investment declines by 747 million birr in the
months of April, May and June of 2012 Ethiopian Calendar. The loss in investment as a result of the
pandemic goes on in the next three months too (July & August/ 2012 and September/ 2013 E.C), where
forecast estimates showing a loss in investment by 115 Million birr. The pandemic damage on investment
expenditure continues in 2013 Ethiopian calendar too, where an estimated 559 Million birr worth of
43 | P a g e
investment expenditure is lost between October (TIKIMT) and December (TAHISAS) 2013(Quarter two
of 2020/21 E.F.Y).
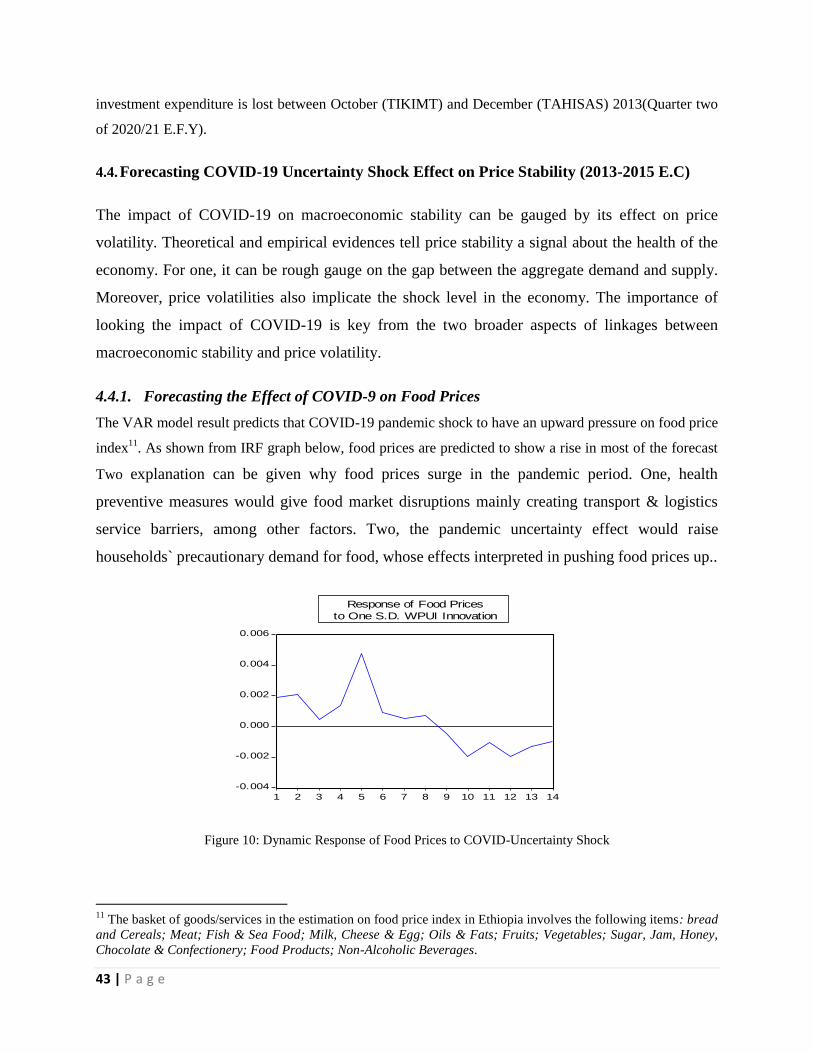
4.4. Forecasting COVID-19 Uncertainty Shock Effect on Price Stability (2013-2015 E.C)
The impact of COVID-19 on macroeconomic stability can be gauged by its effect on price
volatility. Theoretical and empirical evidences tell price stability a signal about the health of the
economy. For one, it can be rough gauge on the gap between the aggregate demand and supply.
Moreover, price volatilities also implicate the shock level in the economy. The importance of
looking the impact of COVID-19 is key from the two broader aspects of linkages between
macroeconomic stability and price volatility.
4.4.1. Forecasting the Effect of COVID-9 on Food Prices
The VAR model result predicts that COVID-19 pandemic shock to have an upward pressure on food price
index11
. As shown from IRF graph below, food prices are predicted to show a rise in most of the forecast
Two explanation can be given why food prices surge in the pandemic period. One, health
preventive measures would give food market disruptions mainly creating transport & logistics
service barriers, among other factors. Two, the pandemic uncertainty effect would raise
households` precautionary demand for food, whose effects interpreted in pushing food prices up..
Figure 10: Dynamic Response of Food Prices to COVID-Uncertainty Shock
11
The basket of goods/services in the estimation on food price index in Ethiopia involves the following items: bread
and Cereals; Meat; Fish & Sea Food; Milk, Cheese & Egg; Oils & Fats; Fruits; Vegetables; Sugar, Jam, Honey,
Chocolate & Confectionery; Food Products; Non-Alcoholic Beverages.
-0.004
-0.002
0.000
0.002
0.004
0.006
1 2 3 4 5 6 7 8 9 10 11 12 13 14
Response of Food Prices
to One S.D. WPUI Innovation

44 | P a g e
To infer on the channels through which food price volatility to be transmitted into the economy,
variance decomposition of food prices shock was made. Accordingly, transport shock is
forecasted to be the main channel through which COVID-19 uncertainty effect is impact is
transmitted into food prices. On average 16.3 % of variances in price of food-price is explained
by transport prices in the whole periods of forecast. As food inputs are highly reliant on transport
& logistics services, it is natural that food prices to vary with transport prices.
Education price is another channel where COVID-19 uncertainty shock impact is transmitted to
food price volatility in Ethiopia in the upcoming three years, whose shock effect on food price
volatility is averaged at 14.9% in the prediction period. In a country like Ethiopia, where there
are 26 million students attending classes as of 2020 or 2012 E.C12
, it is highly likely that
education sector to affect food prices via effects on hotel & restaurant businesses. Indeed, a stay
at home health measures affect hotels and restaurants drawing substantial customer base from
getting services. That inevitably put downward pressure on food prices through the line of
demand shortfalls. That may explain why the impact of education prices is expected to spill over
into food prices.
Apart from education, the impact of COVID-19 on food prices are expected to pass through
communication prices, particularly since the first four quarters of prediction period.
4.4.2. Forecasting the Effect of COVID-19 on Non-Food Prices
To see the dynamic response of non-food prices to COVID-19 uncertainty shock, the study
consider major items in non-food price indexing in Ethiopia. Hence, the dynamic response of
indicators of non-food price index to one standard deviation of COVID-19 uncertainty shock on
transport, communication, education, health and hotel & restaurant prices is forecasted for the
next fourteen quarters since 2019/20 Q3
As depicted in subsequent paragraphs, the forecast result reveals that the pandemic uncertainty
impact is not the same across non-food goods/services indicators.
Transport Prices
12
Report by Planning Commission of Ethiopia, July 2020

45 | P a g e
In the immediate aftermath of the pandemic outbreak, transport prices show upsurge, but only
with a momentous effect as it lasts for few time. This can be explained by pressure on public
mobility on the eve of stay at home measures likely be implemented on the wake of the
coronavirus pandemic. People would rush at once to take themselves at home, raising transport
demand and hence surge in the price index. Moreover, the future is uncertain with more
restrictive measures (including lockdowns) may hold. Therefore, precautionary demands for food
/ non-food items, which raise demand for transport services, leaving an upward pressure on
transport prices.
Except for a momentous increase in prices of transport, the VAR model forecast transport prices
fall in almost all quarters of forecast period. Given the pandemic triggered stay away measures,
that would amount significant limitations on mobility of people and freight, all with dwindling
down effect on transport prices. The impact of COVID-19 uncertainty shock on transport prices
seemingly fades beginning 12th
quarter of forecast.
Figure 11: Dynamic Response of Transport Prices to COVID-Uncertainty Shock
Moreover, the pandemic uncertainty shock is transmitted to transport price volatility via
education and food prices, also with investment. The result in this regard is expected as
education, food supply chain and investment activities are highly reliant on transport services.
Communication Prices
Communication prices show a rise in the upcoming six quarters at least. The rise in price is also
observed in the seventh and eighth quarters too before falling in the last two quarters of forecast.
-0.010
-0.008
-0.006
-0.004
-0.002
0.000
1 2 3 4 5 6 7 8 9 10 11 12 13 14
Response of Transport Prices
to One S.D. WPUI Innovation

46 | P a g e
The upward effect of COVID-19 pandemic on communication price index is understandable. For
obvious reasons, the pandemic preventive measures required limited physical contact. and the
only feasible way managing one`s business, whether economic or social, would be via
telecommunications. That in turn results into surge in demand for communication
devices/services, hence a rise in their prices too.
Figure 12: Dynamic Response of Communication Prices to COVID-Uncertainty Shock
Volatilities in communication prices are predicted to be explained via volatilities in prices in the
health and food prices. Export sector is another channel where COVID-19 uncertainty shock
evokes volatilities in the communication prices. The finding is consistent with the fact that all
those sectors are largely dependent on communication devices to deliver/function their services.
Education Prices
Education prices show a fall in the next three forecast period, but begins a steady rise that lasts
for the next five quarters. The finding is in compatible with the stringent measures to be taken in
the aftermath of the pandemic, one of which is closure of education centers.
As education remains in closure for months, demand for education services and education
materials would be low. And the impact is interpreted with a fall in education prices. That
explains why education price index shows a decline in the months following COVID-19
pandemic.
-0.0005
0.0000
0.0005
0.0010
0.0015
1 2 3 4 5 6 7 8 9 10 11 12 13 14
Response of Communication Prices
to One S.D. WPUI Innovation

47 | P a g e
Figure 13: Dynamic Response of Education Prices to COVID-Uncertainty Shock
As forecasted in the VAR variance decomposition, the transmission channel of the pandemic
effect on education sector is most felt through transport and food price shocks. The duration of
pandemic uncertainty time is also another factor affecting the stability of education prices in the
next couple of years in Ethiopia. Since the beginning of the fourth quarter of forecast,
communication price shocks will affect stability of education prices.
Health Price Index
Health prices show a rise in the first two quarters of forecast. Given the pandemic result a public
health measures to step up, the prediction is as expected. However, for the next three quarters,
health prices show a decline. The impact of COVID-19 uncertainty shock on health prices
culminates beginning the seventh quarter.
-0.006
-0.004
-0.002
0.000
0.002
0.004
1 2 3 4 5 6 7 8 9 10 11 12 13 14
Response of Education Prices
to One S.D. WPUI Innovation

48 | P a g e
Figure 14: Dynamic Response of Health Prices to COVID-Uncertainty Shock
The transmission channel of uncertainty effect on health price stability is most explained by
communication, transport & food price shocks. Import and hotel & restaurant prices are also
found to be another transmission mechanism of COVID-19 uncertainty shock on variations in
health price in the forecast period.
Hotel & Restaurant Prices
Hotel & restaurant prices increase roughly in all periods of forecast except the fourth and fifth
quarters. Given that public health measures required hotels & restaurant business to put in place
changes in their service delivery to complying customer safety that inevitably interpreted in
making cost of production costlier. The in part explains the upward pressures on hotel &
restaurant prices expected in the first four quarters at least.
Figure 15: Dynamic Response of Hotel & Restaurant Prices to COVID-Uncertainty Shock
-0.010
-0.008
-0.006
-0.004
-0.002
0.000
0.002
0.004
1 2 3 4 5 6 7 8 9 10 11 12 13 14
Response of Health Prices
to One S.D. WPUI Innovation
-0.003
-0.002
-0.001
0.000
0.001
0.002
0.003
0.004
1 2 3 4 5 6 7 8 9 10 11 12 13 14
Response of Hotel Prices
to One S.D. WPUI Innovation

49 | P a g e
The impact of COVID-19 pandemic takes its biggest toll in the hotel & restaurant business via
education and food price volatilities. As food items are major inputs/outputs of hoteling business,
and students are the major customers of hotel & restaurant services, the finding is expected. Non-
food prices like communication and transport are also important lines of uncertainty shock
transmission lines resulting volatilities in the hotel & restaurant prices.

50 | P a g e
4.5.Forecasting COVID-19 Uncertainty Shock Effect on the Pattern of Public Expenditure
in Ethiopia (2013-2015 E.C)
The pandemic shock effect has a negative impact on government expenditure in the next four
quarters of pandemic period. As the forecast estimation considers policy factors intact, one
reason why reduction of public spending is because a reduction in government earnings due to
tax and tariff falls as result of the pandemic.
An increase in government expenditure is forecasted in the first quarter of prediction period.
Government spending shows a decline in the last quarter of 2019/20 fiscal year and the first
quarter of 2020/21 fiscal year. In the remaining three quarters of the 2020/21 fiscal year,
however, a slight increase in government expenditure is expected. The pattern of government
expenditure change appears to be cyclical in the next quarters of forecast.
Figure 16: Dynamic Response of Government Expenditure to COVID-Uncertainty Shock
4.5.1. COVID-19 Uncertainty Shock Transmission Mechanism on Public Expenditure (2013-
2015 E.C)
To see the effect COVID-19 uncertainty shock on macroeconomic stability in Ethiopia, the study
examined the transmission mechanism of Government Expenditure volatility. To that end,
variance decomposition on government expenditure variable is estimated in the VAR model.
The result of estimation shows that volatilities in government expenditure transmitted into the
economy by affecting prices, both food and non-food prices. In this regard, food and
-0.04
-0.03
-0.02
-0.01
0.00
0.01
0.02
0.03
1 2 3 4 5 6 7 8 9 10 11 12 13 14
Response of Government Expenditure
to One S.D. WPUI Innovation

51 | P a g e
communication prices appear to be main channels through which COVID-19 shock transmitted
into government expenditure volatility.
As variance decomposition result shows, communication prices shocks are the main transmission
channel of COVID-19 uncertainty shock on government expenditure, explaining 15.74% of
public expenditure volatilities in the forecast period (the coming three years). The explanation
goes to structural/contextual factor pertaining to the public sector in Ethiopia. The role of
communication sector in determining the pattern of government expenditure is apparent as direct
and indirect source of government revenues.
In Ethiopian context, communication sector is entirely owned by the government sector, with the
state monopolizes the telecom business to fetch ransom to service its expenditure. Moreover, the
effect of communication shock on government expenditure may be through its potential impact
on the tax revenue.
The study further identified that COVID-19 uncertainty effect is transmitted into government
expenditure via hotel & restaurant shock. This can be explained by two. For one, hotel &
restaurant business is key source of tax revenue for the government. Moreover, as a result of the
pandemic takes its biggest toll on hotel &restaurant businesses, tax revenue from the sector is
expected to face a decline in the next couple of years. On top of that, given that the hotel &
restaurant sector is receiving major tax concessions from the government, the downward effect
on tax revenue that could have been received from the sector.

52 | P a g e
4.6.Forecasting COVID-19 Uncertainty Shock Effect on Investment Induced Employment
in Ethiopia (2013-2015 E.C)
As we learn from the dynamic response graph below, uncertainty shock sparked by coronavirus
pandemic affect aggregate employment (temporary & permanent employment) negatively in the
first two quarters of forecast period (between TIR and SENE 2012 E.C). Between TIR-
MEGABIT 2012 E.C), COVID-19 uncertainty shock will result a 65% decline in employment
level compared to the previous quarter (2019/20 Q2).
Dynamics of COVID-19 Uncertainty Shock Effect on Employment in the Forecast period is
depicted in the Impulse Response Function (graphed) below
Figure 17: Dynamic Response of Employment to COVID-Uncertainty Shock
The effect of the pandemic on employment is expected to come through investment, the length of
the pandemic period (uncertainty effect) and export shocks. The finding is real as the
employment data used in the study is investment induced employment; and investment and
export sector are largely affected by the length of pandemic period (see sections 4.2 and 4.3)
Indeed, as VAR forecast estimate show, the impact of COVID-19 uncertainty effect is much felt
through investment channels in the whole period of prediction period (three years). In the first
six months of 2012 E.C for instance, changes in investment expenditures explain 37.89% of
volatilities in employment. In the first four quarters of forecast period, though permanent
employees are not totally immune from the pandemic shocks, temporary employment will bear
the cost of the pandemic more than permanent employment. There are solid reason why so.
-0.8
-0.6
-0.4
-0.2
0.0
0.2
0.4
1 2 3 4 5 6 7 8 9 10 11 12 13 14
Response of Employment
to One S.D. WPUI Innovation

53 | P a g e
For one, COVID-19 triggers stringent public health measures to prevent the spread of the disease
restrict the growth of ongoing investments, whose effect interpreted in downsizing additional.
Moreover, pandemic uncertainty erodes the confidence of investors as the prospect for
businesses expectedly gloomy curbing new investments from holding. In both cases, COVID-19
effect is interpreted in its massive effect on temporary employment.
Figure 18: Forecast Effect of COVID-19 on Employment (%)
(Author`s Computation based on VAR Forecast via Impulse Response Function)
The effect of COVID-19 uncertainty on employment is however almost nil in the year 2014.
This, in part, is explained by a rise in public spending to investment undertakings and existing
businesses targeting employees (permanent/contract) from layoffs. As forecast prediction shows,
the effect of the pandemic on employment culminates beginning the second half of 2013 E.C
-80
-60
-40
-20
0
20
40
20
19
/20
Q3
20
19
/20
Q4
20
20
/21
Q1
20
20
/21
Q2
20
20
/21
Q3
20
20
/21
Q4
20
21
/22
Q1
20
21
/22
Q2
20
21
/22
Q3
20
21
/22
Q4
20
22
/23
Q1
20
22
/23
Q2
20
22
/23
Q3
20
22
/23
Q4
ForecastEffect ofCOVID-19 onEmployment(%)

54 | P a g e
4.7.The Role of Fiscal Policy to Mitigate the Uncertainty Shock Impact of COVID-19
Pandemic on Ethiopian Economy (2013-2015 E.C)
In this study, the role of fiscal policy to mitigate COVID-19 driven macroeconomic instability on
Ethiopian economy is examined by instrumenting fiscal policy shocks against key
macroeconomic variables integrated in VAR model used. Expansionary fiscal policy instruments
examined in this study are increasing government expenditure and reducing import tariffs. By
way of illustration, impulse response of key macroeconomic stability indicators to COVID-19
shock (the disturbance factor) and the expansionary fiscal policy shocks (counter disturbance
factors) is presented.
4.7.1. The Role of Managed Rise in Public Expenditure to Stabilize the Economy
To examine the effect of expanding public expenditure in stabilizing the macroeconomic order,
The Impulse Response Function (IRF) to one standard deviation of shock from Government
Expenditure on investment, employment, food & non-food prices, import, export sector was
investigated.
Evident from IRF graphs below, the particular role of an increase in government expenditure
goes to stabilize general prices (both in the food and non-food prices)
Figure 19: The Role of Expansionary Government Expenditure to Price Stability
-0.3
-0.2
-0.1
0.0
0.1
0.2
0.3
1 2 3 4 5 6 7 8 9 10 11 12 13 14
WPUI DLNGOVTEXPSA
Response of Import
to One S.D. Innovations
-0.010
-0.008
-0.006
-0.004
-0.002
0.000
0.002
0.004
1 2 3 4 5 6 7 8 9 10 11 12 13 14
WPUI DLNGOVTEXPSA
Response of Transport Prices
to One S.D. Innovations
-0.004
-0.002
0.000
0.002
0.004
0.006
1 2 3 4 5 6 7 8 9 10 11 12 13 14
WPUI DLNGOVTEXPSA
Response of Food Prices
to One S.D. Innovations
-0.0010
-0.0005
0.0000
0.0005
0.0010
0.0015
1 2 3 4 5 6 7 8 9 10 11 12 13 14
WPUI DLNGOVTEXPSA
Response of Communication Pricers
to One S.D. Innovations
-0.006
-0.004
-0.002
0.000
0.002
0.004
1 2 3 4 5 6 7 8 9 10 11 12 13 14
WPUI DLNGOVTEXPSA
Response of Education Prices
to One S.D. Innovations
-0.012
-0.008
-0.004
0.000
0.004
0.008
1 2 3 4 5 6 7 8 9 10 11 12 13 14
WPUI DLNGOVTEXPSA
Response of Health Prices
to One S.D. Innovations
-0.003
-0.002
-0.001
0.000
0.001
0.002
0.003
0.004
1 2 3 4 5 6 7 8 9 10 11 12 13 14
WPUI DLNGOVTEXPSA
Response of Hotel Prices
to One S.D. Innovations

55 | P a g e
Moreover, increasing government expenditures can heal the fractures of the economy due to
pandemic uncertainty shock effect by stimulating investment, export and employment (see IRF
graphs below).
Figure 20: The Role of Expansionary Government Expenditure to Promote Investment, export and employment
4.7.2. The Role of Reducing Import Tariffs (Import Policy) on Macroeconomic Stability
To enhance the potency expansionary fiscal policy intervention to stabilize the economy, increased public
expenditure has to be complemented by import policies/regulations/procedures. An important instrument
of expansionary fiscal policy in this regard is reducing import tariffs. Reduction of tariff should be
directed toward key ventures in the supply chain in the import supply of consumption and investment
goods.
The role of import policies to complement fiscal policy measures can be explained in to two. For one, by
reducing the transaction cost in import sector, complementary import policies would have positive
spillover effect in final prices thereby mitigating inflation. On the other hand, complementary import
policies would help facilitate importing consumption and investment goods, hence mitigate the
inflationary effects of expansionary fiscal policy by keeping the balance of aggregate demand and supply.
The role of import policy to stabilize prices is depicted in the IRF graphs below
-5
-4
-3
-2
-1
0
1
1 2 3 4 5 6 7 8 9 10 11 12 13 14
WPUI DLNGOVTEXPSA
Response of Investment
to One S.D. Innovations
-30
-20
-10
0
10
1 2 3 4 5 6 7 8 9 10 11 12 13 14
WPUI DLNGOVTEXPSA
Response of Export
to One S.D. Innovations
-0.8
-0.6
-0.4
-0.2
0.0
0.2
0.4
1 2 3 4 5 6 7 8 9 10 11 12 13 14
WPUI DLNGOVTEXPSA
Response of Employment
to One S.D. Innovations
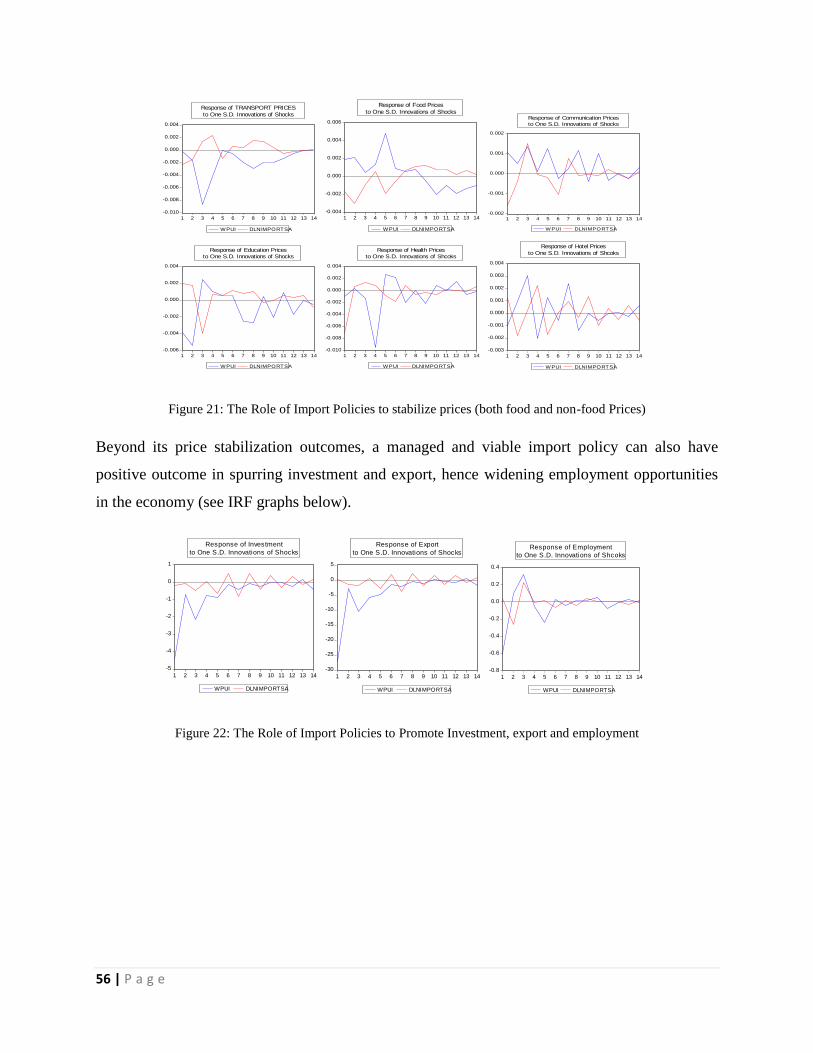
56 | P a g e
Figure 21: The Role of Import Policies to stabilize prices (both food and non-food Prices)
Beyond its price stabilization outcomes, a managed and viable import policy can also have
positive outcome in spurring investment and export, hence widening employment opportunities
in the economy (see IRF graphs below).
Figure 22: The Role of Import Policies to Promote Investment, export and employment
-0.010
-0.008
-0.006
-0.004
-0.002
0.000
0.002
0.004
1 2 3 4 5 6 7 8 9 10 11 12 13 14
WPUI DLNIMPORTSA
Response of TRANSPORT PRICES
to One S.D. Innovations of Shocks
-0.004
-0.002
0.000
0.002
0.004
0.006
1 2 3 4 5 6 7 8 9 10 11 12 13 14
WPUI DLNIMPORTSA
Response of Food Prices
to One S.D. Innovations of Shocks
-0.002
-0.001
0.000
0.001
0.002
1 2 3 4 5 6 7 8 9 10 11 12 13 14
WPUI DLNIMPORTSA
Response of Communication Prices
to One S.D. Innovations of Shocks
-0.006
-0.004
-0.002
0.000
0.002
0.004
1 2 3 4 5 6 7 8 9 10 11 12 13 14
WPUI DLNIMPORTSA
Response of Education Prices
to One S.D. Innovations of Shocks
-0.010
-0.008
-0.006
-0.004
-0.002
0.000
0.002
0.004
1 2 3 4 5 6 7 8 9 10 11 12 13 14
WPUI DLNIMPORTSA
Response of Health Prices
to One S.D. Innovations of Shcoks
-0.003
-0.002
-0.001
0.000
0.001
0.002
0.003
0.004
1 2 3 4 5 6 7 8 9 10 11 12 13 14
WPUI DLNIMPORTSA
Response of Hotel Prices
to One S.D. Innovations of Shcoks
-5
-4
-3
-2
-1
0
1
1 2 3 4 5 6 7 8 9 10 11 12 13 14
WPUI DLNIMPORTSA
Response of Investment
to One S.D. Innovations of Shocks
-30
-25
-20
-15
-10
-5
0
5
1 2 3 4 5 6 7 8 9 10 11 12 13 14
WPUI DLNIMPORTSA
Response of Export
to One S.D. Innovations of Shocks
-0.8
-0.6
-0.4
-0.2
0.0
0.2
0.4
1 2 3 4 5 6 7 8 9 10 11 12 13 14
WPUI DLNIMPORTSA
Response of Employment
to One S.D. Innovations of Shcoks

57 | P a g e
5. CONCLUSION AND POLICY RECOMMENDATIONS
This study investigated the impact of COVID-19 pandemic uncertainty shock on the
macroeconomic stability of Ethiopia. The World Pandemic Uncertainty Index (WPUI) was used
a proxy variable to measure COVID-19 Uncertainty shock effect. The pandemic effect on core
macroeconomic variables like investment, employment, prices (both food & non-food prices),
import, export and fiscal policy indicators was estimated and forecasted. The role of fiscal policy
in mitigating the shock effect of coronavirus pandemic on macroeconomic stability is also
investigated.
5.1.Conclusion
The finding of the study reveals that the COVID-19 impact lasts at least three years to shake the
economy of Ethiopia.
Essentially the COVID-19 immediate impact was on international transactions, and in the
Ethiopian context, where the country relies heavily on import for the service of consumption and
investment demands. Hence, the impact is expected to take its toll via import channel in the
immediate aftermath of the outbreak of the pandemic.
The VAR estimate indicates that COVID-19 uncertainty shock results a massive rise in import in
the six months following the outbreak of the pandemic. The finding in this regard is expected, as
the pandemic triggers massive demand in food and pharmaceuticals, for which Ethiopia is import
dependent on both items. In the next two years, however, the import bill of Ethiopia shows a
decline. Reduction in aggregate demand (both consumption & investment expenditures) is one
explanation for decline in import size in 2013 and 2014 E.C.
The price dynamics as forecasted in the upcoming three years in Ethiopia tells the direction of
impacts of COVID-19 uncertainty shock to shake the macroeconomic order. The findings in this
regard revealed the structural breakups of Ethiopian economy, characterized by its inability to
withstand shocks. As signaled in forecasted price dynamics on both food and non-food price
indices, COVID-19 was a supply shock in its first time impact, but quickly trans-passes to
demand shock. And in the next few years the demand shock outweighs the supply shock.

58 | P a g e
The results of estimations indicate that food prices to sky rocketed at least until the end of 2014
E.C (2021/22). On the other hand, except communication & hotel & restaurant prices, other
components of non-food price indices show a slump. The decline in non-food price level is a
clear showcase of under-consumption characterizes the economic order in Ethiopia in the coming
three years.
COVID-19 uncertainty shock puts huge loss in the investment sector in Ethiopia at least in the
coming two years 2013 and 2014 E.C (2020/21-2021/22). In this regard, the pandemic effect
transmitted to shake investment expenditure via the length of the pandemic period itself and
export performances, both of which are exogenous shocks.
Employment declines up until the sixth quarter, but shows a slight increase between the sixth and
eighth quarter of forecast. The uncertainty impact of COVID-19 on employment dies-off after
the tenth quarter. The finding of the study further reveals that price stabilization policies both in
food and non-food markets are integral elements in promoting investment.
Findings from VAR estimation suggest that fiscal policy can help stabilize both food and non-
food prices in the next three years at least. A particular role of government spending in
stabilizing prices goes to food market and in the transport sector. Moreover, the study found out
that price stabilization policies have spillover effects in boosting investment, promote export and
enhancing the scope of the economy in terms of creating employment opportunities.
5.2.Policy Recommendations
The study identified that general under consumption features the Ethiopian economy in the next
couple of years. Therefore, the government is expected to enact incentives/policy directions
which can boost business confidence. In this regard, government expenditures on consumption
and capital goods would heal the damage cost of COVID-19 uncertainty shocks on aggregate
demand thereby promoting investment & consumption expenditures. The finding of the study
suggests for a managed expansionary fiscal policy to promote investment induced employment
and stabilize food & non-food prices.
Policies that aim to stabilize food price should focus in providing economic incentives to those
agents in food supply chain thereby increasing their production capacity. Price stabilization

59 | P a g e
interventions in the food market can also be achieved through strategies that identify key agents
in the supply chain most affected by the pandemic shock, and channel subsidies in those lines
Moreover, the government has to encourage merchandise imports to avoid inflationary effects of
expansionary fiscal policy in basic consumption and investment goods as a result of supply shortfalls. In
this regard, incentivizing the transport and logistics sector can help fix major fallouts of the
economy as result of COVID-19 uncertainty shock effect on supply chain. Policy interventions
can manage on that through combined legal, bureaucratic and financial policies/strategies/directives
that helps facilitate for an efficient export-import trade, which is key to mitigate macroeconomic
instability thereby narrowing the gap in aggregate demand and supplies on consumption and investment
goods.
Finally, while servicing its rising expenditures, the government has to see viable options of
financings. As such, financing public expenditures should be in a way that would not pressurize
the prospect of the economy in medium and long run. As part of the broader interventions in the
economy through divergent policy instruments, fiscal optimization should also be considered in a
way retargeting or reprogramming possible on already running public projects/programs when
the need arises.

60 | P a g e
REFERENCES
African Union (AU). 2020. Impact of the Coronavirus (COVID-19) on the African Economy,
March.
Africanews. 2020. Coronavirus 'corroding' sports betting in East Africa, March
Alebel Bayrau Weldesilassie and Tassew Woldehanna. 2020. The Economic Implications of
COVID - 19 in Ethiopia and Policy Measures, Policy Studies Institute (PSI), Addis Ababa,
Ethiopia, April
Alemayehu Geda. 2020.The Macroeconomic and Social Impact of COVID-19 in Ethiopia and
Suggested Directions for Policy Response, Preprint, April
Baker, Scott R., Nicholas Bloom, Terry, Stephen J. 2020. Using Disasters to Estimate the Impact
of Uncertainty, Northwestern University Kellogg School of Management and NBER, Stanford
University and Boston University
Baldwin, R. and Weder di Mauro B. 2020. Economics in the Time of COVID-19, Centre for
Economic Policy Research (CEPR), CEPR E-Book, ISBN: 978-1-912179-28-2, CEPR Press,
London, UK, March
Bronwyn Bruton. 2020. What does the coronavirus mean for Africa?, REUTERS, March
Doan, Thomas, Robert Litterman, and Christopher Sims. 1984. Forecasting and Conditional
Projection using Realistic Prior Distributions," Econometric Reviews, Vol. 3, No. 1, pp. 1{100.
Fetzer, T., Hensel, Lukas., Hermle, J. Roth. 2020. Coronavirus Perceptions And Economic
Anxiety, First version, March
FDRE Ministry of Finance and Cooperation. 2020. COVID-19 Multi-Sectorial Preparedness &
Response Plan, Addis Ababa, April
International Monitory Fund (IMF). 2018. Country Report No. 18/354, The Federal Democratic
Republic of Ethiopia, Pp. 4, December

61 | P a g e
Jordà, Òscar, Sanjay R. Singh, Alan M. Taylor. 2020. ―Longer-Run Economic Consequences of
Pandemics,” Federal Reserve Bank of San Francisco Working Paper 2020-09.
https://doi.org/10.24148/wp2020-09
Miranda-Agrippin, S. and Ricco, G. 2018. Bayesian Vector Auto-regressions, Bank of England
and CFM and University of Warwick and OFCE – SciencesPo
Kuikeu, Oscar. 2020. Economic impact of COVID-19 in Cameroon: an empirical assessment
with the VAR Methodology, April
Litterman, Robert B. 1979. Techniques of forecasting using vector auto-regressions, Working
Papers 115, Federal Reserve Bank of Minneapolis.
Liu, S. 2020. The Butterfly Effect: Coronavirus may Re-define the Global Currency Landscape.
Harvard Kennedy School.
Ozili, P. 2020. Covid-19 Pandemic and Economic Crisis : The Nigerian experience and
Structural causes. https://ssrn.com/abstract=3571085, April.
POLITICO Magazine. 2020, Coronavirus Will Change the World Permanently. Here’s How: A
crisis on this scale can reorder society in dramatic ways, for better or worse. Here are 34 big
thinkers‘ predictions for what‘s to come, March
PINSHI, Christian P. 2020. COVID-19 uncertainty and monetary policy, University of Kinshasa,
May
Tadele Ferede, Getachew Diriba and Lulit Mitik Beyene. 2020. The economy wide impact of the
COVID-19 in Ethiopia: Policy and Recovery options’. Ethiopian Economics Association (EEA),
June
The Economist Magazine. 2020. The 90% Economy that Lockdowns will leave Behind, April.
United Nations Conference on Trade and Development (UNCTD). 2020. The Covid-19 Shock to
Developing Countries: Towards a ―whatever it takes‖ program for the two-thirds of the world‘s
population being left behind, March

62 | P a g e
Watanabe, T. 2020. The Responses of Consumption and Prices in Japan to the COVID‐19 Crisis
and the Tohoku Earthquake. JSPS Grant‐in‐Aid for Scientific Research (S), Central Bank
Communication Design, working paper series no.020, March.
Yeshineh and Alfredo J. Mainar Causapé. 2020. Ethiopia: Input-Output Table and Social
Accounting Matrix 2015/16, Policy Studies Institute (PSI), Addis Ababa, Ethiopia
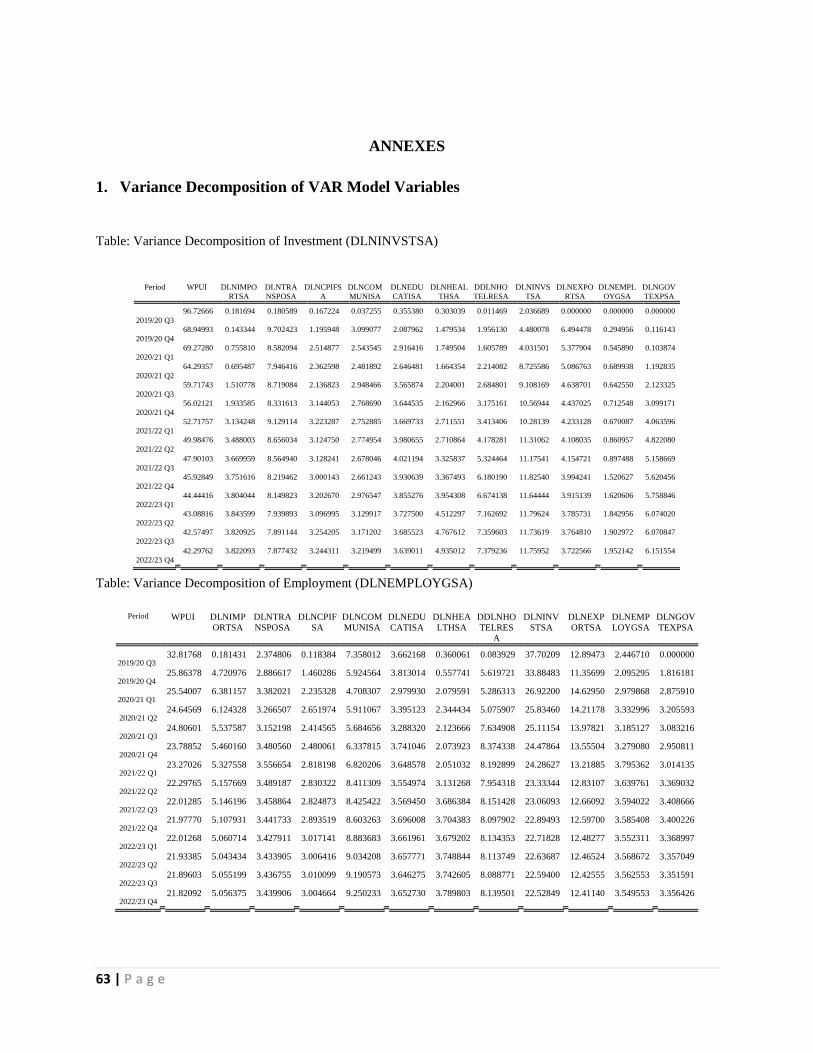
63 | P a g e
ANNEXES
1. Variance Decomposition of VAR Model Variables
Table: Variance Decomposition of Investment (DLNINVSTSA)
Table: Variance Decomposition of Employment (DLNEMPLOYGSA)
Period WPUI DLNIMP
ORTSA
DLNTRA
NSPOSA
DLNCPIF
SA
DLNCOM
MUNISA
DLNEDU
CATISA
DLNHEA
LTHSA
DDLNHO
TELRES
A
DLNINV
STSA
DLNEXP
ORTSA
DLNEMP
LOYGSA
DLNGOV
TEXPSA
2019/20 Q3 32.81768 0.181431 2.374806 0.118384 7.358012 3.662168 0.360061 0.083929 37.70209 12.89473 2.446710 0.000000
2019/20 Q4 25.86378 4.720976 2.886617 1.460286 5.924564 3.813014 0.557741 5.619721 33.88483 11.35699 2.095295 1.816181
2020/21 Q1 25.54007 6.381157 3.382021 2.235328 4.708307 2.979930 2.079591 5.286313 26.92200 14.62950 2.979868 2.875910
2020/21 Q2 24.64569 6.124328 3.266507 2.651974 5.911067 3.395123 2.344434 5.075907 25.83460 14.21178 3.332996 3.205593
2020/21 Q3 24.80601 5.537587 3.152198 2.414565 5.684656 3.288320 2.123666 7.634908 25.11154 13.97821 3.185127 3.083216
2020/21 Q4 23.78852 5.460160 3.480560 2.480061 6.337815 3.741046 2.073923 8.374338 24.47864 13.55504 3.279080 2.950811
2021/22 Q1 23.27026 5.327558 3.556654 2.818198 6.820206 3.648578 2.051032 8.192899 24.28627 13.21885 3.795362 3.014135
2021/22 Q2 22.29765 5.157669 3.489187 2.830322 8.411309 3.554974 3.131268 7.954318 23.33344 12.83107 3.639761 3.369032
2021/22 Q3 22.01285 5.146196 3.458864 2.824873 8.425422 3.569450 3.686384 8.151428 23.06093 12.66092 3.594022 3.408666
2021/22 Q4 21.97770 5.107931 3.441733 2.893519 8.603263 3.696008 3.704383 8.097902 22.89493 12.59700 3.585408 3.400226
2022/23 Q1 22.01268 5.060714 3.427911 3.017141 8.883683 3.661961 3.679202 8.134353 22.71828 12.48277 3.552311 3.368997
2022/23 Q2 21.93385 5.043434 3.433905 3.006416 9.034208 3.657771 3.748844 8.113749 22.63687 12.46524 3.568672 3.357049
2022/23 Q3 21.89603 5.055199 3.436755 3.010099 9.190573 3.646275 3.742605 8.088771 22.59400 12.42555 3.562553 3.351591
2022/23 Q4 21.82092 5.056375 3.439906 3.004664 9.250233 3.652730 3.789803 8.139501 22.52849 12.41140 3.549553 3.356426
Period WPUI DLNIMPO
RTSA
DLNTRA
NSPOSA
DLNCPIFS
A
DLNCOM
MUNISA
DLNEDU
CATISA
DLNHEAL
THSA
DDLNHO
TELRESA
DLNINVS
TSA
DLNEXPO
RTSA
DLNEMPL
OYGSA
DLNGOV
TEXPSA
2019/20 Q3
96.72666 0.181694 0.180589 0.167224 0.037255 0.355380 0.303039 0.011469 2.036689 0.000000 0.000000 0.000000
2019/20 Q4
68.94993 0.143344 9.702423 1.195948 3.099077 2.087962 1.479534 1.956130 4.480078 6.494478 0.294956 0.116143
2020/21 Q1
69.27280 0.755810 8.582094 2.514877 2.543545 2.916416 1.749504 1.605789 4.031501 5.377904 0.545890 0.103874
2020/21 Q2
64.29357 0.695487 7.946416 2.362598 2.481892 2.646481 1.664354 2.214082 8.725586 5.086763 0.689938 1.192835
2020/21 Q3
59.71743 1.510778 8.719084 2.136823 2.948466 3.565874 2.204001 2.684801 9.108169 4.638701 0.642550 2.123325
2020/21 Q4
56.02121 1.933585 8.331613 3.144053 2.768690 3.644535 2.162966 3.175161 10.56944 4.437025 0.712548 3.099171
2021/22 Q1
52.71757 3.134248 9.129114 3.223287 2.752885 3.669733 2.711551 3.413406 10.28139 4.233128 0.670087 4.063596
2021/22 Q2
49.98476 3.488003 8.656034 3.124750 2.774954 3.980655 2.710864 4.178281 11.31062 4.108035 0.860957 4.822080
2021/22 Q3
47.90103 3.669959 8.564940 3.128241 2.678046 4.021194 3.325837 5.324464 11.17541 4.154721 0.897488 5.158669
2021/22 Q4
45.92849 3.751616 8.219462 3.000143 2.661243 3.930639 3.367493 6.180190 11.82540 3.994241 1.520627 5.620456
2022/23 Q1
44.44416 3.804044 8.149823 3.202670 2.976547 3.855276 3.954308 6.674138 11.64444 3.915139 1.620606 5.758846
2022/23 Q2
43.08816 3.843599 7.939893 3.096995 3.129917 3.727500 4.512297 7.162692 11.79624 3.785731 1.842956 6.074020
2022/23 Q3
42.57497 3.820925 7.891144 3.254205 3.171202 3.685523 4.767612 7.359603 11.73619 3.764810 1.902972 6.070847
2022/23 Q4
42.29762 3.822093 7.877432 3.244311 3.219499 3.639011 4.935012 7.379236 11.75952 3.722566 1.952142 6.151554
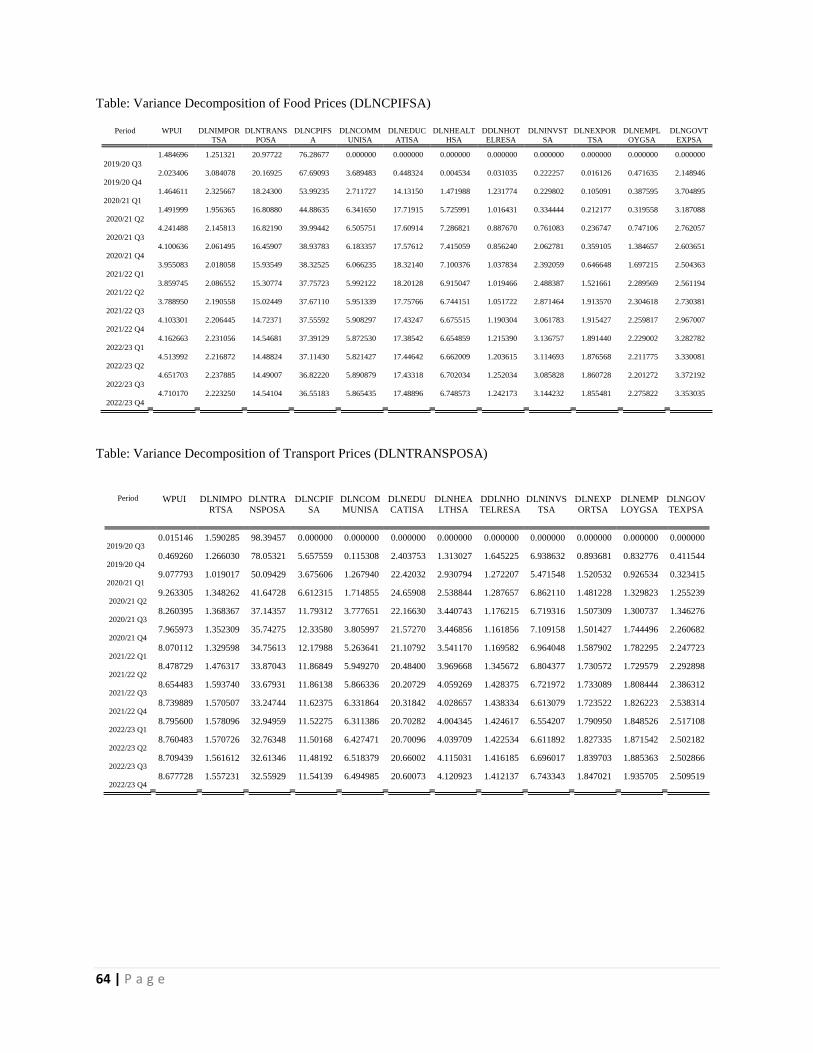
64 | P a g e
Table: Variance Decomposition of Food Prices (DLNCPIFSA)
Period WPUI DLNIMPOR
TSA
DLNTRANS
POSA
DLNCPIFS
A
DLNCOMM
UNISA
DLNEDUC
ATISA
DLNHEALT
HSA
DDLNHOT
ELRESA
DLNINVST
SA
DLNEXPOR
TSA
DLNEMPL
OYGSA
DLNGOVT
EXPSA
2019/20 Q3
1.484696 1.251321 20.97722 76.28677 0.000000 0.000000 0.000000 0.000000 0.000000 0.000000 0.000000 0.000000
2019/20 Q4
2.023406 3.084078 20.16925 67.69093 3.689483 0.448324 0.004534 0.031035 0.222257 0.016126 0.471635 2.148946
2020/21 Q1
1.464611 2.325667 18.24300 53.99235 2.711727 14.13150 1.471988 1.231774 0.229802 0.105091 0.387595 3.704895
2020/21 Q2
1.491999 1.956365 16.80880 44.88635 6.341650 17.71915 5.725991 1.016431 0.334444 0.212177 0.319558 3.187088
2020/21 Q3
4.241488 2.145813 16.82190 39.99442 6.505751 17.60914 7.286821 0.887670 0.761083 0.236747 0.747106 2.762057
2020/21 Q4
4.100636 2.061495 16.45907 38.93783 6.183357 17.57612 7.415059 0.856240 2.062781 0.359105 1.384657 2.603651
2021/22 Q1
3.955083 2.018058 15.93549 38.32525 6.066235 18.32140 7.100376 1.037834 2.392059 0.646648 1.697215 2.504363
2021/22 Q2
3.859745 2.086552 15.30774 37.75723 5.992122 18.20128 6.915047 1.019466 2.488387 1.521661 2.289569 2.561194
2021/22 Q3
3.788950 2.190558 15.02449 37.67110 5.951339 17.75766 6.744151 1.051722 2.871464 1.913570 2.304618 2.730381
2021/22 Q4
4.103301 2.206445 14.72371 37.55592 5.908297 17.43247 6.675515 1.190304 3.061783 1.915427 2.259817 2.967007
2022/23 Q1
4.162663 2.231056 14.54681 37.39129 5.872530 17.38542 6.654859 1.215390 3.136757 1.891440 2.229002 3.282782
2022/23 Q2
4.513992 2.216872 14.48824 37.11430 5.821427 17.44642 6.662009 1.203615 3.114693 1.876568 2.211775 3.330081
2022/23 Q3
4.651703 2.237885 14.49007 36.82220 5.890879 17.43318 6.702034 1.252034 3.085828 1.860728 2.201272 3.372192
2022/23 Q4
4.710170 2.223250 14.54104 36.55183 5.865435 17.48896 6.748573 1.242173 3.144232 1.855481 2.275822 3.353035
Table: Variance Decomposition of Transport Prices (DLNTRANSPOSA)
Period WPUI DLNIMPO
RTSA
DLNTRA
NSPOSA
DLNCPIF
SA
DLNCOM
MUNISA
DLNEDU
CATISA
DLNHEA
LTHSA
DDLNHO
TELRESA
DLNINVS
TSA
DLNEXP
ORTSA
DLNEMP
LOYGSA
DLNGOV
TEXPSA
2019/20 Q3 0.015146 1.590285 98.39457 0.000000 0.000000 0.000000 0.000000 0.000000 0.000000 0.000000 0.000000 0.000000
2019/20 Q4 0.469260 1.266030 78.05321 5.657559 0.115308 2.403753 1.313027 1.645225 6.938632 0.893681 0.832776 0.411544
2020/21 Q1 9.077793 1.019017 50.09429 3.675606 1.267940 22.42032 2.930794 1.272207 5.471548 1.520532 0.926534 0.323415
2020/21 Q2 9.263305 1.348262 41.64728 6.612315 1.714855 24.65908 2.538844 1.287657 6.862110 1.481228 1.329823 1.255239
2020/21 Q3 8.260395 1.368367 37.14357 11.79312 3.777651 22.16630 3.440743 1.176215 6.719316 1.507309 1.300737 1.346276
2020/21 Q4 7.965973 1.352309 35.74275 12.33580 3.805997 21.57270 3.446856 1.161856 7.109158 1.501427 1.744496 2.260682
2021/22 Q1 8.070112 1.329598 34.75613 12.17988 5.263641 21.10792 3.541170 1.169582 6.964048 1.587902 1.782295 2.247723
2021/22 Q2 8.478729 1.476317 33.87043 11.86849 5.949270 20.48400 3.969668 1.345672 6.804377 1.730572 1.729579 2.292898
2021/22 Q3 8.654483 1.593740 33.67931 11.86138 5.866336 20.20729 4.059269 1.428375 6.721972 1.733089 1.808444 2.386312
2021/22 Q4 8.739889 1.570507 33.24744 11.62375 6.331864 20.31842 4.028657 1.438334 6.613079 1.723522 1.826223 2.538314
2022/23 Q1 8.795600 1.578096 32.94959 11.52275 6.311386 20.70282 4.004345 1.424617 6.554207 1.790950 1.848526 2.517108
2022/23 Q2 8.760483 1.570726 32.76348 11.50168 6.427471 20.70096 4.039709 1.422534 6.611892 1.827335 1.871542 2.502182
2022/23 Q3 8.709439 1.561612 32.61346 11.48192 6.518379 20.66002 4.115031 1.416185 6.696017 1.839703 1.885363 2.502866
2022/23 Q4 8.677728 1.557231 32.55929 11.54139 6.494985 20.60073 4.120923 1.412137 6.743343 1.847021 1.935705 2.509519

65 | P a g e
Table: Variance Decomposition of Communication Prices (DLNCOMMUNISA)
Period WPUI DLNIMP
ORTSA
DLNTRA
NSPOSA
DLNCPIF
SA
DLNCOM
MUNISA
DLNEDU
CATISA
DLNHEA
LTHSA
DDLNHO
TELRESA
DLNINVS
TSA
DLNEXP
ORTSA
DLNEMP
LOYGSA
DLNGOV
TEXPSA
2019/20 Q3 1.306594 2.913768 1.553042 1.223781 93.00281 0.000000 0.000000 0.000000 0.000000 0.000000 0.000000 0.000000
2019/20 Q4 1.184220 2.243507 2.024281 1.011701 69.73485 0.663792 20.44030 0.049664 0.166179 1.976667 0.340701 0.164133
2020/21 Q1 2.220124 3.323953 3.085897 5.114490 65.48487 0.850507 16.12998 0.329310 0.177325 1.569151 1.426081 0.288317
2020/21 Q2 1.983036 2.958803 2.750410 6.234255 59.52906 0.801370 17.34591 0.634479 1.392619 3.876565 1.702911 0.790588
2020/21 Q3 2.741222 2.750946 2.847796 5.995844 57.18668 0.757964 16.01136 2.893542 1.514381 4.756366 1.679306 0.864596
2020/21 Q4 2.614767 3.130468 2.749199 6.096972 53.96524 0.879338 15.11440 3.439318 1.501137 6.573740 2.726610 1.208812
2021/22 Q1 2.524585 3.282507 2.887348 5.815515 53.90274 0.949155 15.44307 3.291714 1.433580 6.261979 2.859669 1.348134
2021/22 Q2 3.003762 3.108387 2.754757 5.652158 51.78330 1.106617 15.35482 4.571270 1.822806 6.561722 2.703409 1.576991
2021/22 Q3 3.006261 3.045418 2.780904 5.539998 51.38073 1.225121 15.07870 5.184763 1.931142 6.455179 2.825204 1.546581
2021/22 Q4 3.423033 3.003296 2.811742 5.843880 50.67320 1.213734 14.86927 5.131035 2.027922 6.495549 2.980941 1.526398
2022/23 Q1 3.389782 2.947321 2.797634 5.980022 50.96068 1.223957 14.83900 5.044529 1.987180 6.350273 2.910152 1.569470
2022/23 Q2 3.372079 2.932152 2.805675 5.973376 50.71527 1.218195 15.06904 5.027067 2.018696 6.357601 2.927635 1.583212
2022/23 Q3 3.366041 2.927463 2.802055 5.926168 50.78587 1.327561 14.98169 5.015501 2.037120 6.312294 2.905379 1.612856
2022/23 Q4 3.391563 2.917393 2.785596 6.013646 50.46844 1.333344 14.98523 5.234623 2.034782 6.301882 2.895063 1.638436
Table: Variance Decomposition of Education Prices (DLEDUCATISA)
Period WPUI DLNIMP
ORTSA
DLNTRA
NSPOSA
DLNCPIF
SA
DLNCO
MMUNIS
A
DLNEDU
CATISA
DLNHEA
LTHSA
DDLNHO
TELRES
A
DLNINV
STSA
DLNEXP
ORTSA
DLNEMP
LOYGSA
DLNGOV
TEXPSA
2019/20 Q3 3.262227 0.912424 12.28619 2.984353 0.815186 79.73962 0.000000 0.000000 0.000000 0.000000 0.000000 0.000000
2019/20 Q4 7.972524 1.323996 10.07189 2.624789 1.397171 68.59687 4.299221 0.187995 3.139038 0.136099 0.204560 0.045849
2020/21 Q1 7.414352 3.506517 8.834691 7.648257 3.314057 57.50959 3.545379 0.163341 4.735216 0.115693 2.938243 0.274661
2020/21 Q2 7.113784 3.371109 8.304176 7.658096 5.203923 54.04734 4.667698 0.723486 5.086413 0.108810 3.293112 0.422054
2020/21 Q3 6.835212 3.261976 8.289246 7.322635 5.490567 51.83910 4.465197 1.021443 4.864315 2.796261 3.401385 0.412662
2020/21 Q4 6.388654 3.204233 7.826407 7.537932 7.920920 48.20265 4.337926 3.095366 4.717277 2.717895 3.515472 0.535264
2021/22 Q1 7.015960 3.195139 7.725836 7.716876 7.737937 47.13788 4.308998 3.091878 4.774787 2.661118 4.017171 0.616425
2021/22 Q2 7.330583 3.113663 7.533150 7.702025 10.20102 44.03732 4.372675 3.289687 4.853477 2.488014 3.923177 1.155209
2021/22 Q3 7.250268 3.077720 7.438717 7.677712 10.09406 43.49970 4.792596 3.757879 4.789084 2.538808 3.920664 1.162789
2021/22 Q4 7.596041 3.020817 7.386105 7.587556 10.15653 43.14570 4.896665 3.925317 4.703923 2.491668 3.928364 1.161312
2022/23 Q1 7.593040 3.009090 7.294391 7.631096 10.57875 42.61593 4.974977 3.908828 4.697705 2.514530 4.012706 1.168956
2022/23 Q2 7.790007 2.965035 7.456205 7.595829 10.68590 42.04005 5.252290 3.859504 4.700350 2.480908 4.023175 1.150746
2022/23 Q3 7.764154 2.983224 7.514548 7.592500 10.66262 42.01209 5.237195 3.892142 4.692360 2.473965 4.010647 1.164565
2022/23 Q4 7.721316 3.039852 7.452781 7.581772 10.64125 41.70213 5.230215 4.001428 4.862523 2.459093 4.058848 1.248791

66 | P a g e
Table: Variance Decomposition of Hotel & Restaurant Prices (DLNHOTELRESA)
Period WPUI DLNIMP
ORTSA
DLNTRA
NSPOSA
DLNCPIF
SA
DLNCO
MMUNIS
A
DLNEDU
CATISA
DLNHEA
LTHSA
DDLNHO
TELRES
A
DLNINV
STSA
DLNEXP
ORTSA
DLNEMP
LOYGSA
DLNGOV
TEXPSA
2019/20 Q3 0.868584 1.388432 7.206950 31.77179 6.010263 18.93382 0.701398 33.11877 0.000000 0.000000 0.000000 0.000000
2019/20 Q4 1.128624 2.655650 6.219459 20.95713 4.239690 22.10467 3.463799 35.76765 2.465294 0.002671 0.852418 0.142947
2020/21 Q1 4.968094 2.045856 5.523081 17.87552 3.410059 25.67373 3.058949 28.10166 4.972472 0.028781 3.899861 0.441938
2020/21 Q2 5.290020 3.320743 6.529164 14.08376 10.86563 20.26430 5.395628 22.45639 4.737631 1.553635 3.433609 2.069488
2020/21 Q3 5.250009 3.840874 6.047045 14.05636 9.888232 18.65912 9.216429 21.22795 4.846618 1.501365 3.171416 2.294585
2020/21 Q4 5.236598 3.754940 5.961522 14.00095 9.978417 18.43529 9.359129 20.79442 5.005701 1.482941 3.744393 2.245695
2021/22 Q1 6.644358 3.836590 5.801501 13.58272 10.91376 17.73753 9.398977 19.88240 4.784649 1.433747 3.580689 2.403081
2021/22 Q2 7.038073 3.790454 5.871943 13.32509 11.00905 17.79106 9.482376 19.50073 4.734812 1.445221 3.540824 2.470383
2021/22 Q3 6.939787 4.230788 5.874554 13.14757 10.85803 17.54402 9.349655 19.58577 4.802013 1.425065 3.496174 2.746583
2021/22 Q4 6.924317 4.432332 5.793473 12.96166 10.71124 17.35935 9.235909 19.78140 5.026740 1.407610 3.552741 2.813227
2022/23 Q1 6.773747 4.380341 5.703375 12.68920 10.52236 17.27586 9.137166 20.20104 5.274321 1.537859 3.561317 2.943426
2022/23 Q2 6.612961 4.337451 5.586962 12.39456 10.33643 16.89179 9.017183 20.60390 5.777758 1.501291 3.833066 3.106649
2022/23 Q3 6.511943 4.353341 5.608501 12.27024 10.23095 16.63956 9.237411 20.72928 5.801279 1.478102 3.930801 3.208597
2022/23 Q4 6.487315 4.365207 5.543977 12.06661 10.32309 16.34684 9.411276 20.67590 5.907686 1.452309 4.030310 3.389489
Table: Variance Decomposition of Health Prices (DLNHEALTHSA)
Period WPUI DLNIMP
ORTSA
DLNTRA
NSPOSA
DLNCPIF
SA
DLNCO
MMUNIS
A
DLNEDU
CATISA
DLNHEA
LTHSA
DDLNH
OTELRE
SA
DLNINV
STSA
DLNEXP
ORTSA
DLNEMP
LOYGSA
DLNGO
VTEXPS
A
2019/20 Q3 0.099439 5.337183 10.80450 3.911855 5.397821 0.125980 74.32322 0.000000 0.000000 0.000000 0.000000 0.000000
2019/20 Q4 0.100360 4.597233 9.397350 5.783985 6.847421 0.353427 65.85954 3.410723 0.386881 0.708213 0.558825 1.996040
2020/21 Q1 0.233290 4.435455 8.807536 6.076801 8.650755 1.008209 62.60289 3.432994 0.398048 1.676756 0.615293 2.061975
2020/21 Q2 6.837679 3.953781 8.539330 6.404976 8.395454 1.671852 55.13470 3.916483 0.463835 1.951354 0.542088 2.188470
2020/21 Q3 7.088695 3.844409 8.220855 6.306738 8.674146 1.626862 53.04190 4.108799 0.464309 2.889674 1.605733 2.127881
2020/21 Q4 7.299285 3.988936 8.073138 6.504449 8.624549 2.145044 52.04075 4.181471 0.566006 2.871453 1.611789 2.093130
2021/22 Q1 7.335799 3.904531 8.018009 6.768219 9.316447 2.449844 50.29527 4.731476 0.764093 2.811237 1.557702 2.047379
2021/22 Q2 7.110373 3.818379 8.695539 6.894107 9.171545 3.095453 49.01320 4.858088 0.852669 2.724810 1.695471 2.070366
2021/22 Q3 7.345834 3.782729 8.625114 6.869204 9.071913 3.292676 48.47714 4.897564 1.080099 2.715993 1.792556 2.049173
2021/22 Q4 7.306421 3.762596 8.580467 7.013254 8.970866 3.615466 48.23811 4.917053 1.070183 2.686499 1.773353 2.065729
2022/23 Q1 7.271938 3.748070 8.548152 6.987465 9.240450 3.642603 48.01448 4.895747 1.069705 2.686484 1.818709 2.076200
2022/23 Q2 7.379011 3.732412 8.540084 7.029736 9.226308 3.628591 47.85922 4.877179 1.096518 2.711867 1.849998 2.069076
2022/23 Q3 7.398841 3.728308 8.535813 7.020252 9.276733 3.638854 47.79160 4.877898 1.097147 2.715702 1.850539 2.068313
2022/23 Q4 7.382477 3.748560 8.514912 7.033068 9.258289 3.634602 47.69754 4.928176 1.137413 2.712030 1.856867 2.096071

67 | P a g e
Table: Variance Decomposition of Government Expenditure (DLNGOVTEXPSA)
Table: Variance Decomposition of Export (DLNEXPORTSA)
Period WPUI DLNIMPO
RTSA
DLNTRA
NSPOSA
DLNCPIF
SA
DLNCOM
MUNISA
DLNEDU
CATISA
DLNHEA
LTHSA
DDLNHO
TELRESA
DLNINVS
TSA
DLNEXP
ORTSA
DLNEMP
LOYGSA
DLNGOV
TEXPSA
2019/20 Q3 0.002606 0.370755 0.125376 17.26645 27.66770 0.511366 1.332295 4.042496 2.011381 0.058036 1.796103 44.81544
2019/20 Q4 1.807774 0.914530 0.853521 17.22624 21.98553 2.597692 1.876216 4.670101 2.197219 1.017678 2.800658 42.05284
2020/21 Q1 4.060669 3.884311 0.689954 15.83593 16.12067 5.425980 2.720049 6.511286 2.721395 7.633272 2.282911 32.11357
2020/21 Q2 3.479730 5.801657 0.977124 14.76073 14.89600 4.942023 4.824475 8.254005 2.948414 6.773361 3.458272 28.88420
2020/21 Q3 3.507089 5.105775 1.660696 12.87671 14.73469 4.516446 8.029699 8.502395 2.812365 6.268834 6.084804 25.90050
2020/21 Q4 3.253938 4.615082 1.655665 11.78174 13.66905 4.206176 10.00664 11.25893 3.012638 5.741880 6.808806 23.98945
2021/22 Q1 3.195578 4.422138 1.593255 11.30146 13.14378 4.235419 10.82038 12.46952 2.893403 5.768637 7.130468 23.02596
2021/22 Q2 4.580561 4.246556 1.684925 10.95744 14.00183 4.070778 10.57504 11.97621 2.939719 5.727953 7.125263 22.11372
2021/22 Q3 5.810222 4.096085 1.789017 11.02802 14.51164 3.973642 10.60861 11.64082 2.866151 5.532677 6.874421 21.26868
2021/22 Q4 6.036260 4.100878 1.806649 10.99404 14.37890 3.954830 10.66023 11.75409 2.869995 5.478269 6.893961 21.07190
2022/23 Q1 5.907866 4.122797 1.773153 10.92912 14.19643 3.960672 10.55135 12.40283 3.112456 5.412455 6.880224 20.75065
2022/23 Q2 5.764821 4.065011 1.735943 10.75401 13.85809 4.007401 10.43748 13.35496 3.362108 5.325440 6.987369 20.34737
2022/23 Q3 5.742432 4.035837 1.767700 10.52392 13.60638 4.046195 10.34537 13.89863 3.593457 5.212374 7.175441 20.05226
2022/23 Q4 5.801479 4.034560 1.824318 10.38474 13.71351 3.994545 10.38059 13.98101 3.729466 5.110871 7.259652 19.78526
Period WPUI DLNIMPO
RTSA
DLNTRA
NSPOSA
DLNCPIF
SA
DLNCOM
MUNISA
DLNEDU
CATISA
DLNHEA
LTHSA
DDLNHO
TELRESA
DLNINVS
TSA
DLNEXPO
RTSA
DLNEMP
LOYGSA
DLNGOV
TEXPSA
2019/20 Q3 99.96526 0.001656 0.001416 4.60E-05 0.000215 0.000611 0.011992 1.73E-05 0.005056 0.013733 0.000000 0.000000
2019/20 Q4 74.70264 0.225329 8.715148 2.210869 2.341179 2.183879 0.477018 1.543096 1.222187 5.311597 0.802815 0.264247
2020/21 Q1 75.03030 0.456795 7.769942 3.271313 2.044217 2.240516 0.815694 1.347447 1.203375 4.640664 0.921484 0.258250
2020/21 Q2 71.29304 0.436100 7.222232 3.077438 1.967484 2.047797 0.754828 1.923532 4.831325 4.522607 0.985888 0.937730
2020/21 Q3 68.11947 0.933024 8.016840 2.882397 2.175371 2.774535 1.234928 2.039247 5.274345 4.228164 0.919956 1.401723
2020/21 Q4 65.41283 1.103889 7.825029 3.662869 2.089915 2.801187 1.261134 2.298715 6.426030 4.110030 0.918546 2.089823
2021/22 Q1 62.97693 1.962239 8.472919 3.666241 2.041766 2.864294 1.681515 2.407625 6.354952 3.958853 0.900285 2.712386
2021/22 Q2 61.16318 2.202993 8.236165 3.674584 2.041428 3.220223 1.656306 2.720667 7.070500 3.896019 0.957567 3.160365
2021/22 Q3 59.61979 2.382802 8.242514 3.672570 2.002322 3.293025 2.026388 3.294861 7.114914 3.955419 0.949347 3.446053
2021/22 Q4 58.13579 2.469608 8.036879 3.581481 1.990729 3.302488 2.055810 3.832887 7.650596 3.859629 1.302645 3.781454
2022/23 Q1 56.98968 2.545402 8.002110 3.671908 2.106306 3.274193 2.463062 4.229902 7.609186 3.818729 1.356804 3.932720
2022/23 Q2 55.79609 2.604594 7.849104 3.594210 2.207720 3.208285 2.790579 4.631004 7.840507 3.736226 1.543817 4.197860
2022/23 Q3 55.26807 2.606312 7.819241 3.678535 2.252217 3.186137 2.997323 4.827813 7.833457 3.725194 1.583714 4.221983
2022/23 Q4 54.87044 2.626116 7.791079 3.652678 2.291204 3.153545 3.136755 4.909533 7.924932 3.691240 1.638509 4.313965

68 | P a g e
Table: Variance Decomposition of Import (DLNIMPORTSA)
Period WPUI DLNIMP
ORTSA
DLNTRA
NSPOSA
DLNCPIF
SA
DLNCOM
MUNISA
DLNEDU
CATISA
DLNHEA
LTHSA
DDLNHO
TELRESA
DLNINVS
TSA
DLNEXP
ORTSA
DLNEMP
LOYGSA
DLNGOV
TEXPSA
2019/20 Q3 1.413923 98.58608 0.000000 0.000000 0.000000 0.000000 0.000000 0.000000 0.000000 0.000000 0.000000 0.000000
2019/20 Q4 10.72404 72.88670 0.415412 6.631310 0.533876 1.926921 3.266005 0.121566 0.160990 1.397614 0.854051 1.081518
2020/21 Q1 11.16262 51.17584 2.794023 16.08950 1.607234 1.412162 5.687036 3.953404 1.123481 1.296195 0.657758 3.040745
2020/21 Q2 8.778418 40.11125 2.622166 13.56470 2.056388 7.281859 8.362920 8.653029 2.528302 1.516701 1.187679 3.336588
2020/21 Q3 6.979149 31.82571 2.049936 10.51924 3.381349 18.82230 7.002582 9.515807 4.057059 1.411655 1.836931 2.598291
2020/21 Q4 6.666524 29.21348 2.936035 9.654771 5.178472 18.49731 6.896755 10.00809 4.778771 1.320012 1.889730 2.960051
2021/22 Q1 7.351943 28.29524 3.022636 10.01983 4.879444 17.43388 8.058758 9.918608 4.582245 1.387935 1.851636 3.197852
2021/22 Q2 7.550702 27.95910 3.187923 10.06304 4.784255 17.01291 8.331897 9.739253 4.479473 1.443864 2.015219 3.432369
2021/22 Q3 7.806046 27.49415 3.244552 9.942242 5.575448 16.84769 8.175885 9.609432 4.399277 1.470487 2.005391 3.429400
2021/22 Q4 7.930973 27.34061 3.255466 9.925946 5.570843 16.75425 8.296819 9.669578 4.385291 1.464388 1.994948 3.410893
2022/23 Q1 7.915997 27.36835 3.269719 9.901258 5.554534 16.73952 8.282550 9.647216 4.372903 1.462489 2.048719 3.436739
2022/23 Q2 7.937480 27.35854 3.258556 9.864268 5.679714 16.73461 8.251796 9.616828 4.357587 1.457270 2.047319 3.436033
2022/23 Q3 7.944664 27.30027 3.253412 9.847755 5.675294 16.70769 8.278645 9.643269 4.385317 1.481217 2.042364 3.440097
2022/23 Q4 7.916484 27.21082 3.245966 9.815380 5.661446 16.64696 8.252188 9.756087 4.504417 1.476152 2.052638 3.461454

69 | P a g e
2. Estimated Data Set
ETHIOPIA
N FISCAL
YEAR,
E.F.Y)
CPI-
Food
CPI
Healt
h
CPI
Transpor
t
CPI-
Communicatio
n
CPI-
Educatio
n
CPI
Restaurant
s and
Hotels Export Import
. Investment
Expenditure
(domestic &
Foreign) Total
Employment WPUI
Gov`t Expend
2001 Q1 48.1 3,388,420,000.0 24,931,900,000.0 31,497,000,000
391,994 0.0
12,257,300,000.0
2001 Q2 44.1 37.1 48.2 107.4 47.5 30.5 2,670,722,000.0 19,682,800,000.0 28,510,000,000
240,960 0.0
12,361,600,000.0
2001 Q3 40.9 38 52.1 106.4 49 31.7 4,398,807,000.0 20,431,400,000.0 28,420,000,000
266,728 0.0
12,926,900,000.0
2001 Q4 41.3 38.8 46.5 105.3 49.6 32.8 4,748,720,000.0 19,631,100,000.0 142,250,000,000
266,489 0.0
20,228,500,000.0
2002 Q1 41.9 41.1 48.4 104.1 51.4 33.7 4,235,293,000.0 21,931,900,000.0 28,047,000,000
181,310 0.0
14,624,400,000.0
2002 Q2 41 42.5 55 103.4 53.9 35.2 4,661,167,000.0 29,280,300,000.0 21,213,410,000.00
170,630 0.0
16,279,000,000.0
2002 Q3 40.9 43.9 60.2 104.8 55.6 36.9 7,380,482,000.0 30,274,900,000.0 23,548,970,000.00
169,220 0.0
17,512,300,000.0
2002 Q4 41.1 46.4 62.4 103 57.3 37.8 9,838,364,000.0 27,469,200,000.0 23,785,400,000.00
179,657 0.0
22,919,100,000.0
2003 Q1 41.7 47.8 65.3 101.1 57.7 38.8 8,126,813,000.0 27,929,400,000.0 39,013,200,000.00
222,501 0.0
19,521,500,000.0
2003 Q2 43.7 47.9 65.7 100.4 61.3 39.6 9,067,751,000.0 36,215,600,000.0 12,087,200,000.00
98,890 0.0
19,048,400,000.0
2003 Q3 48 50.2 72.5 100.7 72.3 42.4 12,685,567,000 32,559,500,000.00 160,359,800,000.00
248,822 0.0
20,731,200,000.00
2003 Q4 57.4 51.5 83.8 100.3 72.3 43.9 14,645,434,000.0 32,988,900,000.0 17,933,900,000.00
137,004 0.0
34,530,200,000.0
2004 Q1 62.4 52.9 96.6 100 74.5 48.9 12,799,320,000.0 39,434,000,000.0 30,371,000,000
128,519 0.0
20,647,100,000.0
2004 Q2 65.4 54.2 97.2 99.5 77.8 53.1 10,196,362,000.0 45,452,000,000.0 31,959,000,000
86,842 0.0
27,946,300,000.0
2004 Q3 69.5 55.6 94.7 99.2 82.7 56.3
14,165,205,600
56,843,000,000.0 35,434,000,000
159,839 0.0
26,338,300,000.0
2004 Q4 75.4 56.8 96.9 99.1 82.6 59.6 16,980,993,120.0 49,121,000,000.0 12,976,000,000
65,627 0.0
29,855,300,000.0
2005 Q1 77.6 58 97.5 99.1 85.1 63.1 12,477,356,900.0 45,693,890,000.0 31,890,000,000
123,507 0.0
22,768,675,000.0
2005 Q2 76.3 59.4 97.1 99.1 84.1 66.2 12,944,326,600.0 59,269,417,000.0 23,007,000,000
68,901 0.0
22,768,675,000.0
2005 Q3 75.7 70.3 98.5 99.2 84.1 68.9 14,875,846,900 45,978,695,000.0 26,065,000,000
76,801 0.0
22,768,675,000.0
2005 Q4 77.5 71.1 95.6 99.1 85.3 70.6
15716795600
45,929,013,000 29,310,000,000
96,699 0.0
22768675000
2006 Q1 81.2 73.3 95 99.1 86.7 72.9 11,825,143,600.0 54,693,000,000.0 21,456,000,000
116,666 0.0
30,769,400,000.0
2006 Q2 81.4 72 94.6 99.1 86.7 76.1 12,905,388,400.0 66,084,000,000.0 50,236,500,000.00
88,174 0.0
41,515,600,000.0
2006 Q3 79.7 77.7 96.7 99.1 86.7 78.1 18,715,013,900.0 70,690,000,000.0 39,764,700,000.00
206,258 0.0
43,187,900,000.0
2006 Q4 82.9 80.2 98.5 99.1 86.7 78.8 18,797,453,600.0 70,370,000,000.0 14,137,000,000.00
138,999 0.0
69,998,800,000.0
2007 Q1 85.2 82.9 99.2 99.1 86.9 80.3 14,213,754,800.0 72,347,869,000.0 162300000
2,061 34.5
45,122,000,000.0
2007 Q2 85.3 82.5 99 99.3 87.7 81.3 12,777,498,800.0 87,639,117,000.0 73900000
1,281 0.0
54,825,700,000.0
2007 Q3 86.9 83.8 99.3 99.1 87 81.7 14,596,391,330.0 84,662,746,000.0 67500000
6,207 24.2
52,403,900,000.0
2007 Q4 92.1 86.7 96.3 99.6 87.1 83.3 14,460,828,720.0 86,144,501,000.0 608500000
7,665 14.5
72,403,900,000.0
2008 Q1 97.9 86.1 94.8 101.2 87.2 85.4 12,471,120,400.0 85,408,968,000.0 3,750,000,000.0
10,364 8.1
42,685,900,000.0
2008 Q2 96.9 87.6 96.5 103.9 91.4 88 10,598,336,690.0 87,288,459,000.0 54,300,000.0
1,133 0.0
66,670,500,000.0
2008 Q3 95.2 92 98.2 101.3 99.8 90.8 13,961,929,090.0 92,644,720,000.0 77,200,000.0
184 7.3
62,271,700,000.0
2008 Q4 98.7 93.8 97.2 100.3 99.8 92.6 15,331,192,670.0 87,671,709,000.0 1,752,700,000.0
4,336 0.0
101,302,000,000.0
2009 Q1 102.
6 97.4 97 101.5 99.9 94.9 12,323,039,260.0 88,878,692,000.0
6181700000 7,811 0.0
51,957,800,000.0

70 | P a g e
2009 Q2 101.
3 95.1 98.1 99.7 100 97.6 10,698,282,950.0 87,611,064,000 963,000,000.0
7,551 7.8
78,881,800,000.0
2009 Q3 103.
0 98.8 99.3 99.9 100 99.1 14,634,359,880.0 84,013,849,000.0 864,500,000.0
510 8.0
79,414,900,000.0
2009 Q4 109.
5 104.3 103.9 99.8 100 98.1 25,243,562,230.0 93,767,307,000.0 394,300,000.0
1,557 0.0
119,032,300,000.0
2010 Q1 113.
9 113.4 104.7 102.1 99.4 101.6 13,216,142,280.0 92,760,976,000.0 668,500,000.0
2,642 0.0
67,926,700,000.0
2010 Q2 116.
6 97 106.3 101.7 106 107.9 ############## 105,774,738,000.0
612,500,000.00 1,804 0.0
71,685,900,000.00
2010 Q3 118.
7 92.9 108.9 103.4 107.5 113.5 16,873,256,770.0 96,527,340,000.0 6,386,400,000.0
6,929 0.0
71,063,400,000.0
2010 Q4 123.
1 99.9 111.4 105.9 109.2 114 19,985,363,740.0 99,238,631,000 12990700000
233,013 0.0
63,444,500,000.0
2011 Q1 128.
2 101.3 113.2 107.2 110.4 118.6 16,748,621,860.0 100,982,482,000.0 5,886,800,000.0
17,680 0.0
66,651,800,000.0
2011 Q2 128.
3 107.2 115.5 106.7 117.5 123.7 15,945,810,490.0 123,391,918,000.0 814,100,000.0
4,089 0.0
90,313,300,000.0
2011 Q3 132.
0 110.6 119.7 101.1 125.8 128.1 19,220,672,250.0
100,774,956,000
250,000,000.0
2,437 0.0
99,070,400,000.0
2011 Q4 145.
7 116 128.9 101.5 126.3 130.8
##############
98,244,794,000
898500000
6,654 0.0
157,070,300,000.0
0
2012 Q1 156.6
114.8 132.3 105.5 129.5 135.7 21,030,549,390.0
108,993,105,000
60,700,000.0
112 0.0
87,660,900,000.0
2012 Q2 158.5
120.2 136 105.6 132.6 145.9 18,486,498,200.0
115,423,297,000
99,700,000.0
1,047 0.0
195,048,900,000.0
152