the effect of potential torsion on seismic ... the effect of potential torsion on seismic response...
TRANSCRIPT
1
THE EFFECT OF POTENTIAL TORSION ON SEISMIC RESPONSE OF
REGULAR MID-RISE RC BUILDINGS
Mehmet INEL1, B. Tanik CAYCI22 and Esra OZER3
ABSTRACT
The aim of this study is to evaluate the existence of torsion due to nonlinear behavior of lateral load resisting elements during moderate or strong earthquakes and to check the validity of pushover analysis of existing regular buildings. Therefore, torsion due to unsymmetrical distribution of lateral load resisting elements in the plan of the structure is not in the scope of the current study.
Two reference RC buildings, 4- and 7-story, are selected for the purpose the current study. The other set of buildings is obtained from reference buildings by adding heavy overhangs with and without edge beams. The building models considered in the current study are subjected to 12 ground motion records using SAP2000 program to carry out nonlinear time history analyses. Displacement demands at the center of mass and corner points of the building were obtained for both X and Y directions. The maximum interstory displacement drift demand ratio (IDR) values are determined. Then, torsional irregularity factors are calculated for the story with maximum IDR according to definition given in TEC-2007. Similarly, torsional irregularity factors for nonlinear static (pushover) analyses are also determined.
Similar to other codes, TEC-2007 consider 5% additional eccentricities for bi values greater than 1.2 for the design of buildings to take into account for torsion. Also it is widely accepted that pushover analysis is applied to buildings with torsional irregularity factor,bi smaller than 1.4 without considering accidental eccentricity. Since the buildings considered in the study do not have unsymmetrical distribution of lateral load resisting elements, bi values are smaller than 1.2 for all cases when static analyses are considered. The bi values from pushover analyses show that 4-story building has a torsional tendency in y direction while potential torsion for the 7-story building is in x direction. This observation is consistent with displacement demands obtained from time history analyses. Potential torsion directions of both 4- and 7-story buildings have higher torsional irregularity factors, consistently.
Maximum bi value is calculated as 1.49 for 4-story HO-1.1 model during Koc-Dzc 270 record at y direction. It’s approximately 45% higher than the value obtained by pushover analysis. Although the torsional irregularity factors rarely exceed the pushover limit 1.4, they are beyond 1.2, limit for additional eccentricity, for considerably higher number of times. The effect of overhang irregularities on torsional irregularity factors are limited for the scope the current study. Because the overhangs do not changes the distance between center of mass and center of rigidity by a remarkable amount. There is no clear trend between the irregularity factor and displacement increase due to torsion although the corner displacements slightly tend to increase as bi values get larger. Peak displacement demands at the corner are about 10% higher than those obtained at the center of mass in the scope this study.
1 Prof. Dr., Pamukkale University Civil Engineering Department, Denizli, Turkey. [email protected] 2 Ph.D. student, Pamukkale University Civil Engineering Department, Denizli, Turkey, [email protected] 3 M.S.student, Pamukkale University Civil Engineering Department, Denizli, Turkey, [email protected]
2
INTRODUCTION
Past studies have shown that torsional irregularity may exist in structures, which are symmetric regarding to both plan geometry and stiffness distribution of structural elements (Ozmen, 2002). However, torsional effects on buildings subjected to earthquakes are not found directly in structural analysis unless full three-dimensional inelastic dynamic time history analysis is conducted (Miranda et al., 2012). The studies also conclude that seismic torsion leads to increased displacement at the extremes of the building and may cause distress in the lateral load-resisting elements located at the edges, particularly in buildings that are torsionally flexible.
There are studies in literature to evaluate torsional response of buildings due to different parameters such as unsymmetrical distribution of mass or lateral load resisting elements in the plan of the structure or inelastic behavior of resisting elements and loss of the resistance of such an element during an earthquake (Paulay, 2001; Newmark, 1969; Kilar and Fajfar, 1997; Ladjinovic and Folic, 2008). Inelastic behavior of lateral load resisting elements and loss of resistance of such an element during a moderate or strong earthquake are also a source of torsional response.
Seismic performance of existing buildings is generally evaluated using nonlinear static analysis that has limitations in terms of building height and irregularities. Pushover analysis uses equivalent seismic load method as nonlinear static analysis. This method is applied to buildings not exceed 25 m and, 8 storey and buildings with torsional irregularity factor,bi smaller than 1.4 without considering accidental eccentricity. Torsional irregularity factor, bi, is defined for any of the two orthogonal earthquake directions as the ratio of the maximum relative story drift at any story to the average relative story drift at the same story in the same direction. Also, earthquake codes consider 5% additional eccentricities for bi values greater than 1.2 (e.g. 2007 Turkish Earthquake Code) for the design of buildings.
The aim this study is to evaluate the existence of torsion due to nonlinear behavior of lateral load resisting elements during moderate or strong earthquakes and to check the validity of pushover analysis of existing regular buildings. Therefore, torsion due to unsymmetrical distribution of lateral load resisting elements in the plan of the structure is not in the scope of the current study.
Two reference RC buildings, 4- and 7-story, are selected to represent major portion of existing building stock. The other set of buildings is obtained from reference buildings by adding heavy overhangs with and without edge beams. A set of 12 ground motion records is selected from past earthquakes with different characteristics and peak ground acceleration values in order to carry out nonlinear dynamic analysis. SAP2000 is used for nonlinear time history analyses. Beam and column elements are modelled as nonlinear frame elements with lumped plasticity by defining plastic hinges at both ends of beams and columns.
BUILDING DESCRIPTION AND MODELLING APPROACH
Two RC buildings, 4- and 7-story, are selected to represent reference mid-rise buildings located in the high seismicity region of Turkey. The selected buildings are typical beam-column RC frame buildings with no shear walls. Outcomes of detailed field and archive investigation (about 500 buildings) established building models; number of columns, column and beam dimensions, floor area or other parameters reflects a typical constructed building (Inet et al., 2009). These buildings are used to obtain buildings with heavy overhangs with and without edge beams.
The selected reference buildings are designed according to pre-modern Turkish Earthquake Code (TEC-1975), considering both gravity and seismic loads. A design ground acceleration of 0.4 g and soil class Z3 is assumed. Concrete compressive strength and yield strength of both longitudinal and transverse reinforcement values are considered to be 16 MPa and 220 MPa, respectively.
Figure 1 shows plan views of the selected buildings. All building plans are shown in the same plot. The buildings without shaded area as overhangs are reference buildings. The overhang amounts are based on the detailed field and archive investigation. HO-1 stands for average overhang amount from the study while HO-2 stands for average plus half standard deviation. The models for reference and OH-1 are shown in Figure 1. Figure 2 illustrates the HO-2 models. Based on the inventory study

M. Inel, B.T. Cayci and E. Ozer 3
by Inel et al. (2011), the overhang amount of 4-story building is 7.6% and 10.9% of floor area for HO-1 and HO-2 cases, respectively while that of 7-story building is 5.8% and 8.5% for HO-1 and HO-2 cases. In Figure 2, 4-story HO-1.0 corresponds to 4-story building having average overhang amount without edge beams while 4-story HO-1.1 denoted the same building with edge beams.
4-story building plan view
7-story building plan view
Figure 1. Plan views of 4- and 7-story reference buildings
As shown in Figure 3, five points labeled A, B, C, D, and E define force-deformation behavior of a plastic hinge. The values assigned to each of these points vary depending on type of element, material properties, longitudinal and transverse steel content, and axial load level on the element. Note that number of plastic hinges to be generated for each building is in the order of 500, 800 and 1800 for the 2-, 4- and 7-story buildings, respectively. Plastic hinge length is assumed to be half of the section depth as recommended in 2007 Turkish Earthquake Code. Also, effective stiffness values are obtained per the code; 0.4EI for beams and values between 0.4 and 08EI depending on axial load level for columns.
In 2007 Turkish Earthquake Code, torsional irregularity factor, bi, is defined for any of the two orthogonal earthquake directions as the ratio of the maximum relative story drift at any story to the average relative story drift at the same story in the same direction. Figure 4 shows corner point displacements of a typical floor under an earthquake in y direction. bi, is calculated as shown in Equations 1 and 2. (i)max, and (i)max are maximum and minimum displacements at the corners of ith floor.
averagei
ibi
max (1)

4
2
minmax iiaveragei
(2)
Figure 2. Plan views of 4- and 7-story buildings with heavy overhangs

M. Inel, B.T. Cayci and E. Ozer 5
Figure 3. Typical strength-deformation relation for a plastic hinge
Figure 4. Torsional irregularity factor, bi, defined in TEC-2007
GROUND MOTIONS
The ground motion records used in nonlinear time history analysis are selected from destructive earthquakes in the past. This set provides an opportunity to examine the effect of characteristics of ground motions on torsion behaviour of regular buildings. Table 1 lists the records considered in this study.
Response spectrum and average response spectrum of 12 ground motion records for 5% damping is plotted in Figure 5 as well as demand spectrum provided in Turkish Earthquake Code-2007 for design earthquake with 10% probability of exceedance in 50 years on Z3 soil class (compatible to soil class C of FEMA-356). As seen in the figure, average spectrum for the considered records is higher than the code spectrum of design earthquake (approximately up to 30-35%) within the period of interest for the mid-rise buildings. The code spectrum is provided to visualize the demand of selected records. No special effort has been given to fit the average of selected records to the code spectrum.
Deformation
Forc
e
A
B
C
D E
IO LS CP

6
Table 1. Records from destructive earthquakes in Turkey over past two decades
Identifier Earthquake Date
Magnitude Station Comp. PGA PGV Dist.
(dd/mm/yy) (o) (g) (m/s) (km) CM92PETR.
090 Cape
Mendocino 25.04.1992 MW= 7.1 Petrolia 090o 0.662 0.897 9.51
ER92ERZN. 090 Erzincan 13.03.1992 MW = 6.9 Erzincan East 0.496 0.643 21
GZ76GAZ. 000 Gazli 17.05.1976 MW= 6.8 Karakyr 360o 0.608 0.654 32
IV79ARY5. 140
Imperial Valley 15.10.1979 MW= 6.5 El Centro
Array #5 140o 0.519 0.469 11
KC99DUZC. 180 Kocaeli 17.08.1999 MW = 7.4 Duzce 180o 0.312 0.588 12.71
KC99DUZC. 270 Kocaeli 17.08.1999 MW = 7.4 Duzce 270o 0.358 0.464 12.71
LP89HOOL. 360 Loma Prieta 18.10.1989 MW = 6.9 Hollister-
South & Pine 360o 0.371 0.624 28.81
NR94PACO. 360 Northridge 17.01.1994 MW = 6.7 Pacoima
Kagel Canyon 360o 0.433 0.515 8.21
NR94SEPU. 360 Northridge 17.01.1994 MW = 6.7 Sepulveda VA 360o 0.939 0.766 8.91
NR94SYLM. 090 Northridge 17.01.1994 MW = 6.7 Sylmar - Olive
View Med FF 090o 0.604 0.782 6.41
NR94TARZ. 360 Northridge 17.01.1994 MW= 6.7 Tarzana,
Cedar Hill 360o 0.99 0.776 17.51
PS86NRPS. 210
N. Palm Springs 08.07.1986 MW= 6.0 North Palm
Springs 210o 0.594 0.733 8.21
1 Closest distance to fault rupture 2 Hypocentral
Figure 5. Response spectrum of ground motion records
ANALYSIS AND FINDINGS
The aim this study is to evaluate the existence of torsion due to nonlinear behavior of lateral load resisting elements during moderate or strong earthquakes and to check the validity of pushover analysis of existing regular buildings. Therefore, torsion due to unsymmetrical distribution of lateral load resisting elements in the plan of the structure is not in the scope of the current study.
The building models considered in the current study are subjected to 12 ground motion records using SAP2000 program to carry out nonlinear time history analyses. Displacement demands at the
0
0.5
1
1.5
2
2.5
3
3.5
0 0.5 1 1.5 2 2.5 3
Spec
tral A
ccel
erat
ion(
g)
Period (s)
Capemend-Pet090 Northr-Syl090Erz-ew Koc-Dzc270Gazli-Gaz000 Lomap-Hsp000Northr-Spv360 Northr-Pkc360Impvall-H-E05140 Koc-Dzc180Northr-Tar360 Palmspr-Nps210Average TEC-2007

M. Inel, B.T. Cayci and E. Ozer 7
center of mass and corner points of the building were obtained for both X and Y directions. The maximum interstory displacement drift demand ratio (IDR) values are determined. Then, torsional irregularity factors are calculated for the story with maximum IDR according definition given in TEC-2007. Similarly, torsional irregularity factors for nonlinear static (pushover) analyses are also determined.
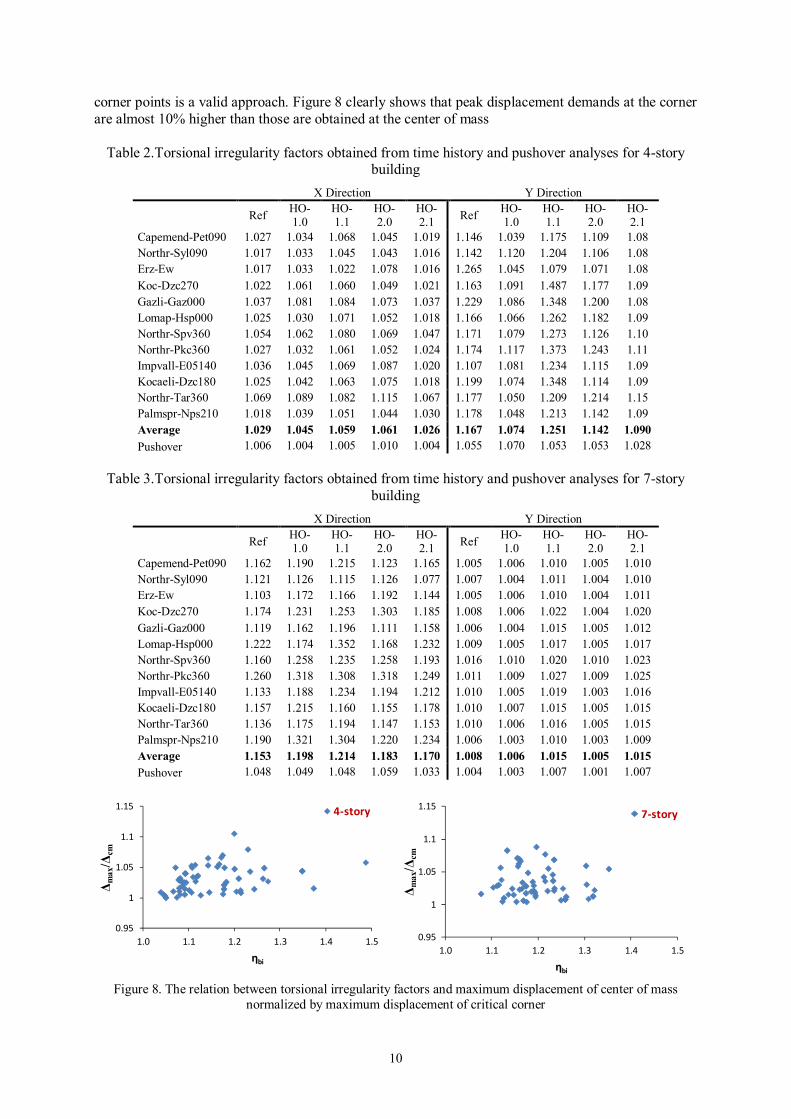
Torsional irregularity factors determined from nonlinear static and dynamic analyses are illustrated in Figures 6 and 7 for 4- and 7-story buildings. Torsional irregularity is defined per TEC-2007 in case of torsional irregularity factor values greater than 1.2 with considering accidental eccentricity for design stage. Also it is widely accepted that pushover analysis is applied to buildings with torsional irregularity factor,bi smaller than 1.4 without considering accidental eccentricity.
Since the buildings considered in the study do not have unsymmetrical distribution of lateral load resisting elements, bi values are smaller than 1.2 for all cases when pushover analyses are considered as seen in Figures 6 and 7.
The bi values from pushover analyses in Figures 6 and 7 show that 4-story building has a torsional tendency in y direction while potential torsion for the 7-story building is in x direction. This observation is consistent with displacement demands obtained from time history analyses. Potential torsion directions of both 4- and 7-story buildings have higher torsional irregularity factors, consistently. The factor varies with the ground motions. Maximum bi value is calculated as 1.49 for 4-story HO-1.1 model during Koc-Dzc 270 record at y direction. It’s approximately 45% higher than the value obtained by pushover analysis.
Pushover analysis uses equivalent seismic load method as nonlinear static analysis. This method is applied to buildings with torsional irregularity factor,bi smaller than 1.4. Since the buildings selected for this study has regular geometry and distribution of stiffness, torsional irregularity factors obtained from nonlinear time history analyses are not extremely high. However, it should be noted that these buildings were considered to have no torsional effects according to the pushover analyses by having the highest bi value of 1.07. The outcomes of the time history analyses suggest that the torsional irregularity factors may increase to significant values under earthquakes especially for the buildings with slightly unsymmetrical distribution of stiffness.
The current study also shows that the amount and location of heavy overhangs used in the current study do not affect the seismic behavior, significantly. There is no obvious trend between the building models with different heavy overhangs and arrangements. Although the torsional irregularity factors have a tendency to be higher for both y direction of 4-story and x-direction of 7-story buildings, it is hard to reach a reliable conclusion.
Torsional irregularity factors obtained from time history analyses and their averages and the factors obtained from pushover analysis are given in Tables 2 and 3. The tables show that although the torsional irregularity factors rarely exceed the pushover limit 1.4, they are beyond 1.2, limit for additional eccentricity, for considerably higher number of times. 23.3% ofbi values are calculated as greater than 1.2 limit for y direction of 4-story building while this ratio is 38.8% for x direction of 7-story building for time history analyses using 12 ground motions. Except one case for 4-story building, bi values satisfy the requirement for pushover analyses, indicating the regularity of the selected buildings in terms of both geometry and stiffness distribution.
The effect of overhang irregularities on torsional irregularity factors are limited for the scope the current study. Because the overhangs do not changes the distance between center of mass and center of rigidity by a remarkable amount. The authors also emphasize that the effect of overhang irregularity might be significant on statically asymmetric structures.

8
(a)
(b)
Figure 6. Torsional irregularity factors of 4-Story TEC 1975 models for (a) x-direction and (b) y-direction.
1.0
1.1
1.2
1.3
1.4
1.5η b
iCapemend-Pet090 Northr-Syl090 Erz-EwKoc-Dzc270 Gazli-Gaz000 Lomap-Hsp000Northr-Spv360 Northr-Pkc360 Impvall-E05140Kocaeli-Dzc180 Northr-Tar360 Palmspr-Nps210Pushover
1.0
1.1
1.2
1.3
1.4
1.5
η bi

M. Inel, B.T. Cayci and E. Ozer 9
(a)
(b)
Figure 7. Torsional irregularity factors of 7-story models for (a) x-direction and (b) y-direction.
The relation between torsional irregularity factors and maximum displacement of center of mass
normalized by maximum displacement of critical corner are given for 4-story and 7-story buildings in Figure 8. It is apparent that there is no clear trend between the irregularity factor and displacement increase due to torsion although the corner displacements slightly tend to increase as bi values get larger. It should be also noted that the calculated bi values do not necessarily correspond to peak values of displacements. Peak relative displacements are not highly sensitive torsion behaviour of regular buildings. Torsion effects increases with distance from the center of mass and reaches maximum value at corner points. Thus, evaluation of torsion behaviour with relative displacements at
1.0
1.1
1.2
1.3
1.4
1.5η b
i
1.0
1.1
1.2
1.3
1.4
1.5
η bi
Capemend-Pet090 Northr-Syl090 Erz-EwKoc-Dzc270 Gazli-Gaz000 Lomap-Hsp000Northr-Spv360 Northr-Pkc360 Impvall-E05140Kocaeli-Dzc180 Northr-Tar360 Palmspr-Nps210Pushover
10
corner points is a valid approach. Figure 8 clearly shows that peak displacement demands at the corner are almost 10% higher than those are obtained at the center of mass
Table 2.Torsional irregularity factors obtained from time history and pushover analyses for 4-story
building X Direction Y Direction
Ref HO- 1.0
HO- 1.1
HO- 2.0
HO- 2.1 Ref HO-
1.0 HO- 1.1
HO- 2.0
HO- 2.1
Capemend-Pet090 1.027 1.034 1.068 1.045 1.019 1.146 1.039 1.175 1.109 1.08 Northr-Syl090 1.017 1.033 1.045 1.043 1.016 1.142 1.120 1.204 1.106 1.08 Erz-Ew 1.017 1.033 1.022 1.078 1.016 1.265 1.045 1.079 1.071 1.08 Koc-Dzc270 1.022 1.061 1.060 1.049 1.021 1.163 1.091 1.487 1.177 1.09 Gazli-Gaz000 1.037 1.081 1.084 1.073 1.037 1.229 1.086 1.348 1.200 1.08 Lomap-Hsp000 1.025 1.030 1.071 1.052 1.018 1.166 1.066 1.262 1.182 1.09 Northr-Spv360 1.054 1.062 1.080 1.069 1.047 1.171 1.079 1.273 1.126 1.10 Northr-Pkc360 1.027 1.032 1.061 1.052 1.024 1.174 1.117 1.373 1.243 1.11 Impvall-E05140 1.036 1.045 1.069 1.087 1.020 1.107 1.081 1.234 1.115 1.09 Kocaeli-Dzc180 1.025 1.042 1.063 1.075 1.018 1.199 1.074 1.348 1.114 1.09 Northr-Tar360 1.069 1.089 1.082 1.115 1.067 1.177 1.050 1.209 1.214 1.15 Palmspr-Nps210 1.018 1.039 1.051 1.044 1.030 1.178 1.048 1.213 1.142 1.09 Average 1.029 1.045 1.059 1.061 1.026 1.167 1.074 1.251 1.142 1.090 Pushover 1.006 1.004 1.005 1.010 1.004 1.055 1.070 1.053 1.053 1.028
Table 3.Torsional irregularity factors obtained from time history and pushover analyses for 7-story
building X Direction Y Direction
Ref HO- 1.0
HO- 1.1
HO- 2.0
HO- 2.1 Ref HO-
1.0 HO- 1.1
HO- 2.0
HO- 2.1
Capemend-Pet090 1.162 1.190 1.215 1.123 1.165 1.005 1.006 1.010 1.005 1.010 Northr-Syl090 1.121 1.126 1.115 1.126 1.077 1.007 1.004 1.011 1.004 1.010 Erz-Ew 1.103 1.172 1.166 1.192 1.144 1.005 1.006 1.010 1.004 1.011 Koc-Dzc270 1.174 1.231 1.253 1.303 1.185 1.008 1.006 1.022 1.004 1.020 Gazli-Gaz000 1.119 1.162 1.196 1.111 1.158 1.006 1.004 1.015 1.005 1.012 Lomap-Hsp000 1.222 1.174 1.352 1.168 1.232 1.009 1.005 1.017 1.005 1.017 Northr-Spv360 1.160 1.258 1.235 1.258 1.193 1.016 1.010 1.020 1.010 1.023 Northr-Pkc360 1.260 1.318 1.308 1.318 1.249 1.011 1.009 1.027 1.009 1.025 Impvall-E05140 1.133 1.188 1.234 1.194 1.212 1.010 1.005 1.019 1.003 1.016 Kocaeli-Dzc180 1.157 1.215 1.160 1.155 1.178 1.010 1.007 1.015 1.005 1.015 Northr-Tar360 1.136 1.175 1.194 1.147 1.153 1.010 1.006 1.016 1.005 1.015 Palmspr-Nps210 1.190 1.321 1.304 1.220 1.234 1.006 1.003 1.010 1.003 1.009 Average 1.153 1.198 1.214 1.183 1.170 1.008 1.006 1.015 1.005 1.015 Pushover 1.048 1.049 1.048 1.059 1.033 1.004 1.003 1.007 1.001 1.007
Figure 8. The relation between torsional irregularity factors and maximum displacement of center of mass
normalized by maximum displacement of critical corner
0.95
1
1.05
1.1
1.15
1.0 1.1 1.2 1.3 1.4 1.5
Δ max
/Δcm
ηbi
4-story
0.95
1
1.05
1.1
1.15
1.0 1.1 1.2 1.3 1.4 1.5
Δ max
/Δcm
ηbi
7-story
M. Inel, B.T. Cayci and E. Ozer 11
SUMMARY AND CONCLUDING REMARKS
The aim of this study is to evaluate the existence of torsion due to nonlinear behavior of lateral load resisting elements during moderate or strong earthquakes and to check the validity of pushover analysis of existing regular buildings. Therefore, torsion due to unsymmetrical distribution of lateral load resisting elements in the plan of the structure is not in the scope of the current study.
Two reference RC buildings, 4- and 7-story, are selected for the purpose the current study. The other set of buildings is obtained from reference buildings by adding heavy overhangs with and without edge beams. The building models considered in the current study are subjected to 12 ground motion records using SAP2000 program to carry out nonlinear time history analyses. Displacement demands at the center of mass and corner points of the building were obtained for both X and Y directions. The maximum interstory displacement drift demand ratio (IDR) values are determined. Then, torsional irregularity factors are calculated for the story with maximum IDR according to definition given in TEC-2007. Similarly, torsional irregularity factors for nonlinear static (pushover) analyses are also determined. The observations are summarized as follow.
1. Similar to other codes, TEC-2007 consider 5% additional eccentricities for bi values greater
than 1.2 for the design of buildings to take into account for torsion. Also it is widely accepted that pushover analysis is applied to buildings with torsional irregularity factor,bi smaller than 1.4 without considering accidental eccentricity.
2. Since the buildings considered in the study do not have unsymmetrical distribution of lateral load resisting elements, bi values are smaller than 1.2 for all cases when static analyses are considered.
3. The bi values from pushover analyses show that 4-story building has a torsional tendency in y direction while potential torsion for the 7-story building is in x direction. This observation is consistent with displacement demands obtained from time history analyses. Potential torsion directions of both 4- and 7-story buildings have higher torsional irregularity factors, consistently.
4. The factor varies with the ground motions. Maximum bi value is calculated as 1.49 for 4-story HO-1.1 model during Koc-Dzc 270 record at y direction. It’s approximately 45% higher than the value obtained by pushover analysis.
5. Pushover analysis uses equivalent seismic load method as nonlinear static analysis. This method is applied to buildings with torsional irregularity factor,bi smaller than 1.4. Since the buildings selected for this study has regular geometry and distribution of stiffness, torsional irregularity factors obtained from nonlinear time history analyses are not extremely high. However, it should be noted that these buildings were considered to have no torsional effects according to the pushover analyses by having the highest bi value of 1.07. The outcomes of the time history analyses suggest that the torsional irregularity factors may increase to significant values under earthquakes especially for the buildings with slightly unsymmetrical distribution of stiffness.
6. Although the torsional irregularity factors rarely exceed the pushover limit 1.4, they are beyond 1.2, limit for additional eccentricity, for considerably higher number of times. 23.3% ofbi values are calculated as greater than 1.2 limit for y direction of 4-story building while this ratio is 38.8% for x direction of 7-story building for time history analyses.
7. The effect of overhang irregularities on torsional irregularity factors are limited for the scope the current study. Because the overhangs do not changes the distance between center of mass and center of rigidity by a remarkable amount. The authors also emphasize that the effect of overhang irregularity might be significant on statically asymmetric structures.
8. There is no clear trend between the irregularity factor and displacement increase due to torsion although the corner displacements slightly tend to increase as bi values get larger.
9. Peak displacement demands at the corner are about 10% higher than those obtained at the center of mass in the scope this study.
12
10. Remarkable rate of symmetrical buildings used in this study have torsional irregularity with some degree in nonlinear analysis. Thus, more detailed study including different properties of existing structures should be carried out to understand torsinoal behavior of existing buildings.
AKCNOWLEDGEMENT
The authors acknowledge support provided by Pamukkale University Research Fund Unit (PAU-BAP).
REFERENCES
Inel M, Ozmen HB, Şenel ŞM, Kayhan AH (2009). “Mevcut Betonarme Binaların Yapısal Özelliklerinin Belirlenmesi”, International Earthquake Symposium of Sakarya , Sakarya, Turkey. [in Turkish]
Inel M, Senel SM, Ozmen HB (2011). “Vulnerability of Low and Mid-Rise Reinforced Concrete Buildings In Turkey”, Scientific and Technical Research Council of Turkey (TUBITAK) , Project No: 107M569, Turkey. [in Turkish]
Kilar Vand Fajfar P (1997) “Simple Push-Over Analysis of Asymmetrical Buildings”, Earthquake Engineering & Structural Dynamics, Vol. 22-2, 233-249
Ladjinovic DjZ and Folic RJ (2008) “Seismic Analysis of Asymmetric In Plan Buildings”, 14th World Conference on Earthquake Engineering , 05-01, Paper No: 0480
Miranda B, MacRea GA, Yeow TZ, Beyer K (2012) “Torsional Considerations in Building Seismic Design”, 2012 NZSEE, Paper No: 055,
Newmark NM (1969) “Torsion in Symmetrical Buildings”, 4Th World Conference on Earthquake Engineering, Vol.2, A3.19-A3.-32
Ozmen G (2002) “Torsional Irregularty in Symmetric Structures”, Teknik Dergi, Vol. 13-4, 2789-2801 Paulay T (2001) “Some Design Principles Relevant to Torsional Phenomena in Ductile Buildings”, Journal Of
Earthquake Engineering, Vol. 5-3, 273-308 PEER, “Pacific Earthquake Engineering Research Center”, http://peer.berkeley.edu) SAP2000, “Integrated Finite Element Analysis and Design of Structures Basic Analysis Reference Manual”, Turkish Earthquake Code (1975 TEC) (1975) “Specifications for buildings to be built in seismic areas”, Ministry of Public Works and Settlement”, Ankara, Turkey. [in Turkish] Turkish Earthquake Code (2007 TEC) (2007) “Specifications for buildings to be built in seismic areas”, Ministry of Public Works and Settlement Ankara, Turkey. [in Turkish]