the effect of sn concentration on oxide texture and ... · the effect of sn concentration on oxide...
TRANSCRIPT

The University of Manchester Research
The effect of Sn concentration on oxide texture andmicrostructure formation in zirconium alloysDOI:10.1016/j.actamat.2015.08.005
Document VersionFinal published version
Link to publication record in Manchester Research Explorer
Citation for published version (APA):Garner, A., Hu, J., Harte, A., Frankel, P., Grovenor, C., Lozano-Perez, S., & Preuss, M. (2015). The effect of Snconcentration on oxide texture and microstructure formation in zirconium alloys. Acta Materialia, 99, 259-272.https://doi.org/10.1016/j.actamat.2015.08.005
Published in:Acta Materialia
Citing this paperPlease note that where the full-text provided on Manchester Research Explorer is the Author Accepted Manuscriptor Proof version this may differ from the final Published version. If citing, it is advised that you check and use thepublisher's definitive version.
General rightsCopyright and moral rights for the publications made accessible in the Research Explorer are retained by theauthors and/or other copyright owners and it is a condition of accessing publications that users recognise andabide by the legal requirements associated with these rights.
Takedown policyIf you believe that this document breaches copyright please refer to the University of Manchester’s TakedownProcedures [http://man.ac.uk/04Y6Bo] or contact [email protected] providingrelevant details, so we can investigate your claim.
Download date:30. Jan. 2020

Acta Materialia 99 (2015) 259–272
Contents lists available at ScienceDirect
Acta Materialia
journal homepage: www.elsevier .com/locate /actamat
The effect of Sn concentration on oxide texture and microstructureformation in zirconium alloys
http://dx.doi.org/10.1016/j.actamat.2015.08.0051359-6454/� 2015 Acta Materialia Inc. Published by Elsevier Ltd.This is an open access article under the CC BY license (http://creativecommons.org/licenses/by/4.0/).
⇑ Corresponding author.
Alistair Garner a,⇑, Jing Hu b, Allan Harte a, Philipp Frankel a, Chris Grovenor b, Sergio Lozano-Perez b,Michael Preuss a
aMaterials Performance Centre, School of Materials, The University of Manchester, Manchester M13 9PL, UKbDepartment of Materials, Oxford University, Parks Road, Oxford OX1 3PH, UK
a r t i c l e i n f o
Article history:Received 8 April 2015Accepted 1 August 2015Available online 14 August 2015
Keywords:Zirconium oxideTextureMicrostructureTEMEBSD
a b s t r a c t
The development of oxide texture and microstructure formed on two zirconium alloys with differing Sncontents (Zr–1Nb–1Sn–0.1Fe, i.e. ZIRLOTM and Zr–1.0Nb–0.1Fe) has been investigated using transmissionKikuchi diffraction (TKD) in the scanning electron microscope (SEM) and automated crystal orientationmapping in the transmission electron microscope (TEM). Bulk texture measurements were also per-formed using electron backscatter diffraction (EBSD) in order to quantify and compare the oxide macro-texture development. The Sn-free alloy showed significantly improved corrosion performance by delay ofthe transition region and reduced levels of hydrogen pickup. The macroscopic texture and grain misori-entation analysis of the oxide films showed that the improved corrosion performance and reduced hydro-gen pick up can be correlated with increased oxide texture strength, the improved oxide grain alignmentresulting in longer, more protective columnar grain growth. A lower tetragonal phase fraction is alsoobserved in the Sn-free alloy. This results in less transformation to the stable monoclinic phase duringoxide growth, which leads to reduced cracking and interconnected porosity and also to the formationof larger, well-aligned monoclinic grains. It is concluded that the Zr–1.0Nb–0.1Fe alloy is more resistantto hydrogen pickup due the formation of a denser oxide with a larger columnar grain structure.� 2015 Acta Materialia Inc. Published by Elsevier Ltd. This is an open access article under the CC BY license
(http://creativecommons.org/licenses/by/4.0/).
1. Introduction
Ever since the development of the first zirconium alloy,Zircaloy-1, which was alloyed with 2.5% Sn, a reduction in Sncontent has been correlated with improved corrosion performance[1–4]. However, this improvement is coupled with a reduction increep resistance and yield stress [5] and therefore modernNb-containing Zr alloys contain small amounts of Sn in order tomaintain adequate mechanical properties. There have been numer-ous studies providing evidence that alloys with reduced levels of Snexhibit a low tetragonal phase fraction in the oxide film [2–4,6]. Arecent study [4] has suggested that Sn enables the stress stabiliza-tion of the tetragonal phase, and therefore induces increased trans-formation to the stable monoclinic phase during later stages ofoxide growth. The large shear strain and volume expansion associ-ated with this transformation has previously been postulated tocause cracking and porosity in the oxide and to lead to the onsetof accelerated corrosion kinetics [7–10]. It has also been suggestedthat Sn segregation to oxide grain boundaries and the subsequent
expansion during oxidation could induce transformation and createporosity at the oxide grain boundaries [3].
The crystallographic orientation of oxide grains that form dur-ing corrosion of zirconium alloys has previously been shown toaffect the corrosion properties of the oxide. Glavicic demonstratedby X-ray diffraction (XRD) analysis that as the oxide texturestrength was increased on a Zr-2.5% Nb alloy, there was a reductionin both oxidation rate and hydrogen pickup [11]. Yilmazbayhanet al. used TEM to show qualitatively that alloys with improvedcorrosion performance showed a higher proportion of well-aligned columnar monoclinic grains [12]. This relationshipbetween grain orientation and corrosion performance is thoughtto be due to the fact that well aligned oxide grains should exhibita high fraction of coherent grain boundaries, and the diffusivityalong these grain boundaries is related to their interfacial energy[13]. A number of studies have also indicated that oxide grainboundaries are likely paths for hydrogen through the protectiveoxide [14–17]. TEM studies have shown interconnected porosityat oxide grain boundaries [9,18], which could provide a transportmechanism for hydrogen through the oxide. This is supported byrecent atom probe tomography observations of deuterium

Table 1Composition in wt.% of zirconium alloys used in this study, measured by EDF using aninductively coupled plasma atomic emission spectrometer (ICP-AES). Balance iszirconium.
Alloy Cr Fe Nb Ni Sn
ZIRLOTM <0.01 0.09 0.87 <0.01 0.92Zr–1.0Nb–0.1Fe <0.01 0.08 0.91 <0.01 0.01
260 A. Garner et al. / Acta Materialia 99 (2015) 259–272
enrichment at oxide grain boundaries in samples exposed to heavywater [17].
A strong texture has been observed via XRD [19,20] and TEM[12,21] analysis to form in the monoclinic oxide during corrosion.The formation of this texture in conventionally processedsingle-phase zirconium alloys is thought to be driven by the trans-formation stress induced by the zirconium-zirconia transformation[20,22]. The oxide orientations which occupy the smallest in-planesurface area will grow preferentially as they minimise thecompressive stress that arises during oxidation of the metal [22].Therefore a fibre texture is formed with the (1 0 �3)–(1 0 �5) planesoriented parallel with the sample surface [19,20,23]. A (001) fibretexture has also been observed using XRD to form in the tetragonalphase of oxidised Zircaloy-4 [23]. The growth of these orientationswill also minimise the transformation stress as they have thesmallest in-plane surface area. It has previously been suggestedthat transformation of these favourable tetragonal orientationscould lead to the formation of the observed monoclinic texture[10]. However, laboratory XRD measurements of the tetragonalphase rely on the measurement of only a single diffraction peakdue to the complex nature of the ZrO2 diffraction spectrum[20,24]. In addition, microtexture measurements rely on thepreparation of electron transparent samples, which results in thetransformation of the majority of the tetragonal grains [10,25].Precise measurement of the orientation of the tetragonal grainsis therefore difficult with these techniques.
The present study focuses on a comparison between the com-mercial alloy ZIRLOTM and an experimental alloy, Zr–1.0Nb–0.1Fedeveloped by Westinghouse, which has the same compositionexcept that no Sn was added to the alloy (Table 1). A previousstudy has shown a similar distribution of monoclinic (�1 1 1) polesin the oxide formed on these alloys as measured by laboratory XRD[4], however only a single contoured pole figure is presented fromeach alloy in the pre-transition region and therefore a moredetailed analysis of the effect of Sn on oxide texture formation isrequired. The aim of the present study was to investigate the effectof Sn reduction on oxide texture formation and microstructuredevelopment and to link this to the corrosion performance of thealloys, both in terms of oxidation and hydrogen pickup. The com-plementary use of conventional EBSD, transmission Kikuchidiffraction (TKD) and the automated crystal orientation mappingTEM technique allows for analysis of a large number of oxidegrains [10]. It thus provides a more statistical approach, includingtexture and misorientation distribution analysis, than conventionalTEM techniques [12,21,26,27]. In addition, removal of the outerportion of the oxide via mechanical grinding and polishing, andthe subsequent examination with EBSD, allowed for examinationof the monoclinic and tetragonal texture evolution whilst main-taining the in-plane stress state in the oxide. The hydrogen pickup behaviour of the alloys was also measured as part of this workin order to determine if the differences in behaviour can be corre-lated with the degree of oxide texture and type of grain misorien-tation distribution. Such a correlation would provide evidence foroxide grain boundaries providing a preferential transport routefor hydrogen through the protective oxide.
1 Zr alloys are known to exhibit cyclic corrosion kinetics. The corrosion kinetics areinitially of parabolic to cubic nature before a point at which the protectiveness of theoxide breaks down causing a transition in corrosion kinetics. At this stage the secondcycle starts.
2. Experimental methods
2.1. Sample selection
Two alloys were selected for this study; the commercial alloy,ZIRLOTM (Zr–1Sn–1Sn–0.1Fe), and the developmental alloy,Zr–1.0Nb–0.1Fe, both supplied by Westinghouse. Both alloys werein tube form in the recrystallised condition. The measured compo-sition of the alloys is shown in Table 1. The alloys were exposed to
simulated primary water chemistry at 360 �C for a total of 540 daysas part of a previous research program (MUZIC-1) [9]. The corro-sion kinetics are shown in Fig. 1 and each data point is an averageweight gain from at least 5 samples. More detail on the corrosiontesting can be found in Ref. [28]. In order to have samples with asimilar oxide thickness for comparison, one sample was selectedfrom each alloy (circled on Fig. 1). The ZIRLOTM sample had beenexposed for a total of 360 days and had an oxide thickness of�6.4 lm, as measured by weight gain measurements (1 lm ofoxide is equivalent to a weight gain of 15 mg dm2 [29]). The Zr–1.0Nb–0.1Fe sample had been exposed for a total of 540 days inprimary water chemistry and also received an additional exposureto deuterated water for 45 days (for NanoSIMS analysis, which isnot covered here). The total oxide thickness after 585 days expo-sure was �5.4 lm from weight gain measurements. The exposureto deuterium accounted for only an additional 0.2 lm of oxidegrowth and is not expected to have caused any changes to themicrostructure of the pre-existing oxide.
The approximate time to the first transition in the corrosionkinetics1 are labelled on Fig. 1. For ZIRLOTM this region can be esti-mated from the accelerated corrosion kinetics after transition. ForZr–1.0Nb–0.1Fe, however, this was not possible as there are insuffi-cient data points beyond 300 days of corrosion. The transition regionwas therefore estimated from comparison of the oxidation kineticsto the oxide microstructure, as will be discussed in more detail later.
2.2. Sample preparation
The samples were prepared for bulk EBSD measurements bysectioning a �6 � 4 mm piece (with the long direction parallel tothe axial direction of the tube) and grinding flat using 4000 gritSiC paper. The use of such a fine grit allowed for the preparationof a flat surface without complete removal of the relatively thinoxide. The samples were subsequently polished in a colloidal silicasuspension for an extended period of time to remove the grindingscratches. After polishing, a series of cross sections were producedacross the tube length using a focussed ion beam (FIB) instrumentin order to measure the thickness of the remaining oxide, as shownin Fig. 2. The oxide removal rate was found to vary significantlyfrom the centre to the outside edge of the tube samples, with verylittle oxide removed from the centre of the tube and all of the oxideremoved at each end. The resulting thickness gradient allowed forthe measurement by EBSD of bulk oxide texture as a function ofoxide thickness. Electron transparent cross-sectional samples formicrotexture analysis were prepared by FIB milling using thein situ lift-out technique [30]. Sample preparation using FIB millingis essential for producing large samples of uniform thickness fromoxide/metal composites. The samples were prepared with the axialdirection of the tube in the plane of the sample. After thinning, lowenergy FIB cleaning was performed on the samples, which has beenshown to remove the surface regions damaged by the ion beamduring preparation [31]. After final thinning the typical foil

Fig. 1. Corrosion kinetics for ZIRLOTM and Zr–1.0Nb–0.1Fe exposed to simulated primary water chemistry in static autoclave at 360 �C. Approximate first transition regions areindicated by dotted lines and samples selected for investigation are circled.
Fig. 2. SEM images showing FIB trenches (numbered) used to measure oxide thickness on ZIRLOTM sample after preparation for EBSD analysis. Oxide thickness reduces fromright to left, with the oxide completely removed on the far edge. The image on right shows high magnification image of FIB trench number 5, and shows that the majority ofthe oxide remains intact in this region, even after extensive grinding and polishing.
A. Garner et al. / Acta Materialia 99 (2015) 259–272 261
thickness was estimated from the electron transparency at low kVin the SEM to be below �100 nm.
2.3. Electron backscattered diffraction
The EBSD measurements were performed on an FEI Magellan400 XHR Field Emission Gun Scanning Electron Microscope (FEG-SEM). The use of a FEG source allows for a small spot size with ahigh current density, which is essential for a nano-grained materialsuch as ZrO2 formed on a corroded Zr alloy sample. Standard EBSDwas employed for the bulk texture measurements using an accel-erating voltage of 15 keV and a probe current of 1.6 nA.
2.4. Transmission Kikuchi diffraction
For microtexture measurements, the cross-sectional FIB sam-ples were mounted in transmission geometry in the FEG-SEMand the transmitted Kikuchi patterns were analysed in a techniquetermed transmission Kikuchi diffraction (TKD) [32], also known astransmission EBSD (t-EBSD) [10]. An accelerating voltage of 30 keVwas used with a probe current of 1.6 nA and a step size of 15 nm.The EBSD data was analysed using the Channel 5 software suitedeveloped by Oxford Instruments HKL.
2.5. Automated crystal orientation mapping with TEM
The TEM measurements were performed on an FEI Tecnai F30Field Emission Gun Transmission Electron Microscope (FEG-TEM)operating at 300 keV. The NanoMEGAS ASTAR automated crystal
orientation mapping system was used for both pattern collectionand data analysis [33]. The spot patterns were collected by anexternal CCD camera and matched to theoretically generated pat-terns using the template matching process [34]. Details of the crys-tal information used for producing the templates for each phasecan be found in Ref. [10]. A small condenser aperture (20 lm)was used in order to reduce the convergence of the beam. Thebeam size was measured experimentally using the in-columnCCD to be �3 nm with a current of 26 pA. A camera length of8.9 cm was applied for all measurements with a scanning step sizeof 5 nm. In addition, a precession angle of 0.8� was used, whichproduces more diffraction spots and reduces dynamical effectsand therefore has been shown to improve the accuracy of the tem-plate matching process [33,35].
3. Results
3.1. Hydrogen pickup
Samples from each alloy were selected for hydrogen measure-ment at various stages in the corrosion process. Hydrogen mea-surements were performed at Westinghouse Electric Companyusing a RECO RHEN602 inert gas fusion analyser. The accuracy ofhydrogen measurement using this equipment has previously beenestimated at ±2% [36], and therefore seems to be more accuratethan other methods for hydrogen analysis [37]. The hydrogen con-centration as a function of autoclave exposure time is shown inFig. 3(a). Early in the corrosion process, similar levels of hydrogenconcentration are measured in both sets of samples. It should be

Fig. 3. Hydrogen pickup data for ZIRLOTM and Zr–1.0Nb–0.1Fe, as measured by Westinghouse using the inert gas fusion technique, (a) total hydrogen concentration as afunction of exposure time, (b) hydrogen pickup fraction as a function of exposure time. Approximate first transition regions are indicated by dotted lines.
262 A. Garner et al. / Acta Materialia 99 (2015) 259–272
noted that at these low levels of hydrogen, the accuracy of mea-surement is comparatively poor. Later in the corrosion process,the ZIRLOTM samples pick up significantly more hydrogen than theSn-free alloy. As the corrosion kinetics of the two alloys are differ-ent (Fig. 1), this will affect the amount of available hydrogen liber-ated by the corrosion reaction. This must be taken into accountwhen comparing hydrogen ingress. Therefore, the hydrogen pickupfraction (HPUF) was estimated, which is the ratio of absorbedhydrogen to the amount of hydrogen generated by corrosion, andis given by [38]:
HPUF ¼10�6 Mt
sCtH �Mi
sCiH
� �
2Mts�Mi
sMO
MH
ð1Þ
where Mis and Mt
s are the initial and final masses of the sample
respectively, CiH and Ct
H are the initial and final hydrogen
concentrations respectively and MO and MH are the atomic massesof oxygen and hydrogen. The initial hydrogen concentrations weremeasured prior to autoclave exposure and so the HPUF could be cal-culated for each hydrogen measurement using the weight gain data.The errors for HPUF were determined using the error propagationformula detailed in Ref. [39]. The HPUF is plotted as a function ofexposure time in Fig. 3(b). Early in the corrosion process, both alloysexhibit similar behaviour. The large scatter on these early points isagain attributed to difficulties in detecting such low hydrogenconcentrations. Later in the corrosion process, the HPUF forZIRLOTM increases in agreement with previous observations [38].Zr–1.0Nb–0.1Fe seems to follow a similar trend to the ZIRLOTM untilabout 200 days of exposure, beyond which it displays significantlylower HPUF. At 540 days, Zr–1.0Nb–0.1Fe exhibits a significant dropin the HPUF to �6%. This measurement was repeated with a sistersample of the same exposure time, which confirmed the lowHPUF at this stage.

Fig. 4. EBSD phase map taken from region adjacent to FIB trench 2 on ZIRLOTM
sample after 360 days autoclave exposure, corresponding to oxide thickness of�1 lm. Black regions are non-indexed.
A. Garner et al. / Acta Materialia 99 (2015) 259–272 263
3.2. Standard EBSD
A series of EBSD maps were acquired from the oxide of eachsample adjacent to the FIB cross sections shown in Fig. 2, whichenabled the analysis of the texture as a function of oxide thickness.The scans were carried out using a step size of 120 nm, which isabout 3–6 times the width of the columnar oxide grains formedon ZIRLOTM [12,29]. The areas scanned in this way were�50 � 50 lm. Due to the small grain size and relatively large beamsize, and therefore the high probability of the beam probing a grainboundary, the indexing rate was �40%. However, since each mapcontained approximately 50,000 indexed points it was possible tomeasure the representative texture at each oxide thickness. Fivemaps were collected from each sample adjacent to each of the FIBtrenches shown in Fig. 2. An example of a phase map from theregion adjacent to FIB trench 2 is shown in Fig. 4, correspondingto a remaining oxide thickness of approximately 1 lm. The mapclearly shows the majority of the oxide is monoclinic. In this area,some of the oxide has spalled away revealing themetal underneath.
There are also clusters of tetragonal grains in these thinnestregions, which are postulated to be stress-stabilized tetragonalgrains that have previously been shown to exist close to themetal-oxide interface region [29]. It is noted that these clustersof tetragonal grains were only visible in regions of oxide spallation,where the oxide is thinnest. It was also noticed that there was aconsiderable amount of tetragonal phase indexed in the oxideregions directly adjacent to the FIB trenches. As these large contin-uous regions of tetragonal grains were seen even in regions of thickoxide where this level of tetragonal phase would not be expected[4], it was concluded that irradiation damage from the FIB hadcaused local transformation of the monoclinic grains surroundingthe trenches. Any maps containing these damaged regions weretherefore excluded from this study. Pre-existing tetragonal grainsfrom the corrosion process are also evenly distributed on the mapsfrom thicker oxide regions. The tetragonal phase fraction as a func-tion of approximate distance from the interface is shown for bothalloys in Fig. 5. It shows that a higher tetragonal phase fraction isobserved in the oxide formed on ZIRLOTM than on Zr–1.0Nb–0.1Fe,with the overall fraction, and the difference between the alloys,increasing closer to the interface, in agreement with previousobservations [4,19]. However the tetragonal phase fraction is lowerthan measured during synchrotron XRD experiments on the samealloys [4]. This is thought to be due to the difficulty in thinning theoxide below �1 lm without causing spallation, and also due to thefact that a considerable number of the tetragonal grains are belowthe spatial resolution limit of this technique [12].
A comparison between orientation maps from a region of simi-lar oxide thickness for each alloy are shown in Fig. 6. The maps arecoloured according to deviation away from the (1 0 �3) fibre compo-nent, which has previously been shown to be one of the main fibrecomponents of monoclinic oxide formed during autoclave corro-sion [10,23]. The deviation frequency distributions shown inFig. 6(c) indicate a higher fraction of the monoclinic grains liewithin �10� of this fibre component in the Zr–1.0Nb–0.1Fe samplethan in ZIRLOTM. There also appears to be a greater proportion ofgrains oriented away from this component in ZIRLOTM. The map alsoshows that there appear to be regions of well-oriented (blue) mon-oclinic grains distributed across the oxide surface. These regionscould be a result of the previously reported undulations in themetal oxide interface [40]. These undulations would result in thedistance to the metal-oxide interface varying at different regionsacross the sample surface. It is also noted here that this roughnesscould contribute to the observed spread in the orientations awayfrom the ideal orientation, as the interface will rarely be orientedexactly parallel with the macroscopic sample surface.
In order to quantify the overall texture strength in the mono-clinic oxide as a function of oxide thickness, the texture index ofeach map was calculated. The texture index is the most frequentlyused method to quantify the degree of preferred orientation in asample [41]. In this study, it was calculated from the orientationdistribution function (ODF) using the open source MATLABtoolbox, MTEX [42]. An alternative quantification of the texturestrength is given by the maximum pole figure intensity. Althoughthis does not provide an overall quantification of the texturestrength, as the main texture component is already known for thismaterial, it does provide an independent measure of the strengthof this texture component. These two quantities, texture indexand (1 0 �3) pole figure intensity (which in all cases was the polewith the highest intensity) are plotted as function of oxidethickness for ZIRLOTM and Zr–1.0Nb–0.1Fe in Fig. 7. Both quantitiesare found to be higher throughout the oxide thickness for theZr–1.0Nb–0.1Fe sample, clearly demonstrating that there is agreater degree of preferred orientation in the monoclinicoxide formed on this alloy. Both samples follow a similar patternof texture evolution throughout the oxide, with a stronger texturein the outer few microns that decreases in strength towards theinterface.
In order to compare the overall distribution of poles, the fivemaps from each sample were combined. This also allowed for theorientation of a significant number of tetragonal grains to be anal-ysed. Pole figures were plotted from these combined maps usingthe Channel 5 software suite, and are shown in Figs. 8 and 9. Thecontoured (1 0 �3) pole figures of the monoclinic phase in Fig. 8show the expected texture, with these planes oriented parallelwith the sample surface. These pole figures also show a highermaximum intensity in the oxide formed on Zr–1.0Nb–0.1Fe thanin ZIRLOTM. It has previously been shown that a (001) fibre textureis expected in tetragonal zirconia formed on single phase zirco-nium alloys [23], this being also the orientation with the smallestin-plane surface area. The contoured (001) tetragonal pole figuresshown in Fig. 9 show a similar distribution in the two alloys, with aregion of intensity close to the oxide growth direction and alsosome intensity at approximately 90� to the growth direction. Incontrast to the monoclinic phase, the maximum intensity of thetetragonal pole figures is higher in the oxide formed on ZIRLOTM.Than on Zr–1.0Nb–0.1Fe. There is a slight misalignment of the cen-tral (001) poles away from the oxide growth direction, this couldbe a sampling issue due to the comparably small number of grainsmeasured from the tetragonal phase.
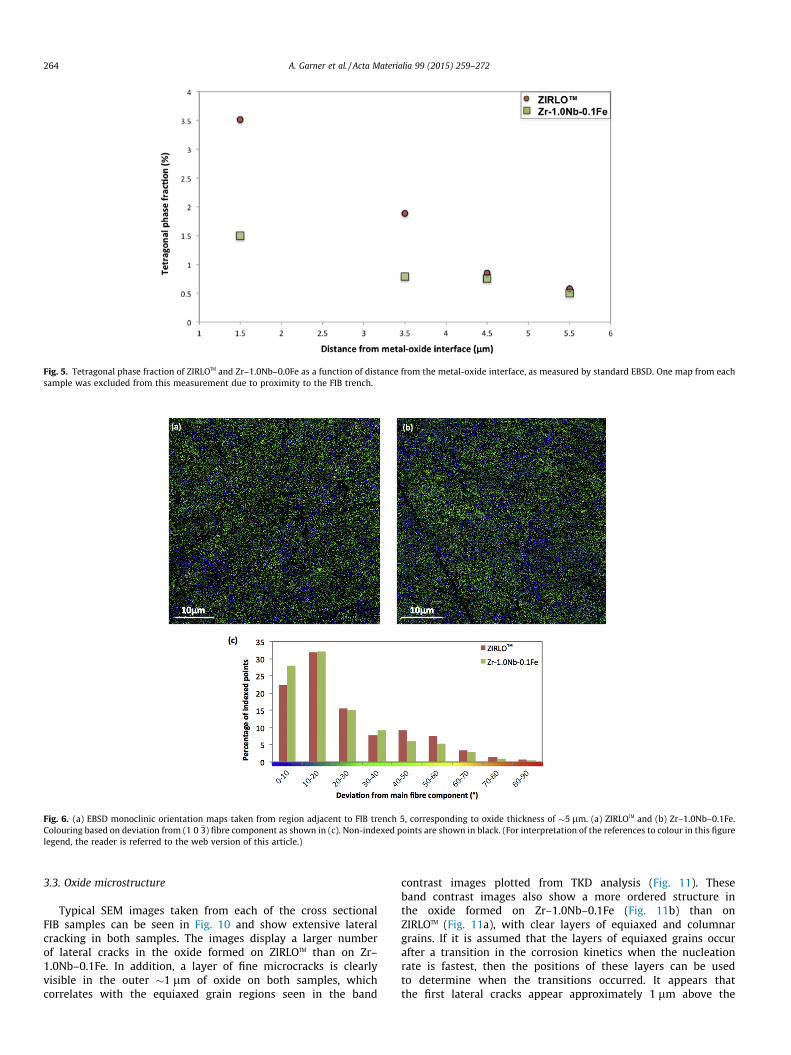
Fig. 5. Tetragonal phase fraction of ZIRLOTM and Zr–1.0Nb–0.0Fe as a function of distance from the metal-oxide interface, as measured by standard EBSD. One map from eachsample was excluded from this measurement due to proximity to the FIB trench.
Fig. 6. (a) EBSD monoclinic orientation maps taken from region adjacent to FIB trench 5, corresponding to oxide thickness of �5 lm. (a) ZIRLOTM and (b) Zr–1.0Nb–0.1Fe.Colouring based on deviation from (1 0 �3) fibre component as shown in (c). Non-indexed points are shown in black. (For interpretation of the references to colour in this figurelegend, the reader is referred to the web version of this article.)
264 A. Garner et al. / Acta Materialia 99 (2015) 259–272
3.3. Oxide microstructure
Typical SEM images taken from each of the cross sectionalFIB samples can be seen in Fig. 10 and show extensive lateralcracking in both samples. The images display a larger numberof lateral cracks in the oxide formed on ZIRLOTM than on Zr–1.0Nb–0.1Fe. In addition, a layer of fine microcracks is clearlyvisible in the outer �1 lm of oxide on both samples, whichcorrelates with the equiaxed grain regions seen in the band
contrast images plotted from TKD analysis (Fig. 11). Theseband contrast images also show a more ordered structure inthe oxide formed on Zr–1.0Nb–0.1Fe (Fig. 11b) than onZIRLOTM (Fig. 11a), with clear layers of equiaxed and columnargrains. If it is assumed that the layers of equiaxed grains occurafter a transition in the corrosion kinetics when the nucleationrate is fastest, then the positions of these layers can be usedto determine when the transitions occurred. It appears thatthe first lateral cracks appear approximately 1 lm above the

Fig. 7. Monoclinic texture index and maximum monoclinic (1 0 �3) pole figure intensity as a function of oxide thickness for ZIRLOTM and Zr–1.0Nb–0.1Fe, as measured bystandard EBSD.
Fig. 9. Contoured (001) tetragonal pole figures from combined EBSD maps, (a) ZIRLOTM after 360 days autoclave exposure (5000 points) and (b) Zr–1.0Nb–0.1 after 540 daysautoclave exposure (2500 points).
Fig. 8. Contoured (1 0 �3) monoclinic pole figures from combined EBSD maps, (a) ZIRLOTM after 360 days autoclave exposure (280,000 points) and (b) Zr–1.0Nb–0.1Fe after540 days autoclave exposure (250,000 points).
A. Garner et al. / Acta Materialia 99 (2015) 259–272 265
equiaxed grain region, these lateral cracks have previouslybeen associated with the transition in corrosion kinetics[43,44]. However, these observations seem to suggest a moregradual development of cracks during the pre and posttransition regimes, as observed during 3D characterisation ofpre and post transition oxides using FIB sectioning andreconstruction [40].
For Zr–1.0Nb–0.1Fe, there is only one point for this alloy on thecorrosion curve after the first transition (Fig. 1), and it is thereforedifficult to ascertain exactly when the transition occurs.Interestingly, from the position of the bands of equiaxed grains itappears that the oxide on Zr–1.0Nb–0.1Fe has undergone twotransitions after 540 days autoclave exposure. The first transitionappears to have occurred at an oxide thickness of �3 lm

Fig. 10. SEM images showing lateral cracking in oxide formed on (a) ZIRLOTM after 360 days autoclave exposure and (b) Zr–1.0Nb–0.1Fe after 540 days autoclave exposure.
Fig. 11. Band contrast maps measured by transmission Kikuchi diffraction, oxide formed on (a) ZIRLOTM and (b) Zr–1.0Nb–0.1Fe.
266 A. Garner et al. / Acta Materialia 99 (2015) 259–272
(corresponding to an exposure time of �370 days) and the secondappears to occur at an oxide thickness of �5 lm (corresponding toan exposure time of �500 days). It is more difficult to infer thetransition points from the oxide microstructure formed onZIRLOTM, as the periodic grain structure is not as clear in the bandcontrast image. There are significant differences in the grain sizesof the oxides formed on the different alloys. From the TKD bandstructure images in Fig. 11, the length and width of the columnargrains appear to be larger for the oxide formed on Zr–1.0Nb–0.1Fe compared to ZIRLOTM. However, it is difficult to quantify thedifference in grain size using this technique as the relatively largestep size (15 nm) and low indexing rate would lead to inaccurateresults. On both samples, the indexed oxide grains are all
monoclinic, and no tetragonal phase is detected. This is becausethe preparation by FIB of the thin TEM samples induces transfor-mation of the larger stress-stabilized tetragonal grains [10], andthose that remain in the oxide after sample preparation are there-fore postulated to be below the spatial resolution limit of thistechnique.
In order to provide an accurate quantification of the grain sizesin oxides formed on the two alloys, automated crystal orientationmapping in the TEM was used due to its superior spatial resolutioncompared to TKD. The reliability index is a measure of the unique-ness of the solution from template matching and therefore will below at grain boundaries where there are overlapping diffractionpatterns [34]. Examples of monoclinic orientation reliability maps

A. Garner et al. / Acta Materialia 99 (2015) 259–272 267
used for grain size analysis are shown in Fig. 12(a) and (b). It isnoted that the maps presented here are small representativeregions of the recorded maps, and a significantly larger area wasused for the grain size analysis. The reliability maps clearly showthe wider and longer columnar grains formed on Zr–1.0Nb–0.1Fecompared to ZIRLOTM. It is also noted here that only columnar mon-oclinic grains were included in the grain size analysis, as the smallequiaxed grains tend to overlap in the transmission direction andtherefore are difficult to measure using this technique. The widthand length of the columnar monoclinic grains was measured usingthe linear intercept method, covering an area of approximately18 lm2 on each sample. The average width of the columnar mon-oclinic grains was measured to be 68 nm and 85 nm on the ZIRLOTM
and Zr–1.0Nb–0.1Fe samples respectively. The average length ofthe columnar monoclinic grains was measured to be 124 nm and190 nm on the ZIRLOTM and Zr–1.0Nb–0.1Fe samples respectively.The average ZIRLOTM columnar grain width is therefore larger thanpreviously reported using synchrotron XRD (40–45 nm) [29] andconventional TEM (25–33 nm) [12]. However, there are a numberof problems associated with measuring grain size accurately usingline broadening of X-ray diffraction peaks, especially consideringthe high levels of residual stress present in the oxide [45]. Also,in the orientation used for standard XRD analysis, the length ofthe columnar grains does not contribute to the peak broadening.Conventional TEM observations are usually only performed on asmall number of grains and so do not have the statistical signifi-cance of this study. If these TEM samples are insufficiently thinthere might be a bias towards measuring small grain sizes due tooverlapping projections of grains along the transmission directionand the greater sensitivity of phase contrast images to low anglegrain boundaries. In both of the samples studied here, we measureby bright field TEM in the regions of columnar monoclinic oxide agrain size of �50 nm. The grain size analysis using the orientationreliability maps is thought to be superior to conventional tech-niques due to the ability to clearly distinguish grain boundariesfrom other features. However, it is noted that this technique couldbe biased towards larger oxide grains due to the difficulties in mea-suring smaller oxide grains described previously. However the TKDand TEM observations presented here clearly show a significantdifference in the monoclinic oxide grain size formed on the twoalloys.
3.4. Oxide microtexture
Monoclinic orientation maps, as measured by automated crys-tal orientation mapping in the TEM, are shown in Fig. 13. As previ-ously mentioned, each solution is given a reliability index, which isa measure of the uniqueness of the solution. This index is an essen-tial part of the analysis of template matching solutions due to theambiguous nature of high symmetry electron spot patterns. Themaps in Fig. 13 therefore only include high reliability solutions. Areliability threshold of 10 has previously been shown to be ade-quate for monoclinic zirconium oxide [35]. The grains are colouredaccording to their deviation from the (1 0 �3) fibre component, asdiscussed previously. Qualitatively, it is clear that there are morewell aligned columnar grains (blue) in the oxide formed on Zr–1.0Nb–0.1Fe than on ZIRLOTM, and that these grains are longerand wider, in agreement with the previous observations. The fre-quencies of the deviations from the fibre component are shownin Fig. 13(c). In agreement with the EBSD data, there is a signifi-cantly higher percentage of indexed points within 10� of the mainfibre component in the oxide formed on Zr–1.0Nb–0.1Fe. In theoxide formed on ZIRLOTM, there is a wider range of orientations,with a significant number of indexed points lying up to 60� fromthe (1 0 �3) fibre component. It is noted here that the same trend
was observed in the TKD orientation data, but is not shown here.Tetragonal grains are highlighted in purple in Fig. 13. A numberof small equiaxed tetragonal grains are observed throughout theoxide formed on ZIRLOTM, with the total phase fraction in the oxidemeasured to be �1%. No tetragonal grains were visible using thistechnique in the oxide formed on the Sn-free alloy. It is well knownthat preparation of thin foils for TEM/TKD examination will lead tothe transformation of the stress stabilized tetragonal oxide grains[10,31]. However, the grain size stabilized tetragonal grains shouldremain in the samples and so the fact that none are detected in theSn-free alloy suggests Sn is affecting the fraction of tetragonalgrains that nucleate at the interface. In addition, this observationis supported by the higher tetragonal phase fraction observed onthe Sn-containing alloy in this work using bulk EBSD, where thestress state in the oxide is maintained.
The misorientation angle distributions (MADs) for the mono-clinic oxide formed on the two alloys as measured using auto-mated crystal orientation mapping with TEM are shown inFig. 14. The grains in each sample were separated into two groupsfor MAD analysis; small grains with a equivalent circle diameter ofless than 50 nm and large grains with an equivalent circle diameterof greater than or equal to 50 nm. Fig. 14(a) compares the MADsfrom the smaller monoclinic grains. A similar distribution isobserved in the small grains on both alloys, with a large range ofmisorientation observed between adjacent grains. Fig. 14(b) com-pares the MADs from the large monoclinic grains and the differ-ences between the alloys become more obvious, with asignificantly larger fraction of 90� and 180� boundaries observedin the oxide formed on ZIRLOTM than on Zr–1.0Nb–0.1Fe. Theseboundaries have previously been shown to be caused by twin vari-ant selection during the martensitic transformation from tetrago-nal to monoclinic oxide [46,47] and so are evidence of anincreased level of phase transformation during oxide growth onZIRLOTM.
4. Discussion
The corrosion kinetics in Fig. 1 demonstrate a clear difference inthe oxidation behaviour of the two alloys. The SEM images inFig. 10 and band contrast images in Fig. 11 can help to identifywhen the first transition in the corrosion kinetics occurs in theabsence of sufficient data points. From analysis of the corrosionkinetics and oxide microstructure, the oxide thicknesses at whichthe first transition occurs is quite similar between the two alloys.However, the Zr–1.0Nb–0.1Fe alloy takes a significantly longertime to reach this thickness. From extrapolation of the corrosionkinetics in Fig. 1, it would appear that there is approximately a200 day delay in the first transition for the Zr–1.0Nb–0.1Fe alloy.Thus the oxide formed prior to transition is much more protectivefor Zr–1.0Nb–0.1Fe than for ZIRLOTM. One possible reason for this isthe difference in the columnar oxide grain size in the two alloys.The ASTAR observations revealed a columnar grain width/lengthof 68/124 nm in oxide formed on ZIRLOTM, and 85/190 nm on Zr–1.0Nb–0.1Fe. It has previously been demonstrated that the major-ity of oxygen transport occurs via oxide grain boundaries [48], sothe reduced grain boundary area in the oxide formed on Zr–1.0Nb–0.1Fe would result in considerably slower oxidation kinet-ics. This extended grain growth only becomes significant at anoxide thickness of �2 lm and therefore the corrosion kinetics ofthe two alloys are similar in the early stages. A possible reasonfor the extended growth of these columnar grains is the greaterdegree of preferred orientation present in this oxide, as shown bythe bulk texture measurement in Fig. 7. Motta et al. suggested thatthe termination of columnar grain growth is caused by small mis-matches in the orientation of adjacent grains, causing the accumu-lation of stress [49]. Therefore, if there is an improved degree of

Fig. 12. Monoclinic orientation reliability maps from columnar grain region of oxide formed on (a) ZIRLOTM and (b) Zr–1.0Nb–0.1Fe, measured with automated crystalorientation mapping in TEM. Through-focal imaging of fine pores (circled) at the metal-oxide interface from the oxide formed on (c) ZIRLOTM and (d) Zr–1.0Nb–0.1Fe. Due toFresnel contrast the porosity changes from dark in the over-focussed images to white in the under-focussed images.
268 A. Garner et al. / Acta Materialia 99 (2015) 259–272
alignment in the growing grains, they will be able to grow furtherbefore the intergranular stress caused by the mismatch builds upto the critical level to cause nucleation of new grains.
It is clear from the observations from a number of differentexperimental techniques shown in this study that the monoclinicoxide formed on Zr–1.0Nb–0.1Fe has a greater degree of preferredorientation than that formed on ZIRLOTM. As the alloys followed thesame processing route, there is no significant difference in the sub-strate texture of the alloys. The distribution and nature of inter-metallic precipitates will also be similar in the two alloys as theirdistribution is determined by the level of Nb and Fe in the alloy,which are identical (Table 1). The only difference between thetwo alloys is therefore the Sn content, which is fully soluble inthe matrix and is not found in precipitates. The differences in cor-rosion behaviour can therefore be attributed to the effect of Sn onoxide formation. A possible mechanism for the increase in oxidetexture strength with the removal of Sn is the effect it has on thestability of the tetragonal phase. It is well documented (via non-destructive methods) that a decrease in Sn content results in alower tetragonal phase fraction [2–4,6]. This is supported by the
consistently lower tetragonal phase fraction observed by EBSD inthis study on the Zr–1.0Nb–0.1Fe alloy (Fig. 5). It is postulated thatSn2+ substitutes for Zr4+ in the oxide, causing the production ofoxygen vacancies to balance the overall charge [50]. These vacan-cies are known to stabilize the tetragonal phase [51]. It has alsopreviously been shown that Sn will increase the number ofstress-stabilized grains present in the oxide, allowing the grainsto grow above the critical size for stabilization [4]. It is thereforelikely that these large tetragonal grains are stabilized by a combi-nation of compressive stress in the oxide and also chemical stabi-lization. A number of studies have clearly shown a reduction incompressive stress as the oxide grows [6,45,52], which could leadto destabilization of these large tetragonal grains. It has also beensuggested that the oxidation of Sn during oxide growth will lead toa transformation from Sn2+ to Sn4+ [50,53,54]. Sn has beenobserved to exist in both of these valence states experimentally[50,53], with the relative fraction of Sn4+ increasing as the oxidethickens [53]. It is therefore possible that the oxidation of Sn dur-ing oxide growth is also contributing to the destabilization of thetetragonal phase. This would also explain why the oxides formed

Fig. 13. High reliability (threshold = 10) monoclinic orientation maps measured by automated crystal orientation mapping in TEM. Oxide formed on (a) ZIRLOTM and (b) Zr–1.0Nb–0.1Fe. Coloured according to degrees away from (1 0 �3) fibre component as shown in (c). Tetragonal zirconia grains are shown in purple and zirconium metal grains inwhite. Black regions are non-indexed. The equiaxed grain region at outer surface has been removed from the maps. (For interpretation of the references to color in this figurelegend, the reader is referred to the web version of this article.)
A. Garner et al. / Acta Materialia 99 (2015) 259–272 269
on both alloys show similar tetragonal phase fractions in the oxide�4 lm away from the metal-oxide interface (Fig. 5), as the Sn inthe oxide formed on ZIRLOTM is fully oxidised away from the inter-face and so has no stabilizing effect on the tetragonal phase.
Therefore in the alloy with higher levels of Sn, the compressivestress that drives the oxide texture formation acts mainly on meta-stable tetragonal grains [10,20,22]. Consequently when the grainscan no longer be stabilized by the surrounding oxide, they willtransform to the monoclinic phase according to a specific orienta-tion relationship. Due to the differences in the crystal structures ofthe two phases, the new phase will no longer be in the preferentialorientation, resulting in the greater spread of orientations observedin the oxide on the Sn-containing alloy. Whereas in the alloy with
no Sn, the favourable orientations are selected from the stablemonoclinic phase, which grow into the large well-oriented colum-nar grains observed in this work. This argument is supported bythe greater degree of preferred orientation observed in the tetrag-onal phase formed on ZIRLOTM, as seen in Fig. 9. Also, a comparisonof Figs. 6 and 13 indicates the difference in the preferred orienta-tion of the alloys is different between the bulk EBSD technique(where the stress state in the oxide is largely maintained) andthe TEM technique. As the sample preparation for the TEM tech-nique is postulated to cause enhanced transformation of thestress-stabilized tetragonal grains, according to the previous dis-cussion, this would lead to a greater misalignment in the mono-clinic phase after transformation, which is observed here.

Fig. 14. Comparison of monoclinic misorientation angle distributions from ZIRLOTM and Zr–1.0Nb–0.1Fe as measured by automated crystal orientation mapping in TEM. (a)grain diameter < 50 nm, (b) grain diameter P 50 nm.
270 A. Garner et al. / Acta Materialia 99 (2015) 259–272
As there is a higher tetragonal fraction in the oxide formed onZIRLOTM (Fig. 5), it follows that there is more transformation of thisphase as the oxide grows. The shear strain and volume expansionassociated with this transformation have been associated withthe onset of cracking and porosity in the oxide, leading to thebreakdown of the protective oxide [7–9]. It is expected that thisreduction in transformation will contribute significantly to theimproved corrosion performance of the Zr–1.0Nb–0.1Fe alloy.From detailed analysis of the fine scale porosity in the oxides onthe two alloys, we have identified a clear difference in the charac-teristic shape and size of the pores. On the Zr–1.0Nb–0.1Fe alloythe oxide contains almost exclusively isolated spherical pores,often arranged along monoclinic grain boundaries (Fig. 12(d)). Bycontrast, Fig. 12(c) shows that the ZIRLOTM sample is full of elon-gated pores (or very fine cracks) that would provide effective inter-connection between the larger cracks. Therefore it appears that theincreased level of transformation of the tetragonal phase duringoxide growth reduces the protectiveness of the oxide and couldinduce the early onset of transition in Sn-containing alloys.
In addition, the number of lateral cracks in the oxide on the Sn-free sample is significantly reduced compared to ZIRLOTM, whichcould be due to the effect of Sn on the mechanical properties ofthe substrate. It is well known that Sn strengthens zirconium alloysthrough solid solution strengthening mechanisms [55]. Therefore,the removal of Sn would be expected to have a significant effecton the mechanical properties of the substrate. It has previouslybeen suggested that interfacial roughness that develops duringoxide growth causes the formation of tensile stress regions at theinterface which lead to the onset of lateral cracking [44,56]. It islikely that this interfacial roughness forms in order to reduce thestress mismatch at the interface. Therefore, if there is less con-straint on the oxide formed on Zr–1.0Nb–0.1Fe, due to the
reduction in substrate strength, then there will be less driving forcefor the development of undulations. This, in turn, will lead to lesslateral cracking in oxides formed on alloys with reduced levels ofSn. It is likely that increased levels of lateral cracks will assist inthe interconnection of cracks and porosity after transition and sowill reduce the protectiveness of the oxide further. As previouslymentioned, the roughness of the interface may also affect thespread in the resulting orientations due to the increase in the frac-tion of the interface that is not parallel with the sample surface. Itis therefore possible that a reduced interface roughness may con-tribute to the formation of a more-well oriented oxide.
It can be seen from Fig. 14 that the removal of Sn also affects thegrain boundary distribution in the oxide. As mentioned previously,the columnar monoclinic grains show a greater degree of align-ment in the oxide formed on Zr–1.0Nb–0.1Fe. The effect of thealignment of grains on the grain boundary character is likely toaffect the diffusion of corrosive species through the oxide, as alow activation energy for diffusion is associated with a high inter-facial energy [13]. If the grains are well aligned, then a fairly coher-ent boundary would be expected to form between adjacent grainswhich is then more resistant to grain boundary diffusion. In thesmaller grains, which are more likely to be un-favourably oriented(Fig. 14(a)), there is a large range of misorientation between adja-cent grains, and it is therefore likely that these boundaries are notcoherent and therefore not protective. In the larger grains, howeverthere is large fraction of transformation-induced twin boundariesformed on both alloys. These twin boundaries are almost totallycoherent, and therefore have very low interfacial energies. Theseare therefore likely to be more protective than the boundariesbetween smaller grains and so contribute to the protective natureof columnar grain growth. However, the fact that there is a higherfraction of twin boundaries on the less protective oxide indicates

A. Garner et al. / Acta Materialia 99 (2015) 259–272 271
that it may be the effect of the transformation on the integrity ofthe oxide, as discussed previously, that is the dominating factorin determining both the oxidation kinetics and pickup of hydrogen.
Concerning the route of hydrogen through the oxide, early inthe corrosion process, when the oxides remain largely protective,the H pickup behaviour of the two alloys is similar. In the absenceof interconnected cracking and porosity prior to transition, bothalloys remain protective against hydrogen ingress and exhibitsimilar levels of hydrogen pickup. The similarity between theseobservations and the oxidation kinetics suggests that early in thecorrosion process, hydrogen ingress is controlled by diffusiondown grain boundaries in the oxide. However, it is clear that thedisruption to the oxide caused by the transformation from tetrag-onal to monoclinic oxide provides easy paths for hydrogen to pen-etrate the oxide. NanoSIMS observations on isotopically spikedsamples have indicated that directly after transition, before thebuildup of new protective oxide, the oxide is sufficiently porousto allow for direct contact between the water and metal [57].This supply of hydrogen close to the interface will reduce the grainboundary length between environment and metal and thus signif-icantly increase the H pickup fraction. This can be seen in the com-parison between the H pickup fractions after 360 days of autoclaveexposure. Here, the Zr–1.0Nb–0.1Fe alloy, which is considered tostill be in the pre-transition regime, remains protective against Hingress. However, the ZIRLOTM sample, which at this stage hasundergone more than one transition and therefore contains signif-icant interconnected cracking and porosity, has a larger HPUF. Thereason for the dramatic reduction in HPUF in the Zr–1.0Nb–0.1Fealloy after 540 days autoclave exposure (when the oxide isassumed to have undergone transition) is postulated to be due toreduced levels of interconnected cracking and porosity caused bythe low tetragonal phase fraction and also the larger oxide grainsize in the dense oxide close to the interface. Therefore the legacyoxide retains a higher degree of protectiveness against both oxida-tion and hydrogen pickup.
5. Conclusions
A detailed study of the texture and microstructure of oxidesformed on two zirconium alloys which exhibit different corrosionbehaviour (ZIRLOTM and Zr–1.0Nb–0.1Fe) has been performed inorder to investigate the effect of the removal of Sn on oxide textureformation during aqueous corrosion. The following conclusions aremade:
� The removal of Sn leads to a delayed transition in the corrosionkinetics (�200 days) and a reduction in hydrogen pickup.
� A greater degree of preferred orientation is present in mono-clinic oxide formed on Zr–1.0Nb–0.1Fe, which allows for thegrowth of larger columnar grains.
� The average columnar grain width and length is larger for theoxide formed on Zr–1.0Nb–0.1Fe and also exhibits a moreordered oxide grain structure.
� A higher tetragonal phase fraction is observed in oxide formedon ZIRLOTM, this is attributed to the stabilizing effect of the pres-ence of Sn in the oxide.
� There is more lateral cracking in the oxide formed on ZIRLOTM,this is attributed to the effect of Sn on the mechanical propertiesof the substrate and its influence on the formation of undula-tions in the metal-oxide interface.
� It is concluded that the improved corrosion performance of Zr–1.0Nb–0.1Fe is due to the reduced stabilization of tetragonalgrains in the absence of Sn. This results in the formation of lar-ger, well-oriented columnar grains and leads to less transforma-tion and therefore a delayed transition.
� The combined effect of reduced disruption and increased colum-nar grain size leads to the Zr–1.0Nb–0.1Fe alloy remaining pro-tective againstH ingress, even after 540 days autoclave exposure.
Acknowledgements
This work was conducted as part of the MUZIC-2 collaborationstudying hydrogen pickup mechanisms in zirconium alloys.Financial support and fruitful discussions from this communityare gratefully acknowledged. Also, this project is financially sup-ported by Rolls-Royce through the Advanced Metallic SystemsCentre for Doctoral Training.
References
[1] M. Harada, M. Kimpara, K. Abe, Effect of alloying elements on uniformcorrosion resistance of zirconium-based alloys in 360 �C water and 400 �Csteam, in: Zirconium in the Nuclear Industry: 9th International Symposium,ASTM STP 1132, 1991, pp. 368–391.
[2] P. Barberis, Zirconia powders and Zircaloy oxide films: tetragonal phaseevolution during 400 �C autoclave tests, J. Nucl. Mater. 226 (1995) 34–43.
[3] K. Takeda, H. Anada, Mechanism of corrosion rate degradation due to tin, in:Zirconium in the Nuclear Industry: 12th International Symposium, ASTM STP1354, 2000, pp. 592–608.
[4] J. Wei, P. Frankel, E. Polatidis, M. Blat, A. Ambard, R.J. Comstock, L. Hallstadius,M. Preuss, The effect of Sn on autoclave corrosion performance and corrosionmechanisms in Zr–Sn–Nb alloys, Acta Mater. 61 (11) (2013) 4200–4214.
[5] G.P. Sabol, ZIRLO – an alloy development success, in: Zirconium in the NuclearIndustry: 14th International Symposium, ASTM STP 1467, 2005, pp. 2–24.
[6] N. Petigny, P. Barberis, C. Lemaignan, V. Ch, M. Lallemant, In situ XRD analysisof the oxide layers formed by oxidation at 743 K on Zircaloy 4 and Zr–1NbO, J.Nucl. Mater. 280 (3) (2000) 318–330.
[7] F. Garzarolli, H. Seidel, R. Tricot, J. Gros, Oxide growth mechanism onzirconium alloys, in: Zirconium in the Nuclear Industry: 9th InternationalSymposium, ASTM STP 1132, 1991, pp. 395–415.
[8] B. Cox, Some thoughts on the mechanisms of in-reactor corrosion of zirconiumalloys, J. Nucl. Mater. 336 (2–3) (2005) 331–368.
[9] M. Preuss, P. Frankel, S. Lozano-Perez, D. Hudson, E. Polatidis, N. Ni, J. Wei,Studies regarding corrosion mechanisms in zirconium alloys, in: Zirconium inthe Nuclear Industry – 16th International Symposium, vol. 8, no. 9, ASTM STP1529, 2011, pp. 1–23.
[10] A. Garner, A. Gholinia, P. Frankel, M. Gass, I. MacLaren, M. Preuss, Themicrostructure and microtexture of zirconium oxide films studied bytransmission electron backscatter diffraction and automated crystal orientationmappingwith transmission electronmicroscopy, ActaMater. 80 (2014) 159–171.
[11] M. Glavicic, Development and Application of Techniques for theMicrostructural Characterisation of Hydrogen Permeability in ZirconiumOxides, McGill University, Montreal, 1998.
[12] A. Yilmazbayhan, E. Breval, A.T. Motta, R.J. Comstock, Transmission electronmicroscopy examination of oxide layers formed on Zr alloys, J. Nucl. Mater.349 (3) (2006) 265–281.
[13] V.Y. Gertsman, A.P. Zhilyaev, J.A. Szpunar, Grain boundary misorientationdistributions in monoclinic zirconia, Model. Simul. Mater. Sci. Eng. 5 (1997)35–52.
[14] M. Elmosethi, B. Warr, S. Mclntyre, A study of the hydrogen uptake mechanismin zirconium alloys, in: Zirconium in the Nuclear Industry: 10th InternationalSymposium, ASTM STP 1245, 1994, pp. 62–79.
[15] N. Ramasubramanian, V. Perovic, M. Leger, Hydrogen transport in the oxideand hydrogen pickup by the metal during out- and in-reactor corrosion of Zr–2.5Nb pressure tube material, in: Zirconium in the Nuclear Industry: 12thInternational Symposium, ASTM STP 1354, 2000, pp. 853–876.
[16] J.A. Szpunar, W. Qin, H. Li, N.a.P. Kiran Kumar, Roles of texture in controllingoxidation, hydrogen ingress and hydride formation in Zr alloys, J. Nucl. Mater.427 (1–3) (2012) 343–349.
[17] G. Sundell, M. Thuvander, A. Yatim, H. Nordin, H.-O. Andrén, Directobservation of hydrogen and deuterium in oxide grain boundaries incorroded zirconium alloys, Corros. Sci. 90 (2015) 1–4.
[18] N. Ni, S. Lozano-Perez, M. Jenkins, C. English, G.D. Smith, J. Sykes, C.R.Grovenor, Porosity in oxides on zirconium fuel cladding alloys, and itsimportance in controlling oxidation rates, Scr. Mater. 62 (8) (2010) 564–567.
[19] J. Lin, H. Li, J.A. Szpunar, Analysis of zirconium oxide formed during oxidation at623 K on Zr–2.5Nb and Zircaloy-4,Mater. Sci. Eng., A 381 (1–2) (2004) 104–112.
[20] A. Garner, M. Preuss, P. Frankel, A method for accurate texture determinationof thin oxide films by glancing angle laboratory X-ray diffraction, J. Appl.Crystallogr. 47 (2014) 575–583.
[21] N. Ni, D. Hudson, J. Wei, P. Wang, S. Lozano-Perez, G.D.W. Smith, J.M. Sykes, S.S.Yardley, K.L. Moore, S. Lyon, R. Cottis, M. Preuss, C.R.M. Grovenor, How thecrystallography and nanoscale chemistry of the metal/oxide interface developsduring the aqueous oxidation of zirconium cladding alloys, Acta Mater. 60 (20)(2012) 7132–7149.

272 A. Garner et al. / Acta Materialia 99 (2015) 259–272
[22] H. Li, M. Glavicic, J.A. Szpunar, A model of texture formation in ZrO2 films,Mater. Sci. Eng., A 366 (1) (2004) 164–174.
[23] J. Lin, Effect of Texture and Microstructure of Zirconium Alloys on theirOxidation and Oxide Texture, McGill University, Montreal, Canada, 2005.
[24] J. Lin, H. Li, C. Nam, J.A. Szpunar, Analysis on volume fraction and crystalorientation relationship of monoclinic and tetragonal oxide grown on Zr–2.5Nb alloy, J. Nucl. Mater. 334 (2–3) (2004) 200–206.
[25] B. Wadman, Z. Lai, H.O. Andren, A.L. Nystrom, P. Rudling, H. Pettersson,Microstructure of oxide layers formed during autoclave testing of zirconiumalloys, in: Zirconium in the Nuclear Industry: 10th International Symposium,ASTM STP 1245, 1994, pp. 579–598.
[26] W. Gong, H. Zhang, Y. Qiao, H. Tian, X. Ni, Z. Li, X. Wang, Grain morphology andcrystal structure of pre-transition oxides formed on Zircaloy-4, Corros. Sci. 74(2013) 323–331.
[27] H.G. Kim, J.Y. Park, B.K. Choi, Y.H. Jeong, Evaluation of pre-transition oxide onZr–0.4 Nb alloy by using the HVEM, J. Nucl. Mater. 374 (1–2) (2008) 204–210.
[28] J. Wei, P. Frankel, M. Blat, A. Ambard, R.J. Comstock, L. Hallstadius, S. Lyon, R.A.Cottis, M. Preuss, Autoclave study of zirconium alloys with and withouthydride rim, Corros. Eng., Sci. Technol. 47 (7) (2012) 516–528.
[29] a. Yilmazbayhan, Structure of zirconium alloy oxides formed in pure waterstudied with synchrotron radiation and optical microscopy: relation tocorrosion rate, J. Nucl. Mater. 324 (1) (2004) 6–22.
[30] R.M. Langford, C. Clinton, In situ lift-out using a FIB-SEM system, Micron 35 (7)(2004) 607–611.
[31] N. Ni, Study of Oxidation Mechanisms of Zirconium Alloys by ElectronMicroscopy, University of Oxford, 2011.
[32] P.W. Trimby, Orientation mapping of nanostructured materials usingtransmission Kikuchi diffraction in the scanning electron microscope,Ultramicroscopy 120 (2012) 16–24.
[33] E.F. Rauch, M. Véron, Automatic crystal orientation and phase mapping in TEMby precession diffraction, Microsc. Anal. 22 (2008) S5–S8.
[34] E.F. Rauch, L. Dupuy, Rapid spot diffraction patterns identification throughtemplate matching, Arch. Metall. Mater. 50 (1) (2005) 87–99.
[35] A. Garner, Investigating the Effect of Oxide Texture on the Corrosion Performanceof Zirconium Alloys, The University of Manchester, Manchester, 2015.
[36] Y. Takagawa, S. Ishimoto, Y. Etoh, T. Kubo, K. Ogata, O. Kubota, The correlationbetweenmicrostructures and in-BWR corrosion behavior of highly irradiated Zr-basedalloys, Zircon.Nucl. Ind. 14th Int. Symp.ASTMSTP1467,2004, pp. 386–403.
[37] A. Couet, A.T. Motta, R.J. Comstock, R.L. Paul, Cold neutron prompt gammaactivation analysis, a non-destructive technique for hydrogen level assessmentin zirconium alloys, J. Nucl. Mater. 425 (1–3) (2012) 211–217.
[38] A. Couet, A.T.Motta, R.J. Comstock, Hydrogen pickupmeasurements in zirconiumalloys: Relation to oxidation kinetics, J. Nucl. Mater. 451 (1–3) (2014) 1–13.
[39] A. Couet, Hydrogen pickup mechanism of zirconium alloys, The PennsylvaniaState University, 2014.
[40] N. Ni, S. Lozano-Perez, J. Sykes, G.D. Smith, C.R. Grovenor, Focussed ion beamsectioning for the 3D characterisation of cracking in oxide scales formed oncommercial ZIRLOTM alloys during corrosion in high temperature pressurisedwater, Corros. Sci. 53 (12) (2011) 4073–4083.
[41] R. Hielscher, H. Schaeben, D. Chateigner, On the entropy to texture indexrelationship in quantitative texture analysis, J. Appl. Crystallogr. 40 (2) (2007)371–375.
[42] F. Bachmann, R. Hielscher, H. Schaeben, Texture analysis with MTEX – free andopen source software toolbox, Solid State Phenom. 160 (2010) 63–68.
[43] P. Bossis, G. Lelikvre, P. Barberis, X. Iltis, F. Lefebvre, Multi-scalecharacterization of the metal-oxide interface of zirconium alloys, in:Zirconium in the Nuclear Industry: 12th International Symposium, ASTMSTP 1354, 2000, pp. 918–945.
[44] P. Tejland, H.-O. Andrén, Origin and effect of lateral cracks in oxide scalesformed on zirconium alloys, J. Nucl. Mater. 430 (1–3) (2012) 64–71.
[45] E. Polatidis, P. Frankel, J. Wei, M. Klaus, R.J. Comstock, A. Ambard, S. Lyon, R.Cottis, M. Preuss, Residual stresses and tetragonal phase fractioncharacterisation of corrosion tested Zircaloy-4 using energy dispersivesynchrotron X-ray diffraction, J. Nucl. Mater. 432 (1–3) (2013) 102–112.
[46] V.Y. Gertsman, Y.P. Lin, A.P. Zhilyaev, J.A. Szpunar, Special grain boundaries inzirconia corrosion films, Philos. Mag. A 79 (7) (1999) 1567–1590.
[47] E.C. Subbarao, Martensitic transformation in zirconia, Phys. Status Solidi 9(1974).
[48] J. Godlewski, J. Gros, M. Lambertin, J. Wadier, H. Weidinger, Ramanspectroscopy study of the tetragonal-to-monoclinic transition in zirconiumoxide scales and determination of overall oxygen diffusion by nuclear analysisof O(18), in: Zirconium in the Nuclear Industry: 9th International Symposium.ASTM STP 1132, 1991, pp. 416–436.
[49] A.T. Motta, A. Yilmazbayhan, R.J. Comstock, J. Partezana, G.P. Sabol, B. Lai, Z.Cai, Microstructure and growth mechanism of oxide layers formed on Zr alloysstudied with micro-beam synchrotron radiation, in: Zirconium in the NuclearIndustry: 14th International Symposium, vol. 2, no. 5, ASTM STP 1467, 2005,pp. 205–232.
[50] H. Hulme, M. Preuss, S. Lyon, A. Steuwer, K. Noren, S. Carlson, M. Gass, M.Ivermark, and R. J. Comstock, A X-ray absorption near-edge structure (XANES)study of the Sn L3 edge in a Zircaloy-4 oxide film, Submitt. to Thin Solid Film,2014.
[51] S. Fabris, A.T. Paxton, M.W. Finnis, A stabilization mechanism of zirconia basedon oxygen vacancies only, Acta Mater. 50 (2002) 5171–5178.
[52] Y.S. Kim, Y.H. Jeong, J.N. Jang, Stress measurements during thin film zirconiumoxide growth, J. Nucl. Mater. 412 (2) (2011) 217–220.
[53] D. Pecheur, V. P. Filippov, A. B. Bateev, and J. J. Ivanov, Mössbauerinvestigations of the chemical states of tin and iron atoms in zirconiumalloy oxide film, in: Zircon. Nucl. Ind. 13th Int. Symp. ASTM STP 1423, 2002, pp.135–153.
[54] B.D.C. Bell, S.T. Murphy, P.A. Burr, R.W. Grimes, M.R. Wenman,Accommodation of Tin in Tetragonal ZrO2, Submitt. to J. Appl. Phys., 2015.
[55] E.R. Bradley, A.-L. Nyström, Microstructure and properties of corrosion-resistant zirconium-tin-iron- chromium-nickel alloys, in: Zirconium in theNuclear Industry: 10th International Symposium, ASTM STP 1245, 1994, pp.483–498.
[56] P. Bossis, F. Lefebvre, P. Barberis, A. Galerie, Corrosion of zirconium alloys: linkbetween the metal/oxide interface roughness, the degradation of theprotective oxide layer and the corrosion kinetics, Mater. Sci. Forum 369–372(2001) 255–262.
[57] S. Yardley, K. Moore, N. Ni, J. Wei, S. Lyon, M. Preuss, S. Lozano-Perez, C.R.M.Grovenor, An investigation of the oxidation behaviour of zirconium alloysusing isotopic tracers and high resolution SIMS, J. Nucl. Mater. 443 (1–3)(2013) 436–443.