the effect of taxes on royalties and the migration of ... effect of taxes on royalties and the...
TRANSCRIPT

NBER WORKING PAPER SERIES
THE EFFECT OF TAXES ON ROYALTIES AND THE MIGRATION OF INTANGIBLEASSETS ABROAD
John H. MuttiHarry Grubert
Working Paper 13248http://www.nber.org/papers/w13248
NATIONAL BUREAU OF ECONOMIC RESEARCH1050 Massachusetts Avenue
Cambridge, MA 02138July 2007
The authors thank Mihir Desai, the editors, and conference participants for helpful comments. Theideas expressed are solely those of the authors and not necessarily the U.S. Treasury Department orthe National Bureau of Economic Research.
© 2007 by John H. Mutti and Harry Grubert. All rights reserved. Short sections of text, not to exceedtwo paragraphs, may be quoted without explicit permission provided that full credit, including © notice,is given to the source.

The Effect of Taxes on Royalties and the Migration of Intangible Assets AbroadJohn H. Mutti and Harry GrubertNBER Working Paper No. 13248July 2007JEL No. F23,H32
ABSTRACT
Migration of intangible assets from the United States to foreign countries has become easier due tothe ability of U.S. firms to create hybrid entities in their affiliates abroad and to reach favorable costsharing agreements with them. This strategy was particularly encouraged by the U.S. adoption of"check-the-box" regulations in 1997. Rather than receive royalties from affiliates abroad, US parentfirms have an incentive to retain abroad in low-tax countries a greater share of the return to their USR&D. Evidence from several sources for years that span the 1997 policy change indicate a significantresponse by US corporations in utilizing this strategy. BEA data indicate affiliate earnings and profitsgrew more rapidly than royalty payments to US parents. Payments to U.S. parents for technical servicesrose even faster, as would be called for under cost sharing agreements. Regression analysis of affiliatedata shows that parent R&D was a more important determinant of royalty payments to U.S. parentsthan it was for affiliate earnings and profits in 1996, but by 2002 it played a larger role in earningsand profits than in royalties. Cost sharing payments from affiliates in Ireland and from pure tax havens(Bermuda, the Cayman Islands, and Luxembourg) are particularly significant, both economically andstatistically.
John H. MuttiGrinnell CollegeDepartment of EconomicsBox 5866Grinnell, IA [email protected]
Harry GrubertDepartment of the [email protected]
2
I. Introduction
A front page article of the Wall Street Journal in November 2005 describes the way that
Microsoft’s four-year old Irish subsidiary, Round Island One Ltd., allows the parent company to
save at least $500 million in taxes each year (Simpson 2005). By licensing its software for use in
Europe, the Middle East, and Africa through the Irish subsidiary, Microsoft receives royalty
payments that are deductible in high-tax locations and subject to a low rate of corporate income
taxation in Ireland. Because the earnings are retained abroad, they are not subject to a residual U.S.
tax. According to company filings with the Securities and Exchange Commission, Simpson reports
that other technology companies are following a similar strategy to reduce their overall tax burden.
Such reports are an indication of major changes over the past ten years in the tax planning
strategies of U.S. multinational corporations (MNCs). These changes have affected the likelihood
that a U.S. parent will receive royalties from its foreign affiliates or that the parent will be able to
increase its earnings abroad from exploiting intangible assets that it develops in the United States.
Additionally, U.S. parents have found new ways to accomplish the relocation or migration of
intangible assets abroad. These new strategies have implications for the way the return to U.S.
research and development (R&D) is reported to the Internal Revenue Service (IRS), as well as any
incentive to relocate innovative activity outside of the United States. This paper demonstrates how
firms have interpreted two important tax regulations to create these new strategies, and it examines
how they appear to have influenced measures of MNC activity reported by the Treasury, the Bureau
of Economic Analysis, and the National Science Foundation.

3
One important tax planning development was the issuance of the ‘check-the-box’ regulations by
the IRS in 1997, which greatly simplified the use of hybrid entities. These are operations that are
classified as incorporated subsidiaries by one country and transparent branches by another. As
explained in Section II of the paper, this distinction allows U.S. MNCs to avoid immediate taxation
of inter-subsidiary payments that otherwise would occur under the anti-abuse Controlled Foreign
Corporation (CFC) provisions of subpart F of the Internal Revenue Code. Hybrids can make such
inter-subsidiary payments invisible to the U.S. Treasury. As a result, MNCs can retain earnings
abroad in low-tax locations.
A second element of the successful tax saving strategies that accomplish the transfer of
intellectual property abroad is that an affiliate can acquire the rights to a valuable intellectual
property at a favorable price. A tax haven entity can engage in a cost sharing agreement with the
parent in which it shares in the cost of an R&D project in exchange for the right to exploit the
technology abroad. Once the technology is developed the tax haven company can license an
operating sibling in a high-tax location, but with a hybrid structure the deductible royalty paid to the
tax haven will not be subject to immediate U.S. tax. Companies have apparently been able to
arrange favorable cost sharing agreements that permit them to leave abroad in a low-tax location a
greater share of the return to the U.S. R&D.
If the strategy sketched out above is widely adopted, the growth in royalties received by U.S.
parents can be expected to decline, and earnings retained in the tax haven company will grow. The
popularity of cost sharing agreements combined with hybrid structures also suggests that there will
be an increase in payments for technical services by U.S. subsidiaries to their parents relative to
4
royalties. In the long run, however, the sum of these service payments should decline relative to
foreign direct investment income abroad as more of the return to U.S. intangible assets is in the form
of net income deferred abroad in low-tax locations.
The paper assesses these predictions empirically at two levels, one using data aggregated to the
country or worldwide level, and one examining firm-specific practices. Verifying whether the
determinants of affiliate royalty payments have been affected by this new tax saving strategy also is
relevant in addressing a potential policy issue in tax reform. In November 2005, the President’s
Advisory Panel on Federal Tax Reform recommended two possible reform plans. One was termed
the Simplified Income Tax, whose provisions in the international area would exempt from U.S. tax
any dividends received from active business income abroad. The foreign tax would be the final tax
imposed on that income. Because that dividend income would never be subject to U.S. tax, such a
change would be likely to reduce royalty payments made to U.S. parents; royalties would continue to
be fully taxed under the rationale that they are a deductible expense abroad.
The remainder of the paper proceeds by first providing a fuller explanation of hybrid structures
and cost sharing agreements. It then examines evidence from IRS and BEA data to determine
whether the strategies suggested above can be detected either in data aggregated to the country level
or in firm specific data. For both levels of empirical analysis several measures are quite consistent
with the predictions described above.
II. Alternative Ways of Utilizing a Hybrid Structure to Affect Payments for Technology

5
The United States taxes the worldwide income of its residents, but allows a credit for foreign
income taxes paid on income received from abroad. Although any residual U.S. tax is deferred until
active business income is repatriated to the United States, for some types of income a U.S. tax is due
immediately. Hybrids are a business structure that allows U.S. firms to avoid having income treated
in that latter category. To understand the significance of hybrids, first consider the role of the CFC
rules that otherwise would apply to transactions between related parties. A recent Treasury
document (2000, p. xii) states the following:
The subpart F rules attempt to prevent (or negate the tax advantage from) deflection of income, either from the United States or from the foreign country in which earned, into another jurisdiction which is a tax haven or which has a preferential tax regime for certain types of income. Thus, subpart F generally targets passive income and income that is split off from the activities that produced the value in the goods or services generating the income. Conversely, subpart F generally does not require current taxation of active business income except when the income is of a type that is easily deflected to a tax haven, such as shipping income, or income earned in certain transactions between related parties. In related party transaction, deflection of income is much easier because a unified group of corporations can direct the flow of income between entities in different jurisdictions. …Generally, rents and royalties earned by a CFC in an active business are excluded from Foreign Personal Holding Company Income (FPHCI). This exception does not apply, however, if the CFC’s rents or royalties are received from a related person. Accordingly, rents and royalties received from a related person are generally treated as FPHCI, without regard to the nature of the business activities of the CFC that give rise to the rents and royalties.
The statement above distinguishes payments to related parties from other transactions that
affiliates might make, because of the belief that the former can be more easily manipulated to shift
income from one jurisdiction to another. The CFC rules might be regarded as a backstop to transfer
pricing regulations that attempt to limit income shifting practices. If payments between related
parties cannot be observed by the U.S. Treasury, however, an MNC can avoid this subpart F
6
treatment. Note that this residual tax is important to U.S. MNCs whose foreign tax payments are
less than the U.S. tax liability on that foreign income. For companies that have substantial excess
foreign tax credits, there is little incentive to create a hybrid to avoid U.S. taxation of royalty
income, because that income already would have been shielded from any additional U.S. tax.
To illustrate the potential benefit from a hybrid arrangement, consider an example where a parent
capitalizes a hybrid entity in a tax haven with equity, and then has it lend to an operation in a high-
tax location. The MNC reports to the high-tax jurisdiction that the tax-haven affiliate is a
corporation, but it tells the U.S. Treasury that the tax haven affiliate is an unincorporated branch of
the high-tax subsidiary. The high-tax subsidiary receives a deduction for the interest paid to the tax
haven affiliate, but from the U.S. Treasury’s perspective the two affiliates are treated as one
consolidated company. The interest income received in the tax haven is not reported to the U.S.
Treasury and can therefore be deferred from current U.S. tax. Without the hybrid, a payment to a tax
haven finance subsidiary would be subject to current U.S. tax under the CFC rules.1 Altshuler and
Grubert (2005) calculate that these types of structures allowed U.S. multinational companies to
lower their foreign taxes by $7.0 billion per year in 2002 compared to 1997.
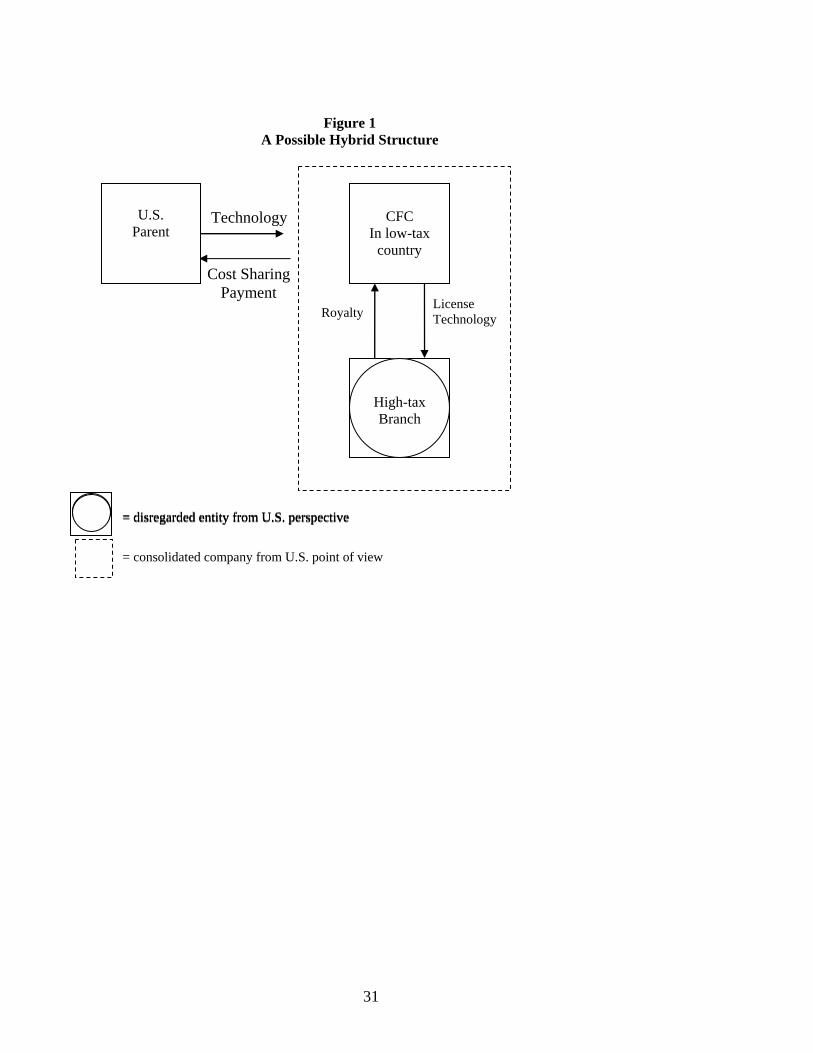
Figure 1 shows a hybrid structure applicable in the technology setting considered here, which
allows the low-tax affiliate to strip out income from the high-tax affiliate through royalty payments
that are a deductible expense in the high-tax country. From the perspective of the high-tax country,
1 A tax law change in 2006 makes it possible for a firm under certain circumstances to achieve this same tax saving result without a hybrid structure. Under the Tax Increase Prevention and Reconciliation Act signed into law on May 17, 2006, which is scheduled to apply through 2008, CFCs can avoid the subpart F treatment explained above if the inter-subsidiary payments of dividends, interest, rents, and royalties are attributable to active business income, in contrast to passive income.
7
less income will be declared by the affiliate that operates there, and the host government will have
collected less tax revenue. The royalty income is not recognized by the U.S. Treasury and can be
retained in the low-tax country where it escapes a current U.S. tax.
Similar benefits may arise under other hybrid structures, although the way such benefits will be
reported to the U.S. Treasury changes. For example, an affiliate in a high-tax Country A may claim
for U.S. tax purposes that a related affiliate in a low-tax Country B is its branch, and therefore the
latter entity becomes invisible to the U.S. Treasury. If the high-tax affiliate in Country A pays a
royalty to the low-tax affiliate in B, it is not recognized by the U.S. Treasury. The consolidated net
income of the high-tax affiliate rises because the royalty is deducted against a high tax rate, but the
higher income now earned by the low-tax affiliate can be retained in B and need not face the higher
tax rate in A. The Country A affiliate appears more profitable because the tax burden on a given
dollar of income now is lower.
In the case of R&D cost sharing agreements, a key issue is the basis on which the affiliate is
allowed to “buy in” to successful research carried out by the parent. If a parent’s latest innovation
builds on several previous generations of research, but the affiliate is able to pay a favorable price
that places little value on those past expenditures, the strategy is particularly successful in allowing a
migration of the intangible asset to the location abroad. New proposed regulations under the cost
sharing provisions of Section 482.7 of the Internal Revenue Code (Reg-144615-02 announced for
public comment on August 29, 2005) are intended to address the “inappropriate migration of
intangibles.” Initial reaction to these proposed regulations suggest that they represent a major

8
revision, which is more likely to require that such agreements reflect a price that would be offered in
an arms-length transaction to an investor who bore none of the risk of the earlier product
developments. Under the less explicit current regulations, U.S. parents have been able to achieve the
outcome that a smaller ownership share of successful technological innovations is retained in the
United States, and fewer royalties will be received by the parent in the future. While payments from
the affiliate for technical services under the cost sharing agreement will result in an initial increase in
parent receipts, over the longer run the parent will receive fewer payments for the utilization of its
intangible assets abroad either in the form of royalties or in the form of cost sharing payments.
III. Indications of the Changing Importance of Royalty Payments at the Aggregate Level
U.S. Treasury Data
As indicated above, the U.S. Treasury receives tax returns from U.S. controlled foreign
corporations, which provide information about royalty payments, payments for technical services,
and CFC earnings. Table 1 is based on compilations of information from the Form 5471, which is
filed with the basic corporate return and reports on each controlled foreign corporation’s transactions
with its related parties. The table compares the values reported in 1996, before the ‘check-the-box’
regime was adopted, and 2002. The latter year is the latest one for which these data are available.
Because some of the hybrid arrangements and cost-sharing agreements described above may take
time to design and implement, a longer time frame generally is desirable to allow more complete
adjustment to these new tax saving opportunities. Over a longer time frame, however, the actual
response observed may be affected by other policy changes or by changes in the business cycle. For
example, due to the economic downturn that occurred in many parts of the world in 2002, the likely
9
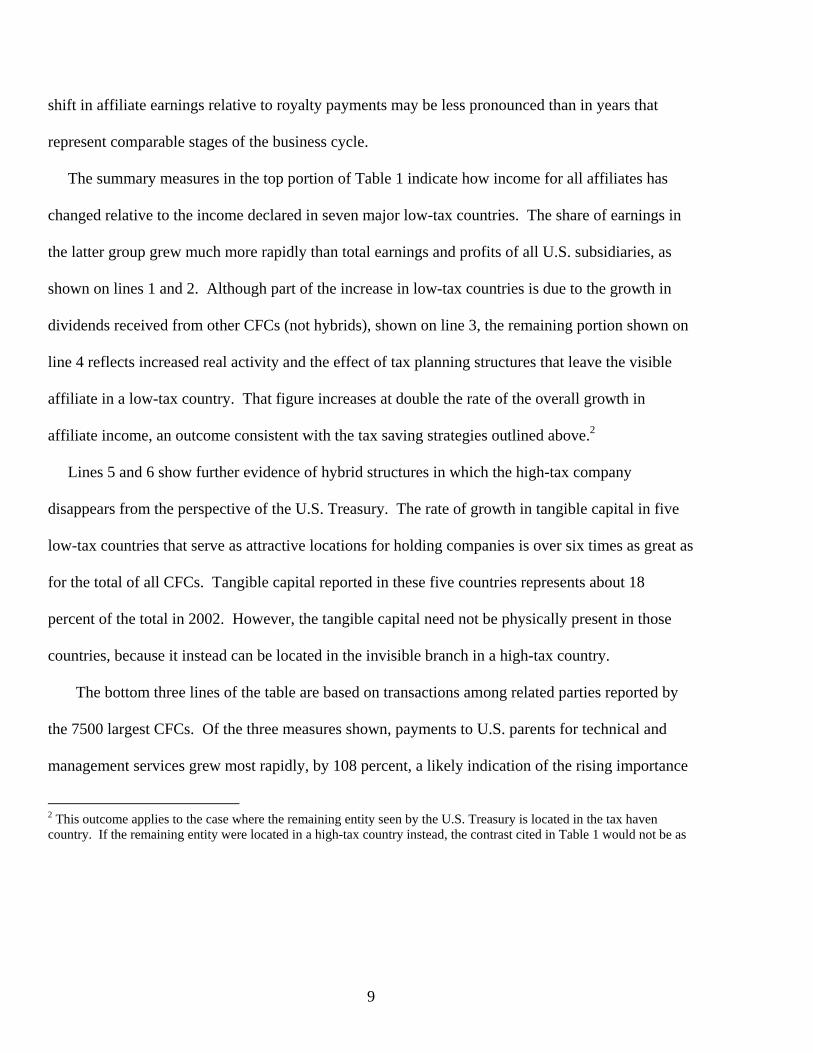
shift in affiliate earnings relative to royalty payments may be less pronounced than in years that
represent comparable stages of the business cycle.
The summary measures in the top portion of Table 1 indicate how income for all affiliates has
changed relative to the income declared in seven major low-tax countries. The share of earnings in
the latter group grew much more rapidly than total earnings and profits of all U.S. subsidiaries, as
shown on lines 1 and 2. Although part of the increase in low-tax countries is due to the growth in
dividends received from other CFCs (not hybrids), shown on line 3, the remaining portion shown on
line 4 reflects increased real activity and the effect of tax planning structures that leave the visible
affiliate in a low-tax country. That figure increases at double the rate of the overall growth in
affiliate income, an outcome consistent with the tax saving strategies outlined above.2
Lines 5 and 6 show further evidence of hybrid structures in which the high-tax company
disappears from the perspective of the U.S. Treasury. The rate of growth in tangible capital in five
low-tax countries that serve as attractive locations for holding companies is over six times as great as
for the total of all CFCs. Tangible capital reported in these five countries represents about 18
percent of the total in 2002. However, the tangible capital need not be physically present in those
countries, because it instead can be located in the invisible branch in a high-tax country.
The bottom three lines of the table are based on transactions among related parties reported by
the 7500 largest CFCs. Of the three measures shown, payments to U.S. parents for technical and
management services grew most rapidly, by 108 percent, a likely indication of the rising importance
2 This outcome applies to the case where the remaining entity seen by the U.S. Treasury is located in the tax haven country. If the remaining entity were located in a high-tax country instead, the contrast cited in Table 1 would not be as

10
of cost sharing agreements. Earnings and profits grew less than royalties paid to the parent, 41
percent compared to 68 percent. That result is somewhat unexpected, if the combination of a hybrid
and a cost sharing agreement makes royalty payments from high-tax affiliates invisible to the U.S.
Treasury.
To put this observation in perspective, however, consider two factors that are more supportive of
the hybrid strategy’s importance. First, the relative ranking of royalties and profits for 2002 may
result because earnings are more cyclically volatile than royalties, and 2002 was a year in which
earnings and profits declined from their 2000 peak. By way of contrast, royalties grew less rapidly
than earnings over the period 1996-2000.3 Second, between 2000 and 2002 the Treasury data show
that royalties received by U.S. parents increased 29 percent, whereas the BEA’s international
transactions figures indicate that royalties received by U.S. parents only grew by 5 percent between
those same years. Such ambiguities suggest the importance of considering multiple data sources to
indicate MNC responses to the changing tax incentives.4
Bureau of Economic Analysis data
great. Evidence for that latter strategy would appear as a lower effective tax rate in the high-tax country, a situation examined by Altshuler and Grubert (2005). 3 Changing composition of this group also may influence these comparisons. Because the largest 7,500 affiliates are selected based on their reported assets, this set includes more capital-intensive operations, such as finance, insurance and real estate. Based on income or receipts, manufacturing, wholesale and retail trade, and construction would play a larger role. Throughout the 1990s these latter industries have declined in relative importance (Nutter 2001).
4 A further example of the difference between Treasury tax data and BEA data comes from looking at total royalty payments reported by U.S. corporations on Form 1118, the basis for claiming a foreign tax credit. In 2000, firms claimed royalties of $75 billion. In the BEA international transactions data, total royalties received by all U.S. residents was $43 billion. MNCs may have a bigger tax incentive to characterize payments received from abroad as royalties, because that increases the foreign source income they receive and thereby increases the foreign tax credits they can claim (see Mutti and Grubert 1998 for discussion of the effects of different source rules).

11
The Bureau of Economic Analysis publishes two important sources of data on affiliate
operations. One is the Annual and Benchmark Surveys of Direct Investment Abroad, which present
financial and operating data of foreign affiliates. Greater detail is available in the case of majority
owned affiliates (MOFAs). A second important source of information comes from the U.S.
international transactions accounts. These data lie behind the calculation of the direct investment
position. However, they only consider the transactions of foreign affiliates with their U.S. parents
and do not provide any basis for analyzing transactions among affiliates.
The surveys of financial and operating data offer the advantage that information is collected for
each affiliate, regardless of whether it operates as a branch or is incorporated in the foreign country.
In contrast to the Treasury data, the disappearance of affiliates under a hybrid arrangement should
not occur in the BEA data. Nevertheless, care is warranted in interpreting these data, too, because
certain measures of affiliate activity, such as net income, may appear overstated due to double
counting.5 If net income is likely to be overstated, but royalties are not, then comparing the
percentage changes in each of these items will not be a valid test of the firm’s response to the tax
incentives identified above.
For example, if a MOFA in country A receives a dividend from a MOFA in country B, the U.S.
parent will report the affiliate’s earnings in Country B and also the remitted dividend as part of the
income of the affiliate in Country A. The sum of income across all MOFAs will appear larger
because of this double counting. As holding company operations expand, and fulfill the role of the
5 See Borga and Mataloni (2001), and Altshuler and Grubert (2005) for presentation of this issue. Altshuler and Grubert were interested in how much tax saving was possible through the growth of payments that presumably were deductible in high-tax locations, in contrast to payments of dividends from one affiliate to another.

12
Country A MOFA in the example above, the potential double counting becomes larger. While the
trend toward greater use of holding companies can be observed from the 1980s onward, the shift
from 1996 to 2004 is particularly large. As reported by Koncz and Yorgason (2005), the portion of
the U.S. direct investment position abroad that they account for has roughly doubled, from 17
percent to 34 percent.6
In contrast, the direct investment income figure from the international transactions account does
not include the double counting that can occur with the financial and operating data. Because it
only records transactions between a U.S. parent and its foreign subsidiaries, it is not affected by
transactions among affiliates.
Those observations serve as useful background to interpret alternative measures of the operations
of foreign affiliates reported in Table 2. The table shows relevant data by which to assess changes
in earnings and royalties from benchmark surveys from 1989, 1994, and 1999. Annual survey data
are available for 2003, but those data do not provide a complete representation of transactions
among affiliates. The royalty payments and other private direct investment service payments for
that year are taken from the international transaction accounts.
First consider the implications of the changes observed from 1994 to 1999, the benchmark years
that span the introduction of the ‘check-the-box’ opportunity. Then examine whether those trends
are reinforced by additional responses to those incentives in the subsequent 1999-2003 period or
whether other factors that operate over that period offset the initial responses observed. Also,
6 Luxembourg has been a particularly attractive location, because it exempts from corporate tax the dividends, interest and royalties received from a foreign source by the holding company. Exemption systems more typically do not tax

13
consider how these patterns differ from those observed in the earlier benchmark intervals from
1982-1989 and 1989-1994.
The BEA data indicate that over the 1994-99 period royalties paid by affiliates to U.S. parents
grew by 50 percent, a rate faster than some indicators of MNC activity, such as sales, gross product,
employment, and R&D, but not as fast as several other measures such as income, property, plant and
equipment, and payments to the parent for other private direct investment services. Comparing
royalty payments to affiliate income requires careful attention to the distinctions raised above, and
therefore two measures for income are included in the table. The first is based on the sum of before-
tax income reported by all MOFAs (which can include double counting described above). The
second is based on the direct investment return to U.S. parents (which should be free from the
double counting described above) adjusted upward by the amount of foreign income tax paid. The
increase in the former figure is particularly large, probably a reflection of the growth of holding
company operations. The increase in the latter figure still is greater than that of royalty payments to
the parent over the 1994-1999 period that spans the introduction of ‘check-the-box’ regulations.
To give greater insight into the conflicting forces that influence the royalty figure, note that in the
earlier 1989-1994 period royalties grew quite rapidly at a time when the growth in income was very
slight. As explained above, the opportunity to receive royalties free of any residual U.S. tax occurs
when the U.S. parent has excess foreign tax credits. While the U.S. Tax Reform Act of 1986
reduced the U.S. corporate tax rate from 46 percent to 34 percent, and caused an initial increase in
the share of U.S. parents that were in excess credit positions, that initial consequence was not a
dividends received from abroad, because they have born a corporate tax in the host country, but do not exempt payments

14
permanent change. Companies adjusted the types of payments they made and host countries
reduced their corporate tax rates (Grubert, Randolph, and Rousslang 1996). Nevertheless, the
incentive to pay additional royalties continued to operate into the 1990s. There was substantial
public commentary over various iterations of proposed regulations that would specify what royalty
methods could be used under the provisions of 1986 act, and the standard that emerged when those
regulations were finalized in 1994 was more stringent than existed prior to 1986. Companies likely
adjusted their practices before 1994 in anticipation of such a change. Also, in 1993 penalty
regulations were adopted, which applied if royalties were understated. In short, there were several
policy changes that could be expected to create increasing pressure to raise royalty payments over
the 1989-94 period.
While the rate of increase of royalty payments by affiliates to parents was slower in the 1994-99
period, the growth rate of payments to other affiliates increased sharply by 131 percent, the largest
increase shown in Table 2. Relative to the royalties paid to the parent, the proportion paid to other
affiliates rose from 15 percent to 24 percent. This pattern is consistent with the rising role of hybrid
structures and the payment of royalties from high-tax affiliates to low-tax affiliates. Finally, parent
receipts of other direct investment service payments rose faster than royalties, 75 percent versus 50
percent from 1994-1999. The larger increase in direct investment service payments is a pattern
consistent with the rise of cost sharing agreements in the Treasury data.
A particular advantage of the BEA data is that they show distinctions by country of origin of
these payments by affiliates. The summary figures in Tables 3 and 4 demonstrate that the pattern of
that were deductible abroad.

15
royalty payments is sensitive to tax incentives. From 1994 to 1999 a particularly large increase
occurred in royalty payments to U.S. parents from affiliates in Ireland and Singapore, as shown in
Table 3A. In the case of Ireland, over the earlier five-year period (1989-94), its share of all royalties
received by U.S. parents from their MOFAs rose from 2.2 percent to 5.1 percent, but in the more
recent period (1994-1999) that proportion increased to 15.0 percent. In the case of Singapore, the
corresponding changes were from 1.6 percent to 3.2 percent and then to 4.6 percent.
This pattern of payments suggests that U.S. parents have found it profitable to locate intellectual
property in low-tax countries, and from the additional revenue received there to pay additional
royalties to the U.S. parent. This strategy will be particularly attractive if only a portion of the
additional revenue is paid to the U.S. parent, and the rest is retained in the low-tax country. In the
case of Ireland, royalties as a share of net income more than doubled from 1989-1994, but then only
increased slightly from 1994 to 1999. In 1994 before-tax income per dollar of sales, net of earnings
from equity investments in other foreign affiliates, was more than three times higher for Irish
affiliates than for the average across all affiliates. U.S. parents already had found it attractive to shift
profits to Ireland before the advent of ‘check-the-box.’ Although that differential did not increase
between 1994 and 1999, a substantial increase in the absolute amount of profits occurred. For Irish
affiliates, there was a threefold increase in before-tax equity income, whereas the increase for all
other affiliates was 73 percent. For evidence of the operation of hybrids, note that royalty receipts
from high-tax countries such as France, Germany or Japan have either declined or grown at rates
much slower than the average. Those affiliates may still be paying royalties commensurate with

16
their expanding sales, but they are not paying them to the U.S. parent, a consequence of hybrid
structures being created.
In the case of royalty payments from one MOFA to another, disclosure limitations mean that the
large increase in payments to other MOFAs shown in Table 4 generally cannot be assigned to
specific countries. More rapid growth in payments from high-tax countries might be expected on
average. Disclosure limitations also make it impossible to show whether the largest increases in
royalties received occurred for affiliates in low-tax countries.7
Consider an alternative standard to apply in assessing how MNC royalty receipts have changed
over time: compare those received from related parties to those from unrelated parties.8 For the
two benchmark years that span the 1986 tax reform, the share of royalties received from related
parties jumped from 67 percent in 1982 to 77 percent in 1989, a clear indication of the sensitivity of
royalty payments to tax incentives. From that peak, however, the ratio has decreased to roughly 75
percent, and exhibits no clear response to later tax policy changes such as ‘check-the-box.’ Of
course, U.S. parents in an excess foreign tax credit position have an incentive to characterize a
receipt as a royalty, regardless of whether it is received from a related or an unrelated party.
Regarding the rapid increase in payments for other direct investment services (such as cost
sharing agreements), the receipts by U.S. parents do not show the same dominant position for
Ireland and Singapore as appeared in the case of royalties received by U.S. parents. Payments from
those countries did grow at an above-average rate from 1994 to 1999, but the current values still
7 The fact that such disclosure problems are reported for Ireland does seem surprising, given the anecdotal evidence cited at the outset over the large number of companies establishing affiliates there.

17
represent a small share of the total. Note, however, that the combination of cost sharing agreements
and hybrids means that a location where real production occurs, such as Ireland or Singapore, is no
longer necessary to relocate intangible assets. A cost sharing agreement with an affiliate in the
Cayman Islands, for example, which then licenses a branch in Germany to produce using the
technology acquired, will accomplish the desired migration of the intangible to a low-tax location.
Consistent with that new opportunity, payments from holding country destinations such as the
Netherlands and Switzerland hardly rose at all. Of particular significance is the Table 3B entry for
the Other Western Hemisphere, which includes Bermuda and the Cayman Islands. For these
countries there is a fourfold increase in payments to U.S. parents between 1994 and 1999, while the
overall rate of increase is only 75 percent.
Cost sharing agreements take time to design and implement, and the 1994-99 observation period
may simply not allow enough time for this influence to be more significant than the other
determinants of such activity. Extending the observation period, however, may introduce other
confounding factors, beyond the question of cyclical performance mentioned above. In the Table 2
observations for 1999-2003, the item that stands out most sharply is the growth of direct investment
income. Over that same period, the share of foreign earnings distributed to U.S. owners steadily
fell, from 49 percent in 1999 to 30 percent in 2003 and 22 percent in 2004. While such a strategy is
consistent with the incentives explained above, the trend undoubtedly was influenced by
expectations of a change in U.S. tax law that would treat such retained earnings more favorably.
Such an opportunity arose in 2004 when the U.S. Congress phased out the Extraterritorial Income
8 We thank Mihir Desai for suggesting this comparison.

18
regime for taxing export income, given unfavorable rulings against it by the dispute resolution
panels of the World Trade Organization. Congress passed the American Jobs Creation Act, which
also reduced the U.S. tax rate on qualifying dividends from MNC operations abroad for a period of
one year from the statutory rate of 35 percent to 5.25 percent. Preliminary figures for 2005 indicate
that slightly more than the entire direct investment earnings for that year were repatriated, resulting
in a reduction in the amount of retained earnings abroad. At the same time, payments to U.S. parents
in the form of royalties and other direct investment services both rose less rapidly than other
measures of affiliate activity, such as gross output, sales, or property, plant and equipment. These
large changes in MNC behavior demonstrate why there is a limited window over which aggregate
responses can be expected to reflect a dominant role for cost sharing agreements and hybrids alone.
BEA and NSF Measures of Research and Development
A final issue to address at the aggregate level is the possible role of tax considerations in the
location of R&D. Although the U.S. transition to a knowledge-based economy accelerated over the
latter half of the 1990s, in terms of the operations of affiliates abroad, Table 2 shows that the
increase in R&D performed abroad did not keep up with the growth in property, plant and
equipment. The tax incentives for shifting R&D abroad are not straightforward. In a high-tax
location the R&D would receive a valuable current deduction, as in the United States, but any
income, including royalties, would be subject to the same high tax. If the company had reason to
believe that the R&D project was likely to be very profitable, it might locate it in a tax haven
because the value of the current deduction would become less important. This could be combined

19
with a hybrid structure to facilitate the payment of royalties to the tax haven. On the other hand, the
cost sharing structure described above may make the actual shift of R&D unnecessary.
The BEA measures of R&D performed by affiliates and by parents are reported in Table 5. The
ratio of these two values is shown for two different measures, one on line three based on the
published figures measured in U.S. dollars at current exchange rates, and one on line four based on
an adjustment of the numerator to take account of changes in the real exchange rate that may affect
the amount of research that can be performed for a given dollar expenditure. (See, for example,
NSF, National Patterns of Research and Development Resources: 2003 for a discussion of this
issue.) The first set of figures suggests a small increase in the proportion of research activity carried
out by affiliates. The adjustment for PPP indicates that this increase has been somewhat larger,
because the dollar was undervalued in 1994 compared to 1999. In that situation a given foreign
currency expenditure in 1994 translated into more dollars and a higher ratio of affiliate effort on line
three, even though the real amount of R&D work accomplished was not correspondingly larger.
The BEA data allow some breakdown of these figures by country. Two groupings are shown in
Table 5, one that reports R&D performed by affiliates in the four most important sites (France,
Germany, Japan and the United Kingdom), and one that reports R&D performed in six low-tax
countries (Luxembourg is excluded from the group used in Table 2, because in most years this entry
cannot be disclosed). The share accounted for by the top four countries shown on line six has
dropped, as R&D efforts of U.S. firms have been dispersed more broadly across the globe. At the
same time line eight shows that there is no marked increase in the share of R&D performed in low-
tax countries, which would have been more likely if U.S. firms found that was the best way to

20
ensure future innovation of highly profitable ideas could be attributed to affiliates in such low-tax
countries. The absence of such a response suggests that U.S. firms have found other ways to shift
intangibles to those countries, such as the combination of hybrids and favorable cost sharing
agreements, which are more effective than carrying out R&D in countries that lack appropriate
infrastructure or have limited personnel available to carry out such work.
The annual National Science Foundation surveys give the share of total industrial R&D
performed abroad by U.S. companies. The value for R&D abroad is smaller than the BEA number
reported above, and the value for R&D performed domestically is higher, given that it is not
restricted to the value performed by U.S. corporations that have foreign affiliates. Therefore, the
ratios calculated here are lower than those from the BEA calculated above. Figure 2 shows the
comparable ratios for unadjusted and PPP-adjusted R&D effort by affiliates abroad relative to
domestic R&D based on these data. The unadjusted series is quite volatile and exhibits no clear
trend. The adjusted series is much more regular, and the trend line suggests that if the initial value
of the series is 8.6 percent, the annual increase in this value will be slightly less than a tenth of a
percentage point.
The NSF data offer a limited breakdown by the country where the R&D is performed. Although
no geographic detail was provided in 1994, information is given in 1995, which can be compared to
similar information in 1999 to examine whether the patterns in this compilation mirror the trends
shown in the BEA data. A somewhat different picture emerges, because for the same four large
countries, their share of the total actually rises over the time that ‘check-the-box’ was introduced,

21
from 41 percent to 43 percent. Such a pattern again indicates that other strategies to promote the
migration of intangibles must be more attractive.9
The lack of a significant response by U.S. MNCs to perform more R&D in low-tax locations
may suggest that the combined strategy of a hybrid and a favorable cost sharing agreement have
kept more R&D activity at home. Because the lack of response also could reflect a situation where
decisions on the location of real R&D activities are not very sensitive to tax factors, the evidence
here does not have an unambiguous interpretation. Studies by Hines (1993) and by Bloom, et al
(2002) do report significant response internationally in the way firms locate their R&D activities,
especially in the long run. To the extent that their findings can be generalized, the higher return to
domestic R&D possible with the strategies outlined above does make domestic locations more
attractive and increase U.S. activity.
IV. Returns to Intangibles and Affiliate Payments at the Firm Level
Prior research at the country level indicates that the location of property, plant and equipment
became more sensitive to host country tax rates in the 1990s than it was in the 1980s (Altshuler, et
al, 2001). Does a similar result hold for intangible capital in the more recent decade? Because
measuring intangible capital is not straightforward, this paper attempts to measure such an effect
9 These comparisons based on current R&D expenditures serve as a proxy for the stock of R&D or intellectual property (IP) located abroad, from which higher affiliate earnings might be expected. Given the general stability of the PPP-adjusted R&D expenditure shares in the NSF data, the proportion of the stock of intellectual property created by affiliates abroad is unlikely to have risen much. Even if the affiliate expenditure share had risen more substantially, the

22
through the examination of affiliate royalties, cost-sharing payments and earnings and profits, based
on firm-level, tax return data accessed at the U.S. Treasury Department. A cross section of all
foreign manufacturing affiliates in 1996 and 2002 provides the basis for comparing how the
determinants of these payments have changed across years when a major change in tax policy
occurred. This analysis does not suggest new theoretical approaches in explaining affiliate earnings
and repatriations. Rather, standard models in the literature are applied to the data available for the
two years identified above.10 The focus is not on the absolute size of the coefficients obtained, but
instead on the relative importance of variables that determine affiliate earnings and payments to
parents for royalties and for technical services.
In contrast to the country aggregates presented above, a particular advantage of the firm-specific
data is that it is possible to control for characteristics of the parent firm and the affiliate when
observing the affiliate’s transactions. Additionally, because parent firms report the earnings and
profits (E&P) of each affiliate, and the E&P calculation is based on income as defined in the U.S. tax
code, not the host country, making comparisons across countries is more straightforward in this data
set. Aside from the benefits of consistency, the E&P measure is an approximation of financial book
income. The Form 5471s filed for each affiliate and the related parent corporate tax return, Form
1120, are the basis for the firm level analysis.
With respect to important parent characteristics, a prime goal is to accurately represent the
intangible assets that a parent has developed. Expenditures for advertising and R&D are two
growth in the proportion of the IP stock would be slower. In the current volume, see the paper by McNeil for discussion of the appropriate rate of depreciation of intellectual property. 10 See, for example, Grubert (1998, 2001, 2003).
23
potentially important measures. The R&D measure comes from the research and experimentation
tax credit claimed by the U.S. parent. This credit is restricted to research expenditures made within
the United States, and the tax code specifies the ways in which such expenditures must differ from
routine product maintenance and production. The parent’s R&D intensity, measured as a share of
sales, indicates its ability to contribute valuable technology to the affiliate. This ratio, which is
based on parent sales rather than assets, is generally more appropriate because it avoids errors in
measurement caused by the valuation of assets at their historical book value.
In addition to the two parent characteristics that indicate the likely magnitude of intangible
assets, two dummy variables represent the age of the affiliate. Younger affiliates might be expected
to show a lower rate of return than those that are better established, although this influence of age
may be offset by more recent aggressive strategies to locate intangibles in attractive tax locations.
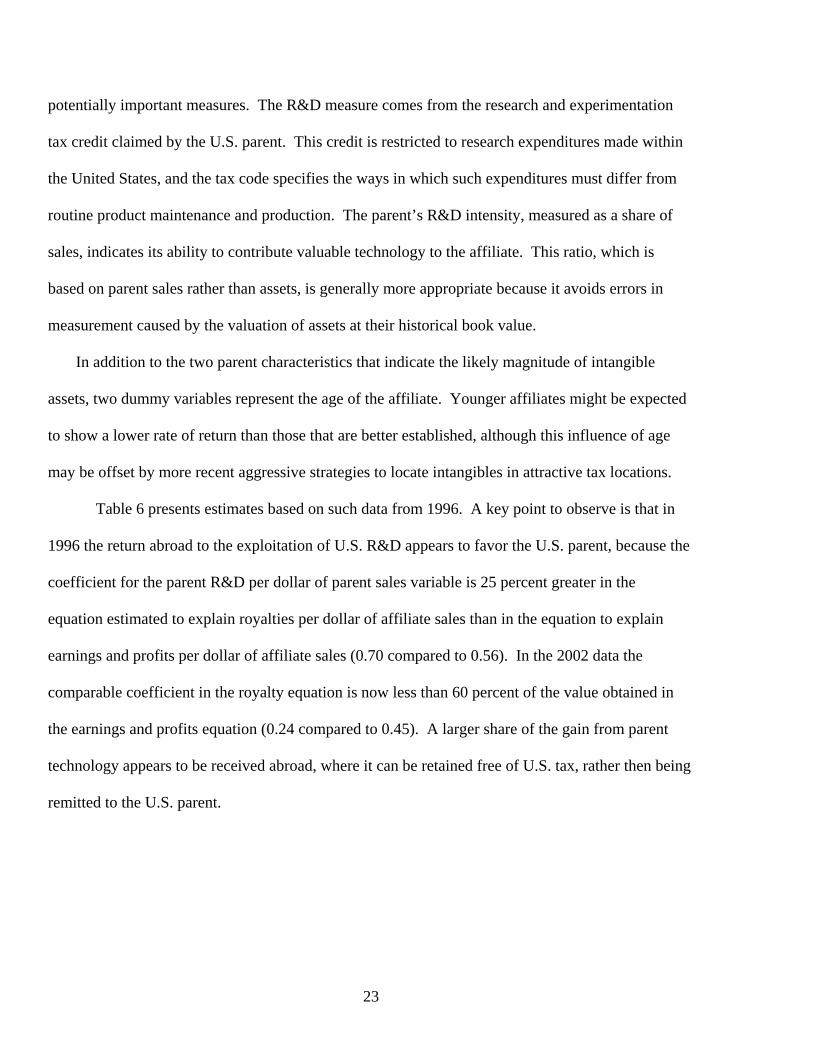
Table 6 presents estimates based on such data from 1996. A key point to observe is that in
1996 the return abroad to the exploitation of U.S. R&D appears to favor the U.S. parent, because the
coefficient for the parent R&D per dollar of parent sales variable is 25 percent greater in the
equation estimated to explain royalties per dollar of affiliate sales than in the equation to explain
earnings and profits per dollar of affiliate sales (0.70 compared to 0.56). In the 2002 data the
comparable coefficient in the royalty equation is now less than 60 percent of the value obtained in
the earnings and profits equation (0.24 compared to 0.45). A larger share of the gain from parent
technology appears to be received abroad, where it can be retained free of U.S. tax, rather then being
remitted to the U.S. parent.

24
Also noteworthy is the importance of the parent R&D variable in the regression for technical
service payments, an indicator of cost sharing agreements. If those payments are compared to
royalties, the coefficients in the 1996 estimates indicate twice as great a role in determining royalty
payments (0.70 compared to 0.35), whereas in 2002 those proportions had nearly reversed, with the
coefficient in the cost sharing equation now appearing much larger (0.24 compared to 0.41). While
that comparison may appear exaggerated because of the major change in importance of parent R&D
in the case of royalty payments, a similar comparison with the estimated coefficient from the
equation for affiliate earnings and profits shows the rising importance across these two years of cost
sharing payments to compensate a parent for its contribution of valuable intellectual property.
These results are consistent with what the hybrid plus cost sharing strategy suggests. A
potential concern may be that the simplified model used to estimate the relevant coefficients for the
three different dependent variables may be distorted by omitted variable bias.11 To address
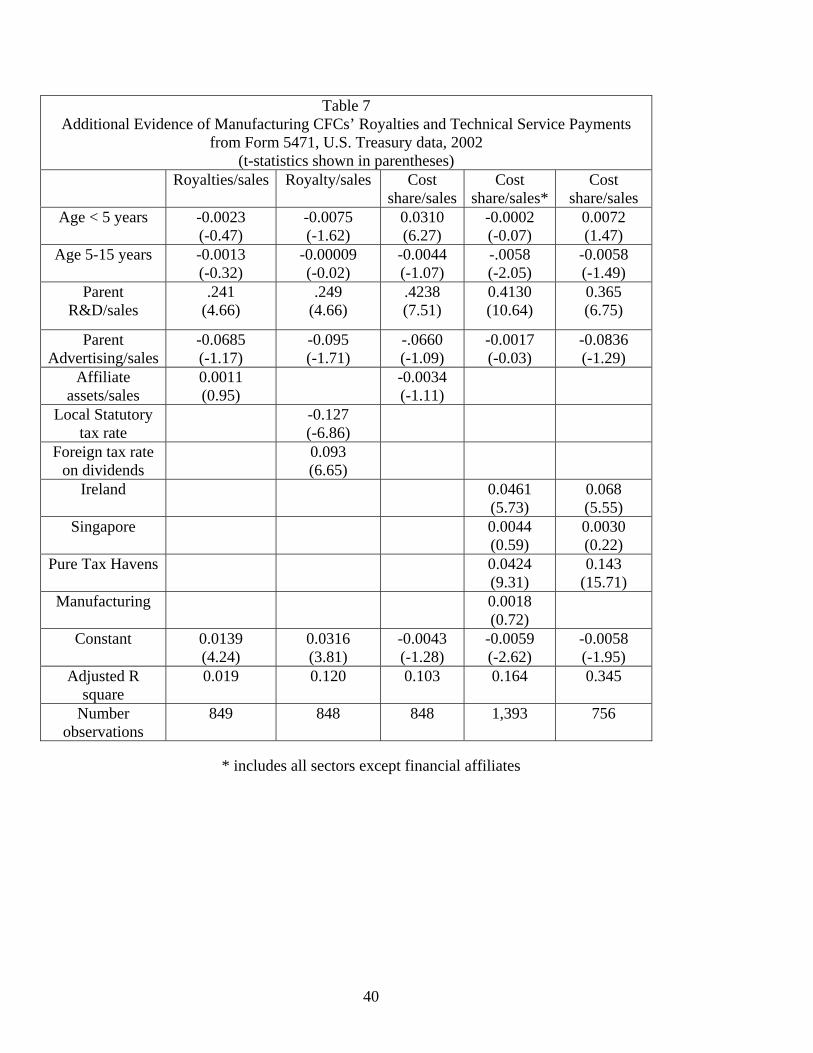
important aspects of that concern, consider the additional estimates reported in Table 7.
The royalty equation shown in column two includes two additional variables important in tax
planning strategies, the host country’s statutory tax rate and the parent’s overall foreign tax rate on
all dividend income received (as calculated from its Form 1118 to claim a foreign tax credit). The
role of the statutory rate is ambiguous. To review the comments made earlier in the paper, a parent
may have an incentive to pay high royalties from a high-tax host country to benefit from the fact that
11 Another concern may be the fact that many affiliates make no royalty payments, and these zero values may make OLS estimates less desirable than alternative approaches, such as tobit estimation or the Heckman two-step procedure. Because the proportion of affiliates that pay royalties to the U.S. parent is roughly the same in each year, 42 percent in 1996 and 45 percent in 2002, the extent of the bias from this truncation is likely to be comparable for the two years. The effect of the shrinkage from 1996 to 2002 in the number of manufacturing affiliates included in the sample is not clear.

25
they are a deductible expense. Yet, a parent may choose to locate valuable intangibles in low-tax
countries in order to benefit from the low taxation of its profits. Even if the affiliate pays less than
an arm’s length royalty, total royalty payments from a low-tax country may be higher. The
importance of such an effect in Ireland and Singapore, where actual production might occur, was
shown in the aggregated BEA data reported in Table 3A. Due to the existence of hybrids, the effect
also can occur in other low-tax locations, where an affiliate owns a portion of the intellectual
property that it licenses for use elsewhere. The outcome that more royalties will be paid from low-
tax countries is confirmed in the firm-specific data, too, because the coefficient on the statutory tax
rate is negative.
Firms are more likely to pay royalties when they can be shielded from taxation in the United
States. The foreign tax rate paid or deemed paid on dividends received from all foreign affiliates is a
potential indicator of a parent’s likelihood of having excess foreign tax credits that would eliminate a
residual tax due on repatriated royalties. Royalties, which are deductible abroad and only bear a
(usually low) withholding tax in the host country, can absorb excess credits originating with highly
taxed dividends. In 2000, 67 percent of royalties were shielded by credits. The positive coefficient
on this variable is consistent with tax optimizing behavior of U.S. firms, as a higher tax rate applied
on foreign dividends creates a larger shield to receive royalties.12 These tax planning variables are
12 While the tax rate on foreign dividends may not be pre-determined entirely independently of a firm’s planned royalty payments, it generally is the source of any excess foreign tax credits, and it is not affected by other adjustments a firm may make in determining its foreign tax credit position. Therefore, it is a better exogenous variable than the ex poste excess credit position of the parent.

26
of interest in their own right, but the key point to observe is that while adding them to this regression
does raise its overall explanatory power, the coefficient for parent R&D is hardly affected at all.
In the case of payments for technical services, a particularly noteworthy extension is to
consider whether certain host countries have been more likely to attract such activity. Country
dummies are included to represent low-tax countries where future product development could take
place (Ireland and Singapore), as well as tax havens where the most important motive would appear
to be the migration of existing intangibles (Bermuda, the Cayman Islands, and Luxembourg). While
such dummies were not significant in 1996, in 2002 the coefficients for Ireland and for Bermuda, the
Cayman Islands, and Luxembourg (the pure tax havens) both were quite significant and
quantitatively very large. The importance of Ireland substantiates the anecdotal evidence cited in the
introduction to the paper. The importance of the pure tax havens suggests that the amount of real
activity expected in the host country need not be great, and a shift of R&D activity out of the United
States need not be made in order to accomplish the migration of intangibles. Those patterns appear
both in the column four results based on all affiliates (not just those in manufacturing) and in the
column five results based on just those affiliates in manufacturing. In the latter case, however, the
role of activity in the pure tax havens is particularly large. Again, including the dummies adds to the
explanatory power of the estimated equation, but it has little effect on the importance of the parent
R&D variable.
V. Conclusions

27
Substantial migration of intangible assets from the United States to foreign countries appears to
have occurred over the last decade. That trend has been facilitated by the ability of U.S. firms to
create hybrid entities in their affiliates abroad and to reach favorable cost sharing agreements with
them. This strategy was particularly encouraged by the U.S. adoption of ‘check-the-box’ regulations
in 1997, which resulted in inter-subsidiary payments between affiliates incorporated in one foreign
country and their branches operating in another foreign country becoming invisible to the IRS.
An expected result is that there will be more rapid growth of earning and profits in foreign
affiliates relative to the royalties they pay to U.S. parents, as companies have an incentive to retain
profits abroad in low-tax countries where they can avoid any residual U.S. tax. Although that
pattern was observed in aggregate Treasury data over the 1996-2000 period, for the longer 1996-
2002 period royalties grew more rapidly than affiliate earnings and profits, a possible reflection of
the cyclical nature of earnings and profits. Payments by affiliates to U.S. parents for technical
services, as would be called for under cost sharing agreements, have increased rapidly even through
the longer 2002 observation period. In the process of certain affiliates becoming invisible to the
U.S. Treasury, affiliates in low-tax countries with little potential to produce goods and services now
claim major increases in their plant and equipment, presumably an indication of the capital held by
their branches in high-tax countries.
BEA data, which retain the identity of individual establishments even if they are part of a hybrid
structure, show more than double the growth of royalty payments from one affiliate to another
compared to the growth in royalty payments to the U.S. parent. Such a trend might not be so
surprising if there had been a major shift in R&D out of the United States to low-tax locations
28
abroad, but evidence from the BEA and from the NSF especially suggest that this has not occurred.
In fact, over the 1995-1999 period the NSF data show the traditional importance of high-tax OECD
locations has increased.
Analysis of firm-specific data from the U.S. Treasury demonstrates how changes in the returns to
parent R&D have shifted when years before ‘check-the-box’ was adopted are compared to
subsequent years. In regression analysis with 1996 tax returns, parent R&D contributed more to
royalty payments to U.S. parents than it did to affiliate earnings and profits. In 2002, however, the
importance of parent R&D had switched in these two regressions, with it now playing a larger role in
earnings and profits relative to royalties. That outcome is consistent with the tax avoidance
strategies explained in Section II. Also, the relative importance of cost sharing payments rose over
this period, relative to both royalties and earnings and profits. Cost sharing payments from affiliates
in Ireland and from pure tax havens (Bermuda, the Cayman Islands, and Luxembourg) are
particularly significant, both economically and statistically. Thus, the ability to carry out research
and development in the affiliate does not appear to be a key pre-requisite for the successful pursuit
of this strategy, and alleged pressures to relocate research and development activity abroad for tax
reasons have not been so compelling.
29
References
Altshuler, Rosanne, and Harry Grubert. “The Three parties in the Race to the Bottom: Host Countries, Home Countries, and Multinational Companies.” Mimeo. (March, 2005) Altshuler, Rosanne, Harry Grubert, and Scott Newlon. “Has U.S. Investment Abroad Become More Sensitive to Tax Rates?” International Taxation and Multinational Activity, Editor, James Hines, The University of Chicago Press: Chicago, 2001, pp. 9-32. Bloom, Nick, Griffith, Rachel and John Van Reenen. “Do R&D Tax Credits Work? Evidence from a Panel of Countries 1979-1997.” Journal of Public Economics 85 (1), 1-31 (July 2002). Borga, Maria and Raymond Mataloni. “Direct Investment Positions for 2000.” Survey of Current Business, July 2001, pp. 16-29. Grubert, Harry. “Taxes and the Division of Foreign Operating Earnings Among Royalties, Interest, Dividends and Retained Earnings.” Journal of Public Economics 68 No. 2 (May, 1998) Grubert, Harry. “Enacting Dividend Exemption and Tax Revenue.” National Tax Journal 54 No. 4 (December, 2001). Grubert, Harry. “Intangible Income, Intercompany Transactions, Income Shifting and the Choice of Location.” National Tax Journal 56 No. 1, Part 2 (March, 2003) Grubert, Harry, William Randolph, and Donald Rousslang. “Country and Multinational Company Responses to the Tax Reform Act of 1986. National Tax Journal 49 (3): 341-58 (1996). Hines, James. “On the Sensitivity of R&D to Delicate Tax Changes: The Tax Behavior of U.S. Multinationals in the 1980s.” Studies in International Taxation. Eds. A. Giovannini, G. Hubbard, and J. Slemrod. University of Chicago Press: Chicago, 1993, pp. 149-187. Koncz, Jennifer and Daniel Yorgason. “Direct Investment Positions for 2004.” Survey of Current Business, July 2005, pp. 40-53. McNeil, Lawrence. “International Trade and Economic Growth: A Methodlogy for Estimating Cross-Border R&D Spillovers.” CRIW Conference on International Service Flows, April 29, 2006. Mutti, John and Harry Grubert. “The Significance of International Tax Rules for Sourcing Income: the Relationship between Income Taxes and Trade Taxes.” Geography and Ownership as Bases for
30
Economic Accounting. Eds., R.E. Baldwin, R.E. Lipsey, and J.D. Richardson. University of Chicago Press: Chicago, 1998, pp. 259-280. Nutter, Sara. “Controlled Foreign Corporations, 1996.” Statistics of Income Bulletin, Spring 2001, pp.134-173. Office of Tax Policy, U.S. Treasury Department. The Deferral of Income Earned through U.S. Controlled Foreign Corporations. December 2000. Simpson, Glenn R. “Irish Subsidiary Lets Microsoft Slash Taxes in U.S. and Europe.” The Wall Street Journal, November 7, 2005, p.A1.
31
= disregarded entity from U.S. perspective
= consolidated company from U.S. point of view
U.S.
Parent
Figure 1 A Possible Hybrid Structure
CFC
In low-tax country
RoyaltyLicense Technology
High-tax Branch
= disregarded entity from U.S. perspective
= consolidated company from U.S. point of view
Technology
Cost Sharing Payment

32
Table 1
Tabulations from the 1996 and 2002 Form 5471 Files (in billions of dollars)
1996 2002
Growth as %
All CFCs
1. Total pre-tax earning and profits $160.8 $228.7 42
2. Earnings and profits in seven major low-tax countries (Ireland, Singapore, Bermuda, Cayman Islands, Netherlands, Luxembourg and Switzerland.)
36.5
82.5
126
3. Dividends received in the seven major low-tax countries 6.4 25.7 302
4. Earnings and profits in the seven major low-tax countries, less dividends received
30.1 56.8 89
5. Total tangible capital (net plant & equipment plus inventories) 767.5 1,119.5 46
6. Tangible capital in five major holding company low-tax countries (Bermuda, Cayman Islands, Netherlands, Luxembourg and Switzerland)
51.7
205.0
296
Top 7500 CFCs
7. Earnings and profits 139.8 196.8 41
8. Compensation for technical and management services (cost-sharing)
13.2
27.4
108
9. Royalties paid to parents 22.4 37.6 68 Source: Treasury tax files.

33
Table 2
Aspects of Affiliate Activity from BEA Benchmark Survey Measures(1989-94-99) and Financial and Operating Data /International Transactions Accounts (2003)
Measure 1989 1994 1999 2003
Growth, 89-94
Growth, 94-99
Growth, 99-03
1 Affiliate net income before tax 105.4 110.4 207.8 396.9 5% 88% 91% 2 Before-tax Direct Inv. Income 86.6 87.6 145.2 247.8 1% 66% 71% 3 Property, Plant & Equipment 248 350 593 730 41% 69% 23% 4 R&D 7.0 11.9 18.1 22.3 70% 52% 23% 5 Gross Product 320 404 566 705 26% 40% 25% 6 Employees 5,114 5,924 7,766 8,364 16% 31% 8% 7 Sales 1,020 1,436 2,219 2,906 41% 55% 31% 8 Royalties paid 12.5 22.0 35.8 76% 63% 9 Royalties to US parent 9.8 16.7 25.0 30.9 70% 50% 18%*
10 Royalties to Other Foreign Affiliate 1.5 2.6 6.0 73% 131% 11 Other Direct Investment 7.1 11.8 20.6 27.0 66% 75% 22%*
Services to Parent 12 Income/Sales (line2/line 7) 8.5 6.1 6.5 8.5 13 Royalties/(Royalties+Income)
Line9/(line 9 + line 2) 10.2 16.0 14.7 11.1
* Based on change in international transactions accounts entries for 1999 and 2003.

34
d denotes suppressed for disclosure reasons
Table 3A U.S. Parent Transactions with Majority-Owned Affiliates
1989 1994 1999 2003
Benchmark III.X.1
Benchmark III.Z.1
Benchmark, III.AA.1,
International Transactions Data
Royalties, received from affiliate 9,839 16,744 25,045 30,876Europe 6,373 10,627 d 16,784 France 993 1,428 1,777 1,639 Germany 1,166 2,019 1,950 1,873 Ireland 216 859 3,761 4,065 Netherlands 652 1,397 d 1,566 Switzerland 259 446 d 1,614 United Kingdom 1,487 1,873 2,270 2,739Asia 2,287 3,991 5,732 8,099 Japan 1,435 2,242 2,864 3,061 Singapore 158 542 1,150 2,385Canada 1,011 1,123 1,746 2,584Latin America and Other Western Hem. 138 929 d 3,167All Other 30 74 296 242 Royalties, paid to affiliate 54 368 2,200 2,550Europe 43 270 d 1,365 France 9 26 70 193 Germany 6 43 25 d Ireland d 4 16 21 Netherlands 0 20 d d UK 25 56 151 176Asia 7 58 170 d Japan 1 25 73 92 Singapore 1 2 19 dCanada 4 113 153Latin America and Other Western Hem. 0 0 d dAll Other 0 0 6 36

35
Table 3B
U.S. Parent Transactions with Majority-Owned Affiliates 1989 1994 1999 2003
Benchmark
III.X.4 Benchmark
III.Z.4 Benchmark,
III.AA.3 International
Transactions Data Other Direct Investment Services, received 7,101 11,780 20,600 26,960Europe 3,981 6,133 10,143 14,016 France 235 737 1,000 1,470 Germany 431 673 1,589 1,811 Ireland 121 316 738 1,299 Netherlands 412 1,236 1,246 1,473 Switzerland 166 510 506 872 United Kingdom 1,733 1,681 3,187 4,773Asia and Pacific 902 2,167 4,369 5,641 Japan 246 554 1,220 1,893 Singapore d 490 1,103 734Canada 1,590 2,455 3,507 3,691Latin America and Other Western Hem. 347 763 2,222 2,577All Other 281 372 359 1,035 Other Direct Investment Services, paid 3,810 6,477 14,939 18,605Europe 1,938 3,521 8,472 11,234 France 290 529 715 826 Germany 479 644 767 1,153 Ireland d 48 335 336 Netherlands 197 186 269 536 Switzerland 74 155 233 324 United Kingdom 600 1,514 4,915 6,263Asia and Pacific 1,085 1,753 3,262 4,065 Japan 881 1,119 765 1,301 Singapore d 152 1,025 458Canada 267 473 942 1,149Latin America and Other Western Hem. 292 457 1,129 1,811All Other 228 273 480 346
d denotes suppressed for disclosure reasons

36
Table 4 Royalties received and paid by Affiliates
1989, III.I.7
1994, III.J.7
1999, III.J.7
Royalties received Total 1,461 2,581 9,241 From affiliated persons 710 1,464 6,456 from US parent 54 368 2,200 from other foreign affiliates 656 1,096 4,256 Europe 462 799 d France 31 45 173 Germany 44 314 725 Ireland d d d Netherlands 66 76 105 Switzerland 87 87 106 UK 117 234 928 Asia 127 254 251 Japan d d 65 Singapore d d 8 From unaffiliated 750 1,116 2,785 Royalties paid Total 12,472 22,039 35,846 by Europe 7,871 14,708 19,949 by Ireland 469 1,496 4,640 by Asia 2,574 4,641 8,889 by Singapore 76 555 2,844 To affiliated persons 11,327 19,358 31,073 to US parent 9,839 16,744 25,045 to other for affiliates 1,488 2,615 6,029 by Europe 938 2,153 d France 188 118 242 Germany 130 d 725 Ireland 251 d 395 Netherlands 82 537 d UK 127 187 578 Asia 157 249 2,216 Japan 68 105 205 Singapore d 75 d To unaffiliated 1,145 2,681 4,773 d denotes suppressed for disclosure reasons

37
Table 5A BEA Measures of R&D Performed
By Parent and Majority Owned Affiliates 1994-2003
Line 1994 1999 2003
1 Parent 90,913 126,291 140,103 2 Affiliate 11,877 18,144 22,328 3 Ratio,
Line2/line 1 0.131 0.144 0.159
4 Ratio, adjusted for PPP 0.114 0.131 0.152
5 Six low-tax
countries 1,170 1,287 1,752 6 Ratio,
line 5/line 2 .099 .071 .078
7 Four major countries 7,509 10,352 11,168
8 Ratio, Line 7/line 2 .632 .571 .500
III.L.1 III.M.1 SCB Soures: III.J.1 III.J.1 Jul-05 Benchmark Benchmark p.22
Low-tax countries are Ireland, the Netherlands, Switzerland, Singapore, Bermuda, and the Cayman Islands. Major countries are France, Germany, the United Kingdom, and Japan.

38
NSF Measures of R&D Performed Abroad Relative to Domestic R&DNominal and Adjusted for Purchasing Power Parity
0.000
0.020
0.040
0.060
0.080
0.100
0.120
0.140
Nominal ratio, affiliate/parent 0.091 0.097 0.101 0.107 0.101 0.097 0.120 0.116 0.098 0.110 0.105 0.097 0.098
Adjusted real ratio 0.089 0.088 0.088 0.091 0.090 0.084 0.096 0.095 0.085 0.101 0.095 0.097 0.102
1989 1990 1991 1992 1993 1994 1995 1996 1997 1998 1999 2000 2001
Figure 2
Source: NSF, Research and Development in Industry, various issues, and IMF, real effective exchange rate for the United States, based on unit labor costs
Table 5B Performance of R&D Outside the United States by US Companies and Their Foreign Affiliates
Location 1995 1999 2001 Total 13,052 16,765 17,869
Four major countries 5,367 7,260 5,809 Ratio, line 2/line 1 .411 .433 .325
Source: NSF, Research and Development in Industry, Table A-12, various issues.

39
Table 6 Determinants of CFCs Profits, Royalties, and Technical Service Payments
from Form 5471, U.S. Treasury data (t-statistics shown in parentheses)
1996 2002 Profit/Sales Royalty/sales Cost
share/salesProfit/sales Royalty/sales Cost
share/salesAge < 5 years 0.0197
(2.27) -0.0163 (-4.23)
0.0042 (1.41)
-0.0004 (-0.03)
-0.0015 (-0.32)
0.0304 (6.17)
Age 5-15 years 0.0215 (3.77)
-0.0041 (-1.60)
-0.0015 (-0.78)
0.0455 (4.21)
-0.0007 (-0.17)
-0.0036 (-0.86)
Parent R&D/sales
0.556 (3.45)
0.697 (9.77)
0.346 (6.25)
0.4510 (3.06)
.236 (4.36)
.4100 (7.24)
Parent Advertising/sales
0.599 (9.06)
0.0581 (1.99)
0.0613 (2.71)
1.5530 (9.84)
-0.0637 (-1.10)
-.0654 (-1.08)
Constant .0585 (14.44)
0.0088 (4.92)
0.0015 (1.07)
0.0488 (5.87)
0.0151 (4.96)
-0.0055 (-1.71)
Adjusted R square
0.062 .062 0.028 0.150
0.018 0.096
Number observations
1,640 1,640 1,640 861 861 861
40
* includes all sectors except financial affiliates
Table 7 Additional Evidence of Manufacturing CFCs’ Royalties and Technical Service Payments
from Form 5471, U.S. Treasury data, 2002 (t-statistics shown in parentheses)
Royalties/sales Royalty/sales Cost share/sales
Cost share/sales*
Cost share/sales
Age < 5 years -0.0023 (-0.47)
-0.0075 (-1.62)
0.0310 (6.27)
-0.0002 (-0.07)
0.0072 (1.47)
Age 5-15 years -0.0013 (-0.32)
-0.00009 (-0.02)
-0.0044 (-1.07)
-.0058 (-2.05)
-0.0058 (-1.49)
Parent R&D/sales
.241 (4.66)
.249 (4.66)
.4238 (7.51)
0.4130 (10.64)
0.365 (6.75)
Parent Advertising/sales
-0.0685 (-1.17)
-0.095 (-1.71)
-.0660 (-1.09)
-0.0017 (-0.03)
-0.0836 (-1.29)
Affiliate assets/sales
0.0011 (0.95)
-0.0034 (-1.11)
Local Statutory tax rate
-0.127 (-6.86)
Foreign tax rate on dividends
0.093 (6.65)
Ireland
0.0461 (5.73)
0.068 (5.55)
Singapore 0.0044 (0.59)
0.0030 (0.22)
Pure Tax Havens 0.0424 (9.31)
0.143 (15.71)
Manufacturing 0.0018 (0.72)
Constant 0.0139 (4.24)
0.0316 (3.81)
-0.0043 (-1.28)
-0.0059 (-2.62)
-0.0058 (-1.95)
Adjusted R square
0.019 0.120 0.103 0.164
0.345
Number observations
849 848 848 1,393 756