the effect of text messaging alerts upon testicular self
TRANSCRIPT

University of Central Florida University of Central Florida
STARS STARS
HIM 1990-2015
2012
The effect of text messaging alerts upon testicular self-The effect of text messaging alerts upon testicular self-
examination (tse) adherence examination (tse) adherence
Lisa Soler University of Central Florida
Part of the Public Health Commons
Find similar works at: https://stars.library.ucf.edu/honorstheses1990-2015
University of Central Florida Libraries http://library.ucf.edu
This Open Access is brought to you for free and open access by STARS. It has been accepted for inclusion in HIM
1990-2015 by an authorized administrator of STARS. For more information, please contact [email protected].
Recommended Citation Recommended Citation Soler, Lisa, "The effect of text messaging alerts upon testicular self-examination (tse) adherence" (2012). HIM 1990-2015. 1373. https://stars.library.ucf.edu/honorstheses1990-2015/1373

THE EFFECT OF TEXT MESSAGING ALERTS UPON TESTICULAR
SELF-EXAMINATION (TSE) ADHERENCE
by
LISA M. SOLER, RN
A thesis submitted in partial fulfillment of the requirements for the Honors in the Major Program in Health Sciences
in the College of Health and Public Affairs and in The Burnett Honors College
at the University of Central Florida Orlando, Florida
Fall Term 2012
Thesis Chair: Dr. Michael J. Rovito

ii
ABSTRACT
Based on Kim Witte’s proven Extended Parallel Process
Model, a mobile communication system was developed in which men
were sent reminders about their health. This study focused on
reminding men about testicular self-examination (TSE), a
proactive behavior used to detect testicular cancer, through the
use of text messaging. A cohort of 75 men were recruited for
this study and placed into one of four groups. All participants
were provided with information concerning TSE and told to
perform the exam monthly; two of the four groups were sent
reminders via text message while the other two groups were told
once about the behavior. An original 30-item survey was used to
measure intention.
Proper data analysis could not be performed due to an
attrition rate of 71%. Nonetheless, a significant relationship
was observed between pre- and post-test adherence as reported by
the participants. In addition, the measurement tool was assessed
and determined to be useful in measuring intention to perform
TSE. Internal consistency measures were reported as 0.672 and
0.626, both of which would have been higher with a larger sample
size. While further research and analysis is recommended, this
study has laid a foundation for a way to communicate with young
men about their health.

iii
DEDICATION
For my parents, you gave me the ability to chase after my big
dreams because, “What is the purpose of a dream if you don’t
pursue it?” Thank you for your love and support and for never
discouraging my ambitious spirit.
For my friends who continuously encouraged me and never let me
quit. Thank you for believing in me when I didn’t believe in
myself.
For the Men’s Health Initiative, thank you for all the support
and help with this project.

iv
ACKNOWLEDGEMENTS
First and foremost I would like to express my sincere gratitude
to the committee that made this possible, Dr. Lindsay Neuberger
and Dr. Theodore Angelopoulos. Your time and input has been
extremely valuable for this project. I would like to especially
thank Dr. Michael J. Rovito, my thesis chair. Without your
guidance and continuous help, I would not have been able to do
this. Thank you for being a great mentor, professor, and friend.
You have pushed me more than anyone else because you have
believed in me more than anyone else and for that I am forever
grateful.
I would also like to give a special thanks to the Men’s Health
Initiative, particularly the TSE Team: Mike, Hannah, and
Adriana. Thank you for the support and help with designing the
pamphlet and making the seminar possible. I could not have done
this without you guys.

v
TABLE OF CONTENTS INTRODUCTION .................................................. 1
PREVALENCE ................................................... 1
COMMUNICATION BARRIER ........................................ 2
PURPOSE ...................................................... 3
SPECIFIC AIMS AND HYPOTHESIS .................................. 4
Research Question .......................................... 4
Specific Aims/Hypothesis ................................... 4
LITERATURE REVIEW .............................................. 6
TESTICULAR CANCER: RISING RISK ................................ 6
TESTICULAR CANCER SCREENING ................................... 7
A LACK OF KNOWLEDGE AND AWARENESS ............................. 7
TESTICULAR SELF EXAMINATION: GAPS IN RESEARCH ................. 9
CREATING MESSAGES ........................................... 11
Socially Mediated Messages ................................ 12
Extended Parallel Process Model (EPPM) .................... 13
High Threat/High Efficacy Message Design .................. 15
METHODOLOGY ................................................... 16
STUDY DESIGN ................................................ 16
Study Phases .............................................. 16
SAMPLE ...................................................... 19
Inclusion/Exclusion Criteria .............................. 21
Incentive/Compensation .................................... 22

vi
INSTRUMENTATION AND OUTCOME MEASURES ......................... 22
Phase 1 ................................................... 22
Phase 2 ................................................... 25
Message Delivery and Assessment ........................... 26
ANALYSIS PLAN ............................................... 28
RESULTS ....................................................... 30
DEMOGRAPHICS ................................................ 30
ANALYSIS OF VARIANCE ......................................... 31
ADDITIONAL ANALYSES ......................................... 37
T-tests ................................................... 37
Regression Analysis ....................................... 40
Reliability and Validity .................................. 41
Attrition Analysis ........................................ 42
DISCUSSION .................................................... 44
STUDY OVERVIEW .............................................. 44
SYSTEMS ANALYSIS ............................................ 46
INSTRUMENTATION ANALYSIS: RELIABILITY AND VALIDITY ........... 50
DISCUSSION OF HYPOTHESES AND OUTCOMES ........................ 53
LIMITATIONS ................................................. 54
RECOMMEDNATIONS FOR FUTURE RESEARCH .......................... 57
REFERENCES .................................................... 59
APPENDIX A: IRB APPROVAL FORM ................................. 64

vii
APPENDIX B: SCREENER SURVEY ................................... 66
APPENDIX C: PRIMARY SURVEY .................................... 68
APPENDIX D: SECONDARY SURVEY .................................. 71
APPENDIX E: TSE PAMPHLET ...................................... 73
APPENDIX F: ADVERTISEMENT FOR STUDY ........................... 75

viii
LIST OF FIGURES
FIGURE 1:STUDY DESIGN OUTLINE ................................19
FIGURE 2:PRE-TEST AGE DISTRIBUTION ...........................30
FIGURE 3:POST-TEST AGE DISTRIBUTION ..........................31
FIGURE 4:PRE-TEST CALCULATED MEANS (n=75) ....................32
FIGURE 5:TEST OF HOMOGENEITY OF VARIANCES ....................32
FIGURE 6:ANOVA ...............................................33
FIGURE 7:POST ATTRITION CALCULATE MEANS ......................34
FIGURE 8:COMPOSITE VARIABLES .................................36
FIGURE 9:INTER-ITEM CORRELATION MATRIX .......................35
FIGURE 10:PAIRED SAMPLES TEST: INCLUDING ALL GROUPS ..........37
FIGURE 11:PAIRED SAMPLES MEANS: EXCLUDING CONTROL GROUP 2 ....38
FIGURE 12:PAIRED SAMPLES TEST: EXCLUDING CONTROL GROUP 2 .....39
FIGURE 13:MEANS: ADHERENCE ...................................40
FIGURE 14:PAIRED T-TEST: ADHERENCE ...........................40
FIGURE 15:REGRESSION ANALYSIS PRE-TEST .......................41
FIGURE 16:REGRESSION ANALYSIS POST-TEST ......................41
FIGURE 17:BETA WEIGHTS .......................................41
FIGURE 18:CROCNBACH’S ALPHA BROKEN DOWN ......................42
FIGURE 19:COMPOSITE VARIABLE MEANS: PRE/POST ATTRITION .......43
FIGURE 20:SIGNIFICANCE OF VARIANCE FOR ATTRITION .............44

1
INTRODUCTION
PREVALENCE
Testicular cancer is the most prevalent form of cancer
among 15 to 35 year-old men, otherwise deemed the ‘at-risk‘
demographic (McCullagh, Lewis, & Marlow, 2005; Powe et al.,
2007). Although incidence rates are low compared to other
cancers (about 1-2% of all male cancers), they continue to
increase and are a leading cause of death among at-risk males
(Wynd, 2002; Brenner et al., 2003; Steadman & Quine, 2004;
Rudberg et al., 2005). The American Cancer Society estimated
that approximately 8000 new cases and 400 deaths resulted from
testicular cancer in 2010. Walschaerts et al. (2008) note that
incidence rates among at-risk men increased over 50% over the
past 40 years with the at-risk demographic demonstrating the
greatest overall increase. Due to the increase in number of
cases among at-risk males, there is a general trend in men’s
health advocacy work that focuses on prevention and persuading
men to take a more active role in conducting preventative
behaviors (e.g., testicular self-examination [TSE]).

2
COMMUNICATION BARRIER
Some influential variables upon male adherence of TSE
include knowledge/awareness (Rovito et al., 2011), fear (Gast &
Peak, 2010), and efficacy (McClenahan et al., 2007). ‘Perceived
masculinity’ has recently been garnering much attention as a
major barrier for men to perform TSE or comply to undergo a
colonoscopy and/or DRE (Vargas-Bustamante, 2010). Perceived
masculinity may assist in repressing emotions, failing to report
symptoms of disease, suppressing the desire to seek help from
others (Nicholas, 2000), increasing the hypersensitivity of men
in feeling ‘unmanly’, (MacNaughton, 2008) and thus possibly
lending to the trend of rising morbidity and mortality rates.
Creating effective messages to encourage health preventive
behaviors such as TSE is critical to early detection of
testicular cancer. One strategy used in health marketing with
mixed success has been the concept of ‘segmentation’ (Noar et
al., 2007) of a particular sample in smaller sub-samples. This
technique segments the sample into groups with a particular
variable in common, either demographic, socio-cultural, medical,
or any other identifier. However, it has not been used
effectively in promoting TSE in young men.
Most studies generally suggest that delivery of testicular
cancer preventative services must improve (Cronholm et al.,

3
2009), or that educators are enthusiastic about promoting
testicular cancer and TSE information (Evans, Simons, & Wardle,
2010), but most studies do not indicate their methods of
information dissemination, let alone any comprehensive plan to
test message effectiveness. Consequently, this overwhelming body
of descriptive research leaves much of the field virtually
unobserved in terms of actual behavioral manipulation through
intervention research.
PURPOSE
This thesis aims to showcase the effectiveness of text
messaging as a means to promote TSE among men. Using Steadman
and Quine’s (2004) ‘implementation intentions’ research on the
effectiveness of reminder systems and TSE adherence, as well as
Rovito et al.’s, (2011) assertion that men prefer private
communication on TSE promotion than public; private messages are
to be used as the reminder system and will be designed based on
Witte’s (1992) Extended Parallel Process Model. Using Witte’s
(1992) model, the messages will induce a threat while providing
high efficacy to induce danger control as opposed to fear.
Further, we hypothesize that the use of text messaging will
increase TSE adherence among men. This private, reoccurring
reminder system will encourage men to conduct the procedure
according to the recommendation of once-a-month performance, at

4
minimum. This study aims to test the accuracy and consistency of
original instrumentation through pilot testing of the tool.
SPECIFIC AIMS AND HYPOTHESIS
Research Question
Can the use of socially mediated messages (specifically, text
messaging) promote adherence to TSE among college age men?
Specific Aims/Hypothesis
SA1: To develop a communication system, using mHealth
principles, which will be used to deliver monthly TSE
informational reminders tailored specifically to college men.
SA2: To carry out a pilot study to test accuracy and consistency
of original instrumentation which will be of further use in the
assessment of a mobile communication system used to deliver
monthly TSE informational reminders tailored specifically to
college age men.
H1: Those men receiving monthly text messages will report
more frequent TSE adherence than men who received only
baseline communication.
H2: Those men receiving bi-weekly text messages will report
more frequent TSE adherence then men that received only
baseline communication.

5
H3: Those men receiving bi-weekly text messages will report
more frequent TSE adherence than men who received monthly
text messages.
H4: Those men who attend the informational seminar
(baseline communication) will report more frequent TSE
adherence than men who received no information regarding
TSE regardless of message reminders.

6
LITERATURE REVIEW
TESTICULAR CANCER: RISING RISK
Testicular cancer is the most prevalent form of cancer
among men aged 15-35 (Barling & Lehmann, 1999). Incidence rates
are low compared to other cancers (about 1-2% of all male
cancers), yet continue to increase and serve as a leading cause
of death among 15-54 year-olds (Khadra & Oakeshott, 2002). The
American Cancer Society (2008) estimates 8,090 new cases and 380
deaths will result from testicular cancer. Incidence rates among
at-risk men increased 50%+ over the past 40 years with males
aged 15-35 years demonstrating the greatest overall increase
(Walschaerts et al., 2008). Due to the aggressive nature of the
disease, researchers state that early detection is of utmost
importance to overall survival (Tani, 2002; Cox et al., 2005).
The lack of testicular cancer information dissemination limits
prevention behaviors (Lechner et al., 2002), contributing to a
50% diagnosis rate post-diaspora from the testes (Trumbo, 2004),
and thus increasing mortality rates from the disease. One of the
most significant concerns with testicular cancer is ‘years of
potential life loss’ as those most affected are under 35 years
of age (Walschaerts et al., 2008).

7
TESTICULAR CANCER SCREENING
Primary health care providers chiefly perform testicular
cancer screenings, but there is little evidence demonstrating
long-term sustainability (or adherence) of prevention behaviors
(Cook, 2000; Hergenroeder, Kozinetz, & Kelder, 2003; Kleier,
2004; Ward et al., 2005; Horowitz et al., 2006). This fact has
held true throughout the past few decades. For example, Vaz,
Best, and Davis (1988) indicated that males were not properly
counseled by their physicians about testicular cancer risks and
prevention techniques, noting that only 2% of males report
receiving information on how to properly conduct TSE. Nearly 20
years later, Rudberg et al., (2005) state that only 5 out of 727
(0.6%) males report learning TSE from their primary care
physician (PCP), thereby demonstrating that little has been done
to promote testicular cancer screening during PCP visits. The
authors discuss the role that school nurses and even military
examinations can possibly serve as alternate sources for
testicular cancer screenings outside of their PCP. But, again,
there is very little evidence clearly demonstrating long-term
adherence.
A LACK OF KNOWLEDGE AND AWARENESS
There is a reported history of a wide TSE knowledge gap
among men in terms of TSE awareness. Barling and Lehmann (1999)

8
note that 83% of pre-test participants did not perform the
recommended once-a-month TSE. Best et al. (1996) state that
although up to 31% of at-risk males indicate knowledge of TSE
only 18% report doing TSE. Wardle et al. (1994) report less
than 15% of participating males had knowledge of TSE with only
3% reporting regular practice. Katz et al. (1995) note that 9%
of surveyed males knew of their risk to develop testicular
cancer with 19% reporting regular TSE practice. Ward et al.
(2005) indicate that only 10.3% of their sample group performed
TSE regularly. One particular deviation from the norm is
McClenahan et al.’s (2007) claim that 61% of participants
reported that they knew how to perform TSE; however, this is
offset by the fact that only approximately 10% reported
practicing the recommended once-a-month exam. These trends are
repeated across most existing TSE studies (Tani, 2002).
Blesch (1986), Katz et al. (1995), Tani (2002), and
Singleton (2008) highlight the reasons men have not practiced
TSE over the past 25 years. Lack of knowledge about testicular
cancer risks and how to perform TSE, lack of perceived severity
of testicular cancer, lack of perceived susceptibility to
testicular cancer, forgetfulness, lack of time, fear,
embarrassment, and upholding their maleness are all listed as
top reasons why TSE is not performed among the vast majority of

9
men. Although most men do not practice TSE, for any of the
aforementioned reasons, Wynd (2002) indicates that 9 out of 10
cases of testicular cancer are self-discovered. However, a
primary issue with testicular cancer is that many of these cases
are found in advanced stages. Wynd (2002) note that 15% to 20%
of testicular tumors have metastasized by the time they
discovered. Men are discovering testicular lumps by themselves,
but well after Stage I cancer and commonly once it has spread to
other organs.
TESTICULAR SELF EXAMINATION: GAPS IN RESEARCH
Men’s Health Scholars suggest that irregular screenings
from primary health care providers promotes self-screening for
detecting testicular cancer due to its convenience, privacy, and
potential for repeated performance (Horowitz, Reinert, &
Caldamone, 2006; Kleier, 2004; Hergenroeder, Kozinetz, & Kelder,
2003; Wynd, 2002). The American Cancer Society (2008) recommends
that men should conduct TSE at least once a month due to the
rapid nature of testicular carcinoma growth. Although some
researchers, including the US Preventative Task Force Service,
question TSE effectiveness due to possible increases in anxiety
and a lack of clinical trials demonstrating its mortality
reduction-powers (Goldbloom, 1985; Dearnaley, Huddart, &
Horwich, 2001), the majority of men’s health promotional

10
research calls for increased publicity of TSE. However, TSE is
seldom taught and rarely practiced (Rudberg, Nilsson, Wikblad, &
Carlsson, 2005). Even if men are educated on TSE, long-term
compliance, as stated previously, has not been observed.
Existing interventions fail to report long-term,
sustainable TSE performance among participating males even when
exposed to promotional messages (Steadman & Quine, 2004;
McCullagh, Lewis & Marlow, 2005). A lack of sustainable TSE
performance post-intervention indicates either a content
communication flaw or a contextual theoretical weakness in how
the specific communication was conveyed. Although Lance
Armstrong’s high-profile testicular cancer case brought much
attention to TSE and the importance of screening, thus producing
an increase in knowledge and awareness, actual TSE behaviors did
not show any significant increase (Trumbo, 2004; Ward et al.,
2005). This suggests that content delivery, not the content
itself, may be the source of the problem in terms of consistent,
long-term TSE adherence.
The failure of men to consistently perform TSE post-
intervention may suggest weaknesses in the study designs and
their theoretical foundations. Although some studies claim
initial success increasing knowledge and intention to perform
TSE (Lechner et al., 2002; McCullagh, Lewis & Marlow, 2005),

11
there are no significant trends in TSE sustainability. This
lends to the argument that there are significant factors in TSE
promotional message design not emphasized and properly tested
for their influence upon behaviors. Robertson et al. (2008)
indicate that larger-scaled, more comprehensive studies are
needed to effectively test promotional campaigns.
CREATING MESSAGES
Creating effective messages to encourage health preventive
behaviors, such as TSE, is critical to early detection of
testicular cancer. One strategy used in health marketing with
mixed success has been the concept of segmentation (Noar et al.,
2007), which segments the sample into groups with a particular
variable in common, though it has not been used effectively in
promoting TSE in young men. Most studies generally suggest that
delivery of testicular cancer preventative services must improve
(e.g., Cronholm et al., 2009), or that educators are
enthusiastic about promoting testicular cancer and TSE
information (e.g., Evans, Simons, & Wardle, 2010), but most
studies do not indicate their methods of information
dissemination, let alone any comprehensive plan to test message
effectiveness. Consequently, this overwhelming body of
descriptive research leaves much of the field virtually

12
unobserved in terms of actual behavioral manipulation,
particularly long-term behavioral change.
Socially Mediated Messages
With new advancements in social media, the barriers
limiting communication are disintegrating. Social media plays an
ever-influential role in how people correspond with each other.
Health providers, as well as patients, are now using social
media as a means to instantaneously communicate regarding
personal health care (Tucker, 2011).
The dearth of studies linking testicular cancer prevention
to mobile phone technology and eventually social media produces
a need to investigate the possible relationship. Research
suggests mobile phone technology, as a means for health behavior
modification is an effective method of communicating behavior
change (Cole-Lewis & Kershaw, 2010). Further, Cole-Lewis and
Kershaw (2010) suggest that 96% of countries in the world have
mobile phone networks, which includes the use of text messaging
services. As almost every phone model is capable of executing
text services, and a vast majority of the population has access
to said technology, a cost effective and convenient mode of
reaching a large audience is created.
This technology is also user-friendly, meaning all
populations and subsequent subgroups may be reached with ease.

13
Tucker (2011) has shown that a large audience of people can
indeed be efficiently and rapidly communicated with in emergent
and non-emergent situations. This principle may be effectively
applied to using text messaging to reach a large population of
men concerning their health.
Further, Cole-Lewis and Kershaw’s research focuses on the
use of text messaging due to the emergence and popularity of
Mobile Health (mHealth). Eight of the twelve studies in the
Cole-Lewis and Kershaw (2010) review correlate a short-term
effect in text message use and behavior change, none of which
are specific to testicular cancer. While current information is
limited, research supports that mobile phone technology and
social media is in fact changing the way information is
received. Thus, the use of text messaging as an intervention in
health behavior change is equitable. In addition, current
information warrants that further studies be conducted in other
fields, including cancer awareness. This study aims to determine
the effectiveness of communicating with patients about
testicular health through text messaging.
Extended Parallel Process Model (EPPM)
Witte’s (1992) EPPM advocates both high threat and high
efficacy messages as the most effective in altering behaviors
and decision-making processes. The EPPM stresses that fear

14
(emotion) leads to message rejection and perceived threat and
efficacy (cognition) leads to message acceptance. Further,
individuals faced with a threat perform either danger control
(adaptive) or fear control (maladaptive). Danger control seeks
to reduce the risk whereas fear control seeks to reduce the
perceived risk. In order for an individual to perform adaptive
health behavior decisions, an individual must perceive the
availability of an opportunity to reduce the risk (response
efficacy) as well as the self-efficacy to perform risk reduction
behaviors. If both are not present, the individual chooses fear
control methods, which promotes maladaptive health behaviors.
This model has been used extensively over the years with very
successful results in producing behavioral changes (Witte et
al., 1998; Witte, 1998; Witte, 1992; Roberto et al., 2000;
Murray-Johnson et al., 2004; Gore & Bracken, 2005).
This study will approach the EPPM in two ways using the
message reminders. One approach is to address response efficacy,
which is the availability of an opportunity to reduce the risk,
while the other is to address operational efficacy, which we
have defined as the ability of the procedure to identify the
risk. We recognize with TSE that operational efficacy is indeed
limited. Previous literature acknowledges the fact that
awareness of the procedure as well as the individuals’ ability

15
to conduct the procedure properly is limited (Rovito et al.,
2011). To limit this, we will address the ability to properly
perform TSE at the seminar and all men will be given literature
for future reference. In addition, proper procedure will be
reinforced in the text message reminders.
High Threat/High Efficacy Message Design
The EPPM suggests that high threat (severity and
vulnerability) and high efficacy (response and self-efficacy)
messages are most influential in changing health behaviors.
Therefore, abiding by message design theory (Robertson et al.,
2008; Sethares & Elliot, 2004; Myers et al., 2007; Hirst et al.,
1997), both experimental groups will need to have a high
threat/high efficacy message designed specifically for them in
order to achieve behavior change. Although Morman (2000) found
significant increases in intention to perform TSE among men
exposed to the EPPM’s recommendations of high threat/high
efficacy messages, there have been no published reports of using
messages tailored to personality promoting long-term TSE
adherence.

16
METHODOLOGY
STUDY DESIGN
A quasi-experimental design was utilized to test high
threat/high efficacy messages (Witte, 1992) promoting long-term
TSE adherence among a cohort of University of Central Florida
males via text messaging. This study expands upon Morman’s
(2000) success in increasing intention to perform TSE via high
threat/high efficacy messages. This study’s aim was to
understand how participant males perceive threat-driven messages
surrounding testicular cancer and TSE via text messaging, and if
these messages are powerful enough to alter the decision-making
process by repetition of the message over the course of the
month. Essentially, the research would demonstrate that a
private reminder-system for messages would increase the
likelihood of men to perform TSE. We aimed to assess said
system’s effectiveness.
Study Phases
There were two phases to the study design (see Figure 1):
sampling/baseline communication phase (Phase 1) and experimental
phase (Phase 2).
Phase 1 included the sampling and randomization of 75
participants and their subsequent placement into one of four
experimental groups. We required that selected, willing

17
participants offer their phone number to take part in the study.
Three of the four test groups were asked to participate in an
hour-long educational seminar, hosted by the Men’s Health
Initiative, regarding TSE. The test group left out of the
seminar served as the control group. The seminar was offered at
three different times to provide flexibility and ample
opportunity for participants to attend. Prior to the
presentation, an original primary survey was distributed on site
to the three test groups attending, which participants completed
before participating in the seminar. The control group also
received this primary survey, it was taken in person at the time
which they received their educational materials. Pamphlets
designed from the American Cancer Society’s recommendation on
TSE were given as the educational material for participants to
keep.
Attention was drawn to the top of the primary survey where
a four-digit number ID would be written. The ID number was the
last four digits of each individual’s phone number. Participants
were asked to use this ID as the only form of personal
identification, as this was to maintain their anonymity.
Additionally, each participant was asked to submit this ID
number with any survey submitted either online or in person, or

18
with any communication with the research team, should it be
necessary.
Phase 1 also consisted of a health message design sub-
phase, which took place after the educational seminar. Said
messages were designed within the parameters of the Extended
Parallel Process Model (Witte, 1992), and were employed during
Phase 2 of the study. This project was seeking to increase
actual TSE performance and long-term intention to continue the
behavior via the persuasive nature of the tailored message
content. As a result, message content included elements of High
Threat/High Efficacy variables as outlined by Witte (1992),
which indicates that effective messages induce a damage control
response from the recipient.
Phase 2 included three months of intervention
implementation. It was during this time that text messages were
sent reminding the test subjects in experimental groups one and
two to perform their TSE for that given month. Text messages
were sent from a study specific e-mail address which only the
co-PI had access to. Additionally, at months 2 and 3, secondary
surveys were administered to only the two experimental groups to
assess TSE adherence.
Month 3 concluded with a second distribution of the primary
survey to all four test groups. The primary survey given at this

19
Figure 1
time was altered to include an item intended to assess long-term
intention to continue adherence in performing TSE. Participants
were asked for their ID number in order to gain access to the
survey.
SAMPLE
A convenience sample of 75 University of Central Florida
male students aged 18-35 [the at-risk population (Singleton,
2000; McClenahan, 2007)] were sought out to participate in an
experiment to determine if text message reminders would increase
short and long-term TSE adherence. This population is deemed
underserved, as the research on such a population within this
topic is relatively limited, with no known studies focused on
Study Design Outline
Phase I – Sampling/Baseline Communication
• Screener Survey/Sampling • Baseline Communication/Brochure Distribution • Message Design • Randomization of Groups • Primary Survey-all groups
Phase II – Experimentation
• Initiate text messages to experimental groups
• Secondary survey at months 2 and 3- experimental groups only
• Primary survey at month 3- all groups

20
the use of mobile messaging to men promoting health and
wellness.
The sample was recruited from campus-wide announcements on
posted flyers*See Appendix E for Example*, recruitment outside of the
Student Union, presentations at the fraternity houses, and
classroom solicitation to take part in the study. The classrooms
chosen were those general education classes held in large
lectures halls and contained all classification levels of
students in order to draw from the most representative sample of
university males. The PI and co-PI conducted recruitment and
scheduling. Permission was obtained from faculty to make in-
class announcements to enroll males into the study. Further, the
PI and co-PI recruited participants in the university recreation
and wellness center as well as the health center.
A screener survey was given in order to exclude those who
currently perform habitual monthly TSE or have been diagnosed
with, or treated for, testicular cancer. Of the men considered
eligible to partake in the survey, 75 met the requirements to
participate. Eligible individuals were randomly sorted into four
groups using simple random assignment: (a) control group 1
[terminal communication group, n=13], (b) control group 2 [TSE
uneducated group, n = 16], (c) experimental group 1 [monthly
text group, n = 23], and (d) experimental group 2 [bi-weekly

21
text group, n = 22]. Assuming 20% attrition, at the end of Phase
2 sample sizes were expected to be approximately n=12 for each
control group and n=20 for each experimental group.
Inclusion/Exclusion Criteria
Race, socioeconomic status, and other personal
characteristics did not factor into the sampling of the male
students, as the study was seeking to test message effectiveness
of TSE promotion regardless of socio-demographic variables.
However, those males previously diagnosed and/or treated for
testicular cancer, as well as those individual males who are
knowledgeable about testicular cancer and/or perform TSE
regularly, were screened from the study due to possible
knowledge, awareness, or attitudinal differences. Such
differences could bring about response biases between groups.
Participation in the study was contingent upon access to a
reliable mobile device that can receive text messages for the
duration of the study. Participants were allowed to use phones
or any device that the individual readily carries with them and
is capable of receiving text messages which the individual
readily accesses as means of receiving the monthly reminders.

22
Incentive/Compensation
A meal was provided at the information session (baseline
communication) in order to incentivize participants to attend
the presentation. At the study’s conclusion, participants who
submitted responses to all surveys were placed in a drawing
using assigned identification numbers to receive a prize of $100
in Knights Cash. The number linking the individual mobile
numbers to the surveys tracked survey completion (discussed in
depth in Instrumentation and Outcome Measures) and provided a
way to maintain anonymity of the winning participant.
INSTRUMENTATION AND OUTCOME MEASURES
Phase 1
A 4-item screener survey was implemented to assess each
candidate’s knowledge of testicular cancer and TSE adherence and
was designed to exclude those who are not qualified to
participate in the study. A 30-item primary survey was then given
to those individuals who were eligible to participate in the
study. A 5-point Likert scale was used to answer all items in
the survey with 1=Strongly Disagree and 5=Strongly Agree. This
survey was administered prior to information dissemination at
the educational seminar. The primary survey was used as a
preliminary review of control group 1, control group 2,

23
experimental group 1, and experimental group 2 that served as a
means of comparison of those selected to evaluate the changes in
response throughout the entire study.
The primary survey gauges the participants’ knowledge and
awareness of testicular cancer and TSE, while also determining
their locus of control (I-Control) in regards to personal
health. The participants’ perceived vulnerability in contracting
testicular cancer is assessed in the primary survey, along with
personal thoughts on the value of health promotion regarding
TSE, and the intentions of the participant in actually
performing TSE monthly. *See Appendix C for copy of survey*
Five key variables, described above, were identified from
the primary survey and used to assess the success of the
intervention (developed communication system). The first
variable, Knowledge, was included to measure general awareness
about the topic, which is basic for measurement tools such as
this. The I-Control variable, which is a derivation of locus of
control, stems from ‘attitudes’, a variable described in the
Theory of Planned Behavior. It has been noted in this theory as
being the most predictive of behavior; it is an outcome
expectancy measurement. The Value of Health Promotion (VHP)
variable is closely linked to I-Control in that it is also an
outcome expectancy measurement, although in this sense an

24
external locus of control would be determinant of the variable.
In the Health Belief Model it has been shown that perceived
vulnerability is indicative of a person’s behavior. This along
with the EPPM’s ‘threat’ component produced the basis for the
Vulnerability variable measured using this tool. All the
previously mentioned variables serve to predict the dependent
variable, Intention. This is consistent throughout the various
health theories; multiple variables lead to the prediction of an
individual’s intention to perform a behavior.
Baseline communication
At baseline communication, three information sessions were
held on the university’s campus to educate all participants
equally. Seminars consisted of American Cancer Society
recommended material and a lecture informing participants of
testicular cancer and proper self-examination technique.
Anecdotal data collected at information sessions and
quantitative data from initial primary survey distribution was
the basis of text message design. Men’s health and health
communication experts were used to assist in the content and
construct validity of the material used and aided in designing
the seminar.

25
Message design sub-phase
Witte’s (1992) high threat high efficacy theory was
employed in text message design. Participants were reminded of
the gravity of testicular cancer (high threat) while prompted to
perform self-examination, which is key in identification and
eradication of the disease (response efficacy and self-
efficacy). High threat is central in message design to inculcate
the need of long-term behavior modification. The threat will not
induce fear as this may cause a maladaptive (fear control)
response in participants and lead to rejection of the message.
Threat was presented in such a way to produce danger control
that will lead to risk reduction behaviors (TSE). Both
experimental groups 1 and 2 received the same message, which was
sent once to group 1 and twice to group 2 per month. By
including both a threat and a resolution participants are given
reason to self-examine and modify current behaviors. In sending
effective messages, which cause participants to consistently
perform TSE, it is believed that long-term habits will form.
Phase 2
This phase included implementation of a 3-item secondary
survey*See Appendix D for copy of survey* which is intended to assess the
effectiveness of the communication via text message. The
secondary survey consisted of three items that pertain to the

26
delivery of the messages. Only participants in experimental
groups 1 and 2 received the secondary survey, which was given at
months two and three. At the end of Phase 2, the primary survey
was given again at month three to all four participant groups.
Further, one question asking whether or not the participants
have performed TSE in the last month was added to the end of the
primary survey. This question is not present in the baseline
assessment of the participants due to the screening process of
only including men in the study who have never performed, or do
not regularly perform (0-2 times within 6 months), TSE. This
question will be measured dichotomously.
Message Delivery and Assessment
Text messages were 160 characters, approximately 2
sentences, and included elements from Witte’s (1992) EPPM that
emphasizes the use of a high threat/high efficacy design. Due to
the time limitations, the dissemination of text messages was
carried out every ten days for the experimental group 2.
Messages were sent out on the weeks that included at minimum one
day of the desired month. This allowed for data to be collected
for three months total. Experimental group 2 received two text
messages, as opposed to experimental group 1 which received one
message, in order to evaluate the effect of message reminder
frequency. It is proposed that increased frequency of reminders

27
will enhance adherence, which if true, will lend credence to the
‘Cues to Action’ construct of the Health Belief Model.
An email account was created to serve as the source of the
text messages sent to both experimental groups through Phase 2.
Access to the account was granted to the co-PI; the account only
functioned for this study’s purposes. The screener survey and
the survey given at baseline communication seminar were paper
surveys; all other surveys were collected electronically via
Qualtrics. An e-mail containing a link to the survey was sent to
all participants in order to gain access the online version of
the document. Participants provided their assigned participant
ID number in the survey as opposed to names; this provided a
method of tracking completion of all requirements.
Phase 2 concluded with all participant groups retaking the
primary survey at month three to assess any changes in their
perceptions of TSE of the key variables from pre- to post-test
and to determine long-term adherence to TSE recommendations.
Also, all participant groups were asked if they performed TSE
within the past month. The secondary survey would not be
applicable here since the control groups did not receive text
message reminders at any point in the experiment. Therefore, a
simple question of whether or not participants performed TSE in

28
the last month was asked at the end of the primary survey when
taken at month three.
ANALYSIS PLAN
Analysis of variance (ANOVA) and t-tests were conducted to
determine pre- and post-test differences for changes within
participant groups for mean differences in survey responses to
key dependent variables: knowledge and awareness of testicular
cancer and TSE, locus of control in regards to personal health
(I-Control), participant perceived vulnerability in contracting
testicular cancer, the value of health promotion regarding TSE,
and the intentions of the participant in actually performing
monthly TSE.
The dependent variables particularly of importance are
intention to perform TSE and self-reported TSE performance.
There are four measurements of intention to perform TSE (items
27-30 of the primary survey). A mean was calculated for each
participant group for these four items to give each individual
an aggregate intention score. This mean was calculated at
baseline and at month three for each participant group. Actual
performance of TSE was assessed at months two and three for the
experimental groups and at month three for the control groups.
TSE adherence was measured as a binary variable based upon
the responses to the question of whether or not participants

29
performed TSE in the past month, in month two (both experimental
groups), and at month three (all participant groups). Stepwise
linear regression modeling was used to multivariately assess
predictors of intent to be screened among the salient variables
associated with testicular cancer and TSE including: knowledge
and awareness, perceived vulnerability, value of health
promotion, and locus of control (I-Control).
The study employed variance analysis using the Test of
Homogeneity of Variances. Significance of the Levene Statistic
was used to determine if the assumption of equal variances holds
true for the study. Additionally, regression analysis was done
to determine predictability of the Intention variable.
Cronbach’s alpha was then used to determine internal consistency
of the instrument used, values of .85 or higher would be
accepted to determine consistency.

30
RESULTS
DEMOGRAPHICS
Of the participants recruited in age range 18-35, a total
of 75 men met all conditions necessary to participate in the
study. The distribution of ages, as seen in Figure 2, indicates
a positive skew with a mean age of 20. The observation is
expected of a college population where the majority of students
are under the age of 25. This distribution falls within the at
risk population defined for the study.
Figure 2
At the conclusion of the study a total of 22 participants
responded to the final survey; an attrition rate of 71% was
0!2!4!6!8!
10!12!14!16!18!20!22!24!26!28!30!32!34!36!38!
18-19! 20-21! 22-23! 25 & up!
# of Participants!
Age!
Pre-Test Age Distribution!

31
observed. The distribution of ages at the end of the study is
seen in Figure 3, showing the largest rate of dropouts coming
from the 18-19 age group. Dropout rate for this age group was
86% as opposed to the 50-60% attrition rate noted in the other
three age groups. With a more normal distribution, the mean age
calculated post-test was 20.8.
Figure 3
ANALYSIS OF VARIANCE
The 30-item questionnaire was categorized into five
composite variables: Knowledge, I-Control, Perceived Value of
Health Promotion, Vulnerability, and Intention to Perform TSE.
Descriptive statistics (Figure 4) of the five variables from the
0!2!4!6!8!
10!12!14!16!18!20!22!24!26!28!30!32!34!36!38!
18-19! 20-21! 22-23! 25 & up!
# of Participants!
Ages!
Post-Test Age Distribution!

32
Figure 4
Figure 5
pre-test group containing all study participants (n=75)
indicates means ranging from 5.047 to 8.140 with Knowledge as
the lowest mean and I-Control as the highest.
Pre-test Calculated Means (n=75)
N Range Minimum Maximum Mean Std.
Deviation
I-Control 75 4.500 5.500 10.000 8.14000 1.143746
Knowledge 75 4.725 3.250 7.975 5.04700 .914698
Vulnerability 75 6.75 3.25 10.00 7.0375 1.93166
VHP 75 4.50 4.94 9.44 7.6159 .99524
Intention 75 4.50 3.25 7.75 5.9650 1.07594
Valid N 75
Pre-test variance analysis (Figure 5) was done on the above
mean calculations to test for homogeneity. The calculated Levene
Statistic values showed no significance in any of the variables.
Significance values ranged from 0.071 to 0.624, all indicating
insignificance in the variability of observed means, validate
the equal variances assumption for this study.
Test of Homogeneity of Variances
Levene Statistic df1 df2 Sig.
IControl .590 3 71 .624
Knowledge .852 3 71 .470
Vulnerability 1.343 3 71 .267
VHP 1.090 3 71 .359
Intention 2.445 3 71 .071

33
Figure 6
Further, a means test was also conducted pre-test on the
cohort prior to accounting for attrition, n=75. An ANOVA test
was conducted for this study as another means of ensuring
homogeneity of groups on the 5 composite variables. Figure 6
indicates no significance in the variance of scores. This
finding additionally supports equal variances, in accordance
with the previously mentioned analysis.
Means calculations (Figure 7) of pre-test scores from the
participants remaining, after attrition was accounted for
ANOVA
Sum of
Squares
df Mean
Square
F Sig.
IControl
Between Groups 9.268 3 3.089 2.506 .066
Within Groups 87.535 71 1.233
Total 96.803 74
Knowledge
Between Groups 2.181 3 .727 .864 .464
Within Groups 59.733 71 .841
Total 61.914 74
Vulnerability
Between Groups 23.293 3 7.764 2.180 .098
Within Groups 252.824 71 3.561
Total 276.117 74
VHP
Between Groups 3.553 3 1.184 1.206 .314
Within Groups 69.744 71 .982
Total 73.297 74
Intention
Between Groups 2.578 3 .859 .734 .535
Within Groups 83.088 71 1.170
Total 85.666 74

34
Figure 7
(n=22), indicates a range from 5.060 to 8.108 with Knowledge as
the lowest mean and I-Control as the highest mean. These values
remain consistent with those noted in the pre-test group prior
to attrition. Figure 7 also includes post-test scores observed
from the cohort after attrition. This displays a range of scores
from 6.594 to 8.350 with Knowledge as the lowest calculation and
Value of Health Promotion representing the highest, the I-
Control variable being 8.338.
Post Attrition Calculated Means
N Mean (Pre-Test)
Mean (Post-Test)
I-Control 22 8.10795 8.33807
Knowledge 22 5.06023 6.59432
Vulnerability 22 6.72727 7.92898
VHP 22 7.78409 8.35085
Intention 22 6.0625 7.36136
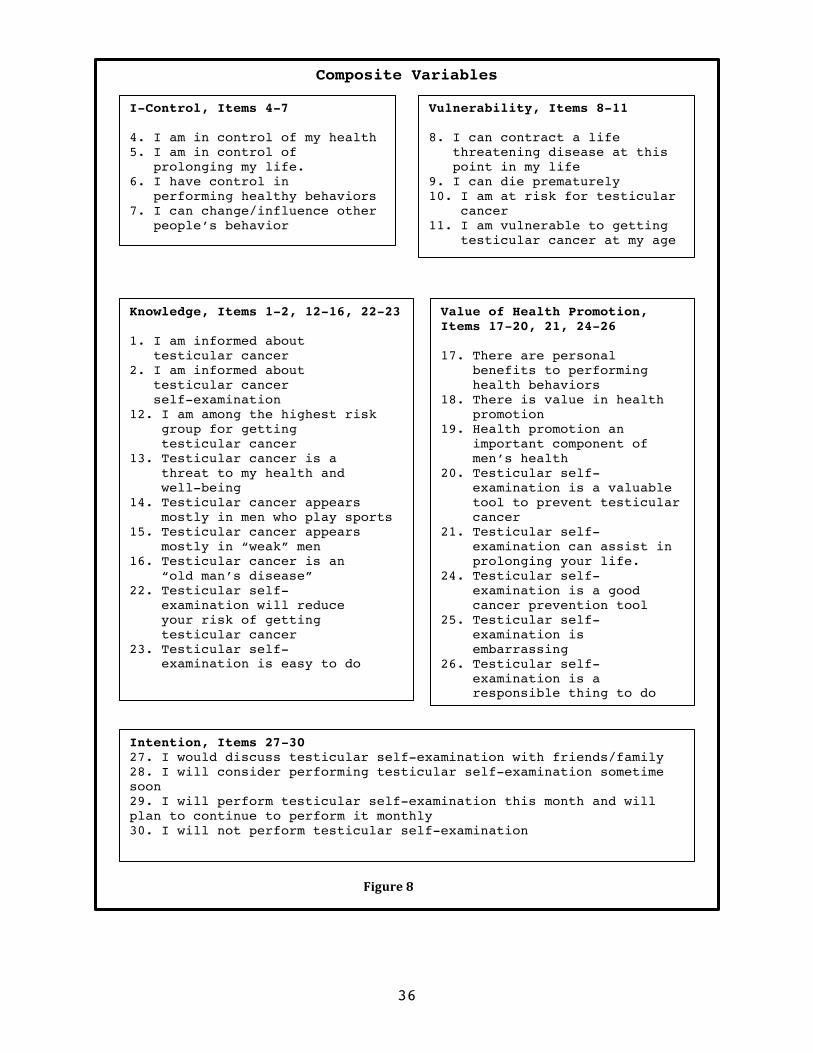
Composite variables were determined a priori using concepts
stemming from theories developed in accordance with the panel of
experts. An Inter-Item Correlation Matrix was carried out to
confirm the a priori development of variables. Figure 8 shows
which groups of questions from the survey compose each variable.
The Correlation Matrix (Figure 9) indicates no strong
correlations exist between variables, supporting the designation

35
of items to constitute each variable. It should be noted that at
the second distribution of the survey an item was added to
measure intended long-term adherence. The long-term adherence
question, Item 31, was added to the intention variable, which
stated, “I will continue to perform testicular self-examination
because of this study.”
IControl Knowledge Vulnerability VHP Intention
IControl 1.000 -.063 .323 .315 .202 Knowledge -.063 1.000 .260 .215 .300
Vulnerability .323 .260 1.000 .053 .273
VHP .315 .215 .053 1.000 .159 Intention .202 .300 .273 .159 1.000
Inter-Item Correlation Matrix
Figure 9
36
Composite Variables
I-Control, Items 4-7
4. I am in control of my health 5. I am in control of prolonging my life. 6. I have control in performing healthy behaviors 7. I can change/influence other people’s behavior
Vulnerability, Items 8-11
8. I can contract a life threatening disease at this point in my life 9. I can die prematurely 10. I am at risk for testicular cancer 11. I am vulnerable to getting testicular cancer at my age
Knowledge, Items 1-2, 12-16, 22-23
1. I am informed about testicular cancer 2. I am informed about testicular cancer self-examination 12. I am among the highest risk group for getting testicular cancer 13. Testicular cancer is a threat to my health and well-being 14. Testicular cancer appears mostly in men who play sports 15. Testicular cancer appears mostly in “weak” men 16. Testicular cancer is an “old man’s disease” 22. Testicular self- examination will reduce your risk of getting testicular cancer 23. Testicular self- examination is easy to do
Value of Health Promotion, Items 17-20, 21, 24-26 17. There are personal benefits to performing health behaviors 18. There is value in health promotion 19. Health promotion an important component of men’s health 20. Testicular self- examination is a valuable tool to prevent testicular cancer 21. Testicular self- examination can assist in prolonging your life. 24. Testicular self- examination is a good cancer prevention tool 25. Testicular self- examination is embarrassing 26. Testicular self- examination is a responsible thing to do
Intention, Items 27-30 27. I would discuss testicular self-examination with friends/family 28. I will consider performing testicular self-examination sometime soon 29. I will perform testicular self-examination this month and will plan to continue to perform it monthly 30. I will not perform testicular self-examination
Figure 8

37
ADDITIONAL ANALYSES
T-tests
A paired samples t-test was conducted to compare means
between pre- and post-test groups (n=22). This sample size
includes all study groups, the only consistent study-related
factor being the informational pamphlet. Figure 7 contains the
means calculated and used in the paired samples test. T test
analysis (Figure 10) indicates a significant difference (p<.05)
in all variables except I-Control, which reported a significance
value of .289.
Paired Samples Test: Including All Groups
Paired Differences t df Sig.
(2-
tailed) Mean Std.
Deviat
ion
Std.
Error
Mean
95% Confidence
Interval
Lower Upper
Pair 1 IControl -
IControlP -.23011 .99204 .21150 -.66996 .20973 -1.088 21 .289
Pair 2 Knowledge -
KnowledgeP -1.53409 1.43590 .30614 -2.17073 -.89745 -5.011 21 .000
Pair 3 Vulnerability -
VulnerabilityP -1.20170 1.39193 .29676 -1.81885 -.58456 -4.049 21 .001
Pair 4 VHP - VHPP -.56676 .87427 .18640 -.95439 -.17913 -3.041 21 .006
Pair 5 Intention -
IntentionP -1.29886 1.14924 .24502 -1.80841 -.78932 -5.301 21 .000
Figure 10

38
An additional paired samples test was conducted on the
post-attrition sample. This sample excluded control group 2, the
true control group, because this was the only group that did not
include the exposure to the seminar. Remaining study groups
(n=17 overall) received both the baseline communication seminar
and the educational pamphlet. Figure 11 demonstrates means (pre-
and post-test) calculated for the participants receiving both
interventions.
T test analysis of above calculated means indicates
significant differences in all variables except I-Control, as
previously observed. It was noted that the significance value of
the I-control variable decreased from the aforementioned value
Paired Samples Means: Excluding Control Group 2
Mean N Std.
Deviation
Std. Error
Mean
Pair
1
IControl 7.9816 17 1.37868 .33438
IControlP 8.3787 17 .99203 .24060
Pair
2
Knowledge 5.1029 17 .83633 .20284
KnowledgeP 6.6912 17 .63022 .15285
Pair
3
Vulnerability 6.5257 17 1.77026 .42935
VulnerabilityP 7.7169 17 2.07125 .50235
Pair
4
VHP 7.6783 17 .85744 .20796
VHPP 8.3456 17 .75652 .18348
Pair
5
Intention 6.1618 17 1.07530 .26080
IntentionP 7.4588 17 .92690 .22481
Figure 11

39
of .298 to .144, approaching the accepted value of p<.05 (see
Figure 12).
Paired Samples Test: Excluding Control Group 2
Paired Differences t df Sig.
(2-
tailed) Mean Std.
Deviat
ion
Std.
Error
Mean
95% Confidence
Interval
Lower Upper
Pair
1
IControl -
IControlP -.39706 1.06661 .25869 -.94546 .15134 -1.535 16 .144
Pair
2
Knowledge -
KnowledgeP -1.58824 1.25141 .30351 -2.23165 -.94482 -5.233 16 .000
Pair
3
Vulnerability -
VulnerabilityP -1.19118 1.57704 .38249 -2.00201 -.38034 -3.114 16 .007
Pair
4 VHP - VHPP -.66728 .87980 .21338 -1.11963 -.21493 -3.127 16 .006
Pair
5
Intention -
IntentionP -1.29706 1.16311 .28210 -1.89507 -.69904 -4.598 16 .000
Paired samples testing was also carried out on reported
adherence to TSE recommendations. Values from the frequency
reported on the screener survey were compared to values reported
at the end of the study (see figure 13). The t-test indicates a
significant relationship (p<.001) exists in TSE frequency post
intervention (seminar, pamphlet, and text reminders) as noted in
Figure 14.
Figure 12

40
Regression Analysis
A regression analysis was conducted with Intention to
perform testicular self-examination serving as the dependent
variable and the four remaining variables (I-Control, Knowledge,
Vulnerability, and Value of Health Promotion) as the independent
variables. One regression run was done on the total pre-test
sample (n=75) and another on the post-test sample where
attrition resulted in a sample size of 22. The adjusted variance
explained value (r2) for the pre-test group was .158 and the
significance value was .016 (see Figure 15). For the post-test
regression, r2 was .232 and a significance value of .314 was
reported (see Figure 16).
Mean N Std.
Deviation
Std. Error
Mean
Pair
1
PreTestScreen .7273 22 1.51757 .32355
TSEsinceSept 3.7727 22 2.50584 .53425
Paired Differences t df Sig. (2-
tailed) Mean Std.
Deviation
Std. Error
Mean
95% Confidence
Interval
Lower Upper
-3.04545 2.05814 .43880 -3.95798 -2.13293 -6.940 21 .000
Figure 13
Figure 14
Means: Adherence
Paired T-testing: Adherence

41
Beta weights of the four independent variables range from .051 to .306, as seen in Figure 17. Of the four variables, Knowledge was shown to be most predictive of the dependent variable, Intention with the highest weight (.306).
R R Square
Adjusted R Square
Std. Error of the Estimate
R Square Change
F Change
Sig. F Change
.398a .158 .110 1.01494 .158 3.291 .016
R R Square
Adjusted R Square
Std. Error of the Estimate
R Square Change
F Change
Sig. F Change
.482a .232 .052 .86900 .232 1.287 .314
Beta Weights
Model Unstandardiz
ed
Coefficients
Standa
rdized
Coeffi
cients
t
Sig.
95.0% Confidence
Interval for B
B Std.
Error
Beta Lower
Bound
Upper
Bound
1
(Constant) 2.258 1.217 1.855 .068 -.169 4.685
IControl .145 .118 .154 1.221 .226 -.092 .381
Knowledge .306 .141 .260 2.172 .033 .025 .587
Vulnerability .085 .068 .153 1.248 .216 -.051 .221
VHP .051 .130 .047 .390 .698 -.209 .310
Regression Analysis Pre-Test
Figure 15
Regression Analysis Post-Test
Figure 16
Figure 17

42
Reliability and Validity
Content validity was assessed using a panel of experts in
the Men’s Health field. Dr. Michael J. Rovito from University of
Central Florida served as the primary expert with consultations
from Dr. James E. Leone and Dr. Frank Johnson, both experts in
the field of men’s health.
Cronbach’s alpha internal consistency calculation was
utilized to assess reliability of the measurement tool. Pre- and
post-test analysis results were reported as 0.672 and 0.626
respectively. Both calculations were based on the 30 survey
items; the added item for the second distribution of the survey
not included in the second computation.
Internal consistency measures were also taken for each
variable individually. Figure 18 shows the results of these
calculations with vulnerability obtaining the highest score.
Variable Cronbach’s Alpha N items
I-Control .667 4
Knowledge .317 10
Vulnerability .774 4
VHP .559 8
Intention .630 3
Cronbach’s Alpha Broken Down
Figure 18

43
Attrition Analysis
A final analysis was carried out to compare means between
those participants that dropped out of the study and those that
did not. Groups were coded as 0 representing the participants
that dropped out (n=53) and 1 representing the remaining
participants (n=22). Figure 19 contains values for the
calculated means for each composite variable of said groups.
Significance of variances of the reported means was
calculated using Levene’s Test. Results of this test indicate no
significant variance in the way participants responded. A t-test
analysis was also done to compare group means. This also
Composite Variables Means: Pre/Post Attrition
POST N Mean Std.
Deviatio
n
Std. Error
Mean
IControl 0 53 8.15330 1.105233 .151815
1 22 8.10795 1.258333 .268277
Knowledge 0 53 5.04151 .962680 .132234
1 22 5.06023 .808204 .172310
Vulnerability 0 53 7.1663 2.03101 .27898
1 22 6.7273 1.67078 .35621
VHP 0 53 7.5461 1.05882 .14544
1 22 7.7841 .81996 .17482
Intention 0 53 5.9245 1.08033 .14840
1 22 6.0625 1.08408 .23113
Figure 19

44
indicated that a significant difference did not exist between
those participants that dropped out of the study and those that
did not. It can be stated that equal variance was observed
between all participants, supported by the described tests (see
Figure 20).
Levene's Test
for Equality
of Variances
F Sig. t df Sig.
(2-
tailed)
Mean
Differen
ce
Std. Error
Difference
IControl
Equal variances
assumed .852 .359 .155 73 .877 .045347 .292007
Equal variances
not assumed
.147 35.148 .884 .045347 .308254
Knowledge
Equal variances
assumed .320 .573 -.080 73 .936 -.018718 .233558
Equal variances
not assumed
-.086 46.505 .932 -.018718 .217202
Vulnerability
Equal variances
assumed 1.888 .174 .895 73 .374 .43900 .49057
Equal variances
not assumed
.970 47.453 .337 .43900 .45246
VHP
Equal variances
assumed 2.871 .094 -.942 73 .349 -.23802 .25260
Equal variances
not assumed
-1.047 50.384 .300 -.23802 .22741
Intention
Equal variances
assumed .478 .491 -.503 73 .616 -.13797 .27427
Equal variances
not assumed
-.502 39.193 .618 -.13797 .27466
Significance of Variance for Attrition
Figure 20

45
DISCUSSION
STUDY OVERVIEW
This study overall aimed to accomplish two goals: show the
effectiveness of mobile phone technology to promote TSE and
increase adherence, and to obtain reliability and validity
measures for original instrumentation in the form of a 30-item
questionnaire. The dependent variable was Intention to perform
TSE and the independent variables were I-Control, Knowledge,
Vulnerability, and Value of Health Promotion. Interventions
included an educational seminar, an informational pamphlet, and
the use of text reminders. As a result of this study, an
educational seminar modeled by Witte’s (1992) theory, which
includes high threat messages followed by high efficacy
interventions, was developed and tested for effectiveness.
The independent and dependent variables were determined
from the questionnaire and tested using a series of within group
means tests and paired t-test. Cronbach’s alpha was used to test
internal consistency using both the pre-test results and the
post-test results obtained after attrition. In addition, the
internal consistency measurement was broken down to indicate the
strongest variables. Variance was ensured and analyzed using the
homogeneity of variance test followed by an ANOVA. Finally, a
regression analysis and paired samples testing was carried out

46
to evaluate the predictability for and actual reported adherence
to the Intention variable.
Resultant findings cannot confirm or strongly support the
hypotheses due to the unfavorable sample size resulting from
attrition. While correlations cannot be made, some positive
trends were noted in support of Hypothesis 1 and overall
adherence to performance of self-examination. These findings,
along with some new observations, lend cause for further
investigation of this ‘at risk’ demographic.
SYSTEMS ANALYSIS
The primary intent of this study was to develop a
technologically advanced communication system to deliver monthly
TSE reminders. Convenience for participants and privacy of
messages were key in the development of said system. Text
messaging was the outlet used for delivery of reminders and
Witte’s (1992) theory was instrumental in the development of the
messages delivered to participants.
Dissemination of text message reminders was carried out
using e-mail to text through a Yahoo e-mail account created for
the study. This method of message delivery was successful in
maintaining organization. Groups were created to organize
contacts according to study groups allowing for timely
distribution of messages. While message confirmation was not

47
possible, ‘failure of delivery’ notices were received in which
the participant’s phone number was identified. If failure
notices were received a copy of the original message was sent
only to the participant(s) mentioned. A confirmation of message
receipt would have been beneficial in tracking which
participants dropped out due to lack of interest, as it could
not be known for sure that participants were receiving the
communication.
Kim Witte’s (1992) high threat/high efficacy theory was
employed in message delivery at baseline communication, the
educational seminar. Men were educated on the risk and severity
of testicular cancer (high threat). For example, it was
emphasized that testicular cancer is a leading cause of death in
15-54 year old men, it is one of the fastest growing cancers,
and it spreads to other organs much quicker than most other
cancers. After high threat was established, an effective
solution was presented (high efficacy). By performing self-
examination monthly, abnormalities are noted in a timely manner
and attention is given to the matter in the form of further
evaluation by a physician. This may lead to early detection of a
tumor, which can be treated. It was emphasized that early
detection is key in making this cancer curable. The seminar

48
concluded with proper technique and resources for participants
to refer to, all part of the high efficacy component.
Message design was also based on Witte’s (1992) model,
although, the high efficacy element was emphasized. Using the e-
mail to text feature limited messages to 160 characters
therefore; emphasis was given to reminding participants using
the high efficacy solutions presented at the seminar.
Participants were encouraged to address any concern that may
come of the examination by referring to the resources given.
Proper means testing was impossible to carry out due to the
high attrition rate leading to the final sample size of 22 men.
Although, paired samples means testing was conducted and
indicated significance in all variables except the I-Control
variable (refer to Figures 10 and 12). The first test was run on
all groups, which shared in common the informational pamphlet*See
Appendix E for copy*, while the second test assessed only the groups
receiving the baseline communication. Significant scores
indicate effectiveness of the intervention; although it cannot
be stated specifically which intervention was most successful,
nor can we isolate what specifically was successful about the
intervention. A larger sample size would allow for proper
between group analyses that would pinpoint the intervention
responsible for the variance.

49
Another component of the communication system was the use
of e-mail to deliver any surveys after the initial primary
survey given at baseline communication. Qualtrics was the online
program used to create the surveys and disperse them to
participants. Advantages to using this program include
convenience for participants and accurate record keeping for the
investigator. The software was simple and included many features
beneficial for data collection. Also, participant identity was
effectively kept confidential with no identifying information
provided aside from an IP address. A question was added to track
participants, they were asked to provide the study ID determined
at initiation into the study.
A major limitation to both components of this system is the
loss to follow up. Participants could become careless and simply
ignore any communication pertaining to the study. It is possible
that this partly accounts for the observed attrition rate of
71%. Another observation in the attrition rate is related to
ages. It was noted that 30 of the original 35 participants in
the 18-19 age group dropped out of the study, seen in the age
distribution graphs (Figures 2 and 3). This is an attrition rate
of 85% for that age group which accounts for 57% of the overall
attrition. This supports previous findings from Bell, Powers,
and Young (2006). In their study, Bell, Powers, and Young
50
investigated causes of attrition in a longitudinal study using a
cohort of women of ages ranging from 18-75. The younger age
group (18-23) had the highest attrition rate of the three groups
identified. Social factors, such as lack of knowledge of
importance of research, were the main cause of attrition in this
group. It is possible for the cohort in this study to have
similar reasons for dropping out.
Overall the system has the potential to be effective.
Results of this study indicate some positive trends that should
be retested and further evaluated. Figures 10-14 illustrate the
significance observed from the pre- and post-test analysis of
the composite variables indicating a significant difference in
the variables, except IControl, due to the interventions
implemented by this study. Most importantly, Figures 13 and 14
indicate a strong significant relationship (p<.001) in the
reported adherence to TSE due to the study. It was also
interesting to note that attrition of experimental group 1
(receiving 1 text reminder a month) was 74%, while the rate for
experimental group 2 (receiving 2 text reminders a month) was
59%. This could indicate that a more constant reminder sustained
the interest of the participants. A study done using a larger
sample size (achievable through oversampling) is warranted and

51
is strongly believed to result in stronger relationships and
more conclusive evidence.
INSTRUMENTATION ANALYSIS: RELIABILITY AND VALIDITY
An equally important goal of this study was to obtain high
reliability and validity scores for the original
instrumentation. Through validation, said instrumentation
becomes an utilizable means of measuring the effectiveness of
the private reminder system. This pilot study was aiming to
obtain a reliability assessment of .85 or greater on all
surveys/scales in order to establish consistency and ensure
measurement continuity.
The key variables used to test the study’s hypotheses were
assessed for internal and content validity. Dr. Michael J.
Rovito of the University of Central Florida, Dr. James E. Leone
of Bridgewater State University, and Dr. Frank Johnson of Temple
University served as the panel of experts used to institute a
content validity check of the primary survey. An Inter-Item
Correlation Matrix (see Figure 9) served to further assess the
key variables. Because no significant correlations existed
between the variables it can be concluded that they were
independently measuring the intended component.
Two Homogeneity of Variances tests were conducted (Figures
5 and 20) to ensure that the assumption of equal variance was

52
valid. The tests were done on the pre- and post-attrition
samples, both indicating no significance and therefore
validating the assumption. The ANOVA test (Figure 6) further
supported the equal variances assumption, as no significance was
noted between the groups. As a result, normal distribution of
the all variables was assumed.
Reliability measures were conducted using Cronbach’s alpha
measure of internal consistency. The pre- and post-attrition
values were reported as .672 and .626 respectively with
vulnerability accounting for the variable with the highest
consistency and knowledge the variable with the lowest. While
this does not fulfill the previously determined acceptable value
of .85, it can be stated with confidence that a larger sample
size would increase the value to meet the set criteria. This is
concluded based on the difference noted in the reported
Cronbach’s alpha scores, the larger score was based on the n=75
sample size before attrition.
Regression analysis done on the pre-test group of n=75
resulted in an r2 value of .158, indicating a 16% predictive
value of the independent variables for intention. The regression
analysis run on the post-test group of n=22 indicated an r2 value
of .232; therefor, there was a 23% accountability of the
questionnaire for predicting intention. Both internal

53
consistency measures indicate that intention was predictive.
Beta weights indicate the Knowledge variable as being the most
predictive although all the variables carried very low beta
weights. Had there been a larger sample size, this predictive
value would have been much higher.
DISCUSSION OF HYPOTHESES AND OUTCOMES
Attrition rates limited proper means testing of the
hypothesis, between group comparisons were not possible with a
sample size of 22. Nonetheless, overall TSE adherence was
measured and analyzed using a paired samples means test. The
pre-test average for reported TSE adherence was .73 while the
post-test average was 3.77; Figure 14 illustrates this is a
significant difference as p< .001. The question asked about TSE
adherence over a range of months (3); therefore it can be stated
that men increased adherence from less than once a month, before
the study, to at least once a month at the end of the study.
While testing could not be carried out for Hypothesis 2,
the attrition rates of the groups compared in this hypothesis
are noteworthy. Experimental group 1, which received one
reminder a month, experienced an attrition rate of 74% compared
to an attrition rate of 50% in experimental group 2, receiving 2
text messages a month. Due to small group sizes, comparison of
actual TSE adherence could not be measured, although it could be

54
stated that an increase interest in remaining in the study would
indicate increased intentions to perform TSE as well.
This study suggests further investigation is necessary in
the field relating to mobile phone outlets as the message
delivery interface. It would be necessary to continue
investigation on this topic to assess whether higher attrition
rates are attributed to the communication system.
As a result of this study, an effective tool was created to
measure behavior intention in relation to TSE. Positive trends
indicate the tool is likely to have good reliability and
internal consistency, while a panel of experts attributed to the
determination of content validity. This tool could be further
implemented in studies assessing a social media communication
system to deliver monthly TSE informational reminders.
A possible finding of this study is that convenience is not
advantageous in this age cohort. Also, it is possible that
texting reminders may have been too personal for participants.
This lends credence to use of social media outlets to distribute
reminders. It is possible that by including a social network men
are more apt to remain connected and take an active role in
their health.

55
LIMITATIONS
Convenience sampling limits the generalizability of the
study findings while self reported survey data introduces
possible participant bias. Additional convenience of sampling
was introduced in control group 2, as these were personally
known individuals, which then snowballed using word of mouth.
This may also introduce a knowledge bias because a large portion
of this group is likely to be health related majors.
The use of original instrumentation introduces limitations
in the reliability and validity of the survey and a potential
source of error to the study. For this reason it was necessary
to carry out this pilot study and test said instruments.
Readability will not be an issue as all participants are college
students and are assumed to have the ability to read at a
college level. However, a knowledge bias may result due to the
overly educated population being used in the experiment.
Additional limitations in the instrumentation arise from
the conversion of the 5-point scale to a 10-point scale. The 5-
point Likert type scale was used for the convenience of
participants, while for data analysis purposes a 10-point scale
is more useful. Dawes’ (2008) scale conversion was used for this
study. In his own study, Dawes demonstrates that very little
difference exists in the means calculated from conversions,

56
which validates the use of a simple transformation. The scale
conversion used for this study is as follows: 1=1, 2=3.25,
3=5.5, 4=7.75, and 5=10. For future studies, it is recommended
to use a 10-point scale to avoid this.
The age range of study participants was initially heavily
skewed toward the younger population. Possible sources of this
arise from recruitment methods. Classroom solicitation occurred
in large amphitheater, General Education classes, which likely
contained many first year students. In addition, recruitment at
campus fraternity houses occurred during new pledge recruitment.
This could pose as another source of young participants. Lack of
commitment and interest from the younger participants is a
possible source of attrition in this study with 83% of the 18-19
year old age group dropping out.
During recruitment, sign-in sheets were passed around large
classrooms and the fraternity houses to expedite the process of
gather possible participant data. This became a major concern as
illegible handwriting was commonly encountered. The same problem
arose from the sheets used to recruit in front of the Student
Union.
Were there to be a highly publicized TSE screening campaign
(such as Lance Armstrong’s high-profile case), rates of
participation and intent to be screened might be higher than

57
expected for all participants, at least in the short term.
Because participants were randomized when placed in a message
group, media effects should affect all subjects equally. Because
this pilot study establishes feasibility for a fully powered
trial, the effect sizes produced would not reflect what would be
achieved in the larger study in the event or absence of a media
event.
Attrition proved to be the principal limitation in this
study, as rates were well above those expected. This created a
major gap in statistical analysis as only within group analyses
were performed and no between group analyses were included. It
is reiterated with confidence that a larger sample size would
have provided more concrete evidence to support all hypotheses.
RECOMMEDNATIONS FOR FUTURE RESEARCH
Using the key variables in this study, future studies
should further analyze the Intention variable in relation to the
Theory of Planned Behavior. The I-Control variable would
function as the control belief, Value of Health Promotion serves
as the behavioral belief and using Item 27 of the questionnaire
with additional questions to measure the normative beliefs.
These three beliefs are predictive of intention to perform the
behavior. By understanding attitudes behind the intention to

58
perform a behavior, interventions specific to those attitudes
can be implemented to increase intention.
Using the high self-efficacy modeled in this study in
conjuncture with interventions to change attitudes using the
Theory of Planned Behavior, a more effective cue to action can
be created to prompt a health behavior change. While this study
indicates a promising way to increase intention to perform the
behavior, a stronger cue to action might be necessary to elicit
the change. In future studies it is recommended that the
reminder (cue to action) include the threat and efficacy
components of the EPPM as opposed to focusing on the efficacy as
was done in this study.
A need still exists for studies measuring long-term
adherence. This study measured long-term adherence in the form
of a question added to the final survey (Item 31). The
calculated mean for this item was 9.284, indicating a high
intent to continue the behavior. Without further follow up one
cannot know whether the intent was carried out and the behavior
continued. This creates a need to replicate this study in order
to determine if this communication system could indeed change
the behavior of college men.
As previously stated, attrition posed the prevalent
limitation for this study and indicates that a need still exists

59
to explore this topic. In future studies, investigators should
oversample to triple amounts and expect an attrition rate of
50%, at minimum. For this study twice as many participants were
recruited than needed and an attrition rate of 20% was expected.
By perfecting this one-on-one communication system, a
gateway to using social communication becomes possible. Using
men from whom behavior was altered because of the developed
communication system as social media advocates, a public
communication system can be developed. Opening the door to the
world of social media provides limitless opportunities to
influence individuals’ behaviors on a very large scale. This
study is a foundation for a much needed communication network in
the field of men’s health.

60
REFERENCES
1. American Cancer Society. (2008). Overview: Testicular Cancer. American Cancer Society, Inc. Atlanta, GA.
2. Barling, N., & M. Lehmann. (1999). Young men's awareness, attitudes, and practice of testicular self-examination: A health action process approach. Psychology, Health, and Medicine, 4(3), 255-264.
3. Bell, S. L., Powers, J. R., & Young, A. F. (2006). Attrition in longitudinal studies: who do you lose? Australian and New Zealand Journal of Public Health, 30(4), 353+.
4. Borg I, & Groenen P. Modern multidimensional scaling: theory and applications. New York: Springer-Verlag; 1997.
5. Brenner, J., A. Hergenroeder, C. Kozinetz, & S, Kelder. (2003). Teaching Testicular Self-Examination: Education and Practices in Pediatric Residents. Pediatrics. Vol. 111, e239-e244
6. Cogniplot. (2009) Created by: T. F. Gordon and R. Flowers
7. Cox, C., R. McLaughlin, S. Rai, B. Steen, & M. Hudson. (2005). Adolescent survivors: A secondary analysis of a clinical trial targeting behavior change. Pediatric Blood Cancer, 45, 144-154.
8. Dearnaley, D., R. Huddart, & A. Horwich. (2001). Managing testicular cancer. British Medical Journal, 322, 1583-1588.
9. Dawes, J. (2008). Do Data Characteristics Change according to the Number of Scale Points Used? An experiment using 5-point, 7-point and 10-point scales. International Journal of Market Research, Vol. 50, 1
10. Gardenfors P. Conceptual spaces: the geometry of thought. Cambridge, MA: MIT Press; 2000.
11. Goldbloom, R. (1985). Self-examination by adolescents. Pediatrics. 76, 126-128.
12. Gore, T. & C. C. Bracken. (2005). Testing the Theoretical Design of a Health Risk Message: Reexamining the Major Tenets of the Extended Parallel Process Model. Health Education & Behavior, 32(1), 27-41
13. Hergenroeder A., C. Kozinetz, & S. Kelder. (2003). Teaching testicular self-examination: Education and practices in pediatric residents. Pediatrics, 111(3), 239-244.

61
14. Hirst, G., C. DiMarco, E. Hovy, & K. Parsons. (1997). Authoring and Generating Health-Education Documents that are Tailored to the Needs of the Individual Patient. In A. Jameson, C. Paris, & C. Tasso (eds). User Modeling: Proceedings of the Sixth International Conference, UM97. Vienna, New York: Springer Wien New York.
15. Horowitz, A., S. Reinert, & A. Caldamone. (2006). Teaching testicular self-examination in the pediatric outpatient setting: A survey of pediatricians and family doctors. Medicine & Health, Rhode Island, 89(11), 370-376.
16. Horowitz, A., S. Reinert, & A. Caldamone. (2006). Teaching testicular self-examination in the pediatric outpatient setting: A survey of pediatricians and family doctors. Medicine & Health, Rhode Island, 89(11), 370-376.
17. Khadra, A & P. Oakeshott. (2002). Pilot study of testicular cancer awareness and testicular self-examination in men attending two South London general practices. Family Practice. Vol. 19, No. 3 pp: 294-296
18. Kleier, J. (2004). Nurse practitioners' behavior regarding teaching testicular self-examination. Journal of the American Academy of Nurse Practitioners., 15(5), 206-212.
19. Lechner, L., A. Oenema, & J. De Nooijer. (2002). Testicular self-examination (TSE) among dutch young men aged 15-19: Determinants of the intention to practice TSE. Health Education Research, 17(1), 73-84.
20. McClenahan, C., M. Shevlin, G. Adamson, C. Bennett, & B. O'Neill. (2007). Testicular self-examination: A test of the health belief model and the theory of planned behavior. Health Education Research, 22(2), 272-284.
21. McCullagh, J., G. Lewis, & C. Marlow. (2005). Promoting awareness and practice of testicular self-examination. Nursing Standard, 19(51), 41-49.
22. McGilligan, C., C. McClenahan, & G. Adamson. (2009). Attitudes and Intentions to Performing Testicular Self-Examination: Utilizing an Extended Theory of Planned Behavior. Journal of Adolescent Health. 44, 404-406
23. Morman, M. (2000). The Influence of Fear Appeals, Message Design, and Masculinity of Men’s Motivation to Perform the Testicular Self-Exam. Journal of Applied Communication Research. 28(2), pp: 91-116

62
24. Morman, M. 2002. Promoting the Testicular Self-Exam as a Preventative Health Care Strategy: Do Diagrams Make a Difference? International Journal of Men’s Health. 1(1), p.73
25. Murray-Johnson, L., K. Witte, D. Patel, V. Orrego, C. Zuckerman, A. M. Maxfield & E. D. Thimons. (2004). Using the Extended Parallel Process Model to Prevent Noise-Induced Hearing Loss Among Coal Miners in Appalachia. Health Education and Behavior. 31(6), 741
26. Myers, R., R. Sifri, T. Hyslop, M. Rosenthal, S. Vernon, J. Cocroft, T. Wolf, J. Andrel, & R. Wender. (2007). A Randomized Controlled Trial of the Impact of Targeted and Tailored Interventions on Colorectal Cancer Screenings. Cancer. 110(9), pp:2083-2091
27. Rew, L., M. Graham, L. Riesch, and C. Parker. 2005. Development of the self-efficacy for testicular self-examination scale. Journal of Men’s Health and Gender. 2(1), pp:59-63
28. Roberto, A., G. Meyer, A. J. Johnson, & C. Atkin. (2000). Using the Extended Parallel Process Model to Prevent Firearm Injury and Death: Field Experiment Results of a Video-Based Intervention. Journal of Communication. Autumn 2000. 157-175
29. Robertson, L., F. Douglas, A. Ludbrook, G. Reid, and E. van Teijlingen. (2008) What works with men? A systematic review of health promoting interventions targeting men. BMC Health Services Research, 8:141
30. Robertson, L., F. Douglas, A. Ludbrook, G. Reid, & E. van Teijlingen. (2008). What works with men? A systematic review of health promoting interventions targeting men. BMC Health Services Research. 8, 141-150
31. Rotter, J. (1966). Generalized expectancies for internal versus external control of reinforcement. Psychol Monogr, 80(1), pp: 1-28.
32. Rovito, M. (2009). Appealing to Males At-Risk for Testicular Cancer: Defining a ‘Control Identity’ Typology and Modeling Perceptions of Testicular Self-Examination (TSE). Dissertation Research. Temple University, Philadelphia, PA
33. Rudberg, L., S. Nilsson, K. Wikblad, M. Carlsson. (2005). Testicular Cancer and Testicular Self-examination:

63
Knowledge and Attitudes of Adolescent Swedish Men. Cancer Nursing. 28(4):256-262, July/August
34. Sethares, K. & K. Elliott. (2004). The effect of a tailored message intervention on heart failure readmission rates, quality of life, and benefit and barrier beliefs in persons with heart failure. Heart & Lung. 33(4), pp:249-260
35. Singleton, A. (2008) “It’s Because of the Invincibility Thing”: Young Men, Masculinity, and Testicular Cancer. International Journal of Men’s Health. 7(1), pp: 40-58
36. Steadman, L., & L. Quine. (2004). Encouraging young males to perform testicular self-examination: A simple, but effective implementation intentions intervention. British Journal of Health Psychology, 9, 479-487.
37. Tani, C. (2002). Increasing the frequency of testicular self-examination behavior in college men. (PhD, Colorado State University).
38. Trumbo, C. (2004). Mass-mediated information effects on testicular self-examination among college students. Journal of American College Health, 52(6), 257-262.
39. Wallston K. & B. Wallston. (1981) Health locus of control scales. In: Lefcourt HM, ed. Research with the Locus of Control Construct. New York: Academic Pr; 1981.
40. Walschaerts M., E. Huyghe, A. Muller, J. Bachaud, L. Bujan, & P. Thonneau. (2008). Doubling of testicular cancer incidence rate over the last 20 years in southern france. Cancer Causes & Control, 19(2), 155-161.
41. Ward, K, M. Vander Weg, M. Read, M. Sell, & B. Beech. (2005). Testicular cancer awareness and self examination among adolescent males in a community-based youth organization. Preventive Medicine, 41, 386-398.
42. Witte, K. (1992, October). Fear control and danger control: An empirical test of the extended parallel process model. Paper presented at the annual meeting of the Speech Communication Association, Chicago.
43. Witte, K. (1992). Putting the Fear Back Into Fear Appeals: The Extended Parallel Process Model. Communications Monographs. 39, 329-349
44. Witte, K. (1998). Fear as motivator. fear as inhibitor: Using the extended parallel process model to explain fear appeal successes and failures (pp. 423-450). In P. A. Andersen & L. K. Guerrero (Eds.), The handbook of

64
communication and emotion: Research, theory, applications, and contexts. San Diego, CA: Academic Press.
45. Witte, K. 1993. message and conceptual confounds in fear appeals: The role of threat, fear, and efficacy. Southern Communication Journal. 58, 147-155
46. Witte, K., J. Berkowitz, K. Cameron, & J. McKeon. (1998). Preventing the Spread of Genital Warts: Using Fear Appeals to Promote Self-Protective Behaviors. Health Education & Behavior. 25(5), 571-585
47. Wynd, C. (2002). Testicular self-examination in young adult men. Journal of Nursing Scholarship, 34(3), 251-255.

65
APPENDIX A: IRB APPROVAL FORM

66
Page 1 of 2
Approval of Human Research From: UCF Institutional Review Board #1 FWA00000351, IRB00001138 To: Michael J. Rovito and Co-PI: Lisa M. Soler Date: August 28, 2012 Dear Researcher: On 8/28/2012, the IRB approved the following minor modifications to human participant research until 08/26/2013 inclusive:
Type of Review: IRB Addendum and Modification Request Form Modification Type: Change to data dissemination: instead of original plan of using a
cell phone as the central device, a free messenger system through Yahoo! mail will be used. In addition a revised flyer and TV ad have been uploaded for use in recruiting participants.
Project Title: The Effect of Text Messaging Alerts Upon Testicular Self-Examination (TSE) Adherence
Investigator: Michael J Rovito IRB Number: SBE-12-08596
Funding Agency: Grant Title:
Research ID: N/A The Continuing Review Application must be submitted 30days prior to the expiration date for studies that were previously expedited, and 60 days prior to the expiration date for research that was previously reviewed at a convened meeting. Do not make changes to the study (i.e., protocol, methodology, consent form, personnel, site, etc.) before obtaining IRB approval. A Modification Form cannot be used to extend the approval period of a study. All forms may be completed and submitted online at https://iris.research.ucf.edu . If continuing review approval is not granted before the expiration date of 08/26/2013, approval of this research expires on that date. When you have completed your research, please submit a Study Closure request in iRIS so that IRB records will be accurate. Use of the approved, stamped consent document(s) is required. The new form supersedes all previous versions, which are now invalid for further use. Only approved investigators (or other approved key study personnel) may solicit consent for research participation. Participants or their representatives must receive a copy of the consent form(s). In the conduct of this research, you are responsible to follow the requirements of the Investigator Manual. On behalf of Sophia Dziegielewski, Ph.D., L.C.S.W., UCF IRB Chair, this letter is signed by: Signature applied by Joanne Muratori on 08/28/2012 04:41:53 PM EDT
University of Central Florida Institutional Review Board Office of Research & Commercialization 12201 Research Parkway, Suite 501 Orlando, Florida 32826-3246 Telephone: 407-823-2901 or 407-882-2276 www.research.ucf.edu/compliance/irb.html

67
APPENDIX B: SCREENER SURVEY

68
Screener Survey
Last 4 digits of your phone number: ______________
1. Have you ever been diagnosed with testicular cancer? a. Yes b. No
2. Over the past 6 months how many times have you performed testicular self
examination?
________________________
3. Do you believe you are knowledgeable about testicular health and self-‐examination? a. Yes b. No
4. Do you have a reliable mobile device that can receive a maximum of 8 text messages
throughout the next four months? a. Yes b. No
5. What is your mobile phone provider (e.g. Verizon, Sprint, etc)?
_______________________________

69
APPENDIX C: PRIMARY SURVEY

70
Testicular Self-Examination Survey Age: _______________ Study ID number (last 4 digits of your phone number): ___________________
For each item listed below, circle the number to the right that best fits your judgment of its quality. Use the scale to select the quality number.
Item Scale Item Scale
1. I am informed about testicular cancer
1
2
3
4
5
2. I am informed about testicular self-‐examination
1
2
3
4
5
3. I have performed testicular self-‐examination
1
2
3
4
5
4. I am in control of my health
1
2
3
4
5
5. I have control in prolonging my life
1
2
3
4
5
6. I have control in performing healthy behaviors
1
2
3
4
5
7. I can change/influence other people’s behavior
1
2
3
4
5
8. I can contract a life-‐threatening disease at this point in my life
1
2
3
4
5
9. I can die prematurely
1
2
3
4
5
10. I am at risk for testicular cancer
1
2
3
4
5
11. I am vulnerable to getting testicular cancer at my age
1
2
3
4
5
12. I am among the highest risk group for getting testicular cancer
1
2
3
4
5
1 Strongly Disagree
2 Disagree
3 Neutral
4 Agree
5 Strongly Agree

71
13. Testicular cancer is a threat to my health and well-‐being
1
2
3
4
5
14. Testicular cancer appears mostly in men who play sports
1
2
3
4
5
15. Testicular cancer appears mostly in “weak” men
1
2
3
4
5
16. Testicular cancer is an “old man’s disease”
1
2
3
4
5
17. There are personal benefits to performing health behaviors
1
2
3
4
5
18. There is value in health promotion
1
2
3
4
5
19. Health promotion is an important component of men’s health
1
2
3
4
5
20. Testicular self-‐examination is a valuable tool to prevent testicular cancer
1
2
3
4
5
21. Testicular self-‐examination can assist in prolonging your life
1
2
3
4
5
22. Testicular self-‐examination will reduce your risk of getting testicular cancer
1
2
3
4
5
23. Testicular self examination is easy to do
1
2
3
4
5
24. Testicular self-‐examination is a good cancer prevention tool
1
2
3
4
5
25. Testicular self-‐examination is embarrassing
1
2
3
4
5
26. Testicular self-‐examination is a responsible thing to do
1
2
3
4
5
27. I would discuss testicular self-‐examination with friends and/or family
1
2
3
4
5
28. I will consider performing testicular self-‐examination sometime soon
1
2
3
4
5
29. I will perform testicular self-‐examination this month and will plan to continue to perform it monthly
1
2
3
4
5
30. I will not perform testicular self-‐examination
1
2
3
4
5

72
APPENDIX D: SECONDARY SURVEY

73
Secondary Survey
1. How many text messages are you receiving a month?
2. Are the text messages easy to understand? a. Yes b. No
3. How many times have you performed the recommended testicular self-‐examination since
the seminar? ___________________________________________

74
APPENDIX E: TSE PAMPHLET

75

76
APPENDIX F: ADVERTISEMENT FOR STUDY

77
The Men’s Health Initiative is looking for volunteer MALES to participate in a study concerning
testicular self-examination.
WE ARE LOOKING FOR:
Males between the ages of 18-35 who have NEVER been diagnosed or treated for
testicular cancer Sound like you?
Contact Dr. Michael J Rovito for more information. 407-823-3888 [email protected]
Let us know which short seminar you can attend on
Friday, September 7th at 10 am, 1pm, or 3pm in HPA1 room 111. We’ll have free PIZZA!!!!
Study participants have a chance to win
$100 in Knights Cash!*
The Men’s Health Initiative is looking for volunteer MALES to
participate in a study concerning testicular self-examination.
WE ARE LOOKING FOR:
Males between the ages of 18-35 who have NEVER been
diagnosed or treated for testicular cancer Sound like you?
Contact Dr. Michael J Rovito for more information. 407-823-3888 [email protected]
Let us know which short seminar you can attend on
Friday, September 7th at 10 am, 1pm, or 3pm in HPA1 room 111. We’ll have free PIZZA!!!!
Study participants have a chance to win
$100 in Knights Cash!*
* To win the $100 Knights Cash, study participants can be entered in a drawing upon full completion of, and participation in, the study. The Men’s Health Initiative, based at UCF, directly conducts the drawing and is funding the prize. No purchase is necessary to be entered. The winning participant will collect his prize from operation headquarters after the 30th of November, at a time set up with Dr. Rovito.
* To win the $100 Knights Cash, study participants can be entered in a drawing upon full completion of, and participation in, the study. The Men’s Health Initiative, based at UCF, directly conducts the drawing and is funding the prize. No purchase is necessary to be entered. The winning participant will collect his prize from operation headquarters after the 30th of November, at a time set up with Dr. Rovito.