the effect of the loss of plant protection products on uk
TRANSCRIPT

ACrop Production Technology:
The Effect of the Loss of Plant Protection Products on UK
Agriculture and Horticulture and the Wider Economy

This report, prepared for the Agricultural Industries Confederation (AIC), the Crop Protection Association (CPA) and the National Farmers Union (NFU) presents the findings from a short research project. The report has been prepared independently, and the views, opinions and conclusions expressed are those of the authors, and do not necessarily reflect those of the commissioning organisations. The authors have taken all reasonable steps to ensure that the information in this report is correct. However, we do not guarantee that the material within the report is free of errors or omissions. We shall not be liable or responsible for any kind of loss or damage that may result as a consequence of the use of this report.

The Andersons Centre CPA-NFU-AIC
i
EXECUTIVE SUMMARY
Plant Protection Products (PPP) are subject to rigorous testing and safety assessments. But, the regulatory
environment has become increasingly challenging to established PPPs and product innovation.
Three main policies threaten the availability of PPP;
the approval process at EU level
the implementation of the Water Framework Directive at national level
restrictions on neonicotinoid seed treatments.
At present, no definitive list of PPP under threat from the various policies exists, in part due to uncertainty in
the way regulations will be defined and interpreted. This project identified that 87 of the 250 active
substances currently approved in the UK could be threatened by the cumulative effects of these policies.
In practice, there is a sliding scale of threat. It has been assessed that 40 active substances are highly likely
to be lost or restricted. This includes 10 insecticides, 12 fungicides, 16 herbicides and 2 molluscicides. The
active substances deemed likely to be withdrawn or restricted include important products for UK crop
production.
Loss or restricted use would make control of weeds, disease, and pests in key UK crops far more difficult.
Furthermore, as reliance is on fewer PPP, resistance build-up will become more likely.
Loss of PPP will result in lower overall yields. Predicted yield decreases range from 4-50% in the crops
studied, based on the effect of losing PPP classified as ‘high’ likelihood of being restricted or not gaining re-
authorisation.
UK cropping patterns would change, with an increase in spring cropping, fallow and temporary grass.
Overall food output from UK farming and horticulture would decline. Although it is assumed that the global
market would offset the shortfall, the effect would be to make the UK more reliant on food imports and so
reduce self-sufficiency.
Domestic production of some ‘iconic’ British foods such as frozen peas, apples and fresh carrots would be
severely curtailed.
The structural change in UK crop production would alter farming costs as seed, fertiliser and PPP uses all
shift and greater reliance is placed on mechanical and hand weeding.
A reduction in home-grown cereal output would lead to rising livestock feed costs.
Modelling all the changes sees UK agriculture’s Gross Value Added (GVA) fall by c. £1.6bn per annum – a
drop of 20% on the 5-year average (2009-2013).
UK farming profit (Total Income from Farming) drops by £1.73bn in monetary terms, which equates to a
36% drop in overall profits. These figures are based on a realistic assessment of the risks of losses of PPP,
not a worst-case scenario.

The Andersons Centre CPA-NFU-AIC
ii
Declining profitability will cause further structural change. In general, less efficient producers will exit the
sector and farming operations will, on average, become fewer and larger.
The impact of losing key PPP goes wider than agriculture. Farming provides the raw materials for the wider
agri-food sector which makes up over 7% of the total UK economy. As a result, the food processing and
manufacturing sector would decline over time and potentially lose around £2.5bn of GVA. The impact on
the associated workforce would be job losses of 35,000 to 40,000.
The agricultural supply industry, including wholesalers would be hit hard with a loss of £0.28bn in GVA and
job losses of 3,500-4,000.
The UK’s role as a major centre for PPP research and development is threatened by legislative uncertainty.
This not only means that better and safer alternatives are not being developed, but it also threatens
investment in this high-tech sector of the UK economy.
As the UK is a relatively wealthy country, purchased imports could make good any shortfall in domestic
production. However, food costs are likely to rise for consumers. While not popular with most of the UK
population, it would seriously affect up to a fifth of the population who already suffer food poverty.
There is a moral question of imposing rich-world production standards when some 842 million people
globally do not have enough to eat. There is a strong argument that Europe, with its favourable soils and
climate, should be optimising output (sustainable intensification).
Alternative production systems and technologies are often cited as ways of ensuring sufficient food
production with less (or no) reliance on PPP. Whilst making useful contributions, these cannot fully replace
PPP at the current time.
The conclusion must be that the current direction of policy in the area of PPP is likely to lead to considerable
economic and social losses, with the gains, at best, uncertain or minimal.
Any policies should be science-led, and the assessment of risks undertaken on a proportionate basis. This
will ensure a thriving agricultural sector and safe food for the UK population in future.

The Andersons Centre CPA-NFU-AIC
iii
CONTENTS
1. INTRODUCTION ............................................................................................................................... 1
1.1. BACKGROUND ............................................................................................................................... 1
1.2. APPROACH .................................................................................................................................... 1
1.3. STRUCTURE OF THIS REPORT ........................................................................................................ 1
1.4. DEFINITIONS ................................................................................................................................. 2
2. THE LEGISLATION .......................................................................................................................... 3
2.1. BACKGROUND ............................................................................................................................... 3
2.2. PESTICIDES APPROVAL ................................................................................................................. 3
2.3. THE WATER FRAMEWORK DIRECTIVE .......................................................................................... 7
2.4. NEONICOTINOID RESTRICTIONS .................................................................................................. 10
2.5. OTHER ISSUES ............................................................................................................................. 10
3. THREATENED ACTIVE SUBSTANCES ...................................................................................... 13
3.1. DATA SOURCES ........................................................................................................................... 13
3.2. POTENTIAL ACTIVE SUBSTANCES LOSSES .................................................................................. 14
4. EFFECT OF ACTIVE SUBSTANCE LOSS .................................................................................. 19
4.1. GENERAL .................................................................................................................................... 19
4.2. PROBLEM AREAS ........................................................................................................................ 20
4.3. WINTER CEREALS ....................................................................................................................... 28
4.4. OTHER COMBINABLE CROPS ....................................................................................................... 31
4.5. ROOT CROPS ............................................................................................................................... 33
4.6. VEGETABLE AND FRUIT CROPS ................................................................................................... 34
4.7. OTHER CROPS ............................................................................................................................. 35
5. EFFECTS ON UK AGRICULTURE .............................................................................................. 39
5.1. METHODOLOGY .......................................................................................................................... 39
5.2. MAIN ASSUMPTIONS ................................................................................................................... 40
5.3. RESULTS ..................................................................................................................................... 44
6. WIDER ECONOMIC EFFECTS ..................................................................................................... 48
6.1. THE FOOD CHAIN AND CONSUMERS ........................................................................................... 48
6.2. ENVIRONMENTAL EFFECTS ......................................................................................................... 53
6.3. EFFECT ON RESEARCH AND SCIENCE BASE ................................................................................. 54
7. MITIGATION STRATEGIES ......................................................................................................... 58
7.1. BACKGROUND ............................................................................................................................. 58
7.2. ORGANIC FARMING ..................................................................................................................... 58
7.3. PRECISION FARMING AND INTEGRATED PEST MANAGEMENT ..................................................... 61
7.4. BIO-PESTICIDES .......................................................................................................................... 62
7.5. FUTURE DEVELOPMENTS ............................................................................................................ 63
8. CONCLUSIONS AND RECOMMENDATIONS ........................................................................... 64
8.1. POTENTIAL LOSSES ..................................................................................................................... 64
8.2. EFFECT ON CROP PRODUCTION ................................................................................................... 64
8.3. IMPACT ON THE FARMING INDUSTRY .......................................................................................... 65
8.4. WIDER ECONOMIC AND SOCIAL EFFECTS ................................................................................... 65

The Andersons Centre CPA-NFU-AIC
iv
8.5. ALTERNATIVES ........................................................................................................................... 66
8.6. OVERALL .................................................................................................................................... 67
APPENDIX I – REFERENCES ................................................................................................................. 68

The Andersons Centre CPA-NFU-AIC
October 2014 Page 1 of 67
1. INTRODUCTION
1.1. BACKGROUND
The UK agricultural industry faces a threat to its productivity through the loss of key plant protection products.
This is a result of legislation resulting in the withdrawal of existing active substances and restrictions of the
development of new pesticides and plant protection products.
Crucially, the threat is not from a single source, but from multiple pieces of legislation. A key feature of the
report is that it looks at the effect of legislation ‘in the round’. Although the economic costs of one policy may be
relatively manageable in isolation (and individual cost-benefit analysis may support this), the effect when
combined with other overlapping policies is likely to be far more profound.
The interaction of regulatory and commercial pressures is looked at. As the cost of gaining approval for a product
increases, then fewer products will have the potential market returns to cover these. These issues are already
contributing to a lack of new products in the pipeline for UK and European farmers.
1.2. APPROACH
This report is based on the best available information. Where possible, the basic data will be based on publically-
available, referenced, information. There will be a requirement for a number of assumptions to be made in
quantifying the impact of the loss of active substances and products. These will be clearly stated and cross-
checked to ensure a robust result. Although the research will be comprehensive and detailed, the aim is to
summarise it in a number of ‘high-level’ figures that will provide an overview of the likely effects.
The project has been undertaken primarily as a desk-based research exercise. It has gathered quantitative data
about UK agriculture from a number of sources and analysed these to arrive at conclusions. This has been
supplemented with interviews with a number of key individuals within the crop protection and farming industries.
1.3. STRUCTURE OF THIS REPORT
The following Chapter provides a brief summary of the legislation that is threatening the continued use of some
key plant protection products.
Chapter 3 outlines the active substances that could become unavailable as a result of the policies. In Chapter 4 the
effect of these losses on key crops is estimated. Chapter 5 gathers the data for individual crops together to arrive
at the effect on the UK farming industry as a whole. This is then extended to look at the wider economic effects
in Chapter 6.
Chapter 7 looks at ways the industry might mitigate some of the worst effects of the loss of products and whether
there are realistic alternatives. Finally, in Chapter 8, the conclusions bring the various strands of the report
together.

The Andersons Centre CPA-NFU-AIC
October 2014 Page 2 of 67
1.4. DEFINITIONS
Within this report the chemical that provides protection to the plant is referred to as a ‘pesticide’ or alternatively
the ‘active substance’. Whilst not used in this report, an alternative term often used is ‘active ingredient’.
A Plant Protection Product (PPP) is the formulation that is used in agriculture or horticulture. It may be made up
of one or more active substances. ‘Product’ is used interchangeably with PPP.
‘Pests’ is used to mean all weeds, pests and diseases.
Insect is also used generically to refer to all aphids, moths, flies, midges, and all arthropod pests including mites,
centipedes etc.

The Andersons Centre CPA-NFU-AIC
October 2014 Page 3 of 67
2. THE LEGISLATION
2.1. BACKGROUND
There are a number of regulatory issues that are coming together to generate a significant threat to many plant
protection products (PPP). Much of the legislation originates at European Union (EU) level, but there are
additional issues associated with the way in which rules are interpreted and applied in the UK.
The science and regulatory environment can be complex. The following section provides a ‘layman’s’ guide to
the issues. It provides a succinct summary of some of the policies impacting on PPP. It does not aim to be fully
comprehensive and full references are provided so that further reading is possible for those that require more
detail.
The main policies that are addressed are;
Active Substance Approval – Regulation EC 1107/2009
Water Framework Directive (WFD) 2000/60 / EC (and related legislation such as the Drinking Water
Directive and the Groundwater Directive)
Conditions of Approval of Neonicotinoids, Regulation 485/2013
UK-specific implementation and guidelines
2.2. PESTICIDES APPROVAL
2.2.1. History – Directive 91/414/EEC
Before the 1990s, individual Member States were responsible for approving pesticides in their own countries.
Directive 91/414/EEC was implemented in 1993 to harmonise the approvals process across the EU. Any active
substance had to meet specific criteria on safety and efficacy before it could be placed onto the European market.
Prior to Directive 91/414/EEC there were around 1,000 active substances authorised in at least one Member
State1. All existing approved substances had to be re-approved under the new Directive. This resulted in around
230 pesticides still having approval in the EU by 2009. The approved active substances were placed on ‘Annex I’
to 91/414 EEC.
The number of active substances lost under 91/414/EEC looks dramatic – over three-quarters lost. However, most
of the substances which did not gain Annex I approval were simply not supported for application (being
uneconomic or superseded) rather than being put forward and then being judged unsafe. This legislation had the
effect of significantly reducing the active substances on the approved list. Only those where the potential market
justified supporting the pesticide through the approvals process remained. Therefore, any loss from this new
baseline meant that important substances were now being lost, which was not always the case in the past.
2.2.2. Annex I Products
Active substances judged safe under the criteria of 91/414 EEC were placed on the Annex I list for a period of 10
years. Whilst the EU is responsible for approving active substances, Member States have responsibility for the

The Andersons Centre CPA-NFU-AIC
October 2014 Page 4 of 67
authorisation of specific PPP containing those substances. Member States can only authorise products containing
pesticides listed in Annex I for supply, sale, storage and use.
After the 10 year period, active substances renewals are required at EU level for a further 10-year period. Many
commonly used active substances are due to be considered for re-approval in the years through to 2020.
The renewals are grouped into batches. The Annex I Review number 1 (AIR-1) saw seven active substances
successfully renewed under Regulation EC 737/20072. At present AIR-2 has 31 active substances under review.
Decisions on this batch are due by the end of 2015. Finally, there is an AIR-3 group of 150 active substances that
are just starting the re-approvals process. Generally, once an application for re-approval has been made, there is
an extension of the expiry date for products containing it whilst the application is processed.
2.2.3. Updated Legislation – Regulation EC 1107/2009
A new ‘Thematic Strategy’ on The Sustainable Use of Pesticides was adopted by the European Commission on
12th July 20063. This has resulted in two main pieces of EU legislation;
Regulation 1107/2009 on the Placing of Plant Protection Products on the Market4. This replaces Directive
91/414/EEC and came into force in June 2011. It has more stringent requirements for active substance
approval (see below). It covers both the approval of new active substances and the renewal of existing
substances. AIR-2, AIR-3 and any subsequent re-approvals will be conducted under these new
requirements
Directive 2009/128 on the Sustainable Use of Pesticides5. This governs the use of pesticides once they
have been approved in the EU
Active substances will not be approved (or re-approved) under 1107/2009 if they are classified as having the
following properties;
Mutagenic
Carcinogenic or have Reproductive Toxicity (unless the exposure is ‘negligible’)
Endocrine Disruptors which cause adverse effects (see below for more details)
Persistent Organic Pollutants (PoPs)
Persistent Bio-accumulative and Toxic (PBT)
Very Persistent / very Bio-accumulative (vPvB)
These are known as the ‘cut-off criteria’.
There is a derogation allowing pesticides to be approved for five years in exceptional circumstances, even if they
fall within the above criteria, if they are necessary to ‘control a serious danger to plant health that cannot be
contained within other means’. Asulam, an important herbicide for bracken control in the uplands, had gained
approval for use under this derogation because there are no alterative products.
The following sections look at specific issues arising out of the 1107/2009 legislation.

The Andersons Centre CPA-NFU-AIC
October 2014 Page 5 of 67
2.2.4. Risk and Hazard
The key change brought about by the introduction of new legislation (1107/2009) is the move from a risk-based to
a hazard-based approvals system.
Under the provisions of 91/414/EEC, even if the properties of a pesticide deemed it to be classified as hazardous
(e.g. carcinogenic) the way it was actually used would be looked at. Exposure when correctly used was
considered, the risk was assessed and, if not considered unacceptable, the pesticide could be registered for sale.
Under the new 1107/2009 rules, any level of exposure to a substance that is deemed as hazardous is considered
unacceptable. It is the intrinsic properties of an active substance that are now key.
This is a fundamental change in approach. An equivalent situation might be the banning of coffee because it
contains caffeine. Caffeine is a stimulant drug and harmful if taken in a sufficient dosage – it is therefore
hazardous. However, as the way it is actually used in products such as tea or coffee provides a very small
exposure (dose) it has been consumed by humans for thousands of years with very little or no risk. Paracelsus, a
16th century scientist regarded as the founder of the study of toxicology stated ‘dosis facit venenum’ – the dose
makes the poison.
2.2.5. Guidance Documents
Those companies wishing to register an active substance are required to submit a ‘dossier’ proving that all the
necessary risk assessments have been undertaken. This dossier is assessed by a Member State of the EU (acting as
‘rapporteur’). The European Food Safety Authority (EFSA) provides technical guidance on how these risk
assessments should be undertaken.
The guidance criteria continue to proliferate; there are now 19 guidance documents either in place or in
preparation. Examples include the Wild Bird and Mammal Guidance which has significantly increased regulatory
costs. The proposed Bee Guidance is estimated by the industry to potentially impact on 95% of all active
substances. It would require high investment in new studies which, with current research capacity, would take 24
years to conduct. It can be clearly seen that the way the guidance is implemented raises costs and lengthens
timescales for approvals.
The guidance itself is also becoming more conservative with consequent restrictions on rates and timings.
When the guidance criteria are revised, the rules are often applied to pesticides already within the approvals
process. This can see active substances lost as, for example, thresholds are changed in the guidance document.
This creates an uncertain regulatory environment.
In certain cases, pesticides already approved and on Annex I can lose their approval (or face additional
restrictions) if EFSA changes its guidance. This is what happened with three neonicotinoid seed treatments (see
Section 2.4).

The Andersons Centre CPA-NFU-AIC
October 2014 Page 6 of 67
2.2.6. Candidates for Substitution
Under 1107/2009 some active substances may be approved, but deemed to be ‘candidates for substitution’. This
means that products containing these pesticides may have their approval removed if a safer alternative is available
to control a particular weed, pest or disease problem on a crop. For this to happen, the alternative product must
have a significantly lower risk to human health or the environment and there must be historical experience in
using the product. Candidates for substitution will only be approved (or re-approved) for a reduced, seven year,
period.
The legislation requires a comparative assessment to be undertaken on any product containing a candidate for
substitution. This looks at the specific use or uses the PPP is put to. As product uses vary between Member
States, this analysis has to be undertaken at the Member State level. What this means is that an active substance
that is a candidate for substitution is unlikely to lose its approval entirely – but the uses to which it can be put may
be restricted.
This comparative assessment has the potential to limit the number of products available to control a weed, pest or
disease problem on a crop. Removal of a specific major use may lead to the product being withdrawn for
commercial reasons and so any use of the product being unavailable. There could be a ‘culling’ of those deemed
more hazardous in favour of a limited number of ‘safer’ alternatives. A PPP containing a ‘candidate for
substitution’ may be retained if it can be demonstrated that it is required for resistance control, economic reasons,
or ‘minor uses’. However, this element of Regulation 1107/2009 is relatively new, so it remains to be seen what
long-term effect it has on the number of active substances and control mechanisms.
The definitive list of pesticides that are candidates for substitution was due to be published in December 2013.
This has not yet been done. The EU Commission contracted the Food Chain Evaluation Consortium (FCEC) to
undertake preparatory work on compiling such a list. The FCEC report6 was submitted in July 2013. Although,
this report has not been formally published, it has been made available to Member States’ Competent Authorities.
It is not a single list, but through combining the multiple lists, studies7 have calculated that around 100 substances
could be candidates for substitution.
2.2.7. Endocrine Disruptors
An Endocrine Disruptor (ED) can interfere with an endocrine (hormone) system in animals. The ED chemicals
bind with receptors for hormones such as oestrogen and androgen and change how the body functions. The issue
is wider than just pesticides, as many other products in the modern world have the potential to be endocrine
disruptors – soya milk, plastics, and detergents. The effects are not always negative; HRT and the contraceptive
pill work on the endocrine system for example.
The EU has a ‘Strategy for Endocrine Disruptors’8 which was adopted in 1999. Since then, much work has been
undertaken in trying to define and list endocrine disruptors. This is still ongoing, with the latest research study9
being published in January 2012 attempting to set out scientific criteria for the identification of endocrine
disruptors.
On 19th February 2013 DG Environment of the EU Commission released a revised proposal for these criteria in a
working paper; ‘Revised Version of Possible Elements for Criteria for Identification of Endocrine Disruptors’10.

The Andersons Centre CPA-NFU-AIC
October 2014 Page 7 of 67
This would establish a system with two categories of endocrine disruptors. Although not specifically stated, it is
assumed that ‘Category 1’ EDs will not be authorised under Regulation 1107/2009.
At the time of writing, the legislation for defining ED criteria is still under discussion. The EU Commission has
recently issued a public consultation on the criteria for identifying EDs11.
2.2.8. Use and Restrictions
Even when a pesticide is approved at EU level, there may be restrictions placed on products containing it that
make its use on farm impractical. An example of this is the product methiocarb. This has been widely used as a
slug control product within slug pellets (especially on potatoes). The active substance is still approved, but the
EU decided to withdraw approval for its use in slug pellets from mid-September 2014. This is due to the
potentially hazardous effect on grain-eating birds that frequent farmland (this was a result of criteria contained in
the Birds and Mammals Guidance document). Methiocarb’s use in other situations, such as seed treatments, can
continue.
2.3. THE WATER FRAMEWORK DIRECTIVE
2.3.1. EU Legislation
The Water Framework Directive (WFD)12 (2000/60/EC) is EU legislation that requires all rivers, lakes, ground
and coastal water to reach good ecological and chemical status. In addition, the Drinking Water Directive (DWD)
(1998/83/EC) sets limits on the amount of pesticides and other chemicals that are allowed in drinking water.
Finally, the Groundwater Directive (GWD) (2006/118/EC) sets out quality requirements for the protection of
groundwater. DWD and GWD are ‘daughter directives’ of the WFD.
The DWD sets standards at tap of 0.1 microgramme per litre for any one pesticide active substance and 0.5
microgramme per litre for total active substances. To place this in context, this is 0.1 parts per billion, or the
equivalent of one paracetamol tablet in an Olympic-sized swimming pool. It is effectively a proxy for zero
residues. The standard is applied to all active substances and does not take their toxicity into account. A standard
of 0.1 microgramme per litre also applies for groundwater.
In terms of the effect on pesticides availability, the WFD impacts in three main ways.
Firstly, a small number of chemicals that have the biggest impact on water quality are identified at EU-level. The
2008 Priority Substances Directive sets out the list of such chemicals. It has been updated by the 2013 Priority
Substances Directive13, and 45 chemicals are on the current list. Two categories of these are defined. Priority
Hazardous Substances (PHS) are deemed to have the greatest threat. The use of these chemicals is to be phased-
out. ‘Priority Substances’ (PS) have a lesser, but still significant, threat and Environmental Quality Standards
(EQS) are mandated at EU level. Not all of the chemicals on the Priority Substances lists are pesticides, but
examples of pesticides that do appear as Priority Substances are chlorpyrifos, isoproturon, bifenox and
cypermethrin.

The Andersons Centre CPA-NFU-AIC
October 2014 Page 8 of 67
The EU Commission has also instituted a ‘watch list’ of chemicals. These are not on the official Priority
(Hazardous) Substances list, but are those that are judged to be of possible concern for the future. Methiocarb has
been placed on this list. The widely-used herbicide glyphosate was an initial candidate for the watch list but after
analysis14 was found not to be of sufficient concern.
Secondly, at Member State level, chemicals that have certain intrinsic properties and are used widely in that
country are identified. In the United Kingdom these are known as ‘UK Specific Pollutants’.
Lastly, Article 7 of the WFD requires that the quality of water intended for drinking should not be allowed to
deteriorate from a baseline level and thus require additional treatment. Drinking Water Protected Areas
(DrWPAs) which supply drinking water have been identified and the aim in these areas is to reduce the need for
water treatment to remove a range of pollutants including pesticides. Whilst there is no specific ‘list’ of
substances that come under Article 7, the Environment Agency (EA) has identified those active substances most
likely to lead to an issue with Article 7 compliance. Currently, the ten most frequently detected by water company
and EA monitoring (in order of frequency of detection) are metaldehyde, MCPA, carbetamide, mecoprop,
propyzamide, clopyralid, chlorotoluron, 2-4D, isoproturon and glyphosate. Isoproturon had been banned in the
UK, but has recently been re-approved in a low-dose form for meadow grass control.
The WFD is implemented in six year ‘cycles’. The first cycle ends in 2015, and the second cycle runs from 2015
to 2021. The relevant authorities in the UK (see below) have begun drafting the programme of measures that will
apply for the second cycle.
2.3.2. UK Implementation of the WFD
Implementation of the WFD is a devolved matter, so England and Wales, Scotland, and Northern Ireland each
have their own regulations. The situation is further complicated by the fact that the WFD is being implemented
on the basis of ‘River Basin Districts’ (RBDs) – simplistically the catchments of major rivers or groups of rivers.
A number of UK RBDs cross national boundaries and some in Northern Ireland cross the international boundary
with the Republic of Ireland.
River Basin Management Plans have been drawn up for each RBD and these are currently being updated for the
next WFD cycle. These are due to be published in December 2015.
DEFRA’s updated water quality standards for the 2015 to 2021 cycle, including standards for Specific Pollutants,
have recently been published15. Of the previous 19 pollutants listed, six have been amended and ten added.
Relevant ones in terms of pesticides are carbendazim, chlorothalonil, cypermethrin, diazinon (although diazinon is
not approved for use in the UK), dimethoate, glyphosate, linuron, mecoprop, methiocarb, pendimethalin and
permethrin.
2.3.3. Effect on Pesticides
Pesticides that may cause a risk to WFD aims being met can be dealt with in a number of ways.
At present, the farming and horticultural industry is engaging positively with the issue by taking voluntary
measures. These include programmes such as the Voluntary Initiative (see www.voluntaryinitiative.org.uk),

The Andersons Centre CPA-NFU-AIC
October 2014 Page 9 of 67
Campaign for the Farmed Environment (see www.cfeonline.org.uk) and the Metaldehyde Stewardship Group (see
www.getpelletwise.co.uk).
These industry-led programmes are buttressed by schemes that incentivise growers to change their practices to
enhance water quality. These include agri-environmental programmes funded by national Governments such as
Environmental Stewardship, Glastir, Rural Priorities etc., although these have aims wider than improvements in
water quality. Government also funds specific water improvement schemes such as the Catchment Sensitive
Farming Scheme in England. Lastly, private sector bodies, mainly water companies, have implemented
programmes in specific areas to encourage and in some instances compensate land managers for changing farming
systems for the benefit of water. Such ‘payments for ecosystems services’ is an area of current interest to policy
makers.
Should voluntary approaches not deliver the required results, then restrictions on the use of active substances may
be imposed. This is discussed in more detail below.
In the past, fiscal instruments such as a ‘pesticides tax’ have been considered. This would have the effect of
increasing the cost and hence limiting the use of the active substances deemed to be the most polluting. This
approach seems unlikely to be adopted in the UK to date because it is perceived to be a blunt instrument and does
not consider the way in which a pesticide is used.
Most of the existing PS and PHS have already been withdrawn in the UK. Some Priority Substances do remain
authorised however, a notable example being chlorpyrifos. With the revision of the EU lists, some important
pesticides have been added. These include bifenox and cypermethrin as PS, and quinoxyfen as a PHS. Any
active substance on these lists is in danger of being withdrawn completely from use (in the EU and UK).
For active substances defined as UK Specific Pollutants, or those that may fall foul of the Article 7 rules,
restrictions under national legislation can be imposed. This is unlikely to be a complete withdrawal across the
UK. Restrictions could be implemented only in catchments and/or DrWPAs where there was an identified
problem. Even within a catchment/DrWPA restrictions are more likely to take the form of limits on timings, dose
rate or crop use. Such rules could even be imposed at a lower geographic level such as Parish, farm or even field
if there was a local water quality problem.
This makes it somewhat difficult to model the possible future effect of the WFD on UK agriculture. The
restrictions could be relatively ‘light-touch’ meaning that the majority of users are relatively unaffected, or they
could be so severe that continued use of a pesticide is practically impossible. Also, some areas of the UK could
face restrictions whilst others would be unaffected. If the affected areas are the only locations where the crops can
be grown in the UK (i.e. on specific soil types) these approaches would effectively have the same impact as a total
withdrawal. These issues are covered in more detail in the following sections.
The UK potentially has a bigger issue with water quality than many other EU countries due to the large proportion
of its land area that is under-drained. This means that any product applied to farmland can move quickly via
drains into watercourses before it breaks down in the soil. Surface run-off is also an important consideration
though.
Water quality issues led to the loss of the widely-used cereals herbicide isopoturon (IPU) from June 2009. (Note,
however, it was not specifically WFD legislation that resulted in the product not being re-registered, instead, the

The Andersons Centre CPA-NFU-AIC
October 2014 Page 10 of 67
concentrations of IPU in watercourses meant it did not pass the UK’s aquatic toxicity risk assessment.) Other
active substances that have been lost recently due wholly, or partly, to their effect on water quality or the aquatic
environment include atrazine, simazine and trifluralin.
2.4. NEONICOTINOID RESTRICTIONS
On 1st December 2013 EU-wide restrictions on three neonicotinoids were imposed - clothianidin, imidacloprid
and thiamethoxam16. The restriction comprises a two-year prohibition of use on the three pesticides as a seed
dressing on flowering crops and spring planted cereals. The active substances can continue to be used as a seed
dressing on crops such as sugar beet and winter cereals and as a foliar spray.
Neonicotinoids are insecticides derived from naturally-occurring plant compounds (nicotines). They stimulate the
nervous system. Every organism will have a different reaction to specific chemicals. The ‘No observable effect
level’ (NOEL) is the maximum dosage that can be taken before the chemical starts to have identifiable effects.
The NOEL for neonicotinoids in mammals is far higher than that for insects, so a dose that is harmless to humans
and other animals causes paralysis and death in insects.
Neonicotinoids are systemic which means that they are taken up by the plant and transported to all the tissues
(leaves, flowers, roots and stems, as well as pollen and nectar). Therefore, if a seed is coated with a neonicotinoid
dressing the resulting growing plant is protected from insect attack for 6 to 8 weeks. According to the HGCA17
over 70% of the UK oilseed rape crop was treated with the three restricted neonicotinoids in 2012.
In the UK, five neonicotinoid insecticides are authorised for use; acetamiprid, clothianidin, imidacloprid,
thiacloprid and thiamethoxam. Their main use in the UK has been the treatment of oilseed rape and sugar beet
seed, although they are also used on cereals, maize and some horticultural crops.
Various studies have implicated some neonicotinoids in the decline of bee and pollinator populations. It is
claimed that currently regulatory practices do not adequately assess the long-term and sub-lethal effects of such
pesticides. However, the science is contentious and other studies have found no effect on bees when
neonicotinoids are used in normal field situations18. Some parties maintain that the EU Commission has not
reviewed all of the available data in reaching the conclusion to withdraw clothianidin, imidacloprid and
thiamethoxam. A discussion of the science can be found in papers from Imperial College19 and the Royal
Society20.
2.5. OTHER ISSUES
2.5.1. UK Administration
Whilst approvals for active substances are undertaken at an EU level, product (PPP) authorisations are conducted
at a national level. In the UK the Chemicals Regulation Directorate (CRD) is the competent authority for PPP
approval. The CRD is an agency of the Health and Safety Executive and operates on clearly laid-out standards21.
Any application must be fully supported by data gathered through defined procedures.

The Andersons Centre CPA-NFU-AIC
October 2014 Page 11 of 67
As at September 2014, 250 active substances were contained in PPP approved for use in the UK22. Note that this
may seem high compared with the EU approved active substances figure outlined in section 2.2.1, but additional
active substances have been authorised at EU level since 2009.
Whilst product authorisation is a Member State activity, the EU has made efforts to harmonise and streamline the
process. Europe is divided into three zones (the UK is in the ‘central zone’). Member States in each zone can
share assessments and mutually recognise each other’s authorisations. In theory, this should avoid duplication and
make product registration in Europe more efficient – if authorisation is gained in one country, then it would be
valid in others in the same zone. However, the system is still relatively new and there is concern over the different
interpretations that may be adopted by different Member State regulators. In theory, if one country rejected an
application it is still possible to make an application in another Member State. But if the two Member States were
in the same zone then the first rejection could well ‘colour’ any subsequent applications.
Furthermore, Member States can have additional national assessments (such as the UK-specific worker exposure
model) which are carried out before an authorisation is granted. This can lead to products being authorised for use
in other Member States but not in the UK, placing UK producers at a competitive disadvantage.
The CRD is also responsible for ‘extension of authorisation for minor uses’ (EAMU) in the UK. Minor uses are
crops grown on relatively small areas or very specific uses on major crops. In these circumstances it is not always
commercially viable for specific authorisations to be sought (supplying the necessary data under the application
rules is an expensive undertaking). Very often, minor uses only have a limited number of products available. The
CRD can extend authorisation for products approved on large-scale crops to cover such minor uses. Because the
‘toolkit’ of pesticides is so small for many of these ‘minor crops’, the loss of any active substances can have a
significant effect.
Many minor crops rely heavily and in some cases solely on the use of EAMUs for plant protection. Often residue
data is not available from the manufacturers and data is generated and funded by the growers. There are European
Working Groups operating to coordinate trials across the European zones to avoid duplication of effort when
generating data to support minor use authorisations. In May 2014 the EU agreed to set up a ‘Minor Uses Fund’ to
try and improve access to pesticides. Farm Ministers have pledged €350,000 per year for the next three years to
support the co-operation and co-ordination of research projects to improve the availability of products in this
area. The European fund will be matched by Member States. However, the author has been informed that CRD
have indicated that they can only contribute ‘in-kind’ which may not be permissible under the scheme rules.
In many policy areas the UK Government is accused of ‘gold plating’ EU regulation with over-zealous
interpretation and enforcement of European laws. However, with pesticides regulation the CRD is generally
regarded as taking a pragmatic, science-based approach to application of regulation and DEFRA also argues the
case for science-led policy-making at an EU level. However, the UK is only one of 28 Member States and has
limited influence on the EU-level decision-making process.
There are some areas where the industry feels that the interpretation of the rules at a UK level could be more
flexible whilst still retaining safety. These cover the extension of products for minor uses (often in ‘emergency’
situations). The CRD is also perceived to be unwilling to take on risk mitigation measures and can be quite

The Andersons Centre CPA-NFU-AIC
October 2014 Page 12 of 67
prescriptive in the final level of operational rules imposed. An example would be the use of protective equipment
in preventing operator exposure.
CRD currently use a different worker exposure assessment to other Member States (UK POEM). Examples exist
where a product is authorised for use in ornamentals crops with a handling interval which is longer than the
harvest interval for the same product applied at the same rate in an edible crop – you can eat the crop before you
can touch it.
2.5.2. Pesticide Residue Levels
EU Regulation 396/2005 sets harmonised standards for Maximum Residue Levels (MRLs) across the EU. The
main issue in regulatory terms is the time that it takes to set MRLs for an active substance. This can delay
authorisation and thus prevent access to useful PPP (often products that have already been used elsewhere in the
world). It also adds cost to the authorisation process.
An example of where MRL may lead to restrictions is the product chlorpropham (CIPC). This is used as a sprout
suppressant in potato storage. It is important particularly in potatoes for processing (frying) where the crop is
stored at warmer temperatures. There is currently a stewardship group in place to ensure that MRL are not
exceeded (see www.cipccompliant.co.uk/).
A number of retailers have grower protocols which impose additional restrictions on the use of PPP. Even when
an active substance or product is authorised a retailer may choose not to buy produce treated with it. This is more
common in the horticulture sector than for broadacre arable crops because many horticultural crops are presented
to the consumer with minimal processing. As these restrictions are not specifically a regulatory issue they have
not been covered in this report
2.5.3. Commercial Considerations
Achieving authorisation (or re-authorisation) for an active substance or product is a costly and time-consuming
undertaking. The manufacturers of PPP are commercial organisations and have to provide a return for investors.
Some products, even if they are ‘safe’ under existing rules, will not be put forward for authorisations, as the
forecast profits from sales is not high enough to offset the high levels of investment in gaining authorisation. This
topic is looked at in more detail in Section 6.3.

The Andersons Centre CPA-NFU-AIC
October 2014 Page 13 of 67
3. THREATENED ACTIVE SUBSTANCES
3.1. DATA SOURCES
The availability of a number of key active substances will be threatened by the policies outlined in the previous
section. It is not possible to produce a definitive list, as some of the legislation (e.g. on endocrine disruptors) is
still to be agreed. This section will set out those ingredients that seem likely to be withdrawn.
The list has been compiled from previous studies outlined below. It has been cross-checked and refined further
through discussions with manufacturers, agronomists and academics.
3.1.1. Pesticides Approval Process
The starting point has been the analysis undertaken by the then Pesticides Safety Directorate (now the Chemicals
Regulation Directorate) published in December 200823. The list of pesticides contained in Annex 2C is widely
regarded as the most likely scenario for losses of pesticides under1107/2009. This was supplemented by a further
CRD study24 published in January 2009 following additional information on Endocrine Disruptors.
With work continuing on the definition of Endocrine Disruptors, a further report for the CRD from WRc 25 used
amended criteria to investigate a sample of UK-approved active ingredients (the impact of this was assessed in a
follow-up project for the CRD by FERA26). The work found that nine substances were ‘more risky’ to
mammalian health under the criteria – these are unlikely to gain authorisation. These have been characterised as
having a ‘high’ likelihood of being lost in the following list.
Another 31 substances were found to be ‘less risky’, but could be withdrawn depending on the precise criteria
used. These have been classed as having a ‘medium’ likelihood of being lost. The WRc study only looked at
around a quarter of the active substances authorised in the UK, so the effects would be wider than shown. Where
manufacturers have identified their own active substances as potential EDs, these have also been included. It must
be stressed that this list is the authors own estimation, and cannot be regarded as definitive in the absence of final
EU criteria.
3.1.2. Water Framework Directive
Any Priority Substances or Priority Hazardous Substances under the WFD are identified from Annex 1 of the EU
Proposal for an Amendment to the Water Framework Directive as regards Priority Substances27.
UK Specific Pollutants are from the document ‘Water Framework Directive: Implementation in England and
Wales’ published in May 201428.
The active substances likely to be affected by Article 7 rules are somewhat more uncertain. These have been
taken from the ADAS report on ‘The Impact of Changing Pesticides Availability on Horticulture’ of March
201029. It is supplemented by the Environment Agency’s ‘WFD Compliance Picture – Pesticides Breakdown’30.
This chart contains 29 active substances that have been detected in surface water drinking catchments in England.
This includes such important pesticides as chlorotoluron, glyphosate and metazachlor for example. However,
only five active substances are posing a risk to surface water in more than 20 out of a total of 560 DrWPAs in
The Andersons Centre CPA-NFU-AIC
October 2014 Page 14 of 67
England. These are metaldehyde, MCPA, carbetamide, mecoprop and propyzamide. The remaining active
substances pose a risk in fewer than 3.5% of DrWPAs (i.e. less than 20 out of 560). For this reason, they have
only been identified as having a ‘medium’ risk of having restrictions imposed. However, metazachlor has been
included as having a high likelihood of restrictions despite only appearing in 8 DrWPAs. This is because it is one
of the three key oilseed rape herbicides (along with carbetamide and propyzamide) and so there would be
substitution issues if restrictions were not placed on all of these. Bentazone has been included as being at a high
risk of being lost as there are specific problems with groundwater with this active substance.
3.1.3. Neonicotinoid
The three affected active ingredients are set out in Regulation 485/201331.
3.1.4. Other
At present, no losses from other sources have been identified.
3.2. POTENTIAL ACTIVE SUBSTANCES LOSSES
Table 1 below sets out the pesticides that could be potentially lost as a result of current policies. The text below
provides more detail on the structure of the list.
It should be noted at the outset that this list draws data from a large number of sources and attempts to present a
realistic picture of the situation as at autumn 2014. However, as the previous sections have indicated, the
legislation and definitions in many areas are not fixed. The list cannot be fully comprehensive, but aims to
provide a firm basis for the agronomic and economic analysis that follows.
3.2.1. List of Active Substances Under Threat – Column 1
The active substances are grouped according to their function (insecticides, herbicides etc.). Those highlighted in
blue can also be used as seed treatments. The active substances are presented alphabetically.
3.2.2. Why and Source – Columns 2 & 3
Column 2 (‘Why?’) sets out the policy or policies that are threatening the product. Where an active ingredient is
being threatened by more than one policy, only the most serious threat is shown.
The legislation potentially impacting on active substance availability is shown in Column 3 (‘Source’). The
asterix ‘*’ denotes an active substance not assessed in the most recent WRc assessment25 and where the earlier
CRD report suggested a possible ban.
In most cases the list has been restricted to active substances used in the UK. However, a handful of substances
that are not currently used have been included. These have approval for use in the UK and have often been used

The Andersons Centre CPA-NFU-AIC
October 2014 Page 15 of 67
historically before superior replacement pesticides became available. They may have uses in the UK if other
active substances are restricted. Therefore these substances have been included for completeness.
3.2.3. Likelihood - Column 4
This is a subjective judgement based on a reading of the available literature and discussions with the wider
industry. With such high regulatory uncertainty, and definitions still to be set, it is reasonable that different
conclusions could be reached.
The labels have been kept deliberately vague to reflect the degree of inherent uncertainty. To provide some
guidance on these;
High – assumed the active substance will be withdrawn in the short-to-medium term. Although it is
difficult to be precise on timings, it can be considered that this is the next 5 to 7 years. All pesticides listed
as having a ‘high’ likelihood of loss will be included in the economic analysis that follows
High (by crop) – for example the neonicotinoid ban that only applies to certain crops
High (catchment) – restrictions in certain geographic areas arising out of the WFD. ‘Catchment’ in this
context also covers DrWPAs.
Medium – authorisations could be lost, but there is some uncertainty on this, or the disappearance may be
over the longer-term
3.2.4. Area Treated - Column 5
This data comes from the Pesticides Usage Surveys conducted by FERA32. It shows the total arable hectares
where an active substance was used in cropping year 2011/2012 (i.e. harvest 2012) – either singly, or in a mix.
What is shown is ‘super developed hectares’ – simplistically, this is the area of crop multiplied by the number of
applications of an active substance that the area receives. In this context, ‘arable’ means all the mainstream
combinable crops in the UK, plus potatoes and sugar beet. It is designed to demonstrate the relative importance of
each active substance listed.
Where the column states ‘not listed separately’ this means the substance is used in the UK on arable crops, but on
small areas so that it is not picked up individually in the FERA survey.
Some of the pesticides are not used on these arable crops, but are very important, either in grassland and forage
crops, or in the horticultural sector. Such active substances are identified.

The Andersons Centre CPA-NFU-AIC
October 2014 Page 16 of 67
Table 1 – Active Substances Potentially under Threat in the UK
Insecticides Why? Source Likelihood of Loss Area Treated 2012
1 abamectin 1107/09 - Endocrine Disruption WRc 2013 High used on field veg
2 beta-cyfluthrin 1107/09 - Endocrine Disruption WRc 2013 Medium 220,0573 bifenthrin 1107/09 - PBT / vPvB CRD 2008 2C High not listed separately
4 clothianidin Bee Health - Neonic. EU Restriction High (by crop) 313,0885 chlorpyrifos WFD - Priority Substance EU List High 68,3146 cypermethrin WFD - Priority Substances EU List High 1,496,6107 deltamethrin 1107/09 - Endocrine Disruption CRD 2009* Medium not listed separately
8 dimethoate 1107/09 - Endocrine Disruption CRD 2009* Medium not listed separately
9 esfenvalerate 1107/09 - PBT CRD 2008 2C High 299,22010 imidacloprid Bee Health - Neonic. EU Restriction High (by crop) not listed separately
11 lamda-cyhalothrin 1107/09 - Endocrine Disruption WRc 2013 Medium 1,460,96512 permethrin WFD - UK Specific Pollutant DEFRA List High (catchments) not listed separately
13 spinosad 1107/09 - Endocrine Disruption WRc 2013 Medium used on field veg
14 spiromesifen 1107/09 - Endocrine Disruption WRc 2013 Medium minor hort use
15 spirotetremat 1107/09 - Endocrine Disruption WRc 2013 Medium minor hort use
16 thiacloprid 1107/09 - Endocrine Disruption CRD 2009* High 79,92517 thiamethoxam Bee Health - Neonic. EU Restriction High (by crop) not listed separately
Fungicides Why? Source Risk Area Treated 2012
18 bupirimate 1107/09 - Endocrine Disruption WRc 2013 Medium used on fruit crops
19 captan WFD - Article 7 ADAS 2010 Medium used on fruit crops
20 carbendazim 1107/09 - Mutagenic CRD 2008 2C High 409,96721 chlorothalonil WFD - UK Specific Pollutant DEFRA List High (catchments) 2,713,24122 cyproconazole 1107/09 - Endocrine Disruption CRD 2009* High 1,326,95823 difenoconazole 1107/09 - Endocrine Disruption CRD 2009* Medium 138,04324 dinocap 1107/09 - Endocrine Disruption CRD 2009* High small use on fruit crops
25 epoxiconazole 1107/09 - Cut-off Criteria / ED CRD 2009* High 4,018,14826 fenbuconazole 1107/09 - Endocrine Disruption CRD 2009* High used on fruit crops
27 fluazinam 1107/09 - Endocrine Disruption WRc 2013 High 377,60228 fluquinconazole 1107/09 - Endocrine Disruption CRD 2009* Medium 79629 folpet 1107/09 - Endocrine Disruption CRD 2009* Medium 380,79530 hymexazol 1107/09 - Endocrine Disruption WRc 2013 Medium not used in UK
31 iprodione 1107/09 - Endocrine Disruption CRD 2009* High not listed separately
32 mancozeb 1107/09 - Endocrine Disruption WRc 2012 High 546,15233 mandipropamid 1107/09 - Endocrine Disruption WRc 2013 Medium 240,25334 maneb 1107/09 - Endocrine Disruption CRD 2009* High not used in UK
35 metconazole 1107/09 - Endocrine Disruption CRD 2009* High 959,51536 metiram 1107/09 - Endocrine Disruption CRD 2009* Medium not used in UK
37 myclobutanil 1107/09 - Endocrine Disruption CRD 2009* Medium used on fruit crops
38 penconazole 1107/09 - Endocrine Disruption CRD 2009* Medium used on fruit crops
39 prochloraz 1107/09 - Endocrine Disruption WRc 2013 Medium 1,194,91340 propiconazole 1107/09 - Endocrine Disruption CRD 2009* Medium not listed separately
41 prothioconazole 1107/09 - Endocrine Disruption WRc 2013 Medium 4,834,55942 quinoxyfen 1107/09 - vPvB CRD 2008 2C High used on fruit crops
43 silthiofam 1107/09 - Endocrine Disruption WRc 2013 Medium 192,36244 tebuconazole 1107/09 - Endocrine Disruption WRc 2013 Medium 3,092,64645 tetraconazole 1107/09 - Endocrine Disruption CRD 2009* Medium not used in UK
46 thiophanate-meythl 1107/09 - Endocrine Disruption WRc 2013 Medium not listed separately
47 thiram 1107/09 - Endocrine Disruption WRc 2013 Medium 128,99048 triademenol 1107/09 - Endocrine Disruption CRD 2009* Medium not listed separately
49 triticonazole 1107/09 - Endocrine Disruption CRD 2009* Medium not listed separately

The Andersons Centre CPA-NFU-AIC
October 2014 Page 17 of 67
* not assessed by WRc, earlier CRD report suggested possible ban # unlikely to be supported for Annex I renewal
3.2.5. Candidates for Substitution List
The Candidates for Substitution have been derived from the proposed list drawn up by the Food Chain Evaluation
Consortium (FCEC) referred to in section 2.2.6. This has been consolidated to cover only those products
authorised in the UK. The PSD assessment of May 2008 listed a larger number of active substances (referenced
in the summary impact assessment in Jan 200924) but it is the authors belief that the products shown in the
following section are those now more likely to be included.
They have been listed separately as there is considerable uncertainty around the comparative assessment process.
Following discussions with industry representatives it has been concluded that, whilst there may be large
Herbicides Why? Source Risk Area Treated 2012
50 2,4-D WFD - UK Specific Pollutant DEFRA List High (catchments) used on forage crops
51 amitrole 1107/09 - Endocrine Disruption CRD 2009* High used on fruit crops
52 asulam WFD - Article 7 ADAS 2010 Medium used on forage crops
53 bentazone WFD - Article 7 (Groundwater) EA Compliance High (catchments) not listed separately
54 bifenox WFD - Priority Substance EU List High 98,24255 carbetamide 1107/09 - Endocrine Disruption EA Compliance High (catchments) 72,27056 chlorotolurun WFD - Article 7 EA Compliance Medium 290,22257 chlorpropham 1107/09 - Endocrine Disruption WRc 2013 Medium used on field veg
58 clopyralid WFD - Article 7 EA Compliance Medium (C'ments) 282,53259 dimethenamid-P 1107/09 - Endocrine Disruption WRc 2013 Medium 174,56760 ethofumesate 1107/09 - Endocrine Disruption WRc 2013 Medium 120,71161 fluazifop-p-butyl 1107/09 - Endocrine Disruption WRc 2013 Medium 130,76662 flumioxazine 1107/09 - Cut-off Criteria / ED CRD 2009* High not listed separately
63 fluometuron 1107/09 - Endocrine Disruption CRD 2009* Medium not used in UK
64 fluroxypyr WFD - Article 7 ADAS 2010 Medium 1,037,40865 glufosinate 1107/09 - Endocrine Disruption WRc 2013 Medium not listed separately
66 glyphosate WFD - UK Spec. Poll'nt (candidate) DEFRA List Medium (C'ments) 1,620,43867 ioxynil# 1107/09 - Endocrine Disruption WRc 2013 High 131,18368 linuron 1107/09 - Endocrine Disruption CRD 2009* High 90,92569 lenacil 1107/09 - Endocrine Disruption WRc 2013 Medium 51,41770 MCPA WFD - Article 7 EA Compliance High (catchments) used on forage crops
71 MCPB WFD - Article 7 ADAS 2010 Medium used on forage crops
72 mecoprop WFD - UK Specific Poll'nt / Art 7 DEFRA List High (catchments) 708,68673 metazachlor WFD - Article 7 EA Compliance High (catchments) 552,03674 metribuzin 1107/09 - Endocrine Disruption WRc 2013 Medium 96,81475 molinate 1107/09 - Endocrine Disruption CRD 2009* High not used in UK
76 pendimethalin 1107/09 - PBT CRD 2009* High 1,333,91977 picloram 1107/09 - Endocrine Disruption CRD 2009* Medium 165,14678 pinoxaden 1107/09 - Endocrine Disruption WRc 2013 Medium 409,60979 propyzamide WFD - Article 7 EA Compliance High (catchments) 406,02480 S-metolachlor 1107/09 - Endocrine Disruption WRc 2013 High used on forage crops
81 tepraloxydim 1107/09 - Endocrine Disruption WRc 2013 Medium 192,80982 terbuthylazine 1107/09 - Endocrine Disruption WRc 2013 High not listed separately
83 tralkoxydim 1107/09 - Endocrine Disruption CRD 2009* Medium not listed separately
84 triflusulfuron 1107/09 - Endocrine Disruption CRD 2009* Medium 98,163
Other Why? Source Risk Area Treated 201285 metam sodium 1107/09 - Endocrine Disruption CRD 2009* Medium 86 metaldehyde WFD - Article 7 EA Compliance High (catchments) 701,47787 methiocarb 1107/09 - Bird Safety EU Restriction High (by use)
The Andersons Centre CPA-NFU-AIC
October 2014 Page 18 of 67
additional information-provision requirements on manufacturers, this element of policy will not result in many, if
any, product losses. This is because resistance issues, minor uses and economics are considered for each crop use
at a Member State level.
There may be issues where a Candidate for Substitution is withdrawn for commercial reasons in another Member
State where other alternatives which meet the criteria in section 2.2.6 exist. In this case, if the active substance
had a major use in the UK or a unique use this would have a significant impact. However, this is not covered in
the analysis.
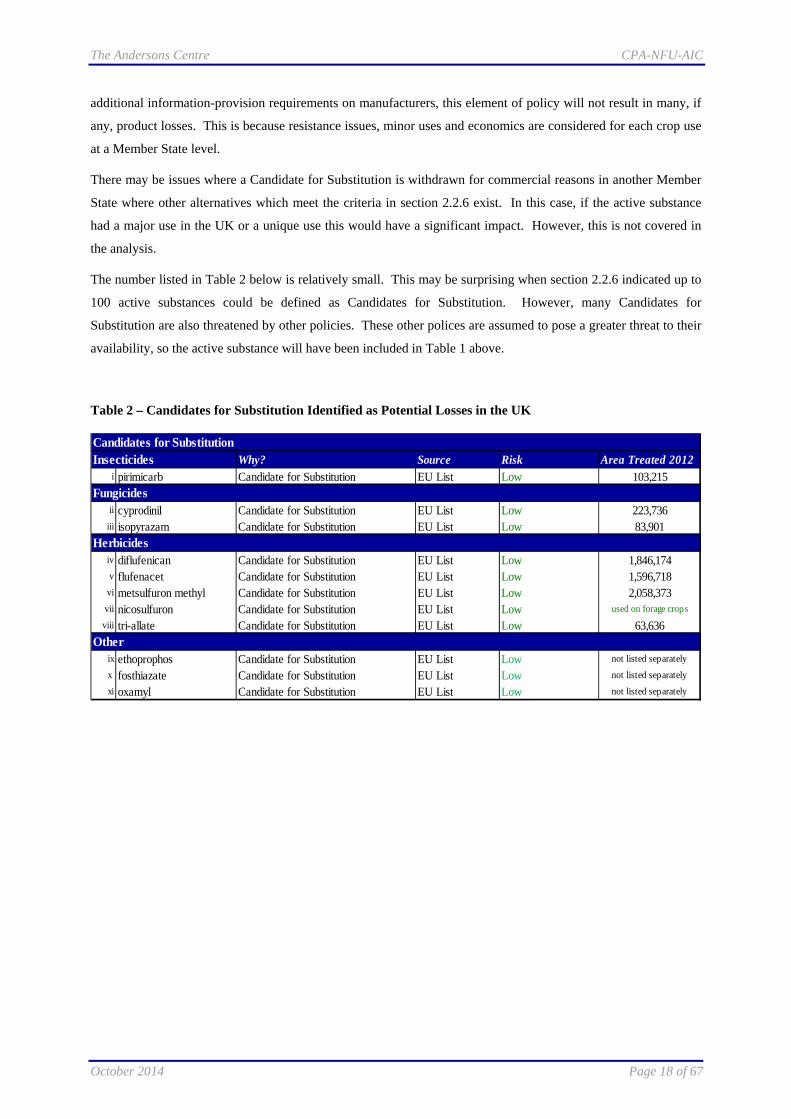
The number listed in Table 2 below is relatively small. This may be surprising when section 2.2.6 indicated up to
100 active substances could be defined as Candidates for Substitution. However, many Candidates for
Substitution are also threatened by other policies. These other polices are assumed to pose a greater threat to their
availability, so the active substance will have been included in Table 1 above.
Table 2 – Candidates for Substitution Identified as Potential Losses in the UK
Candidates for SubstitutionInsecticides Why? Source Risk Area Treated 2012
i pirimicarb Candidate for Substitution EU List Low 103,215Fungicides
ii cyprodinil Candidate for Substitution EU List Low 223,736iii isopyrazam Candidate for Substitution EU List Low 83,901
Herbicidesiv diflufenican Candidate for Substitution EU List Low 1,846,174v flufenacet Candidate for Substitution EU List Low 1,596,718
vi metsulfuron methyl Candidate for Substitution EU List Low 2,058,373vii nicosulfuron Candidate for Substitution EU List Low used on forage crops
viii tri-allate Candidate for Substitution EU List Low 63,636Other
ix ethoprophos Candidate for Substitution EU List Low not listed separately
x fosthiazate Candidate for Substitution EU List Low not listed separately
xi oxamyl Candidate for Substitution EU List Low not listed separately

The Andersons Centre CPA-NFU-AIC
October 2014 Page 19 of 67
4. EFFECT OF ACTIVE SUBSTANCE LOSS
4.1. GENERAL
4.1.1. Crops
UK agriculture is incredibly diverse and grows a vast range of crops. Some of these are more important than
others in terms of land area covered, value produced, and proportion of domestic food supply. Therefore this
report focuses on a number of key crops produced in the UK;
Winter wheat
Winter barley
Winter oats
Winter oilseed rape
Field beans
Peas
Sugar beet
Potatoes
Carrots
Onions
Apples
4.1.2. Methodology
For each crop the most important pests are considered. Then, taking into account the likely active substances
from Section 3.2 that could be lost, an estimate of effects is outlined. Note that for this analysis, it is only those
active substances that have been deemed to be at a ‘high’ risk of being lost that have been included in the
analysis.
Where multiple products are in danger, the cumulative effects are highlighted.
In this section the main focus will be on the level of yield loss. However, other factors will be noted for inclusion
in the later analysis. These include;
Reduction in crop quality and effects on human and animal health
Effect on rotations
Effect on husbandry practices (e.g. greater use of cultivations, spray passes etc.)
Medium/long term effects such as the build-up of resistance
This information has been gathered from previous reports, but updated and expanded through discussions with
academics, agronomists, public bodies and pesticide manufacturers. For confidentiality, names have been
withheld.
In particular, the methodology and figures used in two ADAS reports33 34 on the effects of the loss of PPP have
been used. However, amendments have been made where the active substances listed in Table 1 of this study
differ from those considered threatened in the earlier reports.

The Andersons Centre CPA-NFU-AIC
October 2014 Page 20 of 67
Some of the land worst-affected by a pest may cease growing that particular crop if control options are restricted.
The yield losses shown are those that apply on the remaining cropped area.
4.2. PROBLEM AREAS
Following the loss of some PPP, control of key pests will become more difficult. As stated above, this will not
only have an effect on yield, but also on crop quality and safety. Table 2 below summarises these effects for the
crops under investigation. It is not designed to be fully comprehensive, but highlights the key issues.
It will be seen that, in many cases, these weeds, pests and diseases impact on multiple crops covered in this study.
To save repetition, these problem weeds, pests and diseases are discussed in general terms in this section.
Sections 4.3 to 4.7 then look at crop-specific factors – concentrating on yield issues.
4.2.1. Summary Table
This table highlights the effect of the loss of PPP on important crops for UK agriculture and horticulture.
Table 3 – Summary of Problem Areas
Crop Yield Losses Quality Losses Human/Animal Health Issues
Winter Wheat blackgrass, other grass weeds, broad-leaved
weeds, septoria, yellow rust, slugs, and aphids
- fusarium (mycotoxins), ergot
Winter Barley blackgrass, other grass weeds, broad-leaved
weeds, mildew, slugs, and aphids
- fusarium - limited
Winter Oats grass-weeds, broad-leaved weeds, mildew, slugs, and
insects
- fusarium - limited
Winter Oilseed Rape turnip yellow virus, slugs, broad-leaved weeds, grass-weeds, sclerotinia, phoma,
volunteer cereals,
cleavers -
Peas grass-weeds, broad-leaved weeds, downy mildew,
botrytis
fungal diseases (see left) affecting colour and stain, pea moth, potato berries
potato berries
Field Beans grass-weeds, broad-leaved weeds, chocolate spot
chocolate spot -
Sugar Beet volunteer cereals, broad-leaved weeds, grass-weeds,
powdery mildew, rust, slugs, beet cyst nematode, leatherjackets and other
insects
- -
Potatoes blight, potato cyst nematode (PCN), slugs,
insects, volunteer cereals, broad-leaved weeds, grass-
PCN, wireworm, slugs, leatherjackets, fungal diseases (rots, canker,
scurf etc.)
-

The Andersons Centre CPA-NFU-AIC
October 2014 Page 21 of 67
weeds
Carrots broad-leaved weeds, grass-weeds, volunteer potatoes,
slugs
carrot fly, cutworm -
Onions downy mildew, botrytis, broad-leaved weeds, grass-weeds, volunteer potatoes,
slugs
fungal diseases (see left) -
Apples broad-leaved weeds, grass-weeds
apple scab, insect damage, moths
-
4.2.2. Grass Weeds
The ADAS Crop report for June 201435 found that at the end of May 2014, 58% of the UK wheat area contained
black-grass with 22% expected to suffer a moderate yield loss of 5% or more, and 0.5% of the area (around 9,000
Ha) of the crop expected to be destroyed before harvest to reduce blackgrass seed return. Blackgrass is an
increasing problem in the UK with it spreading out of its traditional heartlands of south and eastern England
further west and north. It is also becoming more prevalent on soil types other than the heavy clay soils with which
it has historically been associated.
Its spread has been caused by the increasing area of autumn cropping, and a move to earlier planting (before the
end of September). This means more of the blackgrass plants emerge with the autumn cereals crop, rather than
beforehand where they can be more easily destroyed. The geographic spread has likely been through the
movement of seeds in hay and straw and also on agricultural machinery.
A number of active ingredients used for blackgrass control have already been lost including trifluralin,
isoproturon, and chlorotoluron. This has led to a reliance on a smaller group of pesticides to control the weed and
resistance has built up as a consequence. According to a recent study36 herbicide resistant blackgrass is now very
widespread and is estimated that some degree of resistance occurs on at least 80% of farms that spray regularly to
control the weed.
Yield losses occur due to the blackgrass competing directly with the crop. Data suggests that up to 50% crop
losses are possible in untreated cereal crops where blackgrass populations are high. Manufacturers are searching
for active substances with alternative modes of action to control resistant blackgrass however regulatory hurdles
are making this more difficult. Little or no new chemistry is expected to be developed in the foreseeable future.
Non chemical methods have recently been reviewed37, but whilst they have potential and are being adopted by
farmers, they cannot substitute for herbicides completely.
Of the other grass weeds commonly found in arable rotations, the most important are annual meadowgrass,
ryegrass, barren brome and wild oats. These compete with the crop directly and also cause contamination of
harvested crop (so that it does not meet milling, malting or seed standard). Traditionally, isoproturon (IPU) was a
key element in controlling these grass weeds until its authorisation in the UK was revoked (it has now been
authorised at low-doses to control meadowgrass). Alternative herbicides exist which currently provide good
levels of control. Whilst the resistance issues are not as severe as with blackgrass, resistant ryegrass and wild oats
are widespread in England36. Any change in the active ingredients that are available will make control more
difficult and expensive.

The Andersons Centre CPA-NFU-AIC
October 2014 Page 22 of 67
Losses where crops are untreated can be up to 50% for heavy infestations of ryegrass and wild oats, 10% for
meadowgrass, and 5-10% for brome.
Historically, couchgrass was a major problem in UK cereal crops. This problem has been controlled almost to the
point of irrelevance with the current armoury of crop protection products.
Work, funded by the HGCA38 has been undertaken to develop strategies for grass weed control in cereals without
key active ingredients. This focusses on ‘stacking’ (applying more than one active ingredient or herbicide product
at the same time) and ‘sequencing’ (when different active ingredients or mixtures of active ingredients are applied
in close succession). This is already being practiced on farm.
Whilst grass weeds are more often primarily thought of as a problem in combinable crops, Table 2 above shows
that they are also significant in root, vegetable and fruit crops. As with combinable crops, the weeds compete
with the crop for water and nutrients and result in restricted growth.
4.2.3. Broadleaved Weeds
This includes cleavers (a particular problem in oilseed rape), mayweed, chickweed, poppies thistles and others of
less economic significance. All of these weeds compete with the crop for nutrients, water and light, so their
presence in large numbers reduces yield. In some cases, especially with vegetable crops, they can contaminate the
saleable crop, resulting in price deductions or rejections.
The presence of broadleaved weeds can create a micro-climate in the growing crop near the soil. This can favour
the development of disease.
The most important of these weeds is cleavers, with up to 15% yield loss in untreated crops. The other
broadleaved weeds will usually cause losses from 1% to 10%. They can cause higher losses in spring wheat than
winter wheat as they compete more vigorously with the growing crop.
Up until now, the herbicides used to control grassweeds in cereals have also provided good control of broadleaved
weeds. In some European countries broadleaved weeds that are resistant to Acetolactate Synthase (ALS)
inhibiting sulfonylurea herbicides have been found. Populations of ALS-resistant poppy, chickweed and
mayweed have now been found in the UK36. This is likely to be an increasing problem in future years.
4.2.4. Volunteers
Where high-value crops such as sugar beet, potatoes, carrots and onions are grown this tends to be in a rotation
with cereals. To reduce crop competition it is necessary to control ‘volunteer’ cereals that germinate from seeds
shed at harvest. In this context, the cereal is simply a weed – competing for nutrients, water and light against the
main crop.
In addition, high-value crops tend to be grown on the ‘best’ land (fertile, well-drained, good soils, accessible to
machinery and processors etc.). The area of such land in the UK is limited, so crops often are grown in the same
rotations. This means, for example, that those growing carrots and onions are required to control volunteer

The Andersons Centre CPA-NFU-AIC
October 2014 Page 23 of 67
potatoes. Another example is the need to control volunteer potatoes in peas (especially vining peas) to prevent
potato berries (also known as potato apples) contaminating harvested peas.
4.2.5. Non-Selective Herbicides (Desiccants)
Non selective herbicides control most vegetation to which they are applied. They are widely used to control
volunteers and other weeds prior to planting and are also used to desiccate crops prior to harvest. This ensures an
even level of crop maturity, reduces moisture content from growing weeds, and makes harvesting easier.
The most commonly used desiccant in the UK is glyphosate. This is a systemic herbicide in that it is absorbed by
leaves, and translocated to all plant tissues (including the roots). It is a key part of the crop production process in
the crops being looked at in this study. For the purposes of this study it has been assumed that there will be no
additional restrictions placed on its use.
4.2.6. Diseases
All fungal diseases vary from season-to-season depending on climatic and agronomic conditions. A disease that
causes significant losses one year, can be relatively innocuous the next.
The key fungal disease in wheat in the UK is septoria tritici. This causes lesions on the leaf which reduce the
photosynthetic area and hence yield. According to an HGCA publication39 losses can be as high as 30-50%, with
susceptible varieties seeing average losses of 20% when left untreated. The ADAS study34 assumes an average of
10% yield loss.
The azole group of fungicides has been the main treatment for septoria. Almost all crops are treated and the
HGCA suggests that an average of 2.85 azole treatments per crop is undertaken. The effectiveness of many older
azole products has declined as septoria has developed resistance to them. The main azole control options in the
UK are now epoxiconazole and prothioconazole.
Alternative control options are chlorothalonil, mancozeb and folpet which are protectant, but provide no curative
action. A group of SDHI fungicides including biaxfen, boscalid, fluxapyroxad and isopyrazam also provide
control against septoria. However, these have only one site of action, and so the probability of resistance
developing if not used in conjunction with the azoles is high.
Other fungal diseases that affect wheat plants are yellow rust, brown rust and mildew. All of these diseases are
currently well-controlled with azoles, SDHIs and the strobilurin group of fungicides. For yellow rust, losses in
untreated susceptible varieties can be as high as 50%. However, the ADAS report suggests untreated losses of 5%
on average. The equivalent figures for brown rust and mildew are 2.5% and 2% respectively.
In barley and oats septoria is not an issue and mildew is more important. Control options for the disease are
generally good and predicted PPP losses would only have a minimal effect.
Fusarium fungal infections can produce mycotoxins which can be toxic to humans and animals. Consequentially,
there will be problems in achieving safe food where control of mycotoxins is reduced or limited from the loss of
products. This issue is greatest in wheat but potentially affects all cereals. Maximum legal limits for the presence

The Andersons Centre CPA-NFU-AIC
October 2014 Page 24 of 67
of mycotoxins have been set40 in grain intended for human consumption. The main fungal mycotoxins of concern
are deoxynivalenol (DON) and zearalenone. The azole group of fungicides has been effective in controlling the
disease, but a large number of these products are at risk as set out in Section 3.2.
Take-all is the key disease infecting the roots of wheat plants. It is the main cause of yield reductions in second
and subsequent wheat crops. This can amount to 10-20% depending on soil type and disease pressure. Control of
the disease is mainly through seed dressing (silthiofam and fluquinconazole). It is less of a problem in other
cereal species.
In oilseed rape the main fungal diseases are phoma leaf spot and light leaf spot. Phoma has historically been more
prevalent in south and eastern England whilst light leaf spot was more common in Scotland and northern England.
However, the diseases now overlap to a large extent with 90% of the oilseed crop potentially affected by phoma
and three-quarters by light leaf spot. Phoma can invade the stem and cause cankers. Untreated the disease can
reduce yields by 10%. Light leaf spot causes slightly lower losses (5-10%). The main treatment from both
diseases is prothioconazole which should remain available. Additional control is achieved through tebuconazole,
fusilazole and metconazole. The latter two are likely to be lost so there will be some effect on yields.
Sclerotinia is the major disease in oilseed rape at flowering. Affected plants can suffer up to 50% yield loss41 but
attacks are very variable from season to season. Prothioconazole is the main active substance used to control the
disease. This should remain available, so minimal losses from the disease are assumed in the model. However, if
prothioconazole lost its authorisation it would severely compromise control options. Peas, potatoes, carrots and
other vegetable crops are all also susceptible to sclerotinia. The fungi alternaria and powdery mildew also infect
oilseed rape, but tend to be controlled by the pesticides used for the leaf spots and sclerotinia.
Turnip yellows virus (TuYV) is a major threat in oilseed rape. The disease is spread by the peach potato aphid so
control is discussed in the ‘Insect Pests’ section below. It can decrease yields by up to 30%.
Powdery mildew is a serious disease in sugar beet, peas and onions. In beet, yield losses from the fungus can be
as high as 20% if it is untreated. The main active substance used to control the disease in beet is cyproconazole.
Both cyproconazole and epoxiconazole which is also used in beet fungicide programmes are both likely to be lost,
leaving difenoconazole as the main treatment.
In onions mildew causes leaf loss and the failure of bulbs to mature. Foliar diseases also affect storage ability.
All onion crops are affected by the disease with significant losses (over 50% of marketable yield) in untreated
crops. The loss of mancozeb would be hugely significant to onion production with chlorothalonil also important.
The latter is also important for mildew control in peas (along with metconazole).
Sugar beet is also susceptible to rust, ramularia, and cercospora. The former is the most important of these with
yield losses of up to 14% possible. The active substances for mildew (i.e. mainly cyproconazole, plus
epoxiconazole) also control these at present, with the same issues around future pesticide availability.
Botrytis is an issue in a number of crops, but most notably in peas and onions. In peas it causes the rotting of
stems and pods. This both reduces yield directly and can cause blemishing of the produce reducing its saleability.
The effect of these diseases can be variable from year to year (depending on weather conditions and other
environmental factors). It is assumed that 10% of the crop will be affected on average each year, but some years
the proportion would be much greater. At present, botrytis is effectively controlled in peas by chlorothalonil (in

The Andersons Centre CPA-NFU-AIC
October 2014 Page 25 of 67
conjunction with cyproconazole and metconazole). All of these products are identified as being highly likely to
be lost in Section 3.2. Azoxystrobin, boscalid and pyraclostrobin would remain but control would be less
effective. All onion crops are potentially at risk from botrytis (both leaf spot and neck rot). Chlorothalonil is,
again, the most important control option although iprodione is also used. Both these active ingredients would be
lost and control would be difficult.
In beans, chocolate spot is the most important disease, caused by two fungi from the botrytis family. It is a wet
weather disease and causes greatest damage in winter crops although it can also reduce yields and quality in
spring beans. Chlorothalonil is a widely used product. If this was lost (or restrictions were placed upon it) then
the use of tebuconazole is likely.
Possibly the most ‘famous’ plant disease is blight in potatoes. This fungal disease was the cause of the Irish
potato famine and remains a problem for growers to this day. All potato crops are at risk from blight (more
properly known as ‘late blight’) and will receive multiple fungicide treatments. The disease spreads rapidly
causing rotting of the potato leaves and stem. Yield losses of 50% are common in untreated crops, with almost
total yield loss possible if the crop is infected early in the season. A range of active substances are used to control
the disease. A number of these have a ‘high’ probability of being withdrawn from use. Although alternatives will
remain, the ‘toolkit’ for blight control will be severely reduced.
For top fruit, the appearance of the product is vital. Consumers and retailers will reject fruit that is blemished or
imperfect. Apple scab is a fungal disease that causes lesions on the leaves, buds and fruit. The whole crop can be
potentially affected, but the variety Gala is particularly susceptible. Left untreated losses can be as high as 70%,
but more usually are around 10%. Treatment programmes are currently successful, but the widely used fungicide
fenbuconazole would be lost. Other fungal diseases of apples include mildew, brown rot and fruit rot. These are
mostly well-controlled and losses are relatively low.
4.2.7. Slugs
Slugs are a problem in almost all of the crops being studied in this report to a greater or lesser extent (with the
exception of apples). An example of this can be seen in the wheat crop. A recent HGCA study42 found that 22%
of the UK wheat area was affected by slugs. The estimated average yield loss across this area was 5%, but in
some cases losses can be far greater.
In all crops, slugs cause crop damage by hollowing out seed before crop emergence as well as grazing on
cotlyledons and small plants.
The three products used to control slugs in UK crops are methiocarb, ferric phosphate and metaldehyde. The EU
has withdrawn approvals for the use of methiocarb as a slug pellet after 19th September 2015 due to computer-
modelled effects assumed for grain-eating farmland birds. This leaves metaldehyde and ferric phosphate as the
slug control options. Biological control of slugs using nematodes is available43. However, it is presently not fully
reliable and expensive and so is only used on high value crops in controlled environments.
Metaldehyde is found in water sources and its prevalence may increase with the loss of methiocarb. Under the
WFD, restrictions may be imposed on its use. The Metaldehyde Stewardship Group44 was formed in 2009 to
develop and disseminate best practice advice for the use of metaldehyde with the aim of reducing metaldehyde

The Andersons Centre CPA-NFU-AIC
October 2014 Page 26 of 67
movement to water. However, this may not be successful and restrictions on the use of the active substance are
considered probable.
The area of a specific crop caught by catchment/DrWPA restrictions is likely to vary. This is covered in more
details in the specific crop sections that follow.
4.2.8. Nematodes
Nematodes are a particular issue in the potato crop, but also affect sugar beet and root vegetables. The three key
products used to control potato cyst nematodes (PCN) are all assumed to remain available (ethoprophs,
fosthiazate, oxamyl). However, their longer-term future is in some doubt as their most recent re-approval was
considered marginal under current standards.
Free-living nematodes are a potential threat in potatoes, sugar beet and carrots. In sugar beet they cause ‘docking
disorder’, and ‘fanging’ in carrots. Aldicarb was the traditional control option but this lost its approval for use in
2007. However the products benfuracarb, fosthiazate and oxamyl provide effective control and should continue to
be available.
4.2.9. Insect Pests
In cereals, insect pests are primarily a problem as vectors of disease. Aphids transmit barley yellow dwarf virus
(BYDV), which affects wheat, barley and oats. Early drilling has seen this problem become more widespread as
aphids transfer to the newly-planted crop from ploughed-down grasses and volunteer cereals. The aphid
population varies by year so the effect of the disease is variable. Early infections can kill patches of plants and
yield losses in untreated cereals crops are suggested to be around 2%.
Wheat can also be affected by orange wheat blossom midge (OWBM) and wheat bulb fly. OWBM adults lay
eggs inside the emerging wheat ears and after hatching the larvae feed on the developing grain, impacting yield
and quality. The larvae of wheat bulb fly attack wheat shoots between January and March, causing the stem or
tiller to die and reducing yield. On average, these pests, along with BYDV are assumed to affect around a third
of the wheat crop in the average year. Other cereals are subject to attack from leatherjackets, frit flies and gout
flies. The yield effect of these is limited however.
In oilseed rape the two key insect pests are cabbage stem flea beetle and aphids – the latter acting as a vector for
turnip yellows virus. Adult cabbage stem flea beetles feed on the cotyledons and leaves of oilseed rape from crop
emergence. Eggs are laid in the soil over a period of a few weeks. Newly hatched larvae tunnel into the leaf stalks
and plant stems between October and early April and can destroy the growing points of the crop, before returning
to the soil to pupate.
The peach potato aphid is the main vector of turnip yellows virus (TuYV) in oilseed rape. The virus decreases
yield by reducing the number of primary branches, the numbers of seeds per pod and the percentage of oil per
seed pod.
Both of these insect pests have historically been controlled by neonicotinoid seed treatments. A study by the
HGCA45 has suggested that the average yield loss from TuYV in untreated crops is 15%, although yield losses of

The Andersons Centre CPA-NFU-AIC
October 2014 Page 27 of 67
up to 30% can occur. The same study suggested that the average yield losses due to cabbage stem flea beetle are
about 1%. However, the study did point out that, in some instances, yield losses may be much higher. In the
absence of neonicotinoid seed dressings for autumn 2014 plantings, it is reported46 that 2.7% of the national
winter oilseed rape crop has been completely lost as a result of cabbage stem flea beetle losses. There are also
likely to be yield losses on crops that have not completely failed, but the extent of this will only become fully
apparent later in the season.
Pollen beetles also affect oilseed rape. The effect on yield is usually relatively modest, but in situations where
pest populations are high, losses can be severe without control.
In sugar beet the main pests are leatherjackets, cutworms, aphids, and moths. Of these leatherjackets have the
potential to cause the greatest yield loss (up to 15%). However, they are only a problem on a small percentage of
the beet crop. Peach potato aphids carry the Beet Mild Yellowing Virus (BMYV) as well as causing direct
feeding damage to the plant together with black bean aphids, flea beetles and leaf borers. Caterpillars (such as
the silver Y moth) also damage beet plants. There are only a limited number of insecticide sprays available for
use on sugar beet and control of these pests is achieved by seed treatments. As a non-flowering plant, it is
assumed that neonicotinoid seed treatments will continue to be allowed.
The peach potato aphid causes damage to potatoes through direct feeding damage and by transmission of viruses
including potato leaf roll and potato virus Y. All potato crops are potentially at risk, and untreated losses are
around 5%.
The main pest in carrots is carrot fly. Through direct feeding, they cause the stunting of young plants, which
severely reduces crop value, and may, in severe infestations, render the crop unsellable. Other pests are the
willow-carrot aphid, which affects yield by direct feeding damage and transmission of parsnip yellow fleck virus
and carrot mottle virus. These viruses stunt root growth and result in high yield losses. Finally cutworms can also
affect crop quality. All these pests are well controlled with lambda-cyhalothrin, which should remain available to
growers.
Onion pests include bean seed fly and onion thrips. Onion thrips reduce the quality of the onion bulb. Bean seed
fly reduces yield.
The apple crop is subject to a large number of insect pests. These include aphids (notably the rosy apple aphid),
capsids, apple sawfly and moths (codling, totrix and winter). The effects are variable. Almost all apple crops are
susceptible to moth attack; however capsid attack is less frequent. Currently these pests are well controlled, with
yield and quality losses relatively modest.
4.2.10. Other
Plant growth Regulators (PGRs) are important in most cereals crops (especially oats). However, the list at Table 1
indicates that no key products are likely to be lost.
As has been mentioned in section 2.5.2, chlorpropham (CIPC) is a key sprout suppressant in potato storage.
Residue level issues have led to a stewardship group being set up and it is assumed, for the purposes of this report,

The Andersons Centre CPA-NFU-AIC
October 2014 Page 28 of 67
that this will be successful in maintaining the availability of this product. If it was withdrawn, the UK processing
potato sector (28% of total output in 2012), would find it difficult to continue operating.
4.3. WINTER CEREALS
4.3.1. Key Issues
For winter cereals the main problem areas are listed (in order of importance) below;
1. Grassweeds – blackgrass, rye-grass, brome and wild oats
2. Fungal Diseases – mainly septoria tritici, but also yellow rust
3. Broadleaved Weeds – cleavers, chickweed, poppies.
4. Slugs
5. Insect Pests – mainly aphids transmitting Barley Yellow Dwarf Virus (BYDV), grain aphids, frit flies, orange
wheat blossom midge
4.3.2. Winter Wheat Effects
The tables below summarise the likely effect on a pest-by-pest basis.
It must be recognised that it is not possible to sum all of these losses to arrive at a total yield loss following the
withdrawal of key PPPs. It may be possible for a figure of over 100% to be reached – indicating no output at all,
which is clearly nonsensical. Even under organic conditions (where no synthetic pesticides are applied), the
likely yield loss compared to ‘conventional’ agriculture is in the order of 50%. The percentages in Table 4 below
apply to losses from just one weed, pest or disease. Where multiple pests are present (as in field conditions) the
losses will not be cumulative, as the ‘top-slice’ of production will have already been lost to something else.
Therefore, at the bottom of each table is an estimated figure for the yield reduction as a result of the loss of the
PPP indicated as ‘Likely Losses’ in Section 3.2. This is the average yield loss for the entire area of the crop
(hence ‘100%’ in the ‘Area Affected’ column). The overall yield loss percentage will be used in the modelling
work in Section 5.

The Andersons Centre CPA-NFU-AIC
October 2014 Page 29 of 67
Table 4 – Winter Wheat
Pest Area Affected %
Yield Loss %
Notes
Blackgrass 50% 16% Key loss would be pendimethalin.
Other Grass Weeds 25% 4% As above. Chlorotoluron, clopyralid and glyphosate availability remains unchanged (i.e. no WFD restrictions).
Septoria 100% 3% Most azole products could be lost, but prothioconazole and tebuconazole retained. Chlorothalonil could be restricted due to WFD.
Take All 80% 0% No key products lost.
Other Fungal Diseases 68% 2% Potential loss of carbendazim for fusarium plus loss of azoles.
Broadleaved Weeds 52% 1% Minor effect from potential loss of 2,4-D, ioxynil and linuron.
Insects 34% 2% Effect due to potential loss of bifenthrin, chlorpyrifos, cypermethrin, esfenvalerate, and thiacloprid.
Slugs <1% 3% Methiocarb will be withdrawn in Sept 2015; likely to be restrictions on metaldehyde. Ferric phosphate remains available.
Total 100% 12%
based on 2014 blackgrass area of 58%, reduced slightly
potential – variable between seasons
restrictions likely to be limited to a small number of catchments/DrWPAs (see metaldehyde notes below). Therefore effects at UK level minimal.
based on Ricardo-AEA report methodology47. Priority catchments are Impacted DrWPA and upstream safeguard zones which accounts for 21% of arable land in England. The scaling is tailored to the risk from all pesticides due to the likelihood that the targeted policy options would be implemented at that DrWPA scale. Restrictions placed on 20% of area within those catchments. Therefore around 4% of total arable area affected (20% x 21%). 15% of the wheat crop treated with slug pellets within this area on an annual basis.
4.3.3. Winter Barley Effects
The main areas of concern for winter barley are similar to those for winter wheat. But diseases, crop yield losses
and control options are slightly different. Potential losses are summarised in Table 5 below.

The Andersons Centre CPA-NFU-AIC
October 2014 Page 30 of 67
Table 5 – Winter Barley
Pest Area Affected %
Yield Loss %
Notes
Blackgrass 50% 16% Key loss is pendimethalin.
Other Grass Weeds 25% 4% As above. Chlorotoluron, clopyralid and glyphosate availability remains unchanged (i.e. no WFD restrictions).
Take All 80% 0% No key products lost
Fungal Diseases 58% 1% Quinoxyfen for mildew, carbendazim for fusarium plus loss of azoles
Broadleaved Weeds 52% 1% Minor effect from loss of 2,4-D, ioxynil and linuron
Slugs <1% 1% Methiocarb will be withdrawn in Sept 2015; likely to be restrictions on metaldehyde. Ferric phosphate remains available.
Insects 21% 1% Effect due to loss of bifenthrin, cypermethrin, esfenvalerate, thiacloprid and chlorpyrifos
Total 100% 10%
see winter wheat notes above
Although not specifically considered in this report, spring barley is an important crop in the UK, especially in the
west and north. With more options for control of grass-weeds, in particular resistant blackgrass through
cultivation, the predicted overall yield loss is lower for the spring crop than for winter sowings due to the
increased area, in particular in the East and Midlands. A fall of 6% has been included in the model.
4.3.4. Winter Oats Effects
As pendimethalin is not used on oats, the effect of PPP loss on oats is less. Although mecoprop is an important
herbicide, it is assumed that restrictions under the WFD would only impact on a very small area of the crop. It is
worth noting that, because current control options for weeds such as blackgrass or wild oats are limited, the crop
tends not to be grown where these weeds are a problem. Potential losses are summarised in Table 6 below.
Table 6 – Winter Oats
Pest Area Affected %
Yield Loss %
Notes
Meadow Grass 1% 2% Loss of mecoprop and flumioxazine.
Blackgrass 1% 24% As above.
Other Grass Weeds 1% 11% As above.
Fungal Diseases 29% 0.5% Quinoxyfen for mildew, carbendazim for fusarium plus loss of azoles
Broadleaved Weeds 49% 1% Minor effect from loss of 2,4-D, ioxynil and linuron
Growth Regulators 80% 0% No key products lost
Aphids 54% 1.5% Effect due to potential loss of bifenthrin, cypermethrin, esfenvalerate, thiacloprid and chlorpyrifos
Other Insects (inc. slugs)
<1% 1% As wheat/barley above for slugs.
Total 100% 4%

The Andersons Centre CPA-NFU-AIC
October 2014 Page 31 of 67
mecoprop only restricted in certain catchments. EA analysis shows only 27 out of 560 catchments affected; restrictions on a small portion of this area (20% assumed for metaldehyde) means very limited area affected.
Note that there will be declines in other winter cereals too – rye, triticale and cereals mixtures. As these crops
traditionally receive lower levels of PPP and have lower yields than wheat and barley, a reduction of 8% in yields
is used.
4.4. OTHER COMBINABLE CROPS
4.4.1. Winter Oilseed Rape Effects
For oilseed rape the main problem areas identified are;
1. Turnip Yellows Virus – transmitted by aphids
2. Cabbage stem flea beetle, pollen beetle and aphids
3. Phoma leaf spot, light leaf spot, sclerotinia and other fungal diseases
4. Grassweeds
5. Slugs
A HGCA research project48 has studied the effects of the neonicotinoid restriction. This suggested a 1% yield
loss due to cabbage stem flea beetle. However, practical experience in the autumn of 2014 suggests losses are
much higher. A figure of 7% has been assumed pending fuller survey results of the effect of the pest.
Potential losses are summarised in Table 7 below.
Table 7 – Winter Oilseed Rape
Pest Area Affected %
Yield Loss %
Notes
Turnip Yellows Virus 60% 10% Loss of neonicotinoid seed treatments. Some control with additional foliar sprays.
Cabbage Stem Flea Beetle
67% 7% As Turnip Yellows Virus. However, treatment options different.
Phoma Leaf Spot 90% 1% Loss of metconazole and flusilazole, but prothioconazole retained.
Light Leaf Spot 79% 2% As above.
Volunteer cereals, grassweeds and broadleaved weeds
4% 24% Carbetamide, metazachlor, and propyzamide could all face restrictions under WFD.
Slugs 1.5% 4% Methiocarb will be withdrawn in Sept 2015; likely to be restrictions on metaldehyde. Ferric phosphate remains available.
Other Fungal Diseases 62% 0.5% As above.
Aphids 45% 2.5% Cypermethrin lost but deltamethrin remains.
Total 100% 18%
based on Ricardo-AEA report methodology. Priority catchments account for 21% of arable land in England; restrictions on 20% of area within those catchments. Therefore around 4% of total arable area affected. All of the oilseed rape crop treated with one or more of these products. Yield loss figure taken from same report.

The Andersons Centre CPA-NFU-AIC
October 2014 Page 32 of 67
same methodology as for wheat. Therefore 4% of total area affected. 50% of the oilseed rape crop treated with slug pellets within this area.
4.4.2. Pea and Bean Effects
For pulses the main problem areas are;
1. Broadleaved weeds
2. Grassweeds
3. Fungal Diseases – powdery mildew and botrytis in peas, plus chocolate spot in beans
4. Volunteer potatoes (peas)
A number of products used in peas and beans such as simazine and trifluralin have already been lost. Potential
future losses are summarised in Tables 8 and 9 below.
Table 8 – Peas
Pest Area Affected %
Yield Loss %
Notes
Broadleaved weeds 75% 15% Pendimethalin lost, and bentazone restricted by catchment.
Grassweeds (inc. blackgrass)
30% 3% As for cereals above, key loss is pendimethalin.
Fungal diseases 10% 20% Downy mildew and botrytis control affected by loss of chlorothalonil and metconazole.
Potato berries 10% 2% Loss of pendimethalin makes control of volunteer potatoes more difficult. Restricted yield loss as mechanical control adopted.
Insect pests 80% 0% No key losses - lambda-cyhalothrin and pirimicarb retained.
Total 100% 15%
based on methodology for slugs and oilseed rape herbicides (see sections above), the area facing bentazone restrictions will be small (likely to be significantly less than 5% of cropped area).
Table 9 – Beans
Pest Area Affected %
Yield Loss %
Notes
Grassweeds (inc. blackgrass)
50% 4% As for cereals above. Also bentazone and carbetamide. restricted by catchment
Broadleaved weeds 60% 12% Pendimethalin and linuron lost.
Fungal Diseases 25% 20% Chocolate spot control affected by loss of chlorothalonil and metconazole
Insect pests 80% 0% No key losses - lambda-cyhalothrin and primicarb retained. Bruchid beetle control retained.
Total 100% 15%
based on methodology for slugs and oilseed rape herbicides, the area facing bentazone restrictions will be small (likely to be significantly less than 5% of cropped area) .

The Andersons Centre CPA-NFU-AIC
October 2014 Page 33 of 67
4.5. ROOT CROPS
4.5.1. Sugar Beet
Potential losses for the sugar beet crop are summarised in Table 10 below.
Table 10 – Sugar Beet
Pest Area Affected %
Yield Loss %
Notes
Fungal Diseases 80% 15% Cyproconazole lost, but difenoconazole retained. Some control of powdery mildew and rust lost.
Leatherjackets 10% 15% Some loss of early control with methiocarb, and later with loss of chlorpyriphos
Other pests – cutworms, aphids, moths etc.
10% 5% Loss of cypermethrin, but continued use of deltamethrin for foliar applications. Clothianidin etc. remain approved as seed treatments.
Volunteer cereals, grassweeds and broadleaved weeds
95% 0% No key losses of sugar beet herbicides. Ethofumesate, lenacil, metamitron, phenmedipham, triflusulfuron-methyl etc. still available
Slugs 1% 2% Methiocarb will be withdrawn in Sept 2015; likely to be restrictions on metaldehyde. Ferric phosphate remains available.
Total 100% 12%
see notes on earlier tables
4.5.2. Potatoes
Potential losses for the potato crop are summarised in Table 11 below.
Table 11 – Potatoes
Pest Area Affected %
Yield Loss %
Notes
Blight 100% 10% Loss of chlorothalonil, fluazinam, mancozeb and maneb. Cymoxanil, and cyazofamid retained.
Other pests – aphids, nematodes etc.
80% 2% Loss of cypermethrin, but continued use of deltamethrin
Slugs 2% 2% Methiocarb will be withdrawn in Sept 2015; likely to be restrictions on metaldehyde. Ferric phosphate remains available.
Other Fungal Diseases 60% 0% Suitable products retained to control rots, canker, scurf etc.
Potato Cyst Nematodes 100% 0% Actives oxamyl, fosthiazate and ethoprophos all remain available.
Volunteer cereals, grassweeds and broadleaved weeds
95% 1% Losses of pendimethalin and linuron, but alterative control through bentazone and metribuzin still available.
Total 100% 12%
see notes on earlier tables
although may be restricted in a small number of catchments (see peas above).

The Andersons Centre CPA-NFU-AIC
October 2014 Page 34 of 67
4.6. VEGETABLE AND FRUIT CROPS
4.6.1. Carrots
Potential losses for the carrot crop are summarised in Table 12 below.
Table 12 – Carrots
Pest Area Affected %
Yield Loss %
Notes
Broadleaved weeds 100% 17% Flumioxazin, linuron and pendimethalin lost.
Grassweeds (inc. meadowgrass)
100% 10% As above.
Volunteer potatoes 90% 10% As above.
Slugs 2% 2% Methiocarb will be withdrawn in Sept 2015; likely to be restrictions on metaldehyde. Ferric phosphate remains available.
Pests 100% 0% Cypermethrin lost, but other products such as lambda-cyhalothrin and pirimicarb retained
Fungal Diseases 100% 0% No key losses – boscalid, pyraclostrobin (and other strobilurins) and tebuconazole remain to control sclerotinia and other diseases
Total 100% 25%
see notes on earlier tables
4.6.2. Onions
Potential onion losses are summarised in Table 13 below.
Table 13 – Onions
Pest Area Affected %
Yield Loss %
Notes
Downy Mildew 100% 35% Mancozeb lost, as is chlorothalonil. Although some products remain, control options and efficacy is severely reduced.
Broadleaved weeds 80% 15% Flumioxazin, linuron and pendimethalin lost. Bentazone, clopyralid, fluroxypyr, pyridate remain, but control becomes far harder.
Grassweeds (inc. meadowgrass)
100% 12% As above.
Volunteer potatoes 15% 5% As above.
Pests 35% 5% Deltamethrin and lambda-cyhalothrin remain, but resistance issues. Chlorpyrifos lost but spinosad retained. Overall, some loss of control
Other Fungal Diseases 100% 2% As for downy mildew above. Iprodione lost for botrytis. Tebuconazole remains
Total 100% 50%
although may be restricted in a small number of catchments (see peas above).

The Andersons Centre CPA-NFU-AIC
October 2014 Page 35 of 67
4.6.3. Apples
Potential losses are summarised in Table 14 below.
Table 14 – Apples
Pest Area Affected %
Yield Loss %
Notes
Grassweeds and broadleaved weeds
100% 3% Ability to maintain weed-free strip is restricted by loss of 2,4-D and mecoprop.
Apple Scab 100% 3% Fenbuconazole lost but alternative products such as boscalid and pyraclostrobin remain.
Fungal Diseases 75% 1% As above. Plus loss of mancozeb, but use of tebuconazole retained.
Aphids, Capsids and Flies.
70% 1% Thiacloprid and chlorpyrifos lost, but alternatives exists so effects minimised
Moths 100% 0% Suitable products retained such as methoxyfenozide and spinosad.
Total 100% 6%
4.7. OTHER CROPS
It should be remembered that there will be effects from the losses of crop protection technology on many, if not
all, of the other crops grown in the UK, not specifically covered in the section above.
4.7.1. Minor Crop Usage
‘Minor Crop’ is perhaps a misleading choice of phrase that has become embedded in usage. It suggests that these
crops are relatively unimportant. In fact, horticulture (taken as vegetables, fruit and ornamentals) comprised a
third of UK crop output (by value) in the five years 2009-13. However, it is a diverse sector, and the area of
individual crops can be small. As set out in Section 2.5.1, these crops often rely on the extension of authorisation
from products approved on ‘broadacre’ crops.
The section above for carrots and onions provides an insight into the problems (and potential losses) that are faced
by all ‘minor crops’. There is no reason to believe that carrots and onions are special cases and are going to be
harder hit than many other crops.
An example of how government intervention can help deal with the issues around minor crops is the IR-4
Project49 in the USA which is a public/private partnership working to develop approvals for use in speciality
crops. The EU Parliament adopted a ‘Strategy for Growth for the Horticultural Sector’ in January 201450 but,
ironically, it is the EU’s own approvals process that is restricting the development of the sector.
It should be remembered that minor use does not only cover speciality crops, but also minor diseases in major
crops. For example, a novel weed, disease or pest could occur in one of the major crops grown in the UK. The
likelihood of this could well increase due to climate change, and the growing threat from invasive species. A
product may be available to treat the problem, but may not be authorised for use on that crop. Granting an EAMU

The Andersons Centre CPA-NFU-AIC
October 2014 Page 36 of 67
would allow the product to be used and the weed, pest or disease to be controlled. EAMUs are vital in allowing
flexibility to respond to unknown threats.
In many ways, the problems faced by the horticultural sector in terms of lack of specific approvals and limited
product choice may be a foretaste of what producers of more ‘mainstream’ crops face if the current direction of
policy is maintained.
4.7.2. Grass
Grassland covers two-thirds of the agricultural area in the UK. Rough grazing comprises 28% of UK farmland –
either ‘sole-right’ or common land. This receives little, if any, pesticides, although some areas are treated with
asulam to control bracken.
Permanent grass makes up 32% of the farmed area, and temporary grass (that in place for less than 5 years), 7%.
Within permanent grassland there is a large range in sward quality. At one end of the spectrum is very extensive
grazing with fairly low productivity (but hardy) species. This is very similar in nature, output and input use to
rough grazing. At the other end of the spectrum some ‘permanent pasture’ can be highly valuable – containing a
good mix of clovers and productive grass species. Its agricultural output would often be the equal of many
temporary grass leys.
There has been a clear trend in the UK livestock industry over the past decade to maximise production from
grazed grass. This has been led by the dairy sector, but is increasingly being embraced by the beef and sheep
sectors too. The philosophy is that the cheapest way to feed an animal is to get as much of its feed requirement as
possible from grazed forage. This saves costs not only on purchased feed, but also on the costs of mechanically
conserving and feeding silage or hay.
To make the system work it is necessary to have high yields of nutritious forage. This has led to a much greater
focus on the management of grass than perhaps has been the case in the past. It involves techniques such as
paddock or rotational grazing, extended grazing, and grass measurement. As part of this the quality of the sward
becomes all-important. Weeds need to be controlled to stop competition with the productive grass species, and to
stop the sward becoming unpalatable.
The active substances 2,4-D and MCPA are widely used in grassland for weed control as they are safe to the
beneficial clover in the sward. Both of these could have restrictions applied (on a catchment basis) under the
WFD. Linuron is also used in grassland products, and is deemed to have a ‘high’ likelihood of being lost.
4.7.3. Soft Fruit
Soft fruit comprises strawberries, raspberries, blackcurrants, currants, gooseberries and various other types of
berry. The area taken up by these crops is relatively small – around 9,500 hectares or less than 0.1% of the UK
farmed area. However, these crops are economically important. The five year average 2009-2013 saw them
comprise around 4.5% of total UK crop output. These crops have also been a great success story for UK farming
over the past two decades – especially strawberries (which account for over 60% of the UK soft fruit output by

The Andersons Centre CPA-NFU-AIC
October 2014 Page 37 of 67
value). The crop has gone from a seasonal luxury only consumed in early summer, to one where UK produce is
available from April to October.
The strawberry crop is susceptible to a number of pests and diseases, notably botrytis, mildew, blackspot,
strawberry blossom weevil and aphids. Chlorothalonil and iprodione are used in fungal disease control
programmes. As set out in Section 3.2 these products may be lost or restricted. This would increase reliance on
alternatives such as fenhexamid and tolylfluanid.
Chlorpyrifos is widely used for pest control, and this seems likely to be lost. This being the case, pirimicarb use
will increase. It is likely to remain available (although it is a Candidate for Substitution).
4.7.4. Hops
Hops are a vital ingredient in the iconic British product of beer. Whilst the farmgate value of British hops is £9
million, they are used in about half the UK’s brewing capacity; with a retail value of £19 billion. The UK hop
area has been in long-term decline with the national area dropping below 1,000 hectares. This is a result of
competition from cheaper imported hops, and a shift in consumers tastes in beer.
Recently the demand for hops has been increasing rapidly, especially in the USA where the interest in ‘craft beers’
and the subsequent improved demand for hops have led to there being fears of hop shortages. The recent upturn
should provide an opportunity for a resurgence in the UK hops sector, including increased exports. However,
growers are reluctant to expand partly because there are too few crop protection options in what is a challenging
crop to grow competitively.
Insect pests are a particular problem. The neonicotinoid imidacloprid was widely used as a soil drench but the
main target pest, aphids, developed resistance to this active substance (mainly because there were no alternatives
with which to build an anti-resistance programme). With this active substance no longer being used a number of
novel pests that were previously controlled (such as flea-beetle from oilseed rape) in addition to aphids have now
emerged as a severe problem.
The only approved option for British hop growers is to apply a pyrethroid but these have limited effectiveness.
Also, they remove natural predators, and this exacerbates problems with major pests like aphid and spider mite,
which are difficult to control in their own right. The approval for the last pyrethroid expires this year. The loss of
abamectin would be significant as it is the only product to control the two-spotted spider mite in hops.
German and Czech hop growers have access to thiamethoxam which is not approved for hops in the UK. This
gives them a significant competitive advantage.
Historically, the the hop industry was subject to regular crop failures (hence the hop warehouses in London). The
industry now relies on very few active substances – for example three aphicides and a single acaricide. Were
these to be lost the remaining 50 British hop growers could face a situation where crops were completely lost in
some years. This would likely result in an end to commercial hop growing in the UK.

The Andersons Centre CPA-NFU-AIC
October 2014 Page 38 of 67
4.7.5. Ornamentals
According to DEFRA statistics the production of plants and flowers (‘ornamentals’) comprised around 12% of the
total output of UK crops in the five years 2009 to 2013. It is therefore an important sector within UK agriculture
and horticulture, although one often overlooked.
The consumer has a low tolerance for pests and diseases within ornamental crops so pesticides are a vital
tool. The widespread use of biological control (see section 7.4) means that chemical pesticides have to be specific
and able to be integrated with the biologicals, limiting the choice of product. Two such chemicals under threat are
spinosad and abamectin commonly used for spider mites and thrips. These are major pests of ornamentals and for
which these products are often the last line of defence. The loss of pirimicarb will limit the choice of a specific
aphicide to one active, increasing the risk of resistance.
In the case of ornamentals, the economic loss is less about yield decreases, or even quality reductions. It is in the
cost of the alternative methods adopted to protect the crop. These include more regular crop monitoring,
increased heating (for protected crops to help prevent disease) and a higher number of pesticide applications (as
alternatives are often less effective, as we have seen with the restrictions on imidacloprid).
The Andersons Centre CPA-NFU-AIC
October 2014 Page 39 of 67
5. EFFECTS ON UK AGRICULTURE
5.1. METHODOLOGY
To gauge the effect of the loss of the Plant Protection Products (PPP) outlined in Section 3, the outcomes
discussed in Section 4 have been fed into a spreadsheet model. This provides a set of outputs – it shows both the
monetary loss of the changes, and also changes in yields and cropping. The latter is important when the
discussion is broadened to look at the effects beyond the farming sector – in terms of raw materials for the food
processing industry and consumers.
The model is based on the aggregate UK farming accounts as compiled by DEFRA. These are published annually
in ‘Agriculture in the UK’51. They are regarded as the definitive guide to the financial performance of the farming
industry. From these accounts a measure of profitability for UK agriculture known as Total Income from Farming
(or TIFF) is derived. This is the aggregate return to all the entrepreneurs in UK agriculture and horticulture for
their management, labour and their own capital in their businesses. Note that the use of the term ‘Income’ can be
confusing – what is essentially being shown is the profit of the farming industry. The data is collected and
produced to EU requirements as part of the UK’s statistical reporting to Brussels.
As aggregate accounts, the TIFF data shows total income and costs for each of the main categories in UK farming.
For example, income from wheat or milk is shown as one figure; then the cost of fertiliser or labour is also shown.
Therefore the data is not produced from gross margins for individual enterprises as the figures for an individual
farm would be.
To provide more detailed analysis, the financial data comprised in the TIFF accounts is supplemented in the
model by physical data for each crop. This covers areas, yields and prices. These are all reconciled to produce a
financial output figure. The source of the physical data is the UK June Agricultural Survey52, Cereals and
Oilseeds Yields Data, and the Basic Horticultural Statistics publication53.
In all cases, for both financial and physical data, five year averages for the years 2009 to 2013 have been used.
This means the most current data is being used in the model. At present the 2013 year is the latest available.
However, farming is an inherently volatile industry so the use of a five-year average means that the base figures
are not distorted by unusual yearly events – for example weather effects.
From this ‘Base’ scenario, the estimated effects on crops from the previous section have been applied. This
changes planted areas, yields, prices and of course financial returns. UK cropping is fully reconciled following
the predicted changes – i.e. if an area of one crop falls due to the loss of PPP, then the area of another crop would
rise, or the area of fallow or grass would increase instead.
Further changes have been included in the model. As cropping patterns change, the use of variable inputs such as
seeds, fertilisers and pesticides will alter. In addition, production systems will change – for example more
cultivations, or a greater number of passes with a sprayer. These effects have been built in to alter the figures in
the respective cost categories – machinery costs, fuel, labour etc.

The Andersons Centre CPA-NFU-AIC
October 2014 Page 40 of 67
The comparison of the Base scenario with the Post-Loss one assumes all other conditions remain constant.
Therefore the analysis is undertaken at today’s prices (and premiums) and cost levels. In this way the effect of the
loss of PPP can be seen in isolation.
5.2. MAIN ASSUMPTIONS
A large number of assumptions are naturally required in the model which are summarised in this section.
Inevitably some of the consequences of these are unknown and all estimations will contain a degree of informed
guesswork. It would be possible to argue a different outcome for any of the individual assumptions. However, as
the model is made up of a large number of calculations any individual figure is not crucial to the overall outcome.
Indeed, any errors in one direction, are likely to be cancelled-out by equivalent, but opposite, errors elsewhere.
5.2.1. Yields
All yield changes are from the five-year average 2009 to 2013. In all cases yields decrease due to increased weed,
disease and pest pressure on crops. These figures are taken from the tables in Section 4. The ‘marketable yield’,
is dealt with through the average price – set out below;
Yields of winter wheat decline by 12%, that for winter barley by 10%. Spring barley yields reduce by only
6% as the loss of PPP is less severe in spring crops.
The oats yield declines by 4%. It is from a lower base, and tends to be a crop which requires lower inputs.
‘Other cereals’ yields decline by 8%.
Winter oilseed rape yields fall by 18%.
Peas have an output drop of 15%, beans by 15%.
Sugar beet yields decline by 12%.
Potato yields drop by 12%.
Carrot yields fall by 25%.
Onions by 50%.
Apple yields decline by 6%.
5.2.2. Crop Areas
All changes are from the five-year average 2009 to 2013
Winter wheat area drops 12% as some land becomes uneconomic to crop with loss of active ingredients.
Spring wheat area rises as part of shift to spring cropping.
Winter barley area drops 10% (not as badly affected as wheat).
Spring barley area rises by 20% as part of shift to spring cropping.
Oat area rises by 20% as growers look for alternative combinable crops (with low-input characteristics).
Other cereals (including rye, triticale and mixes) rise by 100% (albeit from a low base) for the same reason.
Winter oilseed rape area declines by 30%. Spring oilseed rape increases by 100%, but overall rape area
drops by 22%.

The Andersons Centre CPA-NFU-AIC
October 2014 Page 41 of 67
The feed pea area increases by 25% as part of the general move to spring cropping. Very few, if any,
winter peas are assumed. Both the vining pea industry and combined peas for human consumption
disappear completely as it is impossible to produce the quality required, hence they are all imported.
The combinable bean area increases by 30%, with the selection of spring beans assumed.
Sugar beet area goes up by 10% to offset a reduction in yield. Sugar beet is bulky, relatively low value per
tonne and produced in large quantities in the UK. Therefore, the opportunities for import substitution are
more limited. It is assumed that, as the sugar processor has factories to fill, extra area contract will be
offered to offset part of the yield loss. Whilst the crop could well be less profitable than at present due to
yield reductions, the comparative profitability compared with other crops is assumed to be good enough
that this additional contract would be taken-up by growers. Whilst the area grown may increase, the
assumption is that yield loss will not be fully offset so less sugar will be produced (see below).
The potato area decreases by 5%. The area does not drop by as much as the yield reduction might suggest,
as there are slightly greater barriers to import substitution in the potato sector due to the relatively bulky
(and perishable) nature of the crop. Whilst there are currently significant imports from Northern European
countries to the UK, it is assumed in the ‘post-loss’ scenario that growers in the rest of Europe would by
facing the same issues with the loss of PPP as UK producers. Therefore imports would have to come a
greater distance from outside Europe. This protects the sector to some extent from lower-cost import
competition.
The carrot area falls by 40%.
Onion plantings (bulb and spring) decline by 50%.
Although a detailed analysis has not been undertaken on the effects of the loss of products on other
vegetables, it seems safe to assume that the effects will be similar to those seen for carrots and onions. All
other vegetable areas are assumed to decline by 33% apart from protected vegetables, where cultural
control is easier and the area is maintained.
The apple area declines by 30%.
In a similar way to vegetables, the trends in other fruit are extrapolated from the changes in apple areas.
Thus a decline of 30% is assumed.
Generally, most crop areas decline. This is because it becomes more difficult and more expensive to grow them
with the loss of key PPP. Some crops can no longer be grown in certain locations because suitable pesticides are
not available to control the prevalent pests. Longer crop rotations also mean a decline in the area of the most
widely-grown crops. Finally, where production of a crop is economically marginal, it is likely that it will no
longer be grown due to reductions in profitability. Although these area reductions, along with yield changes
discussed below, reduce UK output, it is presumed that imports, which are likely to be from outside the EU, will
be available to make up the shortfall.
No specific analysis has been undertaken of the effect on the biofuels industry. This is now an important outlet
for oilseed rape, sugar beet and wheat produced in the UK. Indeed, if the wider renewable energy sector is looked
at then anaerobic digestion is an important driver of the growth in the maize area (plus other crops used as
feedstocks). It is assumed that these destinations are simply another outlet for the crops grown in the UK. They
will react in the same way to supply, demand, and hence prices as any other market.

The Andersons Centre CPA-NFU-AIC
October 2014 Page 42 of 67
5.2.3. Prices
All changes are based on the five-year average 2009 to 2013. Farmgate rather than retail prices are considered.
In general, all cereals and oilseed rape prices rise by 5%. This is due to a shift from export parity pricing
(the prevailing world market price less the cost of transport to the final destination), to import parity (the
prevailing world market price plus the cost of transporting the grain to the UK).
The percentage of wheat sold for milling declines from its historical average of 35% to 30% due to poorer
crop quality as a result of the loss of key PPP.
The swing towards spring barley production (see section above) creates a higher volume of malting grade
barley in the market. Although the base price goes up 5%; see above, the malting price declines by 8%.
As a result, there is only a small premium remaining for malting grades.
Most peas grown in the UK now go for human consumption or micronizing. It is assumed that loss of PPP
mean that it is harder to meet the quality requirements and more of the crop ‘defaults’ to the base animal
feed price. The base price in this market is set by protein in animal feeds. As the UK is already heavily
reliant on imports in the sector with an emphasis on soya, so the market dynamics do not alter. Overall, the
average pea price falls by 10%.
For beans, a large proportion of the crop currently goes for human consumption, mainly for export. It is
assumed that the loss of products will result in quality issues that end this market (mainly chocolate spot;
bruchid beetle control still possible). Therefore average prices are expected to decline by 12%.
The sugar beet price is assumed to remain relatively unchanged from the price set for the 2015 crop. The
processor has a strong commercial incentive to offer a price that encourages enough beet to be grown to fill
its factory requirements. It is assumed that a price at this level will achieve that goal.
The potato price drops by 8%. This does not assume any reduction in the farmgate price for human
consumption potatoes, indeed the price may well rise slightly in response to lower output. However, the
percentage of grade-outs will rise considerably due to quality issues, so the average price received per
tonne of output will fall. The grade-outs are assumed to be sold at a low price as stock feed.
The average price for carrots and onions is assumed to decline for the same reason as potatoes in response
to a higher percentage of grade-outs. The respective price reductions are 15% and 10% respectively, with
carrots having higher ‘visual quality’ requirements.
Other vegetables are assumed to experience a total revenue drop (area, yield and price together) of 33%.
Apples suffer heavily from the grade-out issue, as consumers have got used to purchasing ‘perfect fruit’
over the past few decades. The average price falls by 20%.
In terms of price effects, an underlying assumption has been made that sufficient volumes of agricultural
commodities are available in European or World markets to replace reduced domestic supplies. However, as
many of the policies would be implemented at an EU level, the rest of the Single Market would be grappling with
a sharp fall in output in the same way as the UK. In some commodities the EU comprises a large portion of global
output. An example is wheat where the EU produces around 20% of the world total54. Therefore, the effect of
falls in EU production would be significant enough to raise the global price higher. This is not factored into the
model.

The Andersons Centre CPA-NFU-AIC
October 2014 Page 43 of 67
In sectors with higher-value output such as fruit and vegetables, the loss of EU production would have a lesser
influence on price. It would make sense for importers to substitute the production of these crops for less valuable
ones to supply the newly-available EU market. The price effect might only be marginal.
An earlier report55 produced for the Crop Protection Association adopted a different approach, with imports from
the rest of the world failing to make up the shortfall in production in the UK and EU. This foresaw ‘farmgate
prices for arable crops, fruit and vegetables would be of the order of 100% higher and the farmgate prices of
meat and dairy products would be around 50% higher’.
5.2.4. Operational Costs
All changes are based on the five-year average 2009 to 2013
Full inversion cultivation needed on cropping areas previously min-tilled or not tilled. This is to improve
weed control (especially against blackgrass). It is assumed that this will be relevant to 25% of winter
cropping area. Some spring area is now also likely to need fuller cultivations but this is accounted for in
the figure.
Assumes an average of two and a half extra spray passes on all cropped land – this is because many of the
remaining PPP are less persistent, or less effective than those products being lost. Hence the need for a
greater number of applications. An example of this is the loss of neonicotinoid seed treatments, where
foliar sprays now have to be applied in the autumn.
Four passes of additional tractor hoeing on vegetable land.
Hand weeding once on all vegetable land.
The cost of these operations are based on average farmers’ costs from the 2015 John Nix Pocketbook56
5.2.5. Other Costs
All cost changes are based on the five-year average aggregate costs, 2009 to 2013
Seed costs drop in proportion to lower cropped areas – with extra fallow and extra temporary grass area. It
is possible that if demand drops seed houses may increase their costs of seed per unit to allow for
continued returns. This is not factored-in the model.
Fertiliser costs also drop for a similar reason. Spring cropping land, and extra temporary grass is assumed
to get two-thirds of the application of winter combinable crops. Fallow receives nothing.
The change in the cost of pesticides is complex. Despite the loss of key active ingredients the spend on
cropped hectares is likely to rise as more expensive and possibly a greater number of products are applied.
An example of this is the loss of linuron for weed control in potatoes. The alternative control options are
all more expensive. The cost on winter combinable crops and fruit and veg is expected to rise by 15%.
The shift to spring cropping will reduce applications in these circumstances – as with fertiliser, rates of
two-thirds the winter cropping cost will be used. No products used on fallow or additional temporary
grass.

The Andersons Centre CPA-NFU-AIC
October 2014 Page 44 of 67
Feed prices for livestock farmers will rise as the internal UK cereals prices rise. As animal feed is made up
of protein (soya) and other ingredients as well as cereals, the full 5% change is unlikely. A 2.5% uplift has
been included.
There are other cost changes that could be made, for example lower crop storage costs due to lower output.
Furthermore, although the grass area has risen, no additional livestock output has been included. It is assumed that
grazing livestock would become more extensive. The list of adjustments is potentially endless. This model has
attempted to capture the main ones.
5.3. RESULTS
5.3.1. Summary of Results
The results of the models are presented in the following two tables. The ‘Base’ figures are the averages for 2009
to 2013. The ‘Post-Loss’ figures are the situation once the most likely scenario for the loss of PPP has been
applied.

The Andersons Centre CPA-NFU-AIC
October 2014 Page 45 of 67
Table 15 – Summary Financial Effects
The drop in Gross Value Added equates to a fall of £1.65bn or around 20%. The figures for Total Income from
Farming are clearly shown in the table, with over a third of the profit of the farming and horticultural industry
being lost. This could well be an understatement as some sectors (e.g. ornamentals) have not been included in the
analysis.
Some crop categories show income rises. This is because the area of the crop is rising – offsetting any yield
drops. This is a result of changes in cropping patterns brought about by the loss of certain PPP, which are
illustrated in Table 16 below.
£m Base Post-LossIncome
Wheat 1 956 1 499Barley 825 816Other Cereals 105 139Oilseed Rape 797 522Beans and Combining Peas 117 119Sugar Beet 238 184Potatoes 738 567Other Crops 735 840Carrots 120 46Onions 104 23Other Vegetables 1 003 668Apples 112 59Other Fruit 474 333Ornamental Crops 1 014 1 014All Livestock Output 12 389 12 389Other Farming Income 2 008 2 008Total Income 22 734 21 225
Costs (Intermediate Consumption')Seed 696 680Fertilisers 1 423 1 384Crop Protection Products 815 854Energy (includes Fuel) 1 318 1 342Animal Feed 4 545 4 658Machinery Expenses 872 890All Other 'Intermediate Consumption' 5 021 5 021Total Intermediate Consumption 14 689 14 830
Gross Value Added (Mkt Prices) 8 045 6 395
Other Costs Depreciation 3 731 3 773Subsidies (less Taxes) - 3 338 - 3 338Wages 2 290 2 327Rent and Interest 579 589Total Other Costs 3 261 3 350
Total Income From Farming ('Profit') 4 784 3 045Change - 1 739% Change -36%

The Andersons Centre CPA-NFU-AIC
October 2014 Page 46 of 67
Table 16 – Summary Cropping Changes
The overall farmed area remains the same. It can be seen that, overall, winter cropping drops at the expense of
spring crops. The area of fallow rises as some land is taken out of production. This will be either the least
productive land that is no longer economic to crop, or land taken out of production rotationally to control weeds.
The area of temporary grass also rises as this ‘crop’ is included more regularly in arable rotations to assist with
weed control.
'000 Ha Base Post-Loss % changeCombinable Crops
All Wheat 1 858 1 681 -10% Winter Barley 368 331 -10% Spring Barley 682 819 20%All Barley 1 050 1 150 9%All Oats 132 159 20%All Other Cereals 27 54 100%Total Cereals 3 067 3 043 -1% Winter Oilseed Rape 638 447 -30% Spring Oilseed Rape 39 78 100%All OSR 678 525 -22%Other Oilseeds 36 65 82%Combining Peas 33 42 25%Field Beans 138 180 30%Total Combinables 3 952 3 855 -2%
Other ArableMaize 169 225 33%Sugar Beet 116 128 10%Other Crops 109 130 19%Fallow Land 196 250 27%Total Other Arable 591 733 24%
Vegetables, Fruit and FlowersPotatoes 143 136 -5%Vining / Processing Peas 42 0 -100%Carrots 11 7 -40%Onions 11 5 -50%Other Vegetables 59 39 -34%Apples 9 6 -30%Other Fruit 20 18 -13%Ornamental Crops 12 10 -16%Total Horticulture 307 221 -28%
Grass and Other LandTemporary Grass 1 300 1 350 4%Permanent Pasture 5 854 5 850 0%Outdoor Pigs 9 9 0%Rough Grazing 5 132 5 127 0%Woodland and non-Agric. 1 174 1 173 0%Total Grass and Other 13 467 13 509 0%
Total Farmed Area 18 317 18 317 0%
The Andersons Centre CPA-NFU-AIC
October 2014 Page 47 of 67
5.3.2. Further Consequences
These changes in the financial status and structure of the farming sector will have consequences that are not fully
covered in the model. Lower output and profitability is likely to accelerate a restructuring of the farming sector.
Farms that are financially weaker or less efficient are likely to cease production with their land taken over by
‘better’ business. Thus, the long-term trend towards fewer, but larger farming enterprises in UK agriculture could
well increase. Whether this is a good or bad thing is debatable. It may result in a more streamlined sector, but
there may be social consequences in certain areas with the loss of traditional ‘family farms’. Obviously for any
individual farm that is rendered uneconomic by the changes, the effects are massive, and usually traumatic. It is
also arguable that larger, ‘leaner’ business might be less willing to spend on landscape maintenance or
biodiversity enhancement.
In certain sectors the demand for labour might actually rise. This is especially true in the horticultural sector,
where hand-weeding or additional labour for grading may be required. However, the past few years have
illustrated the difficulty the horticultural sector has in attracting the indigenous UK population to undertake this
kind of work, which tends to be hard and often relatively low paid. Even in the recent recession, when
unemployment was high, the sector was forced to rely heavily on migrant labour to undertake many of these tasks.
The analysis in this report has assumed that this situation is unlikely to change. It would be difficult for growers
to pay higher wages to attract more workers, as they are under economic pressure from imported produce with
fewer restrictions on pesticides use. Therefore, it has been assumed that a lower area of horticultural crops would
be grown, partly as a result of there not being the labour to satisfy the new labour-intensive production systems.
Overall, it is likely that employment in agriculture will fall as a result of the loss of PPP.

The Andersons Centre CPA-NFU-AIC
October 2014 Page 48 of 67
6. WIDER ECONOMIC EFFECTS
6.1. THE FOOD CHAIN AND CONSUMERS
6.1.1. The UK Food Chain
The farming industry is just one element of the far larger food and drink sector. In 2012, for which the latest full
figures are available57, the ‘agri-food’ sector contributed £97 billion to the UK economy which is just over 7% of
the economic activity of the nation. The entire sector employs over 3.5 million people, around 13% of total
employment in 2013. Figure 1 below shows the contribution of the various sectors of the UK food chain.
Figure 1 – The UK Food Chain, 2013 (Source: DEFRA)
The financial figures in the chart are based on Gross Value-Added (GVA). GVA is a measure used in national
income calculations. It is the output of an industry, less the value of ‘intermediate inputs’. These are inputs
purchased from other sectors of the economy. GVA does not include the cost of depreciation, wages, interest and
rents. It can therefore be seen as the return on all labour and capital invested in an industry. In 2013 the GVA of
agriculture was £9.2bn, whilst profit (TIFF) was £5.5bn.
UK Consumers
64 million peopletotal spend = £196bn
Consumers' expenditure on catering services = £84bn
Household expenditure on food and drink = £84bn
Catering SectorGross Value Added = £26.7bn
Employees = 1,444,000
Food & Drink RetailersGross Value Added = £27.7bn
Employees = 1,168,000
Food & Drink WholesalersGross Value Added = £9.6bn
Employees = 222,000
Food & Drink ManufacturersIncludes primary processing (e.g. milling) through to
complex prepared foods.
Gross Value Added = £24.1bnEmployees = 378,000
DistributionInvolved in all parts of the chain
Agricultural Wholesalers
Gross Value Added = £2.2bnEmployees = 34,000
Exports
Total value = £18.9bn, of which
Highly processed = £11.1bnLightly processed = £6.4bn
Unprocessed = £1.4bn
ImportsTotal value = £40.2bn, of which
Highly processed = £14.4bnLightly processed = £17.8bn
Unprocessed = £8.0bn
Food Supply IndustryGross Value Added = £320m
Employees = 6,000
Farmers and Primary Producers
Gross Value Added = £9.2bnEmployees = 464,000
Agricultural Supply IndustryGross Value Added = £1.2bn
Employees = 13,000

The Andersons Centre CPA-NFU-AIC
October 2014 Page 49 of 67
6.1.2. Likely Changes
Section 5 discussed the physical and financial implications to the agricultural industry from the loss of PPP. The
wider economic effects can be calculated from the information contained on the flowchart in the previous section.
The starting point is that it is assumed that the UK population will not consume any less food and will continue to
consume it in the same way i.e. the balance between food consumed inside and outside the home will remain
broadly constant. (This balance may well change if food became more expensive – the recent recession saw a
decline in eating-out due to economic pressures.) With the same amount of food being consumed, the effect on
retailers and caterers is likely to be negligible. Food wholesalers will also be largely unaffected as they would
amend their supply chains to source more imported products at the expense of home-produced food.
The key sectors affected would be Food and Drink Manufacturers, Agricultural Wholesalers and the Agricultural
Supply Industry. In addition the Distribution sector, which links all these together, would also see losses.
Taking these in turn, the effect on Food and Drink Manufacturers would have the largest economic effect. It can
be seen that the GVA of this sector is between two and three times larger than farming, thus any changes will have
a more significant impact.
Food processors and manufacturers tend to base themselves near to their supply of raw materials. This is because
the unprocessed product for example wheat, milk, etc. tends to be bulky, whilst the processed product such as
bread and cheese is less so. As a result, transport costs are minimised. Traceability and provenance are also
reasons why manufacturers like to be close to and have a relationship with their primary suppliers. Often, in
marketing and branding terms, having the raw material sourced from a specific location is part of the appeal (e.g.
Scotch Whisky). In some cases, these geographical links are enforced legally through the EU’s system of
labelling food products. These are Protected Designation of Origin (PDO), Protected Geographical Indication
(PGI), and Traditional Specialities Guaranteed (TSG).
Looking at the effect of the loss of PPP from the model, the following output drops are forecast for the
commodities under investigation;
Table 17 – Drop in Raw Material Output
It is unlikely that food manufacturing will decline by a similar percentage to the fall in raw material availability.
This is because;
The loss of PPP mainly affects crop production. The effect on livestock production would be less marked
(although feed prices would rise). As much food manufacturing (at least half) is involved with the
processing of livestock products, the loss of PPP would be minimal on this sector.
Food processors and manufacturers have a considerable amount of ‘sunk costs’ in their current plants and
factories. Although they favour domestic sourcing, it is likely that they would import raw materials to keep
these facilities operating at economic throughputs. Therefore, it is unlikely that there would be an
'000 tonnes Base Post-Loss % changeAll Cereals 20 721 18 124 -13%Oilseed Rape 2 319 1 474 -36%Carrots 702 316 -55%Onions 366 92 -75%Apples 224 148 -34%

The Andersons Centre CPA-NFU-AIC
October 2014 Page 50 of 67
immediate ‘offshoring’ of a large element of UK food production. Instead, when new investment was
being made, it would be far more likely to be made outside of the UK and probably the EU. Therefore,
there would be a gradual decline over a period of time in the manufacturing sector.
Although the raw material losses are higher in the fresh produce sector, the amount of processing tends to
be less.
For all these reasons it is considered that, in the medium term (once ‘offshoring had taken place), the loss of GVA
in the food and drink manufacturing sector could be in the region of 10%. This would equate to an economic loss
of £2.5bn. If the workforce showed the same level of change, this would see job losses of between 35,000 to
40,000. There would be knock-on effects on the Food Supply Industry (machinery and equipment for Food
Manufacturers and Processors), but this is difficult to quantify.
As a group, Agricultural Wholesalers both sell products (inputs) to farms and also buy and trade their produce.
This dual role exposes them to reductions in the size of the primary agricultural industry. In terms of inputs, the
model demonstrates that, although values of seeds, fertiliser, plant protection products and fuel will fall, the drop
is not dramatic. Taken together, the declines average about 5%. It may appear that these falls are offset by the
increase in animal feed sales. However, as price rises have been driven by raw material price increases, the
returns to Wholesalers will not increase.
More dramatic changes will result from the output side. The Wholesalers are involved in the trading of
combinable crops. More specialist crops such as potatoes, roots and fruit have dedicated, more direct, supply
chains. The livestock sector also tends to have supply chains separate from Wholesalers. This means that grain
trading is the primary ‘upstream’ activity of these companies. It can be seen from Table 17 above that volumes of
grain available from UK farms drops considerably with the loss of PPP, by somewhere in the region of 15-20%.
It is assumed that two-thirds of Wholesaler business is in input supply. Of this figure, half is in the livestock
sector which is relatively unaffected by the loss of PPP. The remaining third of business is from trading grain
and other outputs.
Working through the figures, it results in an estimated loss of GVA for the Agricultural Wholesaling sector of
£0.18bn. This equates to an 8% drop in economic output. Again, assuming that the effects on employment would
be proportional to the drop in business activity, the effect could be to see job losses of just around 2,700.
In this analysis, the Agricultural Supply Industry is defined as manufacturers of products for use in agriculture.
This includes machinery, equipment, fertilisers and pesticides. It has been demonstrated that the total amount of
agricultural activity in the UK will only drop slightly as a result of the loss of PPP. Indeed with more cultivations,
the demand for farm equipment and machinery may actually increase.
Many of these Supply Industry businesses are international and export a significant proportion of their UK
production. This would still occur after PPP loss and increased exports may be able to offset reductions in the
domestic market. However, as discussed in section 5.2.3, it is likely that other EU countries would be
experiencing many of the same effects. Therefore, unless they had access to markets further afield, the effect on
demand for their products may well be noticeable. If an 8% overall reduction is assumed, that would suggest a
loss in GVA of £0.1bn. The effect on employment would be the loss of over 1,000 jobs.

The Andersons Centre CPA-NFU-AIC
October 2014 Page 51 of 67
Perhaps of greater importance in this sector is the effect that policy is having on investment and research and
development in new PPP. This is covered in more detail in section 6.3.
Finally, it should be remembered that the ‘lost’ output from UK agriculture illustrated in Table 17 is assumed to
be replaced by greater imports. The UK already runs a substantial trade deficit in foodstuffs as is shown by the
data in Figure 1 – exports of £18.9bn, imports of £40.2bn. The UK balance of payments would worsen following
any loss of key PPP. At the revised prices used in the model, the cost of additional imports would worsen balance
of payments by almost £1.0bn (£960m). This assumes the replacement products are purchased in their most basic
form. If they are processed outside the UK, then the change would be higher.
6.1.3. Consumer Availability and Choice
It has been a general presumption within the modelling that any loss of UK output will be replaced by imports
from less restricted production regions around the world. The UK consumer is relatively wealthy in global terms,
so could ‘outbid’ other buyers for the food we demand. Whilst this is fine for the UK, it does not help food
availability in other parts of the world.
It has already been covered that the costs of some raw materials will rise from export parity to import parity
prices. This is mainly grain, which forms a relatively small element of the cost of final retail food prices (the
wheat costs is less than 10% of the shop price of the typical loaf). It would also be present in the other products
that have to be imported instead of being home grown – there would be additional transport costs, the cost of
securing supplies (beating other buyers), and any market effects from lower overall global production.
With most UK consumers spending a relatively small proportion of their income on food, any small price rise may
not have a large impact on the majority. But it should not be forgotten that even in the UK there are those on low
incomes who struggle to secure enough nutritious food. Research funded by Tesco published in 201358 found that
18% of the population had suffered some sort of food poverty in the previous 12 months. Any price rises would
disproportionally affect this group. An argument could be made that policy and standards imposed by an ‘elite’
are adversely affecting the poorest.
It cannot be assumed that the imports that substitute for lower domestic consumption will be of the same standard.
Retailers have minimum quality protocols, but as the horsemeat scandal showed, particularly in processed
products or where there are long and complex supply chains full traceability cannot always be guaranteed.
Some production would inevitably be exported to parts of the world with lax regulatory and inspection regimes,
and so the temptation and ability to ‘cut corners’ on quality would be high.
In any event, the produce may well be grown using PPPs that are perfectly legal in the country of production, but
which are not authorised in the UK. Food production will have been exported with no improvement in safety.
There are also more subjective issues. With greater imports, the ability to buy home-grown, local or even
seasonal produce will diminish. There is already a lack of understanding in the UK population about where and
how their food is produced. If more of it is simply shipped-in on a boat then the large ‘disconnect’ between the
majority of food consumers and food production could become even greater.

The Andersons Centre CPA-NFU-AIC
October 2014 Page 52 of 67
6.1.4. Resilience of the UK Food Chain
The concept of food security is much-debated. In many cases it is conflated with self-sufficiency - i.e. if we
produce what we consume on these islands, then our food security is ensured. In a modern, open trading
economy this perhaps does not make much sense. It is no more vital that the UK has high self-sufficiency in food
than, for example, the Isle of Wight does.
However, in an uncertain world, with sophisticated but delicate supply chains there are pinch-points that could
threaten food security. Some of these were highlighted in a DEFRA report59 on food security. This highlights
that having a diversity of supplies makes the UK’s food security greater – if there is a crop failure or disease
outbreak it is relatively easy to switch to alternative sources.
However, the complexity of modern supply chains causes its own problems in terms of resilience. Over 90% of
the UK’s food imports come by ship. It is therefore crucial that shipping lanes remain open. Whilst any major
disruption to seaborne trade seems unlikely, the handling of imports comes through only a small number of UK
ports. A recent study60 shows that 50% of food imports come through just six ports (Channel Tunnel, Dover,
Felixstowe, Southampton, Thames/Medway, and Humber). Any disruption through natural or man-made disaster
to these would severely constrain the UK’s ability to import in the short-term.
There is then the internal logistics of food supply. Many of these ports are located in the south of England and
disruption to the transport infrastructure would result in the food not being able to reach consumers. This is not
just an issue with imports however. The rise of just-in-time logistics means that there is less resilience built into
the system. The whole food supply, manufacture and distribution is also very energy-dependent, and any
disruption to energy and fuel supplies could have severe effects on availability.
Having home grown food does not solve all these problems. But it does create a more diverse food supply
infrastructure, and results in sources of food being spread around the countryside.
Table 18 – Changes in Availability of Key Foodstuffs (Source: DEFRA – Agriculture in the UK)
6.1.5. Competitiveness
It has been referred to in other sections of this report, but it is worth highlighting the competitive effects of
policies on PPPs on UK and EU farming. If effective, and cost-effective, products are not approved or restricted
at the UK or European level, whilst being allowed in other parts of the world, then this places domestic production
'000 tonnes
Current UK Consumption
Current UK Production
Current Self-Sufficiency
Revised UK Production
Additional Imports
Revised Self-Sufficiency
CommodityWheat 13 910 13 894 100% 11 062 2 832 80%Barley 5 201 5 981 115% 6 006 - 24 115%Oilseed Rape 1 994 2 319 116% 1 474 845 74%Sugar 2 055 1 211 59% 1 174 37 57%Potatoes 7 149 5 832 82% 4 876 956 68%Apples 670 224 33% 148 77 22%Carrots 729 702 96% 316 386 43%Onions 729 366 50% 92 275 13%

The Andersons Centre CPA-NFU-AIC
October 2014 Page 53 of 67
at a considerable disadvantage. Other regions will be able to produce food at a lower cost of production and will
gain market share at the expense of domestic production.
This makes little sense if it only serves to export production to the least-regulated and least-cost parts of the world.
An example of this is the ban on sow stalls unilaterally imposed in the UK in 1999. It was not until 2013 that the
rest of the EU followed and implemented the same sort of restrictions. In that time the UK had lost around half of
its breeding pig herd.
The crop protection sector recognises that a ‘race to the bottom’ in terms of lowering standards to reduce costs is
not in the best long-term interest of anyone. However, there is a strong argument that Europe and the UK should
not get too far ahead of the global mainstream and undermine its own production base
6.2. ENVIRONMENTAL EFFECTS
6.2.1. UK Countryside and Biodiversity
The use of PPPs has been widely blamed for a loss of biodiversity in the UK (for an example, see this61 report).
However, other scientific studies62 have shown there is a more nuanced situation with many other factors
contributing to changes in biodiversity.
The agricultural and horticultural industries have become far more aware of the environment over the past quarter
century. Programmes such as agri-environment schemes, the Voluntary Initiative (VI), and LEAF (Linking
Environment and Farming) have demonstrated that modern farming can co-exist successfully. Indeed, it can be
argued that having ‘intensive’ agriculture leaves more room for the environment elsewhere.
It should be acknowledged that the farming and agro-chemical industries have moved on since the 1950’s and
1960’s, with better science and greater environmental and social awareness which has affected product
development and use. There is also an appreciation of the importance of comprehensive regulatory controls. But
those controls need to be proportionate, properly applied through risk assessment, based on clear guidelines and
underpinned by robust scientific evidence.
It is also recognised that science progresses, and additional knowledge and techniques have changed and continue
to change the regulations to protect the environment and biodiversity. Again, this needs to be based on sound
science and not political considerations. In addition, a careful weighing of the costs and benefits of any additional
regulation should be undertaken. There is a strong perception that the regulators see their task as to ‘regulate’ –
i.e. there is a strong built-in bias to be risk-adverse, and continually add additional ‘safeguards’. However,
regulation does not exist in a vacuum. Any loss of an approved active substance will involve a trade-off between
possible environmental benefits and potential losses in agricultural output. This should be considered more fully,
especially in the context of the global need for food outlined in the following section.
Like all technologies, additional research and development of PPP should result in ‘better’ products. This does
not necessarily mean more effective control of pests; it could equally involve a product with similar control to
present PPP, but with a ‘lighter touch’ on the wider environment. This makes the case for ongoing research and
development to produce new PPP.

The Andersons Centre CPA-NFU-AIC
October 2014 Page 54 of 67
The results of the modelling work shown in Section 5.3 show a shift to more spring cropping. This is likely to
increase biodiversity, and could be seen as a benefit of the loss of certain PPPs. However, this is a trend that is
already underway for a variety of reasons – whilst policy towards PPPs may accelerate it, it is not key to its
development. It is important to recognise that spring cropping is not feasible in all situations particularly on
certain soil types and that PPP are still needed for productive spring cropping.
6.2.2. UK’s Global Responsibility
Previous sections have already covered the issue of exporting production of food to countries with lower standards
than Europe or the UK. Whilst these producers may receive a short-term economic gain in terms of greater sales,
the long-term environmental effects are unlikely to be beneficial. With greater food demand from Europe, there
may be increased pressure in other parts of the world to turn land over to agriculture. Looking at the global
environment ‘in the round’ any gains in Europe from current policy on PPPs would be more than offset by
environmental losses elsewhere.
Within the conclusions of DEFRA’s Green Food Project63 it was stated that there is a ‘moral obligation to do what
we can both domestically and through our influence on other countries to help address the critical long term food
security issue, as well as the more pressing issue of hunger in some parts of the world’. The FAO calculates that
in 2013 there were 842 million people in the world who did not have enough to eat64. Whilst this number has
fallen by 17% percent since 1990, the world still has some way to go to remove hunger.
With this background, it seems perverse that the UK and Europe is not using its natural resources, particularly
good soils and favourable climate, to the maximum advantage. By producing food in a sub-optimal way, it is
actually asking the rest of the planet to take on more of the burden of feeding a hungry population.
At points of lower production/higher price, EU consumer demand for food will impact on poorer countries where
we out-bid locals for supplies of food. Destruction of the biofuel industry also removes an incentive for farmers
to produce enough to buffer low output years – if not produced, grain stocks cannot be diverted for biofuel
processing and into other markets. Over-regulation of futures markets risks exaggerated volatility in both
production levels and prices where price discovery becomes inefficient and farmers respond to misleading signals.
6.3. EFFECT ON RESEARCH AND SCIENCE BASE
6.3.1. Introduction
Discussions with those in the agro-chemical sector have made it clear that the current regulatory environment for
the authorisation for PPP is stifling future innovation. This is borne out by a recent study65 on research and
development (R&D) carried-out for the European Crop Protection Association (ECPA). This is in direct contrast
to the aspirations contained in the UK Government’s Agri-tech strategy66 which states;
‘We want the UK to become a world leader in agricultural technology, innovation and sustainability; exploit
opportunities to develop and adopt new and existing technologies, products and services to increase productivity;
and contribute to global food security and international development’.

The Andersons Centre CPA-NFU-AIC
October 2014 Page 55 of 67
This section looks at some of the trends in plant protection research and the factors that are driving them.
6.3.2. Declining R & D Base
Evidence collated on a worldwide basis since 195065, indicates a pattern of decline in the number of new active
substance introductions since 1997. Of greater concern however is the fact that there has been a significant fall in
the number of new active substances in development from 70 in 2000 to just 28 in 2012.
The share of investment in global crop protection for products used in Europe has fallen from 33.3% in the 1980s
to only 7.7% in the 2005-2014 period65. European farmers can no longer draw on the same amount of new
technology to drive agricultural production as their competitors in other parts of the world. Whilst Europe was
benefitting from new agrochemical introductions at a rate of 4.1 and 4.0 per annum in the 1980s and 1990s, this
rate is predicted to fall significantly to 1.2 per annum between 2005 and 201565.
The greatest regional market expansion in value terms over the past 5 and 10 year periods has occurred in the
developing markets of Asia and Latin America. In Europe the market for conventional chemical plant protection
products is split into three distinct areas, the mature EU-15 markets, the developing new members of the EU-12
and the non-EU European countries, which include the relatively mature Swiss and Norwegian markets and most
importantly the rapidly developing markets in Russia, the Ukraine and other Eastern European countries. It is this
third category, the Rest of Europe which has experienced the greatest growth in Europe. The EU-15 market has
been characterised by relatively low rates of growth.
6.3.3. Causes of the Decline
A number of inter-related factors which have caused the decline in R&D investment in Europe, and hence the UK,
are outlined in the previous section. Of these, the cost of gaining approvals is the most important.
The most recent data on the average cost of bringing a new active substance to market indicates that there has
been a significant increase between 1995 and 2005 of 68.4%67 Of particular note from these figures however, is
that whilst research costs have risen by 18.0%, a staggering 117.9% of the rise relates to development costs
(studies required to achieve registration). It is now estimated that it takes on average 10 years and costs £170
million to bring a new active to market68.
This increase in time and costs is largely due to the quantity of evidence that must be supplied in terms of studies
to support an application. This is a direct result of a more risk-averse regulatory environment. Some of the cost is
for very little gain in terms of safety. An example of this is the Candidates for Substitution legislation. This is
likely to create a large amount of research work through comparative studies, but with minimal or no
improvement in safety or environmental outcomes. In many cases, the modelling work and risk assessments are
not representative of real-world situations in which the products will be used.
Paradoxically, the improvement in science has contributed to the mushrooming cost of approvals. Better scientific
knowledge and equipment creates more and better data. It provides more issues to look at and causes concerns to
be raised.

The Andersons Centre CPA-NFU-AIC
October 2014 Page 56 of 67
All these problems apply not just to the approvals and registration of new active substances. They also apply to
the re-registration of existing pesticides. In a lot of cases, the investment spent on securing a re-registration is
many times the original cost of getting the pesticide approved.
As well as cost and time, the uncertainty of the regulatory environment is another key reason why investment in
research and development has dropped. The introduction of new policies at EU level has created a particularly
unstable policy framework over the past few years. This may settle-down in future with some certainty returning,
but this is perhaps unlikely in the foreseeable future;
Rules and definitions are still to be written in many areas - (e.g. Endocrine Disruptors). EU legislators are
way behind their own deadlines in terms of providing detailed rules.
The Guidance that sets out what evidence is required to be presented for the approvals process is changing
/ being written / re-written. Often this happens whilst a pesticide is within the approvals process - changing
the ‘rules of the game’ whilst it is underway
There can be ‘political’ decisions made outside of the normal regulatory framework – the restrictions on
neonicotinoids are an example of this
The final point is an important one. The crop protection industry feels that this was not science based policy-
making and that due process was not followed. It has ‘spooked’ companies within the sector as, if it can happen
with this class of insecticides, it could potentially happen with other active substance. This only adds to the
uncertainty in gaining and keeping approval for pesticides. At a practical farm-level, such ad-hoc decision-
making means there is no time to develop alternative strategies and certainly not enough time to develop new PPP
to replace those that are banned or restricted.
Given the timescales, costs and uncertainty now involved in the regulatory system, it is not surprising that many
companies are no longer willing to progress new active substances through to development or to invest in Europe.
A very strong business case has to be made to pursue registration. If there is any uncertainty over whether a
pesticide will gain an approval it is simply ‘strangled at birth’.
As registration costs rise, the commercial calculations change. To make a return on the huge investment needed
the PPP needs to have a large market potential. This means world-wide products, not just those targeted at the UK
or even just Western Europe. In addition, the product must have uses on the major global crops. This means there
is very little product development for more minor crops and, even if a product is developed for minor crops, it
may not be submitted for authorisation in Member States where the market is considered too small. The main
focus for R&D is cereals, followed by maize then oilseed rape and soya. From an R&D perspective, the EU-15
market is seen as low-growth and this limits its attraction as a focus for R&D investment and new active substance
development.
Another trend contributing to the decrease in European R&D is the lack of GM technology. Analysis clearly
indicates that R&D investment in the seeds and traits industry is growing at a faster rate than for agrochemicals, a
trend that has been evident since 201065. This situation draws investment away from Europe, as this part of the
world still severely restricts this technology. It is not only the R&D investment that goes into breeding, but
additional investment is also made in the chemical protection required to support GM seeds. This means that
research goes into creating PPP that are unlikely to be suitable for use in Europe.

The Andersons Centre CPA-NFU-AIC
October 2014 Page 57 of 67
With the EU singled out as the region with the most severely regulated pesticide registration system in the world,
R&D companies looking to maximise their chances of successful registration and commercial return for new
innovative products now invariably focus their investment outside Europe.
6.3.4. Market Structure
The high costs and uncertainty built into the EU approvals process creates a high barrier to entry to the sector.
Worldwide, the number of companies involved in the research of new active substances has halved from 35 in
1995 to 18 in 201265. In Europe specifically, the number of companies involved has fallen from 8 to 4 during this
time. This trend has clearly affected levels of competition in the new product area and the diversity of products
that have been developed. In the past small start-up companies have often been responsible for technology
development, however as the associated costs and risks have escalated this source of innovation is far less
common.
The cost of the approvals process is also discouraging ‘generic’ manufacturers. This means there is less
completion in marketplace, even for those active substances that come off-patent.

The Andersons Centre CPA-NFU-AIC
October 2014 Page 58 of 67
7. MITIGATION STRATEGIES
7.1. BACKGROUND
It is unrealistic to expect an industry as dynamic as farming to accept the potential level of change outlined in
Section 5 without responding to it, and trying to minimise the effects.
Other production systems such as organic farming are often cited as a realistic alternative to the caricature of
‘industrial’ agriculture. This section will look at such alternative approaches and assess if they offer a viable
solution.
7.2. ORGANIC FARMING
7.2.1. Organic Principles
The concept of organic farming embraces philosophies and assumptions that are well beyond the simple label of
‘chemical free’. The aim is to create a ‘sustainable’ farming system based on the minimum use of external inputs.
Techniques include wide rotations; the use of organic matter to provide humus enriched soils; the use of only
water-insoluble fertilisers; cultivations and mechanical weed control; exclusion of synthetic fertilisers, chemicals,
growth regulators, and routine antibiotic applications. The use of genetically modified organisms is also
prohibited. Ecological balance and the preservation of soil structure and micro-organisms are fundamental to the
system. Such farming needs a high degree of management skill and may be best suited to those already operating
low-intensity systems.
Due to the restrictions placed on farming practices, yields are usually lower under organic systems. To offset this,
premium prices are required for organic produce. To achieve the price premiums required to make organic
production viable there may be a greater need to successfully market the produce than under ‘conventional’
systems. Furthermore, larger acreages are required for cropping to offset the impact of lower yields, which in turn
has an effect on the uncropped areas available for wildlife.
Despite the commonly held belief that low yielding organic agricultural systems are more environmentally
beneficial and sustainable than high yielding farming systems, the reality is not always true. Many professional
researchers and scientists suggest that these claims are as yet unproven and require more research. Indeed one
leading organic researcher admitted that in organic farming ‘there is very little science’ and that ‘this gives rise to
a great deal of illogicality and confusion particularly in some areas of production’.69
7.2.2. Organic Production
UK cereal farmers have significantly increased production over the past 65 years from a cereals area that has been
in decline since the 1980s. DEFRA figures indicate that the average farm now produces three times more per
hectare than in 1945. While better management techniques, improved plant varieties and fertiliser applications
have had a significant part to play, the use of synthetic pesticides has both enabled and protected these gains.

The Andersons Centre CPA-NFU-AIC
October 2014 Page 59 of 67
Crop yields are significantly lower within an organic farming system where synthetic chemicals are not used.
Research in Germany70 has shown that overall, crop yields would roughly halve without their use. This conclusion
is supported by other studies, both modelling and on farm studies, which routinely found organic wheat yields to
be about 50% of conventional wheat yields.
More recently, ADAS (2008) suggests that an absence of chemicals would see a reduction in wheat yields, and
implicitly cereal yields in general, in excess of 60%. It found that this reduction would result more or less equally
from the loss of synthetic herbicides and fungicides. It concluded that the effectiveness of herbicides in
controlling weeds would only partly be offset by increased ploughing and labour costs per hectare. Furthermore,
the loss of synthetic fungicides would end modern cereals farming in the UK and by implication Europe. The
ADAS study went on to highlight similar yield losses for all arable crops, vegetables, fruits and grasses.
These findings prompt the question as to whether the area of land used for cropping could be increased to make up
the shortfall in organic yield, or whether customers would look to import from elsewhere. In the UK, there is little
scope to increase the cropping area. Currently the UK cereals area is around 3 million hectares compared to
around 4 million 25 years ago. In the intervening years much of the ‘surplus’ land has been lost to development
and it is by no means certain that land currently in other crops would be made available. This pattern of lower
output is likely to be similar in Europe and other parts of the world, where demand for cereals would also outstrip
supply. On a global scale, whilst yield loss in some areas could be more readily offset by bringing more land into
production, even in parts of the world less constrained than Europe greater awareness about the associated costs to
biodiversity and natural resources is becoming more influential.
In reality, every type of agriculture has an impact on the environment. The perception that organic farming per se
is better for the environment because it relies on natural processes does not always hold true. Natural processes
are variable and outside the grower’s control71. This can cause problems, for example the natural breakdown of
mineral nitrogen can occur at the wrong time for the plants, increasing the chances of nitrate leaching72
Furthermore, on organic farms where most of the weed control is undertaken mechanically, this can exacerbate
the problems of soil compaction, the disruption of soil structure and soil erosion whilst at the same time increasing
fossil fuel consumption and global warming. An integrated approach in contrast can combine herbicide use with
no till (or min till) practices to reduce soil disruption, increasing soil porosity and water holding capacity.
The use of soluble mineral salts prohibited by organic regulations is another contentious issue. The minerals
removed from the land as food must balance those put back by other means. Organic farmers typically rely on
legume nitrogen fixation, rain water or mineral recycling. The few detailed accounts that are available suggest
slow but accumulating mineral deficits particularly of potassium and phosphate on organic farmland73.
7.2.3. Can Organic Farming Feed the World?
There is clear evidence to suggest that organic agriculture is politically favoured as an environmentally benign
alternative to the use of chemicals. However, there is also a significant body of professional opinion that believes
widespread organic farming on a global scale is simply not a viable option at this time. In particular, Pacanoski74
is of the opinion that whilst organic farming may satisfy the whim of the rich American and European consumer,
its extension to the developing world would be a disaster. He reinforces this belief by quoting the Indian

The Andersons Centre CPA-NFU-AIC
October 2014 Page 60 of 67
biotechnologist CS Prakash who observes that ‘the only thing sustainable about organic farming in the developing
world is that it sustains poverty’.
The Food and Agriculture Organisation (FAO) of the UN predicts that there will be 9 billion people in the world
by 2050 and that a population of this magnitude will require a 70% increase in food production to survive. Whilst
increasing the land area used for production might seem the most logical response to a problem of this scale, there
are a number of reasons why this suggestion is not a realistic option by itself and would be particularly difficult
for organic farming alone to achieve.
According to Paarlberg75 synthetic fertilisers currently supply around 40% of all nitrogen used by crops grown on
a global scale. Given the current levels of attention to climate change, the replacement of these artificial sources
with animal manures requiring an increase in the global cattle herd from around 1 billion to 7 billion, would be an
environmental disaster. Furthermore, with rising land scarcity and wage rates in much of Asia, the likelihood of
diverting already pressured farmland to more extensive green regimes is minimal.
One further factor to consider is that the reliability of harvest in organic farming systems is less certain than in
those that use a full range of technologies. Therefore, additional average production could be required in order to
provide a ‘buffer’ against crop failures and preserve food security.
The Soil Association76 sees things differently however, believing that organic and other agro-ecological farming
systems can help the world feed itself, that they are best suited to the needs of the poorest people and they have
the potential to reverse environmental degradation. It does however qualify this by acknowledging that a change
in farming systems in isolation is not the answer, highlighting the need for different eating habits, less food
wastage and alternative feeding regimes for livestock.
Smaje77 concludes that there is probably still a case for a bit of both; organic and conventional rather than just
either/or. He believes the agricultural industry is not currently in a position to abandon synthetically fixed
nitrogen and mined phosphates any time soon, and feels it makes sense to use all the technological means at our
disposal to optimise the efficiency. Nevertheless, he does support some of the views held by the Soil Association
in believing there is a case globally to rethink in the longer term the way we recycle nutrients, respond to the
demand for meat, manage our waste, structure our labour markets and allocate global resources.
In summary therefore, it is evident that organic farming practices in the UK are unable to satisfy the levels of
demand for agricultural produce on their own. The yields associated with organic production are insufficient to
match demand, there is an increasing reluctance to pay premium prices and there is a finite supply of available
land to extend cropping acreages. Furthermore, there are three important additional considerations which reinforce
the situation further. Firstly, the effect of lower yields will be compounded by the fact that in the absence of
modern inputs to control pests and diseases, more land will need to be left fallow or sown to grasses and legumes.
Similarly, for those crops that make it into storage, the absence of synthetic chemicals to ensure cheap, efficient
protection will contribute to further reductions in yield as a result of post-harvest losses. And finally, many farms
in developed countries would find it impossible to recruit the cheap, willing labour they would need to control
weeds economically in the absence of chemical inputs.

The Andersons Centre CPA-NFU-AIC
October 2014 Page 61 of 67
7.3. PRECISION FARMING AND INTEGRATED PEST MANAGEMENT
Increasing concerns about the sustainability, environmental impacts and health effects of intensive farming have
led to an increased demand for the development of alternative farming systems such as precision farming and
integrated pest management (also called integrated farm management). Precision farming is the integration of
information, utilising computer technology, GIS and GPS devices and remote sensing to match inputs with actual
yields across different parts of both fields and individual farms. Estimates suggest that in the region of 60% of the
UK farmland is farmed using precision technology. Whilst the numbers of farmers using these systems is thought
to be low by comparison as a result of restrictive economies of scale, it is likely that more will be looking to use it
in future as the costs of the technology come down.
Integrated Pest Management (IPM) is a whole farm approach to management that aims to help farming systems
adapt to, eliminate or reduce the negative impacts of production on the environment whilst maintaining the
economic viability of the farming enterprise. More specifically IPM seeks to minimise the use of pesticides and
fertilisers through better targeting and integration with cultural control of weeds, pests and diseases78. The
development of IPM is encouraged under the EU’s Sustainable Use Directive – a summary can be found in a
recent note from the NFU79.
For many farmers IPM is a logical development of their current conventional farming systems, combining the best
of traditional methods with appropriate modern technology. This practice was conceived as being a dynamic
concept rather than a prescriptive process, enabling it to adapt to new technology and changing market pressures
and consumer demands. It is important to stress however that the concept was conceived as one of ‘integration’
and not one that sought to exclude conventional crop protection products entirely.
While IPM techniques are generally considered to have more beneficial than adverse effects on sustainable
farming practice, there are nevertheless some areas of conflict. In particular, the mechanical and physical
techniques aimed at reducing pesticide use. A number of these techniques involve an increased use of energy and
other resources and, in the case of physical barriers, may create other problems such as additional waste or
adverse effects on biodiversity and the landscape.
IPM techniques associated with soil management tend to be associated with more positive benefits for energy
consumption and efficiency. Examples include fertility building crops, managing weeds through rotation, careful
field drainage management and fertiliser applications. However, although the application of manures provides a
valuable source of plant nutrients and can often be a direct replacement for inorganic fertilisers, manures can also
be a source of environmental pollution and a high negative score for climate change.
It is evident that IPM works best when there is an appropriate balance between cultural and chemical control and
there is merit in pursuing these opportunities in future.
Most recently, a study published in Nature80 commented that yields should only be viewed as part of a set of
economic, social and environmental factors that should be considered when evaluating the benefits of different
farming systems. Foley adds that ‘by combining organic and conventional practices in a way that maximises food
production and social good while minimising adverse environmental impact, we can create a truly sustainable
food system’.

The Andersons Centre CPA-NFU-AIC
October 2014 Page 62 of 67
7.4. BIO-PESTICIDES
Biopesticides are PPP derived from such natural materials as animals, plants, and bacteria. Three main types are
seen in the EU. Microbial pesticides have a micro-organism (e.g., a bacterium, fungus, virus or protozoan) as the
active substance. Botanical pesticides are naturally occurring substances that have plant protection
properties. Examples are plant derived products such as garlic extract or vegetable. Finally, there are Semio-
chemicals such as insect pheromones.
Examples of microbial pesticides used in the UK are Bacillus thuringiensis which is a bacteria which causes
disease in many insects, Bacillus subtilis a bacteria used to control grey mould in fruit, and the fungus
Coniothyrium mintans to control sclerotinia in oilseed rape.
These products have a number of advantages. They are usually fully bio-degradable with no metabolites resulting
as is the case with ‘synthetic’ pesticides. There is usually no withdrawal period after the use of biopesticides.
Their mode of action is often very restricted – only attacking a very specific pest. This means they are targeted
and do not affect other parts of the environment.
A number of drawbacks have been suggested for biopesticides. They are perceived to be more costly than
synthetic PPP (although this is not necessarily the case). The products tend to be slower acting. This means they
are more suited to preventative applications, than immediate treatment of an outbreak. A sufficient density of the
control product must be maintained over a period of time for the biopesticide to take effect. Sometimes this can
be problematical due to all the climatic and biological factors in play in field situations. Multiple applications
may be required rather than one or two applications of synthetic PPPs.
In general, it might be considered that the use of these products requires a ‘mindset’ change. They are more about
controlling pest populations below levels that are injurious to the crop, rather than the removal of pests. There is a
greater degree of management required than with conventional pesticides. This is due to the need for multiple
applications, and the requirement to use the product before the pest becomes established. This partly explains
their greater take-up in the specialist cropping sector where the areas of crop are less, the value higher and the
management more intensive. There is also an issue (as set out in Section 4.7.1) that there are often limited
synthetic pesticides available for ‘minor crops’. Therefore any PPP is welcomed. Broadacre cropping currently
has a variety of control options, although these are decreasing as this report has demonstrated. Therefore the
growers have, until now, continued to use the ‘simpler’ synthetic PPP.
Biopesticides look to have a positive part to play in plant protection in the future. Indeed many of the major agro-
chemical companies have made investments in this sector in recent years. However, like IPM, they are likely to be
complementary to synthetic pesticides, rather than a straight replacement.
Perhaps the most important point however, is that they are still ‘pesticides’. Biopesticides are subject to the same
EU approvals process as synthetic active substances. This means that getting a biopesticide product onto the
market is subject to all the same issues of cost, delays and regulatory uncertainty as any other PPP. Therefore
biopesticides do not provide an alternative option to ‘bypass’ the current policy environment.

The Andersons Centre CPA-NFU-AIC
October 2014 Page 63 of 67
7.5. FUTURE DEVELOPMENTS
Advances continue to be made with agricultural information technology, with more farm equipment being fitted
with smart sensors. These are capable of reading everything from plant health and water needs in the crop to
organic matter and nitrogen levels in the soil. Furthermore, in future drones will be more commonly used to
identify crop health across fields. Farmers now have the opportunity to improve the timing, placement and
management of key inputs during the growing season. Previously, such ‘precision farming’ technology had
tended to focus on nutrients, especially, nitrogen requirements. However, increasing use is being made of variable
rate spray applications. This has the potential to significantly reduce the quantity of pesticides being applied, as
they will only be placed where they are useful. However, even if the quantities are reduced, this technology still
needs effective and useful pesticides to be successful. Therefore, such technology is not a solution to the problem
of losses of key PPP.
Robotics engineering is a new area of study which is destined to take off in precision farming as technology seeks
to reduce labour inputs and the potential for human error. An increasing number of ‘farmbots’ are being
developed to remotely check crops for growth, moisture and signs of disease. This year the UK government has
allocated funding of £70 million to go towards the commercialisation of new agricultural technologies including
robots. It is suggested that the logical endpoint of this technology will be autonomous robots that will ‘rove’ a
field and detect weeds in the crop on an individual basis. The weeds could be controlled by spraying micro
quantities of pesticides on the specific plant. Again, though, this still requires approved pesticides. Alternative
methods such as lasers to ‘burn off’ the growing point to the weed plant have been suggested. Although this
offers a ‘pesticide free’ alternative, it only seems a feasible option with weeds, and still leaves the problem of
diseases and insects.
Other technology may have a role to play in this. There are biopesticides (see above) which are perhaps more
suited to disease and insect control rather than weeds. In addition, techniques such as using suction to remove
insects from horticultural crops have been used. In the specialist sector, the protection of crops under plastic
(polytunnels) enables a micro-climate to be created and this has greatly assisted the control of pests. It seems
unlikely that these technologies could be employed cost-effectively at large scale on the ‘broadacre’ crops grown
across much of the UK however.
In general, whilst new technology offers some exciting opportunities, it is not currently developed enough to
replace PPP. Even when the technology improves, and costs reduce, it seems unlikely to offer the complete
answer. Like biopesticides, IPM, and even organic farming techniques, it is likely to provide one element of a
holistic approach to plant protection, in which synthetic PPP continue to play an important part. It will enable
PPP to be used far more effectively, but it will not be a replacement for PPP.

The Andersons Centre CPA-NFU-AIC
October 2014 Page 64 of 67
8. CONCLUSIONS AND RECOMMENDATIONS
The main conclusions of this study are summarised below. For ease of reference, they have been grouped under
sub-headings.
8.1. POTENTIAL LOSSES
The current EU policy regime for Plant Protection Products (PPP) risks severely damaging UK (and by extension
EU) agriculture by removing or limiting the use of key active substances. By drawing on various sources, this
project has identified that the continued use of 87 (out of a current UK-approved total of around 250) active
substances could be threatened by the cumulative effects of these policies.
In practice there is a sliding scale of threat. In an uncertain policy environment, gauging this is not easy.
However, it has been assessed (through widespread consultations with the industry) that 40 active substances are
likely to be lost or restricted in their use. Of that number, 10 are insecticides, 12 fungicides, 16 herbicides and 2
molluscicides.
8.2. EFFECT ON CROP PRODUCTION
The active substances deemed likely to be withdrawn or restricted are important in UK crop production. Control
of weeds, disease, and pests in key crops grown in the UK would become far more difficult.
Whilst, there may be alternative pesticides to replace those likely to be lost, very often they will be less cost
effective. In addition, the loss of any key active substance reduces the number of ‘modes of action’ against a
specific pest. This means ineffective control, and resistance build-up is more likely. By limiting the control
options, some pesticides and products will be used more widely. This could lead to increasing residues of these
alternatives being found in the environment or in food and then they, in turn, could face restrictions.
For the key combinable crops grown in the UK (wheat, barley, oats, oilseed rape, peas and beans), the control of
grass weeds (particularly blackgrass), is a vital issue. Broadleaved weeds are currently less of a problem, but
could emerge as a major threat in the future. The impact of fungal diseases in cereals would also be far greater
with the loss of threatened PPP.
In higher-value crops in the fruit and vegetable sector, insects and nematodes are important pests. These pests can
affect both crop yields and quality, the latter jeopardising the chances of a crop being accepted by the retailer and
consumer.
The area of crops such as apples, carrots and onions is relatively small compared to the ‘broadacre’ crops like
wheat and barley. Although fruit and vegetable production has a high value per hectare, its sales potential makes
it uneconomic for PPP to be developed specifically for these crops. As a result these crops tend to rely heavily on
‘extension of authorisation for minor use’ (EAMU) approvals. This is where a product approved on a major crop
is also allowed to be used on more specialist cropping. Obviously, if the overall approval is not maintained due to
changing policy or economic reasons, then the minor use on the horticultural crop is lost too.

The Andersons Centre CPA-NFU-AIC
October 2014 Page 65 of 67
The likely loss of PPP will lead to lower overall yields in the crops studied. Yield decreases are in the range of 4-
50%, depending on crop. This is based on the effect of losing those PPP classified as ‘high’ risk of being
restricted or not gaining re-approval.
8.3. IMPACT ON THE FARMING INDUSTRY
There are changes in market prices following the loss of some key PPP – largely due to reduced output. In many
cases these price changes are relatively small as it is assumed that the global market would be able to offset the
shortfall resulting from lower UK output. However, it must be remembered that many of these policies are set at
EU level, and thus the rest of Europe would be experiencing the same effects. In areas where the EU is a key
producer (for example cereals), the market changes as a result of losing key PPP are likely be large enough to
cause effects at a global level.
The loss of PPP changes cropping patterns in the UK. Generally, most crop areas decline. This is because it
becomes more difficult and more expensive to grow them with the loss of key PPP. Greater crop rotation also
means a decline in area of the largest crops. However, spring cropping increases and the area of fallow and
temporary grass rises. Lastly, where production of a crop is economically marginal, it is likely that it will no
longer be grown due to reductions in profitability.
This change in the structure of UK crop production is accompanied by changes in farming costs. The use of seed,
fertiliser and PPP all change. In addition, the loss of some PPP means that greater reliance is placed on
mechanical and hand weeding. The rise in cereal values also has an effect on the cost of animal feed for the
livestock sector.
Modelling all these changes sees the Gross Value Added (GVA) of UK agriculture fall by about £1.6bn per
annum. This represents a drop of 20% on the 5-year average 2009 to 2013.
UK farming profit (Total Income from Farming) drops by £1.74bn in monetary terms, but this is a higher
proportion of the overall profit – a 36% drop from current levels. This decline in profitability will cause further
structural readjustment in the farming industry. In general, less efficient producers will exit the sector. Farming
operations will, on average, become fewer and larger.
It should be noted that the economic assessments undertaken in this report aim to be based on the most likely
scenario. They are not ‘worst-case’ estimates.
8.4. WIDER ECONOMIC AND SOCIAL EFFECTS
The impact of the loss of key PPP goes wider than just agriculture and horticulture. Farming provides the raw
materials for the wider agri-food sector which makes up over 7% of the total UK economy. As a result, the Food
Processing and Manufacturing sector would decline over time and would potentially lose an estimated £2.5bn of
its GVA. The associated workforce would see job losses of between 35,000 and 40,000.
The other sectors hit hard would be Agricultural Wholesalers and the Agricultural Supply Industry. Together, the
loss of GVA in these sectors would total £0.28bn with the potential loss of 3,500 to 4,000 full time jobs.

The Andersons Centre CPA-NFU-AIC
October 2014 Page 66 of 67
The UK is a major centre for research and development for PPP. The present EU policy environment is uncertain
and generally unfavourable for the development of new PPP. Not only does this mean that more effective and
environmentally benign alternatives are not being developed, but it also results in investment in this high-tech
sector of the economy coming under threat.
Consumers in the UK will not go hungry as a consequence of the loss of some PPP. Being a relatively wealthy
country, purchased imports could make up any shortfall in domestic production. However, the cost of food for
consumers is likely to rise marginally. This may not have a great impact on the majority of the UK population,
but would be serious for up to a fifth of the population that is already struggling with food poverty.
The make-up of UK food would change if the quantity of imported produce increases. In some cases, this
imported produce would be grown using lower standards than those acceptable in the UK. Therefore, a net loss in
terms of quality and possibly safety would result (‘horsegate’ provides an example of this). In addition, there
would be the potential export of part of the food supply infrastructure. There are also more qualitative issues.
With greater imports, the ‘disconnect’ between the majority of food consumers, and knowledge of where their
food comes from and how it is grown, could become even greater.
In a globalised economy the concept of food self-sufficiency can seem archaic. However, in an uncertain world,
with sophisticated but delicate supply chains, there are pinch-points that could threaten food security. These
might include sea routes, ports, transport infrastructure and fuel supplies. Having a certain proportion of
domestically-produced food can lessen some of these risks.
The increase in exports means some environmental issues are simply exported. This will often be to parts of the
world with far less regulation and enforcement than the UK or Europe. The ‘losses’ in environmental terms in
these countries are likely to be far greater than the (marginal or non-existent) gains in Europe. There is also the
moral question of imposing rich-world production standards on other countries when there are 842 million people
globally without enough to eat. There is a strong argument that Europe should be optimising its output
(sustainable intensification) from its favourable soils and climate in response to this global challenge.
8.5. ALTERNATIVES
An argument is often put forward that alternative production systems not reliant on PPP can provide enough food.
Of these, the most recognised is organic production, which attempts to operate without ‘artificial’ chemicals.
Whilst various studies have found that organic systems could ‘feed the world’ these tend to rely on two large
assumptions. The first is that consumers in the western world change their diets substantially to eat far less meat
and dairy products, and those in the developing world do not adopt ‘western’ diets wholesale. The second
assumption is that the global food storage, transport and distribution system is re-ordered to vastly reduce waste
and create a ‘fairer’ allocation of the available food. Whilst, theoretically, both of these changes are possible,
neither actually looks likely to happen. Again, there is a moral dilemma associated with the imposition of a
certain ‘worldview’ on those who might wish to decide for themselves what and how they eat.
The concept of Integrated Pest Management (IPM) aims to minimise the use of PPP. As the name suggests
however, it is a method by which PPP are used in conjunction with other techniques. Without the underpinning of

The Andersons Centre CPA-NFU-AIC
October 2014 Page 67 of 67
effective PPP the whole structure falls down. New technologies may provide answers to certain crop pests
(mainly weeds), but these are, as yet, not sufficiently developed for commercial use. Effective PPP will remain a
vital component of a ‘rounded’ approach to plant protection.
8.6. OVERALL
The overall conclusion must be that the current direction of policy in the area of PPP is likely to lead to
considerable economic and social loss with the gains, at best, uncertain or minimal.
Any policies should be science-led, and the assessment of risk has to be undertaken on a proportionate basis. A
less precautionary approach with more realistic assessment of risks (rather than hazards) is essential if the UK
wants to continue to benefit from having a thriving agricultural and horticultural sector, which protects the
environment and provides a safe, affordable and sufficient supply of food for UK consumers.

The Andersons Centre CPA-NFU-AIC
October2011 Appendix 1
APPENDIX I – REFERENCES
1 PIP (Anon): Summary of EU Pesticides Regulations. (updated 2011). See http://pip.coleacp.org/en/pip/18110-pip-summary-eu-pesticide-regulations (Accessed August 2014). 2 Europa (Anon): Commission Regulation EC No 737/2007 of June 2007 Laying down the procedure for the renewal of the inclusion of a first group of active substances in Annex I to Council Directive 91/414/EEC and establishing the list of those substances. Brussels (2007). See http://eur-lex.europa.eu/LexUriServ/LexUriServ.do?uri=OJ:L:2007:169:0010:0018:EN:PDF (accessed August 2014) 3 Europa (Anon): Communication from the Commission of 12 July 2012 entitled “A thematic strategy on the sustainable use of pesticides” (COM (2006) 372 final – not published in the Official Journal). Brussels (2006). See http://europa.eu/legislation_summaries/other/l28178_en.htm (accessed August 2014) and European Commission (Anon): EU Policy for a Sustainable Use of Pesticides – The Story Behind the Strategy. Brussels (2007). See http://ec.europa.eu/environment/archives/ppps/pdf/pesticides_en.pdf (Accessed August 2014). 4 EU (Anon): Official Journal of the European Union. Regulation (EC) No 1107/2009 of the European Parliament and of the Council of 21 October 2009 concerning the placing of plant protection products on the market and repealing Council Directives 79/117/EEC and 91/414/EEC. Strasbourg. Brussels (2009). See http://eur-lex.europa.eu/LexUriServ/LexUriServ.do?uri=OJ:L:2009:309:0001:0050:EN:PDF (accessed August 2014). 5 EU (Anon): Official Journal of the European Union. Directive 2009/128/EC of the European Parliament and of the Council of 21 October 2009 establishing a framework for Community action to achieve the sustainable use of pesticides. Brussels (2009). See - http://eur-lex.europa.eu/LexUriServ/LexUriServ.do?uri=OJ:L:2009:309:0071:0086:en:PDF 6 See - FCEC (Food Chain Evaluation Consortium): Ad-hoc study to support the initial establishment of the list of candidates for substitution as required in Article 80(7) of Regulation (EC) No 1107/2009. 2013. Framework Contract for evaluation and evaluation related services - Lot 3: Food Chain, Final report submitted to the European Commission, 09.07.2013. Available online to Member State authorities. 7 Faust et al. Environmental Sciences Europe 26:11: Comparative assessment of plant protection products: how many cases will regulatory authorities have to answer? (2014). See - http://www.enveurope.com/content/pdf/s12302-014-0011-8.pdf (accessed August 2014). 8 European Commission: An overview of the establishment by the European Commission of a legislative-based strategy for endocrine disruptors. Brussels (2014). See http://ec.europa.eu/environment/chemicals/endocrine/strategy/index_en.htm (accessed August 2014). 9 Kortenkamp A, Martin O, Faust M, Evans R, McKinlay R, Orton F, Rosivatz E A Report for the European Commission – State of the Art Assessment of Endocrine Disruptors. Brussels (2011): See http://ec.europa.eu/environment/chemicals/endocrine/pdf/sota_edc_final_report.pdf (accessed August 2014). 10 European Commission Directorate-General Environment (2013): ED-AD-HOC-6/2013/02. 11 EU Consultation on the Definition of Endocrine Disruptors. Brussels (2014). See - http://ec.europa.eu/dgs/health_consumer/dgs_consultations/food/consultation_20150116_endocrine-disruptors_en.htm (accessed October2014). 12 EU Directive to establish a framework for community action in the field of water policy. Brussels (2000). See http://eur-lex.europa.eu/legal-content/EN/ALL/;ELX_SESSIONID=gs67TLrR4HwjLz3G72VTnbn7hmBPq5l52Jyppt1TQb1td9JrbVWn!246607505?uri=CELEX:32000L0060 (accessed August 2014). 13 European Commission (Anon): Directive 2013/39/EU of the European Parliament and of the Council of 12 August 2013 amending Directives 2000/60/EC as regards priority substances in the field of water policy. Brussels (2013). See http://eur-lex.europa.eu/LexUriServ/LexUriServ.do?uri=OJ:L:2013:226:0001:0017:EN:PDF (accessed August 2014). 14 Raquel N. Carvalho, Lidia Ceriani, Alessio Ippolito and Teresa Lettieri, Development of the 1st Watch List under the Environmental Quality Standards Directive, JRC, Brussels, (2014). 15 DEFRA (Anon): Water Framework Directive implementation in England and Wales: new and updated standards to protect the water environment. London (2014). See https://www.gov.uk/government/uploads/system/uploads/attachment_data/file/307788/river-basin-planning-standards.pdf (accessed August 2014). 16 Commission Regulation 485/2013 restricting neonicotinoid seed treatments. See - http://eur-lex.europa.eu/LexUriServ/LexUriServ.do?uri=OJ:L:2013:139:0012:0026:EN:PDF (accessed August 2014). 17 AHDB (Anon): Neonicotinoids: key messages - a summary of the key implications of insecticide restrictions for growers of oilseed rape and cereal crops. Kenilworth (2014). See

The Andersons Centre CPA-NFU-AIC
October2011 Appendix 1
http://www.hgca.com/media/11527/Neonicotinoids%20%E2%80%93%20key%20messages%20August.pdf (accessed August 2014). 18 DEFRA (Anon), An assessment of key evidence about Neonicotinoids. London (undated) -https://www.gov.uk/government/uploads/system/uploads/attachment_data/file/221052/pb13937-neonicotinoid-bees-20130326.pdf (accessed August 2014). 19 Walters K, Outlooks on Pest Management: Review of data on the effects of neonicotinoid on pollinators. Sunningdale (2013). DEFRA (Anon): An Assessment of Key Evidence about Neonicotinoids. London (undated). See http://pesticidetruths.com/wp-content/uploads/2012/01/Reference-PCP-Bees-2013-08-00-Data-Data-Everywhere-But-We-Don%E2%80%99t-Know-What-To-Think-Walters.pdf 20 H. Charles, J. Godfray, Tjeerd Blacquière, Linda M. Field, Rosemary S. Hails, Gillian Petrokofsky, Simon G. Potts, Nigel E. Raine, Adam J. Vanbergen, Angela R. McLean. A Restatement of the Natural Science Evidence Base Concerning Neonicotinoid Insecticides and Insect Pollinators. Proceedings of the Royal Society. London (2014). See http://rspb.royalsocietypublishing.org/content/281/1786/20140558.abstract 21 HSE (Anon): Registering a Pesticide. Bootle (undated). See http://www.pesticides.gov.uk/guidance/industries/pesticides/topics/pesticide-approvals/pesticides-registration/registering-a-pesticide.htm 22 Based on the PSD Database showing Product expiry dates, sorted to remove ‘amateur’ products and those actives using biological and straight chemical control – see http://www.pesticides.gov.uk/Resources/CRD/Migrated-Resources/Documents/P/product_dates_05_09_14.xlsx 23 Pesticides Safety Directorate (Anon): An assessment of the impact on crop protection in the UK of the ‘cut-off criteria’ and substitution provisions in the proposed regulation of the European Parliament and of the Council concerning the placing of plant protection products on the market. York (2008). See http://www.pesticides.gov.uk/Resources/CRD/Migrated-Resources/Documents/R/Revised_Impact_Report_1_Dec_2008(final).pdf (accessed August 2014). 24 EU (Anon): Proposal for a regulation of the European Parliament and of the Council concerning the placing of plant protection products on the market – Summary Impact Assessment. (COM(2013) 0620. Brussels (2014). See http://www.pesticides.gov.uk/Resources/CRD/Migrated-Resources/Documents/O/Outcomes_paper_-_summary_impact_assessment_(Jan_09).pdf (accessed August 2014). 25 WRc for DEFRA (Anon): Extended impact assessment study of the human health and environment criteria for endocrine disrupting substances proposed by HSE, – PS2812. London (2012). See http://sciencesearch.defra.gov.uk/Default.aspx?Menu=Menu&Module=More&Location=None&Completed=0&ProjectID=18083 26 HSE (Anon): Regulation (EC) No 1107/2009: progress on endocrine disruptors and candidates for submission. Bootle (2014). See - http://www.pesticides.gov.uk/guidance/industries/pesticides/News/Collected-Updates/Information-Updates-2014/January/Regulation+_EC_No_1107_2009-progress_on_endocrine_disrupters_and_candidates_for+substitution 27 European Commission – Environment (Anon): An overview of links to the legal/preparatory acts, study reports and other supporting background documents relevant to the development of the legislation on priority substances under the Water Framework Directive. Brussels (2014). See http://ec.europa.eu/environment/water/water-dangersub/lib_pri_substances.htm#prop_2011_docs 28 DEFRA (Anon): Water Directive implementation in England and Wales – new and updated standards to protect the water environment. London (2014). See https://www.gov.uk/government/uploads/system/uploads/attachment_data/file/307788/river-basin-planning-standards.pdf 29 DEFRA (Anon): Impact of changing pesticide availability on horticulture and an assessment of all impacts and priorities on a range of arable, horticultural and forage crops. - IF01100. London (2010). See - http://sciencesearch.defra.gov.uk/Default.aspx?Menu=Menu&Module=More&Location=None&Completed=0&ProjectID=17126 30 Environment Agency (Anon): WFD Compliance Picture – Pesticides Breakdown. Unpublished. 31 EU (Anon): Official Journal of the European Union. Commission implementing regulation (EU) No 485/2013 of 24 May 2013 amending Implementing Regulation (EU) No 540/2011, as regards the conditions of approval of the active substances clothianidin, thiamethoxam and imidacloprid, and prohibiting the use and sale of seeds treated with plant protection products containing those active substances. Brussels (2013). See http://eur-lex.europa.eu/LexUriServ/LexUriServ.do?uri=OJ:L:2013:139:0012:0026:EN:PDF 32 Food & Environment Research Agency (Anon): Pesticide Usage Survey. York (undated). See http://www.fera.defra.gov.uk/landUseSustainability/surveys/

The Andersons Centre CPA-NFU-AIC
October2011 Appendix 1
33 Clarke JH, Wynn SC, Twining SE, Berry P, Cook S, Ellis E and Gladders P, HGCA Research Review 70: Pesticide Availability for Cereals and Oilseeds Following Revision of Directive 91/414/EEC; Effects of Losses and New Research Priorities. Kenilworth (2009). See -http://archive.hgca.com/document.aspx?fn=load&media_id=5195&publicationId=5850 34 ADAS (Anon): Impact of Changing Pesticide Availability on Horticulture. Wolverhampton (2010). See - http://randd.defra.gov.uk/Default.aspx?Menu=Menu&Module=More&Location=None&Completed=0&ProjectID=17126 35 HGCA (Anon): ADAS Arable Crop Report :June 2014. Kenilworth (2014). See http://www.hgca.com/markets/market-news/2014/june/27/adas-arable-crop-report-june-2014.aspx 36 S R Moss, R Marshall, R Hull and R Alarcon-Reverte: Current status of herbicide-resistant weeds in the United Kingdom. Aspects of Applied Biology 106 (2011) 37 Lutman P J W, Moss S R, Welham S J, Cook S, A review of the effects of crop agronomy on the management of Alopecurus myosuroides. Weed Research (2012) 38 Stobary RM and Ballingall M, HGCA Project Report No 509: New strategies to maintain autumn grass-weed control in cereals and oilseed rape. Kenilworth (2011). See http://www.hgca.com/media/197879/pr509-summary.pdf 39 HGCA (Anon): Topic Sheet 113 /Spring 2012 Septoria tritici in winter wheat. Kenilworth (2012). See http://www.hgca.com/media/178045/ts113_septoria_tritici_in_winter_wheat.pdf 40 HGCA (Anon): Guidelines to minimise risk of Fusarium mycotoxins in cereals. Kenilworth (2010). See http://adlib.everysite.co.uk/resources/000/245/487/2010_FusariumGuide.pdf 41 HGCA (Anon). Oilseed Rape Guide. Kenilworth (2014). See http://www.hgca.com/media/493856/g55-oilseed-rape-guide-updated-september-2014.pdf 42 Nicholls CJ HGCA Research Review No 79: Implications of not controlling slugs in oilseed rape and wheat in the UK. Kenilworth (2014). See http://www.hgca.com/media/364367/rr79.pdf 43 AHDB (Anon) Information Sheet 02 Autumn: Integrated slug control – latest information and action points prepared in conjunction with the Potato Council. Kenilworth (2013). See http://www.hgca.com/media/246568/ahdb-is02slug_control_-_ahdb_is2_aut_2013_20139115815.pdf 44 Metaldehyde Stewardship Group (Anon): Get Pelletwise – Guidance and best practice for the use of metadehyde slug pellets. (2014). See http://www.getpelletwise.co.uk/ 45 Nicholls CJ HGCA Research Review No 77: Implications of the restriction on the neonicotinoids: imidacloprid, clothianidin and thiamethoxam on crop protection in oilseeds and cereals in the UK. Kenilworth (2013). See http://publicationsarchive.hgca.com/publications/documents/RR77.pdf 46 Wynn S, Ellis S and Alves L. Cabbage stem flea beetle snapshot assessment – incidence and severity at end September 2014. ADAS for HGCA. See http://www.hgca.com/media/507048/cabbage-stem-flea-beetle-report.pdf?utm_medium=email&utm_campaign=CSFB%20press%20release&utm_content=CSFB%20press%20release+CID_748ddec7bea5e9e65b9dc16f5dc5ef7d&utm_source=Campaign%20monitor%20emails&utm_term=Cabbage%20stem%20flea%20beetle%20snapshot%20assessment%20%20incidence%20and%20severity%20at%20end%20September%202014 47 Ricardo-AEA (Anon), Appraisal of Policy Options to Manage pesticides 48 Nicholls CJ HGCA Research Review No 77: Implications of the restriction on the neonicotinoids: imidacloprid, clothianidin and thiamethoxam on crop protection in oilseeds and cereals in the UK. Kenilworth (2013). See http://archive.hgca.com/document.aspx?fn=load&media_id=8858&publicationId=9309 49 See http://ir4.rutgers.edu/ 50 See http://www.europarl.europa.eu/sides/getDoc.do?type=TA&reference=P7-TA-2014-0205&language=EN&ring=A7-2014-0048 51 DEFRA (Anon): Annual statistics about agriculture in the UK for 2011, 2012 and 2013.London (updated 2014. See https://www.gov.uk/government/collections/agriculture-in-the-united-kingdom 52 DEFRA (Anon): Statistical Data Set – Structure of the agricultural industry in England and the UK at June. London (updated 2014). See https://www.gov.uk/government/statistical-data-sets/structure-of-the-agricultural-industry-in-england-and-the-uk-at-june 53 DEFRA (Anon) National Statistics – Basic Horticultural Statistics 2013 on the area, yield, production, trade and valuation of the main fruit and vegetable crops grown in the UK. London (updated 2013). See https://www.gov.uk/government/publications/basic-horticultural-statistics 54 International Grains Council – Monthly Market Report. 55 Rickard S CPA Report: The Value of Crop Protection. Peterborough. (2010). See http://www.cropprotection.org.uk/media/1903/cpa_the_value_of_crop_protection_rickard_report.pdf

The Andersons Centre CPA-NFU-AIC
October2011 Appendix 1
56 Redman G John Nix Pocketbook 45TH Edition 2015. Melton Mowbray (2014). See http://www.thepocketbook.biz/ 57 DEFRA (Anon). Agriculture in the UK, 2013. 58 Tesco PLC (Anon): News Release – One in five parents struggling to feed their children. Cheshunt (2013). See http://www.tescoplc.com/index.asp?pageid=17&newsid=790 59 DEFRA (Anon): UK Food Security Assessment: Our approach: London (2009). See http://archive.defra.gov.uk/foodfarm/food/pdf/food-assess-approach-0908.pdf 60 DEFRA (Anon) Science and Research Project: Resilience of the food supply to port disruption – FO0108. London (undated). See http://randd.defra.gov.uk/Default.aspx?Menu=Menu&Module=More&Location=None&Completed=0&ProjectID=17782 61 Isenring R, Pesticide Action Network Europe: Pesticides and the loss of biodiversity – How intensive pesticide use affects wildlife populations and species diversity. London (2010). See http://www.pan-europe.info/Resources/Briefings/Pesticides_and_the_loss_of_biodiversity.pdf 62 HSE (Anon): The Impact of Herbicides on Weed Abundance & Biodiversity – Executive Summary and Conclusions. Bootle (undated). See http://www.pesticides.gov.uk/guidance/industries/pesticides/topics/publications/research-reports/the-impact-of-herbicides-on-weed-abundance-biodiversity 63 DEFRA (Anon): Policy Paper - Green Food Project Conclusions (jointly developed and owned by the Green Food Project Steering Group). London (2012). See https://www.gov.uk/government/publications/green-food-project-conclusions 64 Food and Agriculture Organisation of the United Nations (Anon): The State of Food Insecurity in the World (SOFI) 2014. Rome (2014). See http://www.fao.org/publications/sofi/en/ 65 Philips McDougal: R&D Trends for Chemical Crop Protection Products and the Position of the European Market – A Consultancy Study Undertaken for ECPA. Pathhead. (2013). 66 DEFRA, DBIS and DID Policy Paper (Anon): See UK Agricultural Technologies Strategy – an outline of the way government and industry will build on the strengths of the UK sector. London (updated 2013). See - https://www.gov.uk/government/publications/uk-agricultural-technologies-strategy 67 Phillips McDougal: A Consultancy Study for Crop Life America and ECPA. Pathhead. (2010). 68 Crop Protection Association - Challenges to Crop Protection (undated). 69 House of Lords Select Committee on European Communities: 16th Report Organic Farming and the European Union. HL93 ISBN 0 10 409399 4. London (1999). 70 Oerke E: Crop Losses to Pests. Bonn (2006) 71 Kidd M, Lewis E: Organic Foods – Consumer Concerns (Submission to the House of Commons Agriculture Committee Enquiry into Organic Farming). London (1999). 72 Myers RJK, Van Norordwijk M, Vityakon P for ASB: Synchrony of Nutrient Release and Plant Demand: Plant Litter Quality, Soil Environment and Farm Management Options. Wallingford (1997). 73 Nolte C, Werner W: Biol. Agric. Horticult.10 235- 254. (1994). 74 Pacanoski Z: The Myth of Organic Agriculture. Skopje (2009). 75 Paarlberg R Food Politics: What Everyone Needs to Know. New York (2010). 76 Soil Association: Feeding the Future - How Organic Farming Can Help Feed the World. Bristol (undated). 77 Smaje C: Can Organic Farming Feed the World? Statistics Views 21-5-2013 (2013). 78 Boatman ND, Parry HR, Bishop JD, Cuthbertson AGS: Impacts of Agricultural Change on Farmland Biodiversity in the UK. (2007). 79 See http://www.nfuonline.com/assets/20830 80 Seufert V, Ramankutty N, Foley JA: Comparing the Yields of Organic and Conventional Agriculture – Nature. (2012).

Report produced by:THE ANDERSONS CENTREOld Bell House2 Nottingham StreetMelton MowbrayLeicestershireLE13 1NW
Contact:RICHARD KING
Office: 01664 503 200Direct: 01664 503 208
E-mail: [email protected]