the effect of uncomplicated potassium depletion on urine
TRANSCRIPT
The Effect of Uncomplicated Potassium
Depletion on Urine Acidification
RIcIARD L. TANNEN
From the Department of Metabolism, Walter Reed Army Institute of Research,Washington, D. C. 20012
ABSTRA CT Studies were performed on normal hu-man subjects to determine the effects of potassium deple-tion on urine acidification. Depletion was induced byingestion of a low potassium diet either alone or incombination with a potassium-binding resin, and theresponse of each subject to an acute ammonium chlorideload in the potassium-depleted state was compared tohis normal response. Urine pH was significantly higherduring potassium deficiency if sufficient potassium de-pletion had been induced. No differences in blood acid-base parameters, urinary flow rate, or urinary fixedbuffer excretion rate were found to account for thischange; however, the increase in urine pH was accom-panied by a concomitant increase in net acid and am-monium excretion. It is proposed that these changesduring potassium depletion reflect an increase in am-monia diffusion into the urine, presumably as a resultof increased renal ammonia production. In addition, itis speculated that changes in ammonia metabolism maybe a physiologic control mechanism for potassium con-servation.
INTRODUCTIONAlthough the interrelationship between renal potassiumand hydrogen ion secretion and excretion have beenintensively studied (1), the effect of uncomplicatedpotassium deficiency on urine acidification has receivedlittle attention. In the few studies in humans of thislatter relationship, chronic potassium deficiency resultedin an elevation of urine pH (2-4). It has been proposedthat this is the result of an inability to establish a nor-mal blood to tubular fluid hydrogen ion gradient, i.e.,an acquired distal renal tubular acidosis (2). Because
A preliminary report appeared in 1969 Clin. Res. 17: 450.Dr. Tannen's present address is the Department of
Medicine, University of Vermont, Burlington, Vt. 05401.Received for publication 23 July 1969 and in revised form
12 November 1969.
it appeared that a number of important variables hadnot been considered in the design of these investiga-tions, a reevaluation of the problem was undertaken.The results of the present study demonstrate an un-
equivocal effect of potassium depletion on urine acidifi-cation. They indicate that the elevation in urine pH isthe result of a primary increase in ammonia diffusioninto the urine rather than the result of an acquiredrenal tubular acidosis. In addition, these findings sug-gest possible new insight into the mechanism of therenal control of potassium excretion.
METHODSUrine acidification was evaluated by means of a modifiedshort ammonium chloride test (5) in nine men (ages 20-26 yr) with normal renal function; at least once undernormal conditions, and at one or more degrees of potas-sium depletion. All subjects were volunteers who gaveinformed consent.
Five of the subjects had no history of significant ante-cedent illness. Patient Da had idiopathic hypercalciuria with-out evidence of nephrolithiasis. Three patients (D, B, andMi) had malaria with apparent cure 1-2 months beforestudy. Two of them (B and Mi) had a transient rise inblood urea nitrogen (BUN) to approximately 35 mg/100ml and transient mild proteinuria during the acute phase ofmalaria. At the time of study, every patient had a normalblood pressure, urinalysis, creatinine clearance, serum cal-cium, phosphorus, uric acid, total protein, and globulinconcentrations; aminoaciduria was absent, and the urineculture was negative.A low electrolyte food powder' supplemented with sodium
chloride and served as a liquid formula was ingested dailypreceding both the normal and the potassium-depleted, am-monium chloride studies. The food powder which containscalcium caseinate, corn oil, and sucrose provides 21.9 g ofprotein, 16.5 g of fat, 59.0 g of carbohydrate, 0.1 mmoleof sodium, 0.2 mmole of potassium, 0.25 mmole of magne-sium, 10.0 mmoles of calcium, and 183 mg of phosphorusper 100 g of food powder (6). The diet was given in quan-tities to provide daily the following: 35 calories, 3 ml ofwater, and 2 mmoles of sodium per kg of body weight.
1 Low electrolyte food powder 7000J kindly supplied byMead Johnson and Company, Evansville, Ind.
The Journal of Clinical Investigation Volume 49 1970 813

Before the normal studies, the diet was ingested for 3 daysand supplemented daily with potassium chloride providing0.75 mmoles of potassium per kg of body weight. Onepatient (R) also underwent a second normal study precededby 5 days of formula diet.
Varying degrees of potassium depletion were achievedin the following fashion: (a) 3 days of formula diet withpotassium chloride being withdrawn on day 3 (one patient).(b) 3 days of formula diet without potassium chloride(two patients). (c) 5 days of formula diet without potas-sium chloride (six patients). (d) 5 days of formula dietwithout potassium chloride and with sodium-cycle sulfonicpolystyrene cation exchange resin (Kayexalate)2 ingestion(80 g/day) on days 1 and 2 (four patients).The formula diet in the absence of potassium supplemen-
tation provided a daily intake of potassium of less than1 mmole. During the potassium depletion periods, stool andurine were collected in order to quantitate the degree ofpotassium depletion.The formula diet is deficient in magnesium (6); how-
ever, after 5 days of ingestion, a magnesium deficit of lessthan 2% of total body magnesium would be expected (7, 8).In every Kayexalate study, in two 5-day potassium depletionstudies (R and Mc), and in three normal studies (N, S,and R-2), a daily magnesium chloride supplement of 4mmoles was ingested. No difference was evident betweenthe studies done with or without the magnesium supplement.An interval of from 7 to 38 days occurred between acute
ammonium chloride studies performed on an individual sub-ject. The normal study antedated the potassium depletionstudies in all patients with the exception of subject R, whosesecond normal study followed the potassium depletionstudies.The ammonium chloride study was perfomed in a similar
fashion during the normal and potassium-depleted state. Onthe day of study the subjects were awakened at 6:30 a.m.and from then until the completion of the test remained inthe upright position ingesting only water. A water load of300400 ml was given from 6:30 to 7:30 a.m., and approxi-mately 100 ml/hr thereafter. After two 1-hr urine collec-tions, ammonium chloride in gelatin capsules (2 mmoles/kgof body weight) was taken from 9:30 to 10 :30 a.m. andeight subsequent hourly urines were collected. Urine wasvoided directly into flasks containing mineral oil and thymol.It was aspirated immediately into a syringe and stoppered,and pH and total C02 determinations were performedpromptly. All other urine determinations were performed onfrozen aliquots.Venous blood for pH and total C02 determinations was
collected before ingestion of ammonium chloride and 1, 2, 4,and 6 hr thereafter. These samples were drawn withoutstasis into heparinized plastic syringes, and the analyseswere promptly performed. Blood electrolyte and creatininedeterminations were performed on serum samples drawnbefore and 6 hr after ammonium chloride ingestion.
Chemical determinations. Blood and urine pH weredetermined anaerobically at 37°C with a Corning Model 12blood pH system. Plasma and urine total C02 were deter-mined manometrically with a Natelson microgasometer.(Scientific Industries, Inc., Springfield, Mass.). Chloridewas measured with an Aminco Cotlove chloride titrator(American Instrument Co., Inc., Silver Spring, Md.).Stool potassium content was determined on nitric acid-perchloric acid digests. The following determinations wereperformed with a Technicon Autoanalyzer (Technicon
2 Winthrop Laboratories, New York.
Corporation, Ardsley, N. Y.) using suitable modifications ofthe referenced techniques: sodium and potassium by flamephotometry; phosphate (9); ammonium (10); and creati-nine (11).
Total urinary organic acids and the contribution oforganic acids to titratable acid were determined in thefollowing fashion. Dephosphated urine specimens weretitrated from pH 2.7 to 8.0 to determine total organic acidsas described by Van Slyke and Palmer (12), and fromurine to blood pH to determine the contribution of organicacids to titratable acid. Then both these values were cor-rected for the creatinine content of the specimen, assuminga pKa' creatinine of 4.92 for the correction of titratableacid.
Calculation. Urine ionic strength (As) was calculated asone-half the sum of the product of the molality of each mea-sured ion and the square of its valence; and the product of thecalculated unmeasured anion and the square of an assumedvalence of one. Blood bicarbonate concentration and Pc02 werecalculated from the Henderson-Hasselbalch equation assum-ing a pKa' of 6.10 and solubility coefficient of 0.0301; andurine values were calculated similarly using a PKa. of (6.33- 0.5,-) (13) and a solubility coefficient of 0.0309. Titra-table acid was calculated from urine pH, blood pH, and uri-nary phosphate, and creatinine content, using a pKa' phosphateof (7.181 - 1.57 AJj&)/(1 + 1.49 -'h) + (63), as documentedexperimentally by Schwartz, Bank, and Cutler (14), and apK.' creatinine of 4.92. Urine-free ammonia (NH3) was cal-culated from the equation:
NH3 = total ammonia/antilog (pKa' - pH) + 1using a pK.' of (8.89 + 0.5176 Vp)/(1 + 1.159 <,.) (15). Netacid was calculated as the sum of ammonium plus titratableacid minus bicarbonate. The data were calculated in part withan IBM 1401 computer using Fortran II code language.
RESULTSAlthough control urine collections were made beforethe ingestion of ammonium chloride in all normal andpotassium-depleted studies, only 8 of 10 studies fromthe 5-day potassium depletion protocols (both with andwithout Kayexalate) had mean control rates of urineflow of 0.5 ml/min or greater. In these eight studiescontrol net acid excretion averaged 45.8 Amoles/min inthe normal state and 44.2 /Amoles/min during potassiumdepletion. The mean difference of 1.6 +8.7SD Amoles/min was not significant. Because of the variability inboth rate of urine flow and phosphate excretion, thesecontrol observations were unsuitable for interpretationof the response to potassium depletion of urine pH andammonium excretion.The qualitative response to the ingestion of ammo-
nium chloride by normal individuals in these studieshas been previously described,' and the response inpotassium-depleted subjects was similar. Because a rela-tive plateau in urine pH and net acid excretion occursfrom the 2nd hr (U2) after the ingestion of ammoniumchloride to the end of the study (Us), these periods
'Tannen, R. L. 1969. The relationship between urine pHand acid excretion; the influence of urine flow rate. J. Lab.Clin. Med. 74: 757.
814 R. L. Tannen

Low K* Diet Low K* Diet(l and 3 days) (5 days )
+ 0.80
+ 0.60
A pH
(K Depleted-Normal)
+ 0.40
+ 0.20
0
- 0.20
00
0
0
0 0
0
0
0
0S
0
0
0
0
0
0
00 0
00
@0
. . . * -I.T . . A- . . .--
2 4 6 8
* 0
*8 *
* 0 *a
*
Ia
0
0.
2 4 6 8 2 4 6 8
HOURS
FIGURE 1 The effect of potassium depletion on urine pH. Each point in this andall subsequent figures represents a comparison between the response during a com-parable time period of a paired potassium-depleted and normal study. Only theperiods from 2 to 8 hr after the ingestion of ammonium chloride are plotted.
have been utilized in comparing the results of thenormal and potassium-depletion studies. The mean val-ues of each parameter during this time period (U2-Us)from each subject's potassium-depleted and normal studywere compared and analyzed statistically utilizing a
paired t test. In addition, every value obtained duringa subject's potassium-depleted study was compared to
the value obtained during the same time period of hisnormal study.
Urine pH. In Fig. 1, a comparison of the response
of urine pH to the ingestion of ammonium chlorideduring the potassium-depleted and normal state isshown. In Table I, the mean urine pH (U2-Us)' duringpotassium-depleted and normal studies is recorded.No difference in urine pH after the ingestion of
ammonium chloride was noted between potassium-depleted and normal studies when potassium was absentfrom the diet for 1 or 3 days; nor between the two
normal studies performed on subject R (Fig. 1).
'The mean pH reported were calculated by directly takingthe arithmetic mean. All mean pH data were also calculatedby converting individual pH values to hydrogen ion con-
centration, taking this arithmetic mean, and then convertingback to pH. In no instance was the interpretation of thedata affected by the method of calculating mean pH.
A statistically significant' increase in urine pH was
noted in five of six studies when potassium was absentfrom the diet for 5 days; however, the magnitude ofthe change varied considerably from an increase inmean urine pH of 0.07 to 0.73 U (Fig. 1). The increasein mean urine pH of the entire group was from 4.97to 5.20.
All four patients who received Kayexalate, in additionto ingesting the low potassium diet for 5 days, had a
significant rise in urine pH; the increase in mean urinepH ranging from 0.15 to 0.52 U (Fig. 1). Mean urinepH for this entire group increased significantly (P <0.02) from 4.84 to 5.22 U.Four subjects underwent two studies at different
degrees of potassium depletion. Subject Da was studiedafter 1 and 3 days of potassium withdrawal; subject Dafter 3 and 5 days of potassium withdrawal; and sub-jects R and Mc after 5 days of potassium withdrawalalone, and also_ with Kayexalate ingestion. Da's re-
sponse did not differ from normal at either level ofpotassium depletion. In the other three subjects urinepH was highest during the study in which they were
the most severely depleted of potassium.
' The term significant will be used only to indicate eventscalculated to be statistically significant at the 0.05 level.
Potassium Depletion and Urine Acidification 815
Low K* Diet+ Kayexalote
.

TABLE I
Mean Urinary A cid-
pH
Norm.§ K+dep.11
4.684.945.034.864.86
4.795.125.024.935.01
4.87 4.97<0.05
5.105.235.024.734.76
5.355.965.475.125.28
4.96 5.43<0.01
Urine flow
Norm. K"dep.
mi/min
1.81.42.51.71.7
Net acid
Norm. K+dep.
,umoles/min
2.2 54.81.9 81.71.9 72.11.0 98.31.4 98.3
51.781.976.685.993.2
1.8 1.7 81.0 77.9NS
2.4 2.3 92.3
0.9 2.2 55.5
2.5 2.7 72.1
2.2 1.9 71.5
2.4 2.4 79.1
NS
100.257.278.974.189.9
2.1 2.3 74.1 80.1NS <0.05
NH4+
Norm. K+dep.
,Amoles/min
35.350.257.767.667.6
35.556.757.858.265.8
55.7 54.8NS
72.932.857.752.353.6
81.346.165.456.567.4
53.9 63.3<0.01
* If Kayexalate, as well as 5 days of a low potassium diet was ingested, it is indicated in parentheses.t TA, titratable acid.§ Norm., normal study.11 K+dep., potassium-depleted study.Norm. values are mean cf two normal studies.
** P values refer to the comparison between normal and potassium-depleted studies.
The largest, and hence most readily detectable.changes in factors relating to the increase in urine pHwould be expected in those studies in which urine pHincreased the greatest amount. Therefore, in an attempt
to define the factors responsible for the increase inurine pH, those five studies (from protocols employingeither the 5 day low potassium diet alone or the lowpotassium diet and Kayexalate) in which mean urine pH
-increased by 0.25 U or more were arbitrarily analyzedas a group (A pH greater than 0.25 group). In addition,the remaining five studies (from protocols employingeither the 5 day low potassium diet alone or' the lowpotassium diet and Kayexalate) were also analyzed as
a group (A pH less than 0.25 group). The two groups
were compared to examine which factors were importantin determining whether urine pH would increase duringpotassium depletion, and also to determine whether thechanges noted in certain acid-base parameters were di-rectly related to changes in urine pH.Potassium balance and serum concentration. In Table
IL the potassium deficit occurred before the ammonium
chloride study, and serum potassium concentrations
before and during the ammonium chloride study aregiven for both the A pH greater than 0.25 and A pHless than 0.25 groups.
Neither the absolute amount of the potassium deficit(-201 vs. -196 mmoles) nor the degree of potassiumdepletion factored by body weight (-28.3 vs. -23.6mmoles/10 kg) were significantly different between theA pH greater than 0.25 and the A pH less than 0.25groups..
In the A pH greater than 0.25 group, control serumpotassium concentration averaged 4.1 mm in the normalstudies and 3.6 mm in the potassium depletion studies;6 hr after the ingestion of ammonium chloride it aver-aged 4.4 mm and 4.0 mm, this latter difference is notsignificant. No difference in serum potassium concen-tration between normal and potassium-depleted studieswas noted at either time in the A pH less than 0.25group.
Acid-base. In Table I mean urinary acid-base pa-
rameters and in Table III blood acid-base parametersfor the A pH greater than 0.25 and A pH less than 0.25groups are given. In Figs. 2-5 differences in urinary
816 R1. L. Tannen
Subjects*
A pH lessthan 0.25
MiARTlMcMc (Kaye)
Meanpa*
A pH greaterthan 0.25
DB I
R¶ (Kaye)N (Kaye)S (Kaye)
MeanUP**

Base Parameters (U2- U8)
TA* HCO- Phosphate Creatinine Organic acids
Norm. K+dep. Norm. K+dep. Norm. K+dep. Norm. K dep. Norm. K'dep.
Amoles/min ;&moles/min ;&moles/min pmoles/min pmoles/min
19.6 16.3 0.1 0.1 17.2 13.4 11.1 10.6 21.0 27.531.7 25.4 0.2 0.3 34.4 26.3 12.8 15.1 49.0 23.115.0 19.1 0.7 0.4 14.3 19.5 10.1 11.1 6.7 15.631.0 27.8 0.2 0.1 31.6 29.7 13.9 12.6 11.0 15.631.0 27.6 0.2 0.2 31.6 29.3 13.9 13.2 11.0 14.4
25.7 23.2 0.3 0.2 25.8 23.6 12.4 12.5 19.7 19.2NS NS NS NS NS
19.6 19.4 0.3 0.5 20.3 23.0 11.8 12.4 22.1 18.922.9 13.3 0.2 2.2 26.9 19.7 10A 9.7 12.9 10.715.0 15.3 0.7 1.8 14.3 18.2 10.1 10.1 6.7 8.719.3 17.9 0.2 0.3 17.8 19.3 10.3 10.3 22.5 8.625.8 23.4 0.2 1.0 25.0 27.1 11.2 10.9 9.1 7.1
20.5 17.9 0.3 1.2 20.9 21.5 10.8 10.7 14.7 10.8NS NS NS NS NS
acid-base parameters between the potassium-depletedand normal studies of the A pH greater than 0.25 groupare shown.A pH greater than 0.25 group. Mean urine pH after
ammonium chloride ingestion increased from 4.96 dur-ing normal studies to 5.43 during potassium depletion.This increase in urine pH was not associated with anychange in blood acid-base parameters during potassiumdepletion; blood-pH, Pco2, and plasma bicarbonate con-centration were similar both before and after ammoniumchloride ingestion in the normal and potassium-depletedstudies (Table III).An increase in urine flow rate will result in an in-
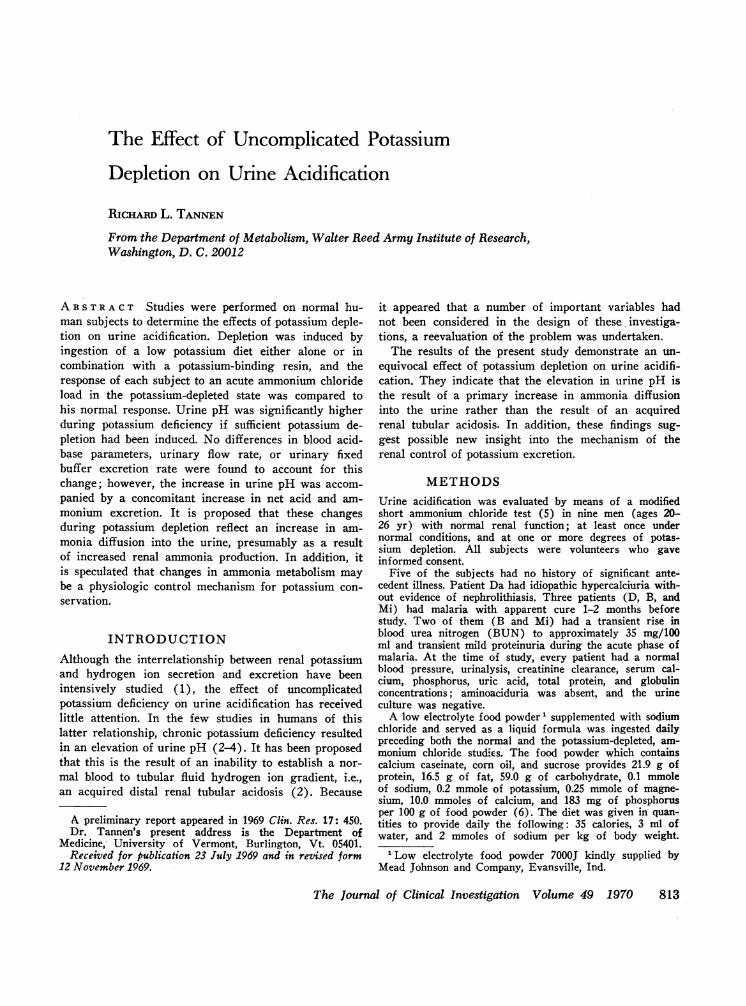
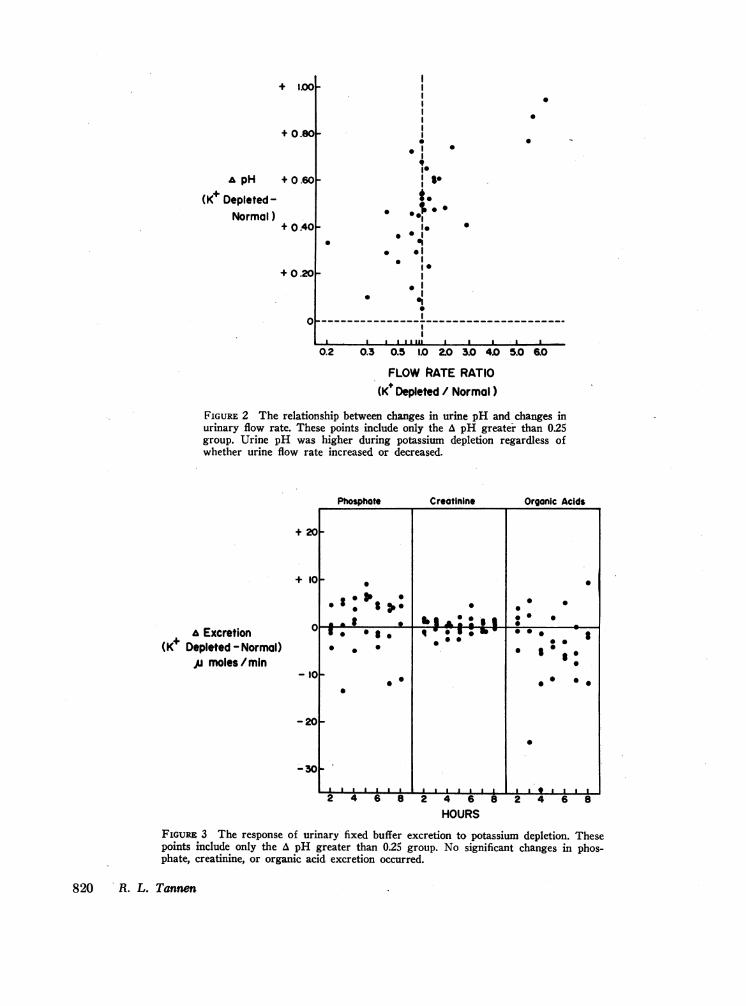
crease in the urine pH of an acid urine (16, 17 and foot-note 3). After the ingestion of ammonium chloride,urine flow rates were similar averaging 2.3 ml/minduring potassium-depleted and 2.1 ml/min during nor-mal studies (Table I). As shown in Fig. 2, urine pHwas higher in every instance during potassium depletionregardless of the flow rate relationship between potas-sim-depleted and normal studies. No significant differ-ence in phosphate, creatinine, or organic acid excretion
was noted between normal and potassium-depleted stud-ies (Fig. 3, Table I).Urinary net acid excretion after the ingestion of
ammonium chloride was moderately but significantlygreater in the potassium-depleted than in the normalstudies, averaging 80.1 vs. 74.1 smoles/min (Fig. 4,Table I). This was accompanied by a significantlyhigher rate of ammonium excretion averaging 63.3/Amoles/min during potassium depletion and 53.9 imoles/min during the normal state (Fig. 4, Table I). Titrata-ble acid excretion averaged 20.5 /moles/min duringnormal studies and 17.9 jumoles/min during potassiumdepletion; bicarbonate excretion averaged 0.3 and 1.2i'moles/min respectively; and the calculated titratableacid minus bicarbonate excretion decreased in everystudy (mean, 3.5 imoles/min); however, none of thesechanges was statistically significant.
Titratable acid excretion, as calculated, included onlythe contribution of phosphate and creatinine, and notthat of organic acids. The magnitude of the contribu-tion of organic acids to titratable acid was estimatedin some specimens from both normal and potassium-
Potassium Depletion and Urine Acidification 817

TABLE I IDegree of Potassium Depletion
Serum K+
Control Post NH4Cl
Subjects* K+ balance Norm. K+dep. Norm. K+dep.
mmoles mmoles/lOkg mM mMA pH less
than 0.25Mi -198 -28.5 4.9 4.2 4.2 4.4A -205 -25.3 4.7 4.9 4.7 4.5R -170 -25.1 4.2 3.7 4.4 4.0Mc -168 -16.2 3.7 3.5 3.9 4.0Mc(Kaye) -240 -23.1 3.7 4.0 3.9 4.0
Mean -196 -23.6 4.2 4.1 4.2 4.2Pt NS NS
A pH greaterthan 0.25
D -281 -38.2 4.0 3.5 3.8 3.9B -143 -22.3 4.0 3.7 4.7 3.8R (Kaye) -186 -27.4 4.2 3.5 4.4 3.9N (Kaye) -173 -25.0 4.4 4.0 4.4 4.4S (Kaye) -221 -28.8 4.0 3.1 4.6 3.8
Mean -201 -28.3 4.1 3.6 4.4 4.0Pt <0.01 NS
* Kayexalate studies indicated by (Kaye).t P values refer to the comparison between normal and potassium-depleted studies.
depleted studies. 31 specimens from normal studies hada ratio of organic acid titratable acidity to total urinaryorganic acids of 0.14 +0.O1SE, and nine specimens frompotassium-depleted studies a ratio of 0.16 +0.02SE.Therefore, it is unlikely that the exclusion of organicacids from the calculation of titratable acid significantlyinfluenced the interpretation of changes in either titrata-ble acid or net acid excretion.
Following the ingestion of ammonium chloride, uri-nary-free ammonia concentration averaged 3.2 /hM dur-ing normal studies, and 12.0 /Mm during potassiumdepletion. A decrease in urine flow rate can increaseurine-free ammonia concentration; however, this in-crease was observed consistently regardless of therelationship in urine flow rate between normal andpotassium-depleted studies (Fig. 5). Urinary Pco2 didnot differ significantly between the normal and potas-sium-depleted studies averaging 57 and 66 mm Hg.A pH less than 0.25 group. In this group following
the ingestion of ammonium chloride, mean urine pHwas 4.87 during the normal studies and 4.97 during thepotassium-depleted studies. Blood acid-base parameterswere not significantly different during the potassium-depleted and normal studies (Table III). Urine flow
rate was similar, 1.7 and 1.8 ml/min respectively, andno significant difference in phosphate, creatinine, ororganic acid excretion was noted (Table I).Net acid excretion averaged 81.0 umoles/min during
normal studies and 77.9 umoles/min during potassiumdepletion and ammonium excretion was 55.7 and 54.8Amoles/min. No significant changes in titratable acid orbicarbonate excretion were observed during potassiumdepletion (Table I).Urine free NH8 concentration averaged 2.5 uMm during
normal studies and 3.7 luM during potassium depletion,and urine Pco2 was 60 and 58 mm Hg.Comparison of the A pH greater than 0.25 and A pH
less than 0.25 groups. The differences between potas-sium-depleted and normal studies of the A pH greaterthan 0.25 group were compared with the differencesfound in the A pH less than 0.25 group utilizing anonpaired t test.As might be anticipated, based on the criteria for
forming the two groups, the increase in urine pH wassignificantly larger in the A pH greater than 0.25 groupthan in the A pH less than 0.25 group. The responses ofblood acid-base parameters; urine flow rate; and phos-
818 R. L. Tannen

TABLE I IIBlood Acid-Base Parameters
HCO- pH Poo0
Control Post NH4Cl$ Control Post NH4Cl Control Post NH4C1
Subjects* Norm. K+dep. Norm. K+dep. Norm. K+dep. Norm. K+dep. Norm. K+dep. Norm. K+dep.
mM mm HgA pH less
than 0.25Mi 28.1 27.7 22.3 23.0 7.28 7.31 7.27 7.28 61.8 56.7 50.3 50.4A 29.3 26.9 24.6 22.3 7.37 7.34 7.30 7.33 52.3 51.3 51.5 43.3R 28.2 26.4 22.5 23.7 7.31 7.33 7.27 7.29 57.7 51.7 50.4 50.3Mc 25.9 28.0 20.8 22.0 7.33 7.33 7.29 7.27 50.6 54.7 44.0 48.9Mc (Kaye) 25.9 25.3 20.8 22.6 7.33 7.33 7.29 7.32 50.6 49.5 44.0 45.2
Mean 27.5 26.9 22.2 22.7 7.32 7.33 7.28 7.30 54.6 52.8 48.0 47.6
A pH greaterthan 0.25
D 30.2 27.8 24.8 22.5 7.38' 7.24 7.29 7.23 52.7 66.9 53.0 54.8B 25.6 24.9 19.7 20.8 7.35 7.37 7.29 7.33 47.8 44.4 41.6 40.2R (Kaye) 28.2 28.0 22.5 23.1 7.31 7.33 7.27 7.29 57.7 54.7 50.4 49.3N (Kaye) 26.6 26.4 22.0 19.8 7.34 7.30 7.28 7.26 50.8 55.4 47.6 44.7S (Kaye) 30.1 30.4 22.7 24.6 7.36 7.37 7.33 7.32 55.0 54.2 44.2 48.6
Mean 28.1 27.5 22.3 22.2 7.35 7.32 7.29 7.29 52.8 55.1 47.4 47.5
* Kayexalate studies indicated by (Kaye).$ Mean value of bloods drawn 1, 2, 4, and 6 hr after ingesting NH4CL.
phate, creatinine, and organic acid excretion did notdiffer.The increases in both net acid and ammonium excre-
tion during potassium depletion in the A pH greaterthan 0.25 group were significantly different from theresponse of the A pH less than 0.25 group; indicatingthat these changes are directly related to the increasein urine pH. No significant differences between the twogroups in the response of titratable acid or bicarbonateexcretion were observed.
Electrolytes. In Table IV and Fig. 6, the urinaryelectrolyte response to the ammonium chloride loadduring the normal and potassium-depleted state is givenfor both the A pH less than 0.25 and the A pH greaterthan 0.25 groups.The urinary electrolyte response to the ammonium
chloride load was similar in the A pH greater than 0.25and A pH less than 0.25 groups. Sodium excretion wasgreater in both groups during potassium depletion andchloride excretion did not change significantly; there-fore the calculated (Cl--Na') excretion decreased sig-nificantly in both groups (Table IV, Fig. 6). Serumsodium, chloride, and creatinine concentrations were notsignificantly different during normal and potassium-depleted studies.
Potassium and potassium plus net acid excretion(K++H+) decreased significantly in both groups duringpotassium depletion (Table IV). The decrease in(K++H+) excretion was comparable in magnitude toand highly correlated with (r = 0.81, P < 0.01) thedecrease in (C--Na') excretion as seen in Fig. 7, anda similar relationship exists for potassium excretion and(ClV-Na') excretion. The mean fall in (Cl--Na+) was55 jtmoles/min, and in (K++H+) was 58 jmoles/min inthe A pH less than 0.25 group; while it was 42 and 41/hmoles/min respectively in the A pH greater than 0.25group.The ratio of urinary potassium excretion to urinary
potassium plus net acid excretion (K+/K++H+) de-creased significantly from 0.55 to 0.38 during potassiumdepletion in the A pH less than 0.25 group and from0.50 to 0.25 in the A pH greater than 0.25 group. Thisratio is significantly lower during potassium depletionin the A pH greater than 0.25 group than in the A pHless than 0.25 group.
DISCUSSION
Clarke, Evans, Macintyre, and Milne demonstrated thaturine pH was increased during potassium deficiency inthree normal human subjects receiving ammoniumchloride (2). In addition, net acid and ammonium ex-
Potassium Depletion and Urine Acidification 819
1.00-
+ 0.80_
A pH + 0.60
(K+ Depleted-0Normal)
+ 0 .40_
+0.201
o
00
00
0
0
9
I SOI.t.
. *$0I.
0 |at
.
I
0'1*10- - - - - -- -
I-- -------- ----------
a lI I I I al llIasal a l l
0.2 0.3 0.5 1.0 20 3.0 4.0 5.0 &0
FLOW RATE RATIO(K* Depleted / Normal)
FIGURE 2 The relationship between changes in urine pH and changes inurinary flow rate. These points include only the A pH greater than 025group. Urine pH was higher during potassium depletion regardless ofwhether urine flow rate increased or decreased.
Phosphate Creatinine Organic Acids
z 4 6 8 2 4 6 8
HOURS2 4 6 8
FIGURE 3 The response of urinary fixed buffer excretion to potassium depletion. Thesepoints include only the A pH greater than 0.25 group. No significant changes in phos-phate, creatinine, or organic acid excretion occurred.
820 R. L. Tannen
+ 2
+ 11
A Excretion(K Depleted - Normal)
Al moles/mn-i1
10l
10-0~~~~~~~~~~~~~
0. ..* .
._ _ _ _ _ _ _~~~~~~~-2_
-34
+

cretion were slightly decreased; however, a comparablediet was not ingested during the normal and potassiumdepletion studies. The authors concluded from these ob-servations that potassium deficiency results in an ac-
quired renal tubular acidosis, i.e., an inability toestablish a normal blood to tubular fluid hydrogen iongradient. This increase in urine pH during potassiumdeficiency was confirmed subsequently by two othergroups (3, 4); however, in both of these studies inade-quate data were reported to ascertain the mechanismresponsible for the change.
In the present study the response of a potassium-deficient subject to an acute ammonium chloride loadwas investigated with special emphasis placed on con-
trolling all other variables which may influence urineacidification. A minimum of 7 days separated the acuteammonium \ hloride studies; the same formula diet withthe exception of potassium chloride content was ingestedfor 3 days preceding both the normal and potassiumdepletion studies; food was not ingested during theacute ammonium chloride study; subjects were main-tained in the upright position during the ammoniumchloride study (18); the same dose of ammoniumchloride was ingested by the same subject at the same
time of day; the urine flow rate was controlled, andspecimens collected during comparable time periodswere subjected to paired analysis.
Since human volunteers were being studied, an at-tempt was made to induce the least amount of potassium
Net Acid
depletion necessary to observe an effect on urinaryacidification. No difference in urine pH following theingestion of ammonium chloride was detected betweennortnal and potassium-depleted studies after either 1 or
3 days of a low potassium diet. After 5 days of a lowpotassium diet the effect was variable. Some subjectshad an unequivocally higher urine pH, while othersshowed minimal increases or no change. When, in addi-tion to 5 days of a low potassium diet, Kayexalate (80g/day) was ingested on the first 2 days, urine pHfollowing an ammonium chloride load was increased inall subjects during potassium depletion. These observa-tions are consistent with previous studies which sug-gested that urine pH can be increased as a result ofpotassium deficiency (2-4).
In order to define the mechanism responsible for thisincrease in urine pH, the concomitant response of theother variables which might influence urinary acidifica-tion were analyzed. It would be expected that significantchanges in these related variables would be detectedmost easily in those studies which showed the greatestincrease in urine pH. For this reason all subjects dem-onstrating an increase in mean urine pH of 0.25 U or
greater were arbitrarily put into a group referred to as
the A pH greater than 0.25 group, and analyzed sepa-
rately. In addition, this group was compared to thegroup of patients showing either a modest or no rise inurine pH, referred to as the A pH less than 0.25 group.
Ammonium Titratoble Acid
+ 3
+ 2
+2
Excretion
(K+ Depleted-Normal)
,u moles/min
+ I
+ I
-I
-1
2 4 6 8 2 4 6 8
HOURS2 4 6 8
FIGURE 4 The response of urinary acid-base parameters to potassium depletion. Thesepoints include only the A pH greater than 0.25 group. Net acid and ammonium excretionwere both significantly greater during potassium depletion, but the small decrease intitratable acid excretion was not significant.
Potassium Depletion and Urine Acidification 821
B - .
:5
to - . * 0 00
* 0
10 0

8
7
UrineNH3 Ratio
K DepletedNormal
6
5
4
3
2
o
*I
0
.
Pe
Sit
*^ 0.,
I
a S
I
.. . ...... ....... . . . . .~~
02 Q3 0.5 1.0 2.0 3.0 4.0 5.0 6.0
FLOW RATE RATIO(K Depleted /Normal)
FIGURE 5 The relationship between changes in urinary free ammoniaconcentration (NH8) and changes in urinary flow rate. These pointsinclude only the A pH greater than 0.25 group. The increase in freeammonia occurred regardless of whether urine flow rate increased ordecreased.
No' Cl
& kxcmto(K Ospst d-Normo
,u mole /min
+20
+ I1
+ 15
+ 12
+ 10
+7T
I) +5
+ 2
-2!
-5
-7
-I0
2 4 6 8 2 4 6 8 2 4 6 8HOURS
FIGURE 6 The response of urinary electrolytes to potassium depletion.The closed circles represent the A pH greater than 0.25 group and theopen circles the A pH less than 0.25 group. Sodium excretion in-creased significantly, potassium excretion decreased significantly, andchloride excretion did not change significantly during potassiumdepletion.
822 R. L. Tannen
o 0
0 0. ~~~~~~0
o : 000 ~ ~ ~ ~
o .: 0.
05 3o * 0
gS0 *0 1
0 0~~~~00 *~~~~~0
5 0~~~~~~~~
0 ~ ~~~~~ 00
0 00~~L±W±. 4~LLL4L LLJLWL

The degree of potassium depletion was not signifi-cantly greater in the A pH greater than 0.25 group thanin the A pH less than 0.25 group (28 vs. 24 mmoles/10kg) and considerable overlap existed between the twogroups. Nevertheless, some observations suggested thatthe increase in urine pH might bear some relationshipto the degree of potassium depletion. Although the de-gree of potassium depletion was not significantly largerin the A pH greater than 0.25 than A pH less than 0.25group, a significant decrease in serum potassium con-centration was observed only in the A pH greater than0.25 group. An increase in urine pH was observed con-sistently in the Kayexalate protocol which provided thegreatest potassium-depleting stress, was more variablein the 5 day low potassium diet protocol and did notoccur in the 1 and 3 day protocols. In addition, threesubjects studied at more than one level of potassiumdepletion had the highest urine pH when they were themost depleted of potassium. Although these observa-tions suggest that urine pH is more likely to be in-creased with larger degrees of potassium depletion, itis clear that the relationship between changes in urinepH and potassium depletion varies considerably betweenindividual subjects. The amount of potassium depletionassociated with a rise in urine pH in this study was
comparable to that observed in other studies (2-4), andis also of the same magnitude necesary to inducechanges in renal concentrating ability in the human(19). Whether further degrees of potassium deficiencywould result in greater changes in urine pH is un-answered.The pH of an acid urine increases as urine flow rate
is increased (16, 17)8 and potassium depletion is knownto result in a defect in water reabsorption (19, 20).This possible explanation for the rise in urine pHobserved during potassium deficiency had not beenconsidered in any of the previous investigations, how-ever, it was specifically excluded in this study. Asnoted in Table I mean urine flow rate was not signifi-cantly different between potassium-depleted and normalstudies, and, as seen in Fig. 2, urine pH increased dur-ing potassium depletion irrespective of urine flow rate.Since a specific attempt was made to control urine flowrate in this study, the possibility cannot be excludedthat this mechanism contributes to the increase in urinepH seen in clinical settings associated with potassiumdepletion, as for example, in patients with hyperal-dosteronism (21).Urine pH was not increased because of a change in
blood pH, Pco2, or bicarbonate. Nor did the pH increase
TABLE IVMean Urinary Electrolyte Parameters ( U2-U8)
Na+ C1- (C1 - Na+) K+ (K + H+)t K+/(K+ + H+)
Subjects* Norm. K+dep. Norm. K+dep. Norm. K+dep. Norm. K+dep. Norm. K+dep. Norm. K+dep.
gmoles/min gmoles/min Mmoles/min lzmoles/min ismoles/minA pH less
than 0.25Mi 96 171 177 228 81 57 85 51 139 102 0.60 0.49A 108 191 212 235 103 45 112 54 194 136 0.58 0.40R 98 155 176 206 78 51 62 41 134 118 0.46 0.35Mc 108 141 228 193 121 51 128 57 226 143 0.56 0.39Mc (Kaye) 108 220 228 244 121 25 128 38 226 131 0.56 0.29
Mean 104 176 204 221 101 46 103 48 184 126 0.55 0.38P§i <0.01 NS <0.02 <0.02 <0.02 <0.01
A pH greaterthan 0.25
D 154 230 251 292 98 62 76 39 169 139 0.45 0.28B 70 84 113 114 44 30 66 37 121 94 0.54 0.39R (Kaye) 98 130 176 155 78 25 62 20 134 99 0.46 0.20N (Kaye) 93 101 170 133 77 32 78 27 150 101 0.52 0.27S (Kaye) 100 201 192 231 92 30 91 17 170 107 0.53 0.15
Mean 103 149 180 185 78 36 75 28 149 108 0.50 0.25P§ NS NS <0.01 <0.01 <0.01 <0.01
* Kayexalate studies indicated by (Kaye).t (K+ + H+) indicates potassium plus net acid.§ P values refer to the comparison between normal and potassium-depleted studies.
Potassium Depletion and Urine Acidification 823

a(K+H )(K+ Depleted-
Normal)p moles /min
+1
0
0
0
00
0* 0
0
* A
/0.
.
0
0S
0
0..
0 *
-40 -60 -80
A (Ci-Na+)(K+ Depleted-Normal)
ju moles / minFIGURE 7 The relationship between changes in potassium plus net acid excretion(K++H+) to changes in chloride minus sodium excretion (Cl--Na+). These pointsinclude both the A pH greater than 0.25 and A pH less than 0.25 groups. The 450identity line is drawn to indicate the relationship expected if the changes in bothparameters are of equal magnitude. The decrease in (K++H+) excretion and thedecrease in (Cl--Na+) excretion which occurred during potassium depletion werecorrelated significantly and were approximately equal.
result from an increase in fixed buffering capacity ofthe urine; as seen in Fig. 3, no increase in phosphate,creatinine, or organic acid excretion was observedduring potassium depletion.Net acid excretion was found to be increased rather
than decreased in those subjects demonstrating thegreatest increase in urine pH. The increase was ac-counted for entirely by an increase in ammonium excre-tion of greater magnitude than the rise in net acid.6Neither net acid excretion nor ammonium excretionchanged significantly in the A pH less than 0.25 group,indicating that the changes in both of these parametersare related in some fashion to the rise in urine pH.Significant changes were not found in either titratable
6If the increases in net acid and ammonium excretionwere the result of an increase in ammonium chloride absorp-tion from the gastrointestinal tract during potassium defi-ciency, they should be associated with a decrease rather thanan increase in urine pH.
acid or bicarbonate excretion and although calculatedtitratable acid minus bicarbonate excretion decreased inevery study, this change was also not statistically sig-nificant. In the urine pH range of these studies, it wasexpected that any changes in these parameters would betoo small to validate statistically.7
It has been suggested that the increase in urine pHduring potassium deficiency is the result of an inabilityto establish a normal blood to urine hydrogen ion gra-
7In the urine pH range of these studies virtually all theurinary phosphate is in the acidified form and thereforechanges in phosphate excretion will have a much greaterinfluence on titratable acid excretion than will changes inurine pH. Although phosphate excretion did not changesignificantly during potassium depletion in the A pH greaterthan 0.25 group, its variability in individual studies wouldserve to mask possible small changes in titratable acidexcretion in the group as a whole resulting from the in-crease in urine pH. Also in this pH range changes inbicarbonate excretion would be minimal.
824 R. L. Tannen

dient (2). A priori, it might be expected that a defectin hydrogen ion transport would result in diminished,certainly not enhanced, excretion of an acute acid load.Indeed in classical distal renal tubular acidosis, theresponse to an acute ammonium chloride load is a com-bination of a higher urine pH and lower rate of netacid excretion than observed in normal subjects (5).However, the patient with classical renal tubular acido-sis has a number of factors including a diminishedglomerular filtration rate and chronic metabolic acido-sis, as well as potassium deficiency, which mightmodify the response to an acid load. On the other hand,individuals with so-called "incomplete renal tubularacidosis," who have a normal glomerular filtration rateand no acidosis or hypokalemia, provide a relativelypure model of a hydrogen ion gradient defect. Rela-tively few of these patients have been reported in theliterature. The three patients initially described byWrong and Davies included one with subnormal andone with supernormal net acid excretion in responseto an acute acid load (5). Two of the three patientsreported by Buckalew, McCurdy, Ludwig, Chaykin, andElkinton had relatively low rates of net acid excretion(22) and all six of the patients reported by Gydry andEdwards had low rates of net acid excretion (23).One patient with incomplete renal tubular acidosisevaluated by us had an unequivocal diminution in netacid and ammonium excretion when compared to 18normal subjects. Therefore it appears that net acidexcretion in response to an acid load is diminished, ifchanged at all, when a defect in establishing a normalhydrogen ion gradient exists.
In addition, although it has frequently been pointedout that ammonium excretion is high in relationship tourine pH in individuals with renal tubular acidosis(5, 23), rates of ammonium excretion higher than nor-mal are not noted usually in patients with either classicor incomplete renal tubular acidosis. On the contrary,the absolute rate of ammonium excretion most often hasbeen unchanged or diminished (5, 22, 23). Since theresponse of subjects with potassium deficiency to anacute acid load is characterized by an increase in netacid and an even greater increase in ammonium ex-cretion it would seem unlikely that this is the resultof an acquired renal tubular acidosis.A more plausible explanation for these experimental
results is that potassium depletion causes a primaryincrease in ammonia diffusion into the urine. Theoreti-cally if the excretion rate of net acid and fixed buffer,as well as the rate of urine flow, remain constant, anincrease in ammonia diffusion into the urine wouldresult in an increase in free ammonia concentration, anincrease in the ratio of free ammonia to ammoniumconcentration, and a concomitant increase in urine pH
and rearrangement of other urinary buffer pair con-centration ratios. The urine concentration and excretionrate of titratable acid would tend to decrease and thoseof bicarbonate8 and ammonium to increase; but themagnitude of these changes would depend on the initialpH of the urine, the concentration of fixed buffer inthe urine and the quantity of ammonia added. In actualfact, however, net acid excretion might increase ratherthan remain constant because the rise in urine pHwould enhance the gradient for hydrogen ion secretion.If so, any added hydrogen ion would be excreted inthe form of ammonium. The results of this study areconsistent with such a sequence of events. Urine pHand free ammonia concentration increased concomi-tantly with an increase in ammonium and net acidexcretion. As would be anticipated in the urine pHrange of this study, the effects on titratable acid andbicarbonate excretion were minimal.
Other evidence exists to suggest that an increase inrenal ammonia production accompanies potassium de-pletion. Potassium-depleted rats have been found to haveincreased activity of renal glutaminase (24) and glu-tamine transaminase-w-amidase (25) enzymes and con-comitantly an increase in urinary ammonium excretion.In addition, renal cortical slices from potassium-de-pleted rats have an increased rate of glucose produc-tion (26). These observations are all consistent with anincreased rate of ammonia production. Conflict existsregarding the glutaminase activity in the kidneys ofpotassium-depleted dogs (27, 28); however, Gabuzda,Hall, Baertl, and Sancetta have shown by direct tech-niques in vivo that potassium depletion can increaserenal ammonia production in normal dogs and also inhumans with cirrhosis (28, 29). No direct measurementsof renal ammonia production in normal humans havebeen reported to date.Although this relationship between ammonia produc-
tion and potassium depletion has been noted, its possiblephysiologic ramifications have not been elucidated. Someof the findings in this study suggest that an increase inrenal ammonia production could possibly be a controlmechanism for potassium conservation.
In this study potassium depletion was found to enhancethe natriuretic response to an ammonium chloride loadand other investigators have noted comparable findings(2, 3). On the other hand many investigators havedescribed sodium retention during potassium depletion,and recently this has been ascribed to an increase inproximal tubular sodium reabsorption (30). Our findingsduring potassium deficiency probably differ from those
8 Bicarbonate concentration will increase only if a suffi-ciently large decrease in urine Pco2 does not occur. In thisstudy urine Pco2 was not significantly different during thenormal and potassium-depleted state.
Potassium Depletion and Urine Acidification 825

of others because of the administration of ammoniumchloride which modifies renal sodium handling and alsopossibly because our studies were acute, while those inwhich sodium retention have been noted were chronic.This slightly greater natriuretic response to an am-monium chloride load during potassium depletion wasaccompanied by a consistent decrease in calculated(Cl--Na+) excretion which was quantitatively similarto and significantly correlated with a concomitant de-crease in total potassium and net acid excretion (K++H+), as seen in Fig. 7. This pattern of electrolyteexcretion most likely represents a decrease in distalsodium-cation exchange and probably is a result, atleast in part, of the decrease in aldosterone secretionwhich accompanies potassium depletion (31-33). Thisapparently is one manner in which urinary potassiumexcretion is altered in response to potassium deficiency.
In addition to the decrease in sodium-cation exchange,a striking decrease in the per cent of potassium in thetotal cation exchanged, i.e. the ratio of K+/(K++H+),was observed; and the per cent of potassium appears tobe lowest in those studies showing the greatest increasein urine pH. In the A pH greater than 0.25 group thisdecrease in percentage of potassium comprising totalcation exchange (49 ±o8% SE) is far greater than thepercentage decrease in serum potassium (14 +3% SE),or estimated decrease in total body potassium (6 ±0.4%SE).' It presumably is also far greater than the decreasein intracellular and more specifically renal tubularpotassium concentration (35). Therefore some mecha-nism other than a change in potassium concentration insome body compartment appears to be necessary toexplain fully the decrease in K+/(k++H+) ratio. Apossible explanation would be that aldosterone effectsthe renal tubule by selectively altering only sodium-potassium exchange; however, most evidence suggeststhat it always affects hydrogen ion exchange concomi-tantly as well (36-39). It is tempting to speculate thatthis unexplained decrease in potassium excretion mightbe the result of an increase in renal ammonia produc-tion accompanying potassium depletion. The more fa-vorable gradient for hydrogen ion secretion resultingfrom increased ammonia production could enhance dis-tal sodium-hydrogen ion exchange at the expense ofsodium-potassium exchange. Further studies in an at-tempt to substantiate this thesis would be of interest.
ACKNOWLEDGMENTSI wish to thank the entire staff of the Metabolic Ward,Walter Reed General Hospital and Walter Reed ArmyInstitute of Research, for their invaluable assistance; Mr.Daniel Minnick for his help in programming the data
' Calculated assuming a normal body potassium content of49 mEq/kg (34).
analysis; and Colonel Paul Teschan for his support andencouragement.
REFERENCES1. Berliner, R. W. 1959-60. Renal mechanisms for potas-
sium excretion. Harvey Lect. 55: 141.2. Clarke, E., B. M. Evans, I. Macintyre, and M. D.
Milne. 1955. Acidosis in experimental electrolyte deple-tion. Clin. Sci. (London). 14: 421.
3. Rubini, M. E., W. B. Blythe, E. G. Herndon, and W. H.Meroney. 1957. Influence of potassium deficiency onresponse to an acidifying salt. Clin. Res. 5: 193.
4. Schloeder, F. X., and B. J. Stinebaugh. 1966. Defect ofurinary acidification during fasting. Metab. (Clin. Exp.)15: 17.
5. Wrong, O., and H. E. F. Davies. 1959. The excretionof acid in renal disease. Quart. J. Med. 28: 259.
6. Mitchell, J., and H. J. Gitelman. 1968. A low electrolyteliquid diet suitable for metabolic studies. Amer. J. Clin.Nutr. 21: 1321.
7. Fitzgerald, M. G., and P. Fourman. 1956. An experi-mental study of magnesium deficiency in man. Clin. Sci.15: 635.
8. Dunn, M. J., and M. Walser. 1966. Magnesium depletionin normal man. Metab. (Clin. Exp.) 1S: 884.
9. Fiske, C. H., and T. J. Subbarow. 1925. The coloro-metric determination of phosphorus. J. Biol. Chem. 66:375.
10. Logsdon, E. E. 1960. A method for the determination ofammonia in biological materials on the autoanalyzer.Ann. N. Y. Acad. Sci. 87: 801.
11. Chasson, A. L., M. J. Grady, and M. A. Stanley. 1961.Determination of creatinine by means of automaticchemical analysis. Amer. J. Clin. Path. 35: 83.
12. Van Slyke, D. D., and W. W. Palmer. 1920. Studies ofacidosis. XVI. The titration of organic acids in urine.J. Biol. Chem. 41: 567.
13. Hastings, A. B., and J. Sendroy. 1925. The effect ofvariation in ionic strength on the apparent first andsecond dissociation constants of carbonic acid. J. Biol.Chem. 65: 445.
14. Schwartz, W. B., N. Bank, and R. W. P. Cutler. 1959.The influence of urinary ionic strength on phosphatepK2' and the determination of titratable acid. J. Clin.Invest. 38: 347.
15. Bank, N., and W. B. Schwartz. 1960. Influence of cer-tain urinary solutes on acidic dissociation constant ofammonium at 370C. J. Appl. Physiol. 15: 125.
16. Nutbourne, D. M., and H. E. de Wardener. 1961. Theeffect of a water diuresis on the urinary excretion ofhydrogen ions in man. Clin. Sci. (London). 20: 63.
17. Woeber, K. A., E. L. Reid, I. Kiem, and A. G. Hills.1963. Diffusion of gases out of the distal nephron seg-ment in man. I. NH3. J. Clin. Invest. 42: 1689.
18. Steinmetz, P. R., and N. Bank. 1963. Effects of acuteincreases in the excretion of solute and water on renalacid excretion in man. J. Clin. Invest. 42: 1142.
19. Rubini, M. E. 1961. Water excretion in potassium-deficient man. J. Clin. Invest. 40: 2215.
20. Relman, A. S., and W. B. Schwartz. 1956. The ne-phropathy of potassium depletion. A clinical and patho-logical entity. N. Engl. J. Med. 255: 195.
21. Luetscher, J. A. 1964. Primary aldosteronism. Observa-tions in six cases and review of diagnostic procedures.Medicine. 43: 437.
826 R. L. Tannen

22. Buckalew, V. M., Jr., D. K. McCurdy, G. D. Ludwig,L. B. Chaykin, and J. R. Elkinton. 1968. Incompleterenal tubular acidosis. Physiologic studies in threepatients with a defect in lowering urine pH. Amer. J.Med. 45: 32.
23. Gybry, A. Z., and K. D. G. Edwards. 1968. Renaltubular acidosis. A family with an autosomal dominantgenetic defect in renal hydrogen ion transport, withproximal tubular and collecting duct dysfunction andincreased metabolism of citrate and ammonia. Amer.J. Med. 45: 43.
24. Iacobellis, M., E. Muntwyler, and G. E. Griffin. 1954.Enzyme concentration changes in the kidneys of pro-tein- and/or potassium-deficient rats. Amer. J. Physiol.178: 477.
25. Goldstein, L. 1964. Relation of renal glutamine trans-aminase-w-amidase activity to ammonia excretion inthe rat. Nature (London). 201: 1229.
26. Goodman, A. D., R. E. Fuisz, and G. F. Cahill. 1966.Renal gluconeogenesis in acidosis, alkalosis, and potas-sium deficiency: its possible role in regulation of renalammonia production. J. Clin. Invest. 45: 612.
27. Iacobellis, M., E. Muntwyler, and G. E. Griffin. 1955.Kidney glutaminase and carbonic anhydrase activity andtissue electrolyte composition in potassium-deficient dogs.Amer. J. Physiol. 183: 395.
28. Gabuzda, G. J., and P. W. Hall, III. 1966. Relation ofpotassium depletion to renal ammonium metabolism andhepatic coma. Medicine. 45: 481.
29. Baertl, J. M., S. M. Sancetta, and G. J. Gabuzda. 1963.Relation of acute potassium depletion to renal ammo-nium metabolism in patients with cirrhosis. J. Clin. In-vest. 42: 696.
30. Lennon, E. J., and J. Lemann, Jr. 1968. The effect of apotassium-deficient diet on the pattern of recovery fromexperimental metabolic acidosis. Clin. Sci. (London).34: 365.
31. Johnson, B. B., A. H. Lieberman, and P. J. Mulrow.1957. Aldosterone excretion in normal subjects depletedof sodium and potassium. J. Clin. Invest. 36: 757.
32. Gann, D. S., C. S. Delea, J. R. Gill, Jr., J. P. Thomas,and F. C. Bartter. 1964. Control of aldosterone secre-tion by change of body potassium in normal man. Amer.J. Physiol. 207: 104.
34. Cannon, P. J., R. P. Ames, and J. H. Laragh. 1966.Relation between potassium balance and aldosteronesecretion in normal subjects and in patients with hyper-tensive or renal tubular disease. J. Clin. Invest. 45: 865.
34. Edelman, I. S., and J. Leibman. 1959. Anatomy of bodywater and electrolytes. Amer. J. Med. 27: 256.
35. Welt, L. G., W. Hollander, Jr., and W. B. Blythe. 1960.The consequences of potassium depletion. J. ChronicDis. 11: 213.
36. August, J. T., and D. H. Nelson. 1959. The dual actionof aldosterone on renal sodium reabsorption in normalsubjects. Clin. Res. 7: 274.
37. Mills, J. N., S. Thomas, and K. S. Williamson. 1961.The effects of intravenous aldosterone and hydrocorti-sone on the urinary electrolytes of the recumbent humansubject. J. Physiol. (London). 156: 415.
38. Sonnenblick, E. H., P. J. Cannon, and J. H. Laragh.1961. The nature of the action of intravenous aldoster-one: evidence for a role of the hormone in urinarydilution. J. Clin. Invest. 40: 903.
39. Liddle, G. W. 1958. Aldosterone antagonists. Arch.Intern. Med. 102: 998.
Potassium Depletion and Urine Acidification 827