the effects of fatigue on biomechanics of heading
TRANSCRIPT

Bridgewater State UniversityVirtual Commons - Bridgewater State University
Master’s Theses and Projects College of Graduate Studies
2018
The Effects of Fatigue on Biomechanics of HeadingPerformance in SoccerSeunguk Han
Follow this and additional works at: http://vc.bridgew.edu/theses
Part of the Sports Sciences Commons
This item is available as part of Virtual Commons, the open-access institutional repository of Bridgewater State University, Bridgewater, Massachusetts.
Recommended CitationHan, Seunguk. (2018). The Effects of Fatigue on Biomechanics of Heading Performance in Soccer. In BSU Master’s Theses and Projects.Item 60.Available at http://vc.bridgew.edu/theses/60Copyright © 2018 Seunguk Han

THE EFFECTS OF FATIGUE ON BIOMECHANICS OF HEADING PERFORMANCE IN
SOCCER
A Thesis Presented
By
SEUNGUK HAN
Submitted to the Graduate School of Bridgewater State University
in partial fulfillment of the requirements for the degree of
MASTER OF SCIENCE IN ATHLETIC TRAINING
May 2018

i
THE EFFECTS OF FATIGUE ON BIOMECHANICS OF HEADING PERFORMANCE IN
SOCCER
A Thesis Presented
By
SEUNGUK HAN
Approved as to style and content by:
_______________________________________________________________________
(Chairperson of Thesis Committee) and date
_______________________________________________________________________
(Committee Member) and date
_______________________________________________________________________
(Committee Member) and date
May 2018

ii
ABSTRACT
Title of Thesis: THE EFFECTS OF FATIGUE ON BIOMECHANICS OF
HEADING PERFORMANCE IN SOCCER
SEUNGUK HAN, Master of Science, 2018
Thesis directed by: Dr. Tong-Ching Tom Wu
Soccer is one of the high intermittent sports, in which the athletes perform
various activities of different intensities over a prolonged period. One of the most
important and potentially dangerous skills in soccer is heading because it can potentially
cause concussion if it is not executed correctly. Even though coaches and practitioners
recognize that heading the ball is one of the factors to cause concussion, there are few
studies that have examined the kinematics of head and neck motion while performing
heading skill. Therefore, the purpose of this study was to examine the effects of short
period fatigue on the biomechanical performance of soccer heading skill. Six competitive
college male soccer players (age, 21.5 ± 3.15 years; height, 1.76 ± 0.06 m; mass, 71.38 ±
9.55 kg) participated in this study. A standard two-dimensional kinematic analysis was
conducted using a high-speed video camera operated at 120 Hz during heading
performance. A 90-second fatigue protocol soccer course was set up to mimic a real
soccer game situation. All soccer players completed fatigue protocol five sets to induce
fatigue. The mechanics of heading skills were recorded prior to the fatigue protocol and
then after each fatigue protocol. Six joint reflective markers were placed on the right side
of each participant’s body. The statistical analysis between the baseline and after each
fatigue protocol data was conducted using one-way repeated measure ANOVA at α =
0.05 and followed up by t-test with Bonferroni adjustment if a significant difference was

iii
found. The result showed that there were no statistically significant differences in the
heading ball velocity and acceleration, cervical spine and hip joint angle, velocity and
acceleration at the time of ball contact. The results of this study suggest that heading ball
velocity and acceleration, biomechanics of cervical spine and hip joint may not indicate
fatigue even if athletes were fatigued during practices or games. Moreover, recreationally
active male individuals may require more than five sets of 90-second fatigue protocol
soccer course to induce fatigue if research or training personnel intend to use this protocol
to study changes in heading ball velocity and acceleration and cervical spine and hip joint
angle, velocity, and acceleration at the time of ball contact.

iv
TABLE OF CONTENTS
Page ABSTRACT ............................................................................................................................... ii
TABLE OF CONTENTS .......................................................................................................... iv
LIST OF TABLES ..................................................................................................................... v
LIST OF FIGURES ................................................................................................................... vi
LITERATURE REVIEW ........................................................................................................... 3
Muscle Fatigue ................................................................................................................................. 4
Heading and Concussion ................................................................................................................. 6
Summary ........................................................................................................................................... 7
METHODS ................................................................................................................................. 9
Participants ...................................................................................................................................... 9
Experimental Setup .......................................................................................................................... 9
Procedures ..................................................................................................................................... 10
Data Processing ............................................................................................................................. 11
Statistical Analysis ......................................................................................................................... 12
RESULTS ................................................................................................................................. 13
DISCUSSION ........................................................................................................................... 17
CONCLUSION ........................................................................................................................ 22
REFERENCES ......................................................................................................................... 23
v
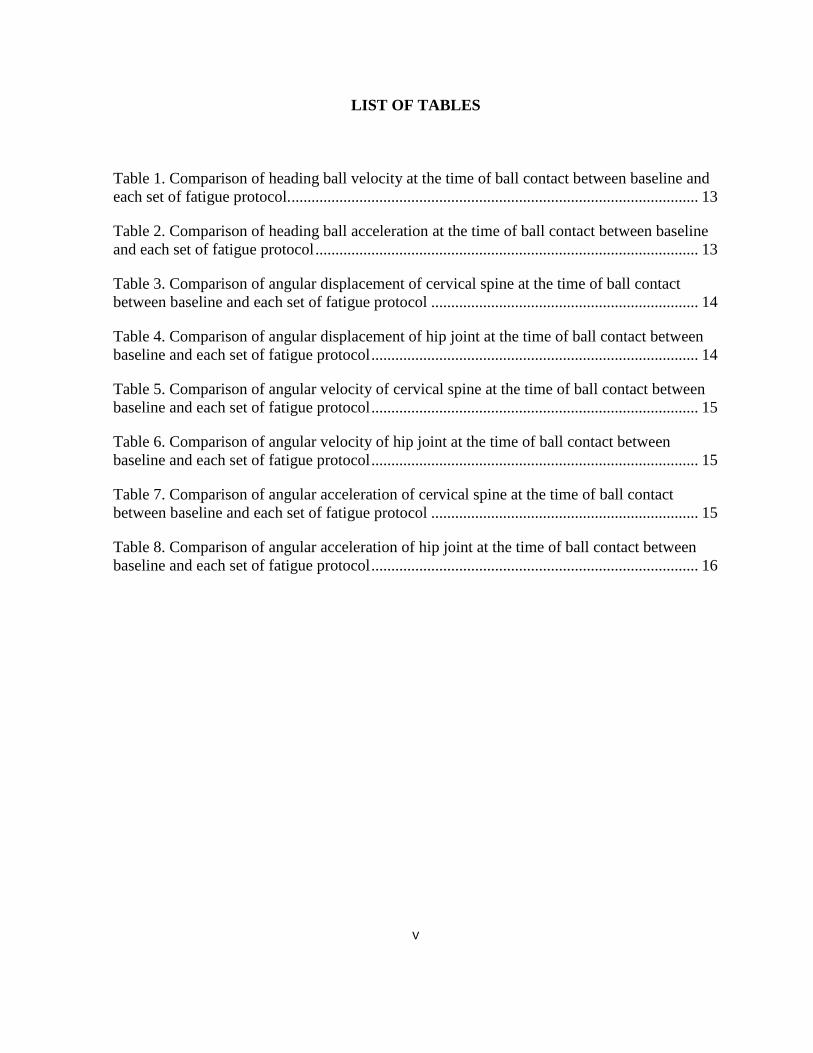
LIST OF TABLES
Table 1. Comparison of heading ball velocity at the time of ball contact between baseline and
each set of fatigue protocol. ...................................................................................................... 13
Table 2. Comparison of heading ball acceleration at the time of ball contact between baseline
and each set of fatigue protocol ................................................................................................ 13
Table 3. Comparison of angular displacement of cervical spine at the time of ball contact
between baseline and each set of fatigue protocol ................................................................... 14
Table 4. Comparison of angular displacement of hip joint at the time of ball contact between
baseline and each set of fatigue protocol .................................................................................. 14
Table 5. Comparison of angular velocity of cervical spine at the time of ball contact between
baseline and each set of fatigue protocol .................................................................................. 15
Table 6. Comparison of angular velocity of hip joint at the time of ball contact between
baseline and each set of fatigue protocol .................................................................................. 15
Table 7. Comparison of angular acceleration of cervical spine at the time of ball contact
between baseline and each set of fatigue protocol ................................................................... 15
Table 8. Comparison of angular acceleration of hip joint at the time of ball contact between
baseline and each set of fatigue protocol .................................................................................. 16

vi
LIST OF FIGURES
Figure 1. A 90-second fatigue protocol soccer course to induce fatigue ................................. 10
Figure 2. A header pendulum fixed to a metal frame with a rope attached on the wall ........... 11

1
Soccer is a high-intermittent sport, in which athletes perform various activities in
different intensities over a prolonged period.1 During a game, soccer players perform 1,000 to
1,400 short-period actions that change every three to five seconds including actions with ball and
without ball such as dribbling, tackling, running, jumping, kicking, and heading.2, 3 One of the
most important and dangerous skills in soccer is heading because it can potentially cause
concussion if it is not executed correctly. Marar indicated a large percentage of total injuries
among high school soccer players (girls: 15.4%; boys: 11.1%) is from concussion.4 Among both
girls and boys, the activity most frequently related with concussion was heading performance
(27.7% and 31.1%, respectively). In addition, approximately 60% of injuries sustained while
performing heading skill were concussions. 4 Even though coaches and practitioners recognize
that heading the ball is one of the mechanisms of concussion, there are few studies that have
examined the kinematics of head and neck motion while performing the heading skill.
Fatigue during the game is one of the critical factors that could potentially affect athletic
performances and movements. According to previous study, Mohr indicated that soccer players
present two different fatigue patterns: a short fatigue pattern (momentary fatigue), which occurs
depending on different game situations; and a long fatigue pattern related with long periods
(from start of the game to finish).5 Research studies have examined the effects of fatigue on
injuries or performances on muscle strength, angles of peak torque of hamstring muscles, and
ground reaction forces.6, 7 Some research studies have evaluated the relationship between fatigue
and injury in soccer players.8, 9 However, these studies primary focused on physiological changes
in the lower extremities, as opposed to mechanical differences between fatigue and upper
extremities. Thus, there is a lack of understanding how fatigue can affect head and neck injuries
2
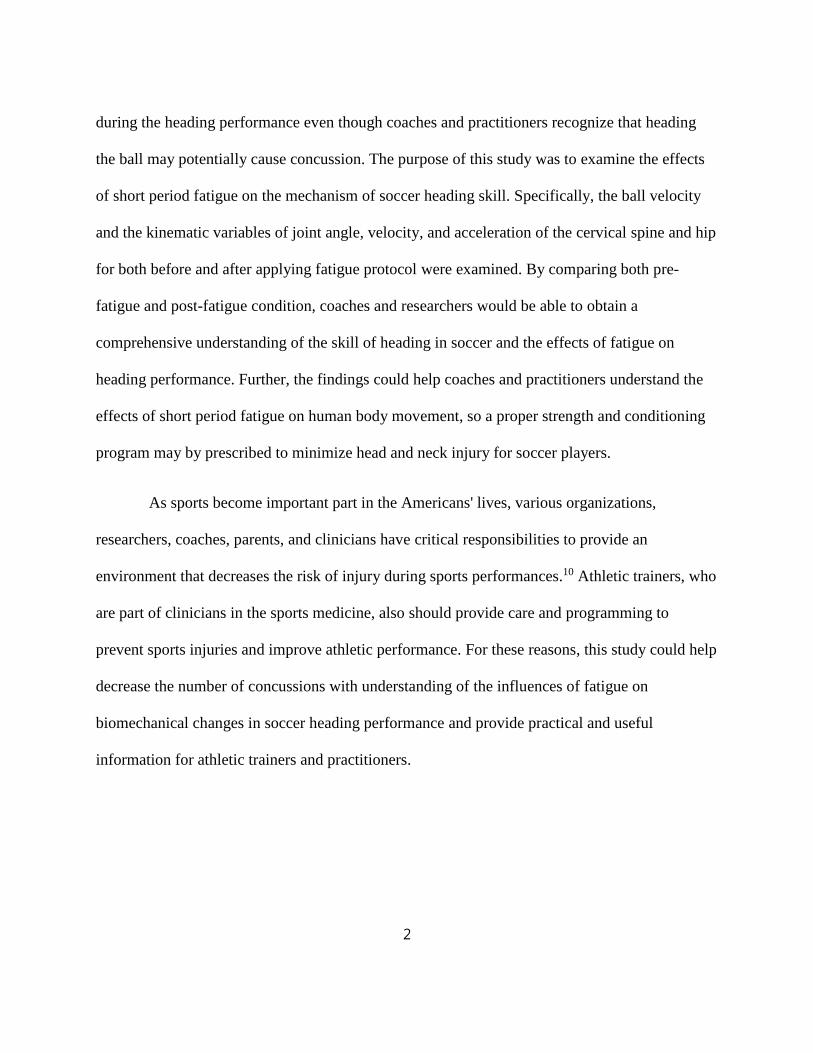
during the heading performance even though coaches and practitioners recognize that heading
the ball may potentially cause concussion. The purpose of this study was to examine the effects
of short period fatigue on the mechanism of soccer heading skill. Specifically, the ball velocity
and the kinematic variables of joint angle, velocity, and acceleration of the cervical spine and hip
for both before and after applying fatigue protocol were examined. By comparing both pre-
fatigue and post-fatigue condition, coaches and researchers would be able to obtain a
comprehensive understanding of the skill of heading in soccer and the effects of fatigue on
heading performance. Further, the findings could help coaches and practitioners understand the
effects of short period fatigue on human body movement, so a proper strength and conditioning
program may by prescribed to minimize head and neck injury for soccer players.
As sports become important part in the Americans' lives, various organizations,
researchers, coaches, parents, and clinicians have critical responsibilities to provide an
environment that decreases the risk of injury during sports performances.10 Athletic trainers, who
are part of clinicians in the sports medicine, also should provide care and programming to
prevent sports injuries and improve athletic performance. For these reasons, this study could help
decrease the number of concussions with understanding of the influences of fatigue on
biomechanical changes in soccer heading performance and provide practical and useful
information for athletic trainers and practitioners.

3
LITERATURE REVIEW
Soccer is one of the most common and popular sports in the world. The International
Federation of Association Football (FIFA) reported that approximately 265 million people
participated in soccer worldwide in 2007.11 There are currently 209 nations recognized for
men and 177 for women listed in the FIFA World rankings process. Participation at both elite
and recreational levels has increased significantly in women’s soccer. Fahmy indicated that
only two international matches were played in 1971 compared to over 500 competitions
involving 141 countries in 2010, with almost 29 million women competing in soccer in
2011.12 In the United States, the popularity of soccer has been increasing, and it is recognized
as the primary youth participation sport. During the 2009-2010 school year, over 390,000
student athletes participated in the 11,375 authorized boys’ high school soccer programs;
more than 25 percent of participation has been increased in 10 years.13 According to National
Federation of State High School Associations (NFHS), the number of high school soccer
programs in the U.S. has approximately doubled in the past 20 years.13 Due to its’ popularity,
soccer is reported to have the third highest number of injuries in the U.S after football and
wrestling.14
Previous researchers investigated about movement demands of men’s soccer athletes.1,
15-17 Soccer is one of the high intermittent sports, in which athletes perform various activities
at different intensities over a prolonged period.1 During the game, soccer players perform
1,000 to 1,400 short period actions that changes every three to five seconds including actions
with ball and without ball such as dribbles, tackles, running at various velocities, jumps, kicks

4
and headings, and each type of movements varies significantly in terms of physiological
demand on athletes.2, 3, 18, 19
A typical soccer game is 90 minutes in duration (two halves with 45 minutes with a 15-
minute halftime break). The effective time in the game that subtract the time such as
substitution, injuries, goals, and stoppages is nearly 50 minutes or 55% of the total duration of
the match.20 In general, elite soccer players cover approximately 11 kilometers in distance
with moderate intensity effort near the anaerobic threshold (80 to 90 percent of maximal heart
rate) and the ratio of work to rest is 1:8 depending on teams’ strategy.1, 15, 21-24 In addition, the
average time of ball possession per each player in the game is from 44.6 to 74.3 seconds.25
According to Withers, soccer players in the Australian Professional National League perform
nearly 50 high speed changes in direction during a competition.26 Hence, the activity profile
of the soccer players can be considered as high intensity, repeated, multidirectional sprint, and
match specific efforts, combined with different bouts of low to moderate intensity activity for
the duration of the game.
Muscle Fatigue
Fatigue is defined as the inability to continue a desired level of intensity during task.27
Although the effect of fatigue on injury occurrence is unclear, within the field of exercise
physiology or sport, fatigue is defined as “feeling or tiredness or exhaustion or a need to rest
because of lack of energy or strength.”28 According to Abbiss, different fields of sports
science have described fatigue best match individual disciplines.29 For example,
biomechanists may evaluate fatigue as a decrease in the muscle force output from the

5
breakdown of mechanical motion whereas psychologists may define fatigue as feeling of
tiredness, and physiologists may measure fatigue as the failure of a particular physiological
system.29 In addition, as Abbiss explained that there are several interrelated models for
exercise related fatigue such as cardiovascular/anaerobic model (decreased in function of
cardiovascular function and the capacity to supply the body with rich-oxygen blood with
removing metabolic by products at the same time), energy supply model (an incapability to
meet energy demand for working muscle), neuromuscular model (failures in excitation-
contraction coupling), muscle trauma model (macro/micro strain to the muscle fiber structure
and whole muscle), biomechanical model (decreased efficiency of movement with strenuous
or prolonged exercise), thermoregulation model (body’s self-protection from increased
temperature), psychological/motivational model (reduced motivation to maintain activity),
and central governor model (overarching body safety switch against overload).
As fatigue is considered negative and an inevitable result of exercise, research has
investigated effects of fatigue on exercise performance.30-32 Evidence from previous
researches studied from different sports suggest that both perceived fatigue produced by
exercise and fatigue associated with muscle force are the risk factors for injury during
competition and practice.33-36 In ice hockey, a study of high school players have indicated that
fatigue may increase the risk of injury.35 In the skill of hockey department, research has
shown that fatigue may change backward skating mechanism.36 In addition, basketball players
in China have reported that they believe when they experience fatigue, they are more prone to
injury.34 Hawkins indicated that the final 15 minutes of both halves in a soccer game is where
the majority of non-contact injuries occur; as the duration of athletic event increases, the risk

6
of injury increases as well. Thus, it can be concluded that fatigue can be a major risk factor
for injury.37
There are different methods to assess and evaluate fatigue such as questionnaire or
electromyography (EMG). The objective methods of measurements for fatigue include using
EMG, altering muscle and body segment coordination, changing in posture and accuracy of
performance.38 Jump landing is a common test to measure of fatigue in athletic performance in
a laboratory setting, and any weakness in the lower extremity muscle may result in injury to
the knee or ankle joint.38 Researchers have indicated that fatigue changes the kinematics of
landing which makes the knee joint more vulnerable to injury.39, 40 Specifically, fatigue
increases hip and ankle muscle forces and the anterior knee shear force during landing.39, 41
Heading and Concussion
The skill of heading in soccer is first performed by extending head and trunk backward,
followed by a quick forward head and truck flexion movements to strike the ball with player’s
forehead.42 The heading technique requires high velocity of trunk hyperextension to generate a
high impact force applied to the ball with a rigid neck musculature in order to stabilize the
head during the movement. The most common heading injuries are due to improper mechanics
in which the ball impacts the head with insufficient head and neck stability and the lack of
flexion in the neck joint.43 According to Marar, a large percentage of the injuries experienced
by high school soccer players (girls: 15.4% and boys: 11.1%) are concussions. Tysvaer
indicated that up to 22% of soccer injuries consist of head injuries including concussions.4, 44
In addition, approximately 60% of injuries sustained by concussions experienced as a result of

7
heading performance.4 Sports-related concussions are often the result of an external force,
which causes an impacting the skull. Sports-related concussions may result from contact with
the playing surface, a part of sports equipment, or another player. The collision can produce
acceleration and deceleration forces, which may cause damage to the brain’s central nervous
system. The degree of concussion depends on a variety of factors that include the direction of
impact, anatomical structures, and distribution of forces.45 The complexity surrounding the
mechanism of head injuries and concussive symptoms, the concussion assessment and
management are extremely challenging. Head injuries and concussion can potentially be
ignored due to ignorance, poor information given by the athletes, and inadequately staffed
sporting events. Currently, there are different types of concussion assessment include postural
assessments, graded symptom checklists, neuropsychological tests, balance protocols, and
mental status measurements. These concussion assessment protocol and tests are commonly
used in both laboratory and field settings.46
Summary
Previous research studies have investigated the relationship between fatigue and injuries
or performances on muscle strength, angles of peak torque of hamstring muscles, and ground
reaction forces.6, 7 Some researchers also have examined muscle and body segment
coordination, changes in posture, and changes in accuracy of performance.38 However, there
are lack of studies that evaluate biomechanical changes in head and neck (cervical spine) and
trunk and hip motions. Due to the lack of empirical evidence, it is important to examine the
biomechanical changes in ball velocity and the joint angle, velocity, and acceleration of the
cervical spine and hip when athletes become fatigued. The results of the study could help
8
athletic trainers, coaches and other healthcare providers better understand the effects of fatigue
on soccer heading skill. A proper strength and conditioning program could be used to players
to minimize chances of concussion and head and neck injuries.

9
METHODS
Participants
Before conducting this study, the researcher obtained approval from the University’s
Institutional Review Board (Case #2018090). Six healthy, competitive collegiate male soccer
players (age: 21.5 ± 3.15 years; height: 1.76 ± 0.06 m; mass: 71.38 ± 9.55 kg) participated.
Participants had soccer experience of at least five years, were free of injury at the time of data
collection, and had no history of surgery to their back or lower extremities. Informed consent
form was obtained from the participants prior to participation.
Experimental Setup
Six joint reflective markers were placed on the right side of the body (sagittal plane)
including participant’s top head, spine of cervical two (C2) and seven (C7), greater tubercle of
humerus, greater trochanter of femur, and lateral epicondyle of the femur. A 90-second fatigue
protocol soccer course was set up to induce fatigue.47 The rationale for setting up a 90-second
course was to induce fatigue based on the depletion of the anaerobic energy system.48 This
protocol consisted of shooting, running, pivoting, cutting, jumping, dribbling, and heading to
mimic a real soccer game situation (Figure.1). Data collection was conducted in one session and
was approximately one hour in duration for each participant. A Casio high speed video camera
(Model: Ex-FH25) was used to capture the kinematic movement in the sagittal view at 120
frames per second during heading performance. Additionally, a 650W artificial light was used to
assist joint marker identification.

10
Figure 1. A 90-second fatigue protocol soccer course to induce fatigue
Procedures
All participants were asked to wear indoor soccer shoes and a soccer uniform or
sweatpants to facilitate the placement of six joint reflective markers. Prior to testing, participants
were asked to warm-up and stretch own their ways. The participants performed heading using a
header pendulum fixed to a metal frame with a rope attached on the wall (Figure 2) above the
participants with standardized ball (size 5; diameter 0.22m). The ball pendulum height was
standardized to the distance of one ball diameter between head and pendulum. The participants’
starting position was selected so that the ball was at the height of the forehead. The participants
were instructed to perform a header from a standing position by jumping with both legs and
heading the ball as forcefully as possible in a horizontal forward direction.49 After setting the ball
heights, participants performed five sets of heading and shooting for the baseline testing. After

11
the baseline testing, participants performed fatigue protocol. Participants were asked to finish
five sets of fatigue protocol in 90 seconds for each set. Five sets of heading performance were
recorded at the end of each fatigue protocol.
Figure 2. A header pendulum fixed to a metal frame with a rope attached on the wall
Data Processing
All video trials were transferred onto a personal laptop computer and the three best
trials, determined by ball velocity, were analyzed to ensure the reliability of the data. Since each
participant performed heading three times each session, baseline and five sets of fatigue protocol,
a total of 108 trials (6 participants x 3 trials of heading performance x 6 different timelines) were
collected in this study. A standard two-dimensional kinematic analyses were conducted with
12
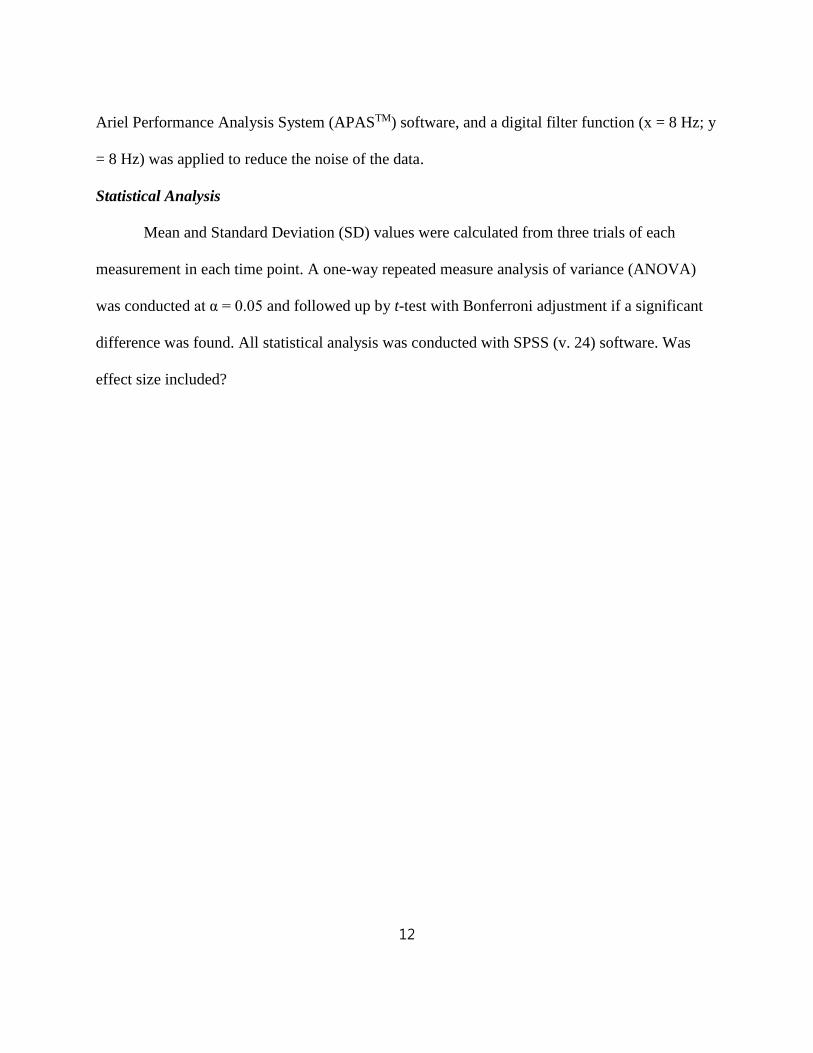
Ariel Performance Analysis System (APASTM) software, and a digital filter function (x = 8 Hz; y
= 8 Hz) was applied to reduce the noise of the data.
Statistical Analysis
Mean and Standard Deviation (SD) values were calculated from three trials of each
measurement in each time point. A one-way repeated measure analysis of variance (ANOVA)
was conducted at α = 0.05 and followed up by t-test with Bonferroni adjustment if a significant
difference was found. All statistical analysis was conducted with SPSS (v. 24) software. Was
effect size included?

13
RESULTS
A one-way repeated measure analysis of variance (ANOVA) was conducted at α = 0.05
for the heading ball velocity and acceleration at the time of ball contact. Using the Huynh-Feldt
correction in the repeated measure ANOVA design, no statistically significant differences were
found in the time effects for the ball velocity and acceleration. Table 1 and 2 show the changes in
heading ball velocity and acceleration at the time of ball contact, as well as p values compared
with the baseline.
Table 1. Comparison of heading ball velocity at the time of ball contact between baseline and
each set of fatigue protocol.
Ball velocity (m/s) Mean (SD)
Baseline Set-1 Set-2 Set-3 Set-4 Set-5
1.29
(0.25)
1.26
(0.18)
1.22
(0.28)
1.41
(0.29)
1.23
(0.20)
1.41
(0.23)
p 1.00 1.00 1.00 1.00 1.00
Table 2. Comparison of heading ball acceleration at the time of ball contact between baseline
and each set of fatigue protocol.
Ball acceleration (m/s2) Mean (SD)
Baseline Set-1 Set-2 Set-3 Set-4 Set-5
20.00
(3.93)
20.40
(3.86)
20.96
(4.63)
22.83
(5.71)
21.50
(5.52)
21.72
(5.63)
p 1.00 1.00 1.00 1.00 1.00
A one-way repeated measure analysis of variance (ANOVA) was conducted at α = 0.05
for the joint angle, velocity, and acceleration of cervical spine and hip at the time of ball contact.

14
Using the Huynh-Feldt correction in the repeated measure ANOVA design, no statistical
significant differences were found in the time effects for the joint angle, velocity, and
acceleration of cervical spine and hip. Table 3,4,5,6,7, and, 8 show the angular displacement,
velocity, and acceleration of cervical spine and hip joint at the time of ball contact and p values
compared with the baseline respectively.
Table 3. Comparison of angular displacement of cervical spine at the time of ball contact
between baseline and each set of fatigue protocol.
Displacement of cervical spine (°) Mean (SD)
Baseline Set-1 Set-2 Set-3 Set-4 Set-5
161.20
(12.29)
164.04
(12.42)
164.91
(15.22)
162.43
(14.56)
150.29
(27.54)
162.92
(11.39)
p 1.00 1.00 1.00 1.00 1.00
Table 4. Comparison of angular displacement of hip joint at the time of ball contact between
baseline and each set of fatigue protocol.
Displacement of hip joint (°) Mean (SD)
Baseline Set-1 Set-2 Set-3 Set-4 Set-5
167.76
(9.12)
162.86
(11.28)
163.48
(13.08)
163.61
(8.25)
164.34
(10.05)
165.05
(8.61)
p 1.00 1.00 1.00 1.00 1.00

15
Table 5. Comparison of angular velocity of cervical spine at the time of ball contact between
baseline and each set of fatigue protocol.
Cervical spine velocity (°/s) Mean (SD)
Baseline Set-1 Set-2 Set-3 Set-4 Set-5
58.72
(70.00)
-5.18
(126.61)
-43.19
(104.04)
71.93
(67.24)
27.99
(95.89)
-5.19
(72.85)
p 1.00 0.08 1.00 1.00 1.00
Table 6. Comparison of angular velocity of hip joint at the time of ball contact between
baseline and each set of fatigue protocol.
Hip joint velocity (°/s) Mean (SD)
Baseline Set-1 Set-2 Set-3 Set-4 Set-5
-59.22
(110.11)
-55.34
(117.01)
-140.54
(114.68)
-92.72
(135.44)
-91.55
(140.16)
-120.75
(117.25)
p 1.00 0.16 1.00 1.00 1.00
Table 7. Comparison of angular acceleration of cervical spine at the time of ball contact
between baseline and each set of fatigue protocol.
Cervical spine acceleration (°/s2) Mean (SD)
Baseline Set-1 Set-2 Set-3 Set-4 Set-5
-267.10
(1059.19)
2311.33
(2545.99)
827.32
(3127.18)
1051.70
(3329.65)
2468.91
(2258.71)
800.60
(4261.01)
p 0.92 1.00 1.00 1.00 1.00

16
Table 8. Comparison of angular acceleration of hip joint at the time of ball contact between
baseline and each set of fatigue protocol.
Hip joint acceleration (°/s2) Mean (SD)
Baseline Set-1 Set-2 Set-3 Set-4 Set-5
196.71
(457.44)
346.02
(649.93)
409.71
(312.57)
69.08
(591.60)
266.02
(280.12)
277.21
(213.72)
p 1.00 1.00 1.00 1.00 1.00

17
DISCUSSION
This study was conducted to investigate the effects of fatigue on the biomechanics of
heading performance in soccer. The biomechanics of cervical spine, hip joint, heading ball
velocity and acceleration were calculated. Both cervical spine and hip joint angles were analyzed
at the time of ball contact. In order to examine the effects of fatigue on the heading performance,
participants were asked to complete five sets of fatigue protocol in 90 seconds. The present study
applied the soccer fatigue protocol, which has been formerly validated and used to induce fatigue
conditions.48 The results reported by researcher showed that no significant differences were
observed in heading ball velocity and acceleration, cervical spine joint angle, velocity, and
acceleration, hip joint angle, velocity, and acceleration at the time of ball contact between the
baseline and five sets of fatigue protocol.
With regard to ball velocity, it is typically assumed that velocity decreases when
participants are fatigued and previous studies supported this idea.50, 52 However, additional
research has shown that changes in ball velocity under the condition of fatigue by extended
performance may vary by individual; however, heading ball velocity and acceleration may not be
an appropriate way for assessing fatigue.51 This indirect comparison may suggest that the effects
of fatigue protocol are equivalent to the previous method and this study. According to the earlier
reports, effects of fatigue on performance accuracies in various sports such as throwing in team
handball, water polo, and kicking in soccer are controversial.52-54 Nuno reported that the
condition of fatigue decreased throwing accuracy in team handball, but no changes in soccer and
water polo under the condition of fatigue.52-54 Despite this controversial, other studies also
conducted with tennis players and soccer players had established that accuracy is affected when

18
athletes were fatigued.55-57 Thus, the accuracy of heading performance also can be affected by
fatigue generated in this soccer fatigue protocol and future study may be examined at this
variable.
Although this study showed no significant difference in cervical spine and hip joint angle
biomechanics at the time of ball contact, lower extremity landing strategies and the ability to
attenuate impact during landing or the muscle required for the pretension might be changed after
fatigue similar to other studies.49, 58 Moreover, since heading performance in soccer is a difficult
skill, which is more complicated by performing the task during other performance (e.g., walking,
standing, jumping, running forward or backward, diving, or being challenged by an opponent),
measuring only two joints’ movement may not be sufficient to fully demonstrate or reveal ? the
effects of fatigue on heading performance.59 this study did not place markers on the lower
extremities to test this hypothesis. This study was suggested that multi-joint coordination and
activity of the muscle groups should be investigated in more detail in future research. Future
studies are warranted to examine the biomechanics of lower extremities and ground reaction
during heading performance in soccer.
According to previous literature, the condition of fatigue decreased ball velocity in soccer
kicking or angular velocity of the lower leg and lower leg swing speed at the time of kicking.48, 60
in studies as mentioned earlier applied exercise protocols that induced fatigue to the only
localized joint and found the differences in the same joints that selected. However, it is essential
to highlight the fact that this specifically designed fatigue protocol also mainly included the
movements related to lower extremities such as sprint, jog, and jump even though the dependent
variables were related to cervical spine and hip joint biomechanics. For these reasons, there were

19
no differences in cervical spine and hip joint angle, velocities, and accelerations even if this
soccer protocol induced fatigue to the participants.
The total amount of time for exercise has been associated with increased risk of injury.
Previous studies investigated the effects of 90 minutes’ fatigue protocol on lower extremities’
kinematics and muscle strength.8, 61 Small indicated that 90 minutes of fatigue protocol made the
correlation between increased sprint time and reduced stride length, and Greig found the
eccentric strength in hamstrings decreased as a function of time and after the halftime interval.8,
61 Since the participants in this study accomplished the fatigue protocol in 90 seconds, most
participants used a significant amount of anaerobic component rather than used all three different
systems (ATP-PC, Glycolysis, and Oxidation) efficiently during this protocol. The previous
study by Ortiz also reported that the condition of fatigue developed by the 30 seconds of Wingate
anaerobic test did not affect dynamic knee joint stability and neuromuscular activation in
recreational population.62 Although the researcher in the previous study that applied similar
protocol indicated that participants reached the level of fatigue according to the soccer fatigue
protocol, the rapid recovery and time for collecting data between each set of the protocol may
have played a factor prohibiting differences between each set.48 In addition, as long-lasting but
low-intensity fatigue protocols have shown that in more significant and more persistent
reductions in quadriceps muscle force-generating capacity than the shorter bout of exercise with
external resistance, the results could be varied if this study’s protocol was more focused on
simulating real soccer game time than exercise intensity.63
This study has several limitations that should be considered. One of the limitations of
this study was the lack of available tools that are commonly used for the assessment of fatigued

20
condition during physical exercises such as blood lactate level, heart rate level in relation to
physiological symptoms, or the Borg scale Rating of Perceived Exertion (RPE) for subjective
symptoms. Although measuring blood lactate level was claimed as to be the most accurate
indicator for measuring and monitoring fatigue, this study followed a similar approach that was
presented by Ferraz induced condition of fatigue with five sets of 90 second protocol.64, 65 The
rationale was to maximize the ecological validity in this research study; hence, this study used a
fatigue soccer course protocol with less equipment on the field, not in the laboratory settings, to
mimic the game situation on the field which coaches or practitioners do not measure blood
lactate level during practices or games at the sideline. In addition, from the short communication
with the participants after five sets of fatigue protocol, it revealed that participants did experience
fatigue at the last set of protocol and could no longer sprint or jump as hard as they would be
able to after they had completed the fatigue protocol. Furthermore, condition of fatigue cannot be
evaluated in a single process. Multiple process of evaluating fatigue can be determined as a result
of complicated interactions of various components within both peripheral nervous system (e.g.,
musculoskeletal fatigue) and the central nervous system (e.g., central fatigue).66 Because of the
complication of these systems, the effects of fatigue can be affected by the participants’
psychological, physical, physiological and mental characteristics.67 Each participant may
demonstrate different reactions as a response to the same fatigue protocol. Therefore, using this
fatigue protocol with an objective tool or method for assessing fatigue may resolve this
individual issue and help achieve participants’ intended exhaustion in a future study. Another
limitation of this study is that the participants were recreationally active collegiate male students,
so the results may be different if a research study was conducted on different levels of soccer

21
players or different gender participants. In future studies, different levels of soccer player or
different genders of population should be recruited when examining the effects of fatigue on
biomechanics of heading performance in soccer.

22
CONCLUSION
This study was carried out to observe the effects of fatigue in ball velocity and
acceleration, cervical spine and hip joint angle, velocity, and acceleration in six recreationally
active collegiate male students. The results are summarized as follows.
Heading ball velocity and acceleration at the time of ball contact were not changed by
five sets of 90-second fatigue protocol soccer course to induce fatigue. In addition, cervical spine
joint and hip joint angle, velocity, and acceleration at the time of ball contact were not changed
by five sets of 90-second fatigue protocol soccer course to induce fatigue.
The results of this study were suggested that (1) ball velocity and acceleration may not be
used exclusively as the signs of fatigue even if athletes have condition of fatigue during the
practice or game, (2) cervical spine and hip joint angle, velocity, and acceleration may not be the
only indicators for fatigue even if athletes have condition of fatigue during the practice and
game, (3) if research or training personnel adopts this protocol to study changes in ball velocity
and acceleration and cervical spine and hip joint angles, velocities, and accelerations. It is
important to recognize that recreationally active male individuals may require completing more
than five sets of 90-second fatigue protocol soccer course to fully induce fatigue.

23
REFERENCES
1. Bangsbo J, Mohr M, Krustrup P. Physical and metabolic demands of training and match-play
in the elite football player. J Sports Sci. 2006;24(07):665-674.
2. Iaia FM, Ermanno R, Bangsbo J. High-intensity training in football. Int J Sports Physiol
Perform. 2009;4(3):291-306.
3. Mohr M, Krustrup P, Bangsbo J. Match performance of high-standard soccer players with
special reference to development of fatigue. J Sports Sci. 2003;21(7):519 -528.
4. Marar M, McIlvain NM, Fields SK, Comstock RD. Epidemiology of concussions among
United States high school athletes in 20 sports. Am J Sports Med. 2012;40(4):747-755.
5. Mohr M, Krustrup P, Bangsbo J. Fatigue in soccer: a brief review. J Sports Sci.
2005;23(6):593-599.
6. Gerlach KE, White SC, Burton HW, Dorn JM, Leddy JJ, Horvath PJ. Kinetic changes with
fatigue and relationship to injury in female runners. Med Sci Sports Exerc.
2005;37(4):657-663.
7. Small K, McNaughton LR, Greig M, Lohkamp M, Lovell R. Soccer fatigue, sprinting and
hamstring injury risk. Int J Sports Med. 2009;30(8):573.
8. Beijsterveldt AMC, Port IGL, Vereijken AJ, Backx FJG. Risk factors for hamstring injuries
in male soccer players: a systematic review of prospective studies. Scand J Med Sci
Sports 2013;23(3):253-262.
24
9. Santamaria LJ, Webster KE. The effect of fatigue on lower-limb biomechanics during single-
limb landings: a systematic review. J Orthop Sports Phys Ther. 2010;40(8):464-473.
10. Guskiewicz KM, Bruce SL, Cantu RC, Ferrara MS, Kelly JP, McCrea M, McLeod TCV.
National Athletic Trainers' Association position statement: management of sport-related
concussion. J Athl Train. 2004;39(3):280.
11. Kunz M. Big Count. FIFA Magazine. Retrieved March 11, 2014.
12. Fahmy M. Increase participation and competitions. In 5th FIFA women’s football
symposium, Frankfurt. 2011.
13. National Federation of State High School Associations. (2007) Retrieved June 23, 2009.
14. Centers for Disease Control and Prevention. Sports-related injuries among high
school athletes--United States, 2005-06 school year. MMWR: Morbidity and mortality
weekly report. 2006;55(38):1037-1040.
15. Di Salvo V, Baron R, Tschan H, Montero FC, Bachl N, Pigozzi F. Performance
characteristics according to playing position in elite soccer. Int J Sports Med.
2007;28(03):222-227.
16. Reilly T, Bangsbo J, Franks A. Anthropometric and physiological redisposition for elite
soccer. J Sports Sci. 2000;18(9):669-683.
17. Reilly T, Gilbourne D.Science and football: a review of applied research in the football
codes. J Sports Sci. 2003;21(9):693-705.

25
18. Drust B, Atkinson G, Reilly T. Future perspectives in the evaluation of the physiological
demands of soccer. Sports Med. 2007;37(9):783-805.
19. Rienzi E, Drust B, Reilly T, Carter JEXL, Martin A. Investigation of anthropometric and
work-rate profiles of elite South American international soccer layers. J Sports Med
Phys Fitness. 2000;40(2):162.
20. Castellano J, Blanco-Villaseñor A, Alvarez D.Contextual variables and time- motion analysis
in soccer. Int J Sports Med. 2011;32(06):415-421.
21. Bradley PS, Sheldon W, Wooster B, Olsen P, Boanas P, Krustrup P. High- intensity running
in English FA Premier League soccer matches. J Sports Sci. 2009;27(2): 159-168
22. Bradley PS, Carling C, Archer D, Roberts J, Dodds A, Di Mascio M, Krustrup P. The effect
of playing formation on high-intensity running and technical profiles in English FA
Premier League soccer matches. J Sports Sci. 2009;29(8):821- 830.
23. Carling C. Analysis of physical activity profiles when running with the ball in a
professional soccer team. J Sports Sci. 2010;28(3):319-326.
24. Vigne G, Gaudino C, Rogowski I, Alloatti G, Hautier C.Activity profile in elite Italian soccer
team. Int J Sports Med. 2010;31(05):304-310.
25. Dellal A, Lago-Penas C, Wong DP, Chamari K. Effect of the number of ball contacts within
bouts of 4 vs. 4 small-sided soccer games. Int J Sports Physiol Perform. 2011;6(3):322-
333.

26
26. Withers RT, Maricic ZW, Wasilewski S, Kelly L. Match analysis of Australian professional
soccer players. J Hum Movement Stud. 1982;8(4):159-176.
27. Weiss KJ. The effect of fatigue on lower extremity mechanics during the unanticipated
cutting maneuver. 2013.
28. Weakness and Fatigue. No Title [Online]. WebMD, https://www.webmd.com/a-to-z-
guides/tc/weakness-and-fatigue-topic-overview#1 [Oct. 2017]
29. Abbiss CR, Laursen PB. Models to explain fatigue during prolonged endurance cycling.
Sports Med. 2005;35(10):865-898.
30. Millet G, Lepers R, Lattier G, Martin V, Babault N, Maffiuletti N. Influence of ultra-long-
term fatigue on the oxygen cost of two types of locomotion. Eur J Appl Physiol.
2000;83(4);376-380.
31. Millet GY, Lepers R, Maffiuletti NA, Babault N, Martin V, Lattier G. Alterations of
neuromuscular function after an ultramarathon. J Appl Physiol. 2002;92(2):486-492
32. Millet GY, Millet GP, Lattier G, Maffiuletti NA, Candau R. Alteration of neuromuscular
function after a prolonged road cycling race. Int J Sports Med. 2003;24(03):190-194.
33. Hawkins RD, Hulse MA, Wilkinson C, Hodson A, Gibson M. The association football
medical research programme: an audit of injuries in professional football. Brit J Sport
Med. 2001;35(1):43-47.

27
34. Li GY, Wang AH. Survey on the current status of sports injury of basketball athletes in
Shangdong Province. Chin J Clin rehab. 2006;10:69-71
35. Smith AM, Stuart MJ, Wiese-Bjornstal DM, Gunnon, C. Predictors of injury in ice hockey
players: a multivariate, multidisciplinary approach. Am J Sports Med. 1997;25(4):500-
507.
36. Wu TCT. Poster: The Effects of Fatigue in Backward Skating in Ice Hockey.2016.
37. Asplund C. The Effects of Exhaustive Exercise on ACL Injury Risk (Doctoral
dissertation). 2016.
38. Kirst MA. Effects of tool weight on fatigue and performance during short cycle overhead
work operations. Chicago.1999.
39. Ortiz A, Olson SL, Etnyre B, Trudelle-Jackson EE, Bartlett W, Venegas-Rios HL. Fatigue
ffects on knee joint stability during two jump tasks in women. J Strength Cond Res.
2010;24(4):1019.
40. Quammen D, Cortes N, Van Lunen BL, Lucci S, Ringleb SI, Onate J. Two different fatigue
protocols and lower extremity motion patterns during a stop-jump task. J Athl Train.
2012;47(1):32-41.
41. Schmitz RJ, Cone JC, Copple TJ, Henson RA, Shultz SJ. Lower-extremity biomechanics and
maintenance of vertical-jump height during prolonged intermittent exercise. J Sport
Rehabil. 2014;23(4):319-329.

28
42. Mehnert MJ, Agesen T, Malanga GA. " Heading" and Neck Injuries in Soccer: A Review of
Biomechanics and Potential Long-term Effects. Pain Physician. 2005;8(4):391.
43. Schneider K, Zernicke RF. Computer simulation of head impact: estimation of head-injury
risk during soccer heading. Int J Sport Biomech.1988;4(4):358- 371.
44. Tysvaer AT. Head and neck injuries in soccer. Sports Med. 1992;14(3):200-213.
45. Barth JT, Freeman JR, Broshek DK, Varney RN. Acceleration- deceleration sport-related
concussion: the gravity of it all. J Athl Train. 2001;36(3):253.
46. Guskiewicz KM. Assessment of postural stability following sport-related concussion.
Curr Sports Med Rep. 2003;2(1):24-30.
47. Serresse O, Lortie G, Bouchard C. Estimation of the Contribution of the Various Energy
Systems During. Int. J. Sports Med, 1988;9:456-460.
48. Ferraz R, Van Den Tillaar R, Marques MC. The effect of fatigue on kicking velocity in
soccer players. J Hum Kinet. 2012;35(1):97-107.
49. Becker S, Fröhlich M, Kelm J, Ludwig O. Change of muscle activity as well as kinematic
nd kinetic parameters during headers after core muscle fatigue. Sports. 2017;5(1):10.
50. Escamilla RF, Barrentine SW, Fleisig GS, Zheng N, Takada Y, Kingsley D, Andrews JR.
Pitching biomechanics as a pitcher approaches muscular fatigue during a simulated
baseball game. Am J Sports Med.2007;35(1):23-33.

29
51. Hirayama D, Fujii N, Koike S, Michiyoshi AE. Simple linear regression analysis of the
relationship of the number of pitches to the kinematic changes of pitching. J Biomech.
2007;40:S610.
52. Nuño A, Chirosa IJ, van den Tillaar R, Guisado R, Martín I, Martinez I, Chirosa LJ. Effects
of fatigue on throwing performance in experienced team handball players. J Hum Kinet.
2016;54(1):103-113.
53. Ferraz R, van den Tillar R, Marques MC. The influence of different exercise intensities on
kicking accuracy and velocity in soccer players. J Sport Health Sci. 2015.
54. Stevens HB, Brown LE, Coburn JW, Spiering BA. Effect of swim sprints on throwing
accuracy and velocity in female collegiate water polo players. J Strength Cond Res.
2010;24(5):1195-1198.
55. Davey PR, Thorpe RD, Williams C. Fatigue decreases skilled tennis performance. J Sports
Sci. 2002;20(4):311-318.
56. Coutts AJ, Rampinini E, Marcora SM, Castagna C, Impellizzeri FM. Heart rate and blood
lactate correlates of perceived exertion during small-sided soccer games. J Sci Med
Sport. 2009;12(1):79-84.
57. Kelly DM, Drust B. The effect of pitch dimensions on heart rate responses and technical
demands of small-sided soccer games in elite players. J Sci Med Sport. 2009;2(4):475-
479.

30
58. Tamura A, Akasaka K, Otsudo T, Shiozawa J, Toda Y, Yamada K. Fatigue influences lower
extremity angular velocities during a single-leg drop vertical jump. J Phys Ther Sci .
2017;29(3):498-504.
59. Kirkendall DT, Garrett Jr WE. Heading in soccer: integral skill or grounds for cognitive
dysfunction? J Athl Train. 2001;36(3):328.
60. Apriantono T, Nunome H, Ikegami Y, Sano S. The effect of muscle fatigue on instep kicking
kinetics and kinematics in association football. J Sports Sci. 2006;24(9):951-960.
61. Greig M, Siegler JC. Soccer-specific fatigue and eccentric hamstrings muscle strength.
J Athl Train. 2009;44(2):180-184.
62. Ortiz A, Olson SL, Etnyre B, Trudelle-Jackson EE, Bartlett W, Venegas-Rios HL. Fatigue
effects on knee joint stability during two jump tasks in women. J Strength Cond Res.
2010;24(4):1019.
63. Ullrich B, Brüggemann GP. Force-generating capacities and fatigability of the quadriceps
femoris in relation to different exercise modes. J Strength Cond Res. 2008;22(5):1544-
1555.
64. Sinclair WH, Kerr RM, Spinks WL, Leicht AS. Blood lactate, heart rate and rating of
perceived exertion responses of elite surf lifesavers to high-performance competition.
J Sci Med Sport. 2009;12(1):101-106.

31
65. Boulay, M. R., Simoneau, J. A., Lortie, G. I. L. L. E. S., & Bouchard, C. (1997). Monitoring
high-intensity endurance exercise with heart rate and thresholds. Med Sci Sport Exer.
29(1), 125-132.
66. McKenna MJ, Mechanisms of Muscle Fatigue. In Physiological bases of sport performance.
Eds: Hargreaves, M. And Hawley, J. McGraw-Hill, New South Wales, 2003.
67. Asmussen E. Muscle fatigue. Med Sci Sports. 1979;11:313-321.