the effects of inflation - federal reserve bank of st. louis · the effects of inflation ......
TRANSCRIPT

The Effects of Inflation (1960-68)by ALBERT E. BURGER
THE MAJOR GOALS of economic stabilizationpolicy are a full-employment level of real outputand a stable price level. Over the first five years ofthe current economic expansion which began in early1981., the goal of full employment dominated discus-sions of policy. In January 1966 the interim targetgoal of 4 per cent unemployment uvas reached.Since early 1966 most studies of unemployment havebeen concerned with unemployment by specificclasses or groups rather than total unemployment.At an aggregate level, the problems of achieving astable price level have increasingly dominated theattention of the policymakers and the public.
The objective of a full-employment level of realoutput is a desirable goal of economic stabilizationpolicy. If the economy is operating at less than itspotential level of real output there is waste, not onlyfrom the standpoint of individuals who are un-employed, but from an aggregate viewpoint. Thereis less real output being produced than the economycould produce, given its endowment of factors ofproduction, the degree of skill and training of thelabor force, and the available technology. By mov-ing from a position of underemployment to one ofmaximum utilization of resources, a larger flow of realgoods may be made available for all members of theeconomy.
Most people can see the inherent dangers of so-called hyperinflation. Gennany in the post-WorldWar I period, when prices rose by a factor of 100billion in one year, the Eastern European countriesof Poland and Hungary in the 1921-23 period, andChina in the post World War II period, stand out asvery clear examples of the severe political as well aseconomic consequences of hyperinflation.
However, to the individual, effects of inflation areless immediately clear when the rate of change ofprices increases from 1.3 per cent to 5 per cent overa period of four years, as was experienced in theUnited States during 1964-68. Indeed, sometimes thereis even confusion as to just what the term inflationmeans. A careful distinction must be made between
changes in relative prices of assets and changes in thesame direction of prices of all assets except money.1
Changes in relative prices play an important role ina dynamic growing economy. In a market-directedeconomy such as ours, changes in relative prices ofgoods and services and classes of factors of productionare the mechanism by which resources are directed toproduce the real goods and services that maximizethe satisfaction of individuals in the economy.
Individuals purchase real goods and services be-cause the consumption of these items yields satisfac-tion (or as economists would say, utility) to the in-dividual purchaser. Exactly defined, inflation refersto a situation where an individual can no longer pur-chase as large an amount of utility for a given moneyoutlay. Because a satisfactory means has not been de-veloped to quantify the utility that individuals receivefrom consuming goods and services, a less exactdefinition of inflation must be used.
The term inflation is applied operationally to asituation where the exchange value of the mediumof exchange (money), in terms of real goods andservices, is decreasing. We attempt to measurewhether the general level of prices has increased, orwhether there has only been a change in relativeprices, by the use of a price index. Changes in theprice index reflect changes in the total cost of a rep-resentative market basket of goods. For example, ifa price index rises from 100 to 105 over a periodof time, we say that the exchange value of moneyin terms of this representative market basket of goodsis 4.8 per cent less.
The purpose of this article is to examine the effectsof inflation on individuals in their separate roles asincome earners and holders of financial and real as-
tAn individual’s holdings of assets, the current dollar valueof which measures his nonhuman wealth, may be dividedinto two broad classes real assets and financial assets, Realassets are items which yield a direct flow of consumption orproduction services to the asset holder. Financial assets areitems that represent a claim on real assets or other financialassets.
Page 25
FEDERAL RESERVE BANK OF ST. LOUIS
sets. The analysis is limited to the eight-year period1960 through 1968. No attempt is made to discusslong-run trends. For comparison purposes, the periodfrom 1960-68 is divided into two four-year periods:1960-64 when overall prices remained relatively sta-ble, and 1964-68 when the rate of increase of pricesaccelerated.
The analysis is limited to the effects of inflation onindividuals in their separate roles on the average.Any one individual is not exclusively an incomeearner, not Inst a homeowner, nor just a holder offinancial assets. Quite likely, he is all three. We canjudge whether a particular individual “benefited” or“lost” in a given period of time only by examining histotal balance sheet. During the latter comparisionperiod some individuals experienced greater increasesin real income flows and in the real value of the stockof assets they held than during the 1960-64 period.Others fared worse with respect to these items thanduring the earlier comparison period.2
An Overall Look at the Period1960 Through 1968
At the aggregate level, both of the comparison pe-riods show remarkable economic expansion. Over thefirst four-year period, real GNP increased by ~93.4billion, a 19 per cent increase. During the next fouryears, real GNP grew by an additional $126.5 billion,up 22 percent.3 Per capita real GNP also rose mark-edly, by 12 per cent from 1960 through 1964, andthen by 16 per cent from 1964-68.
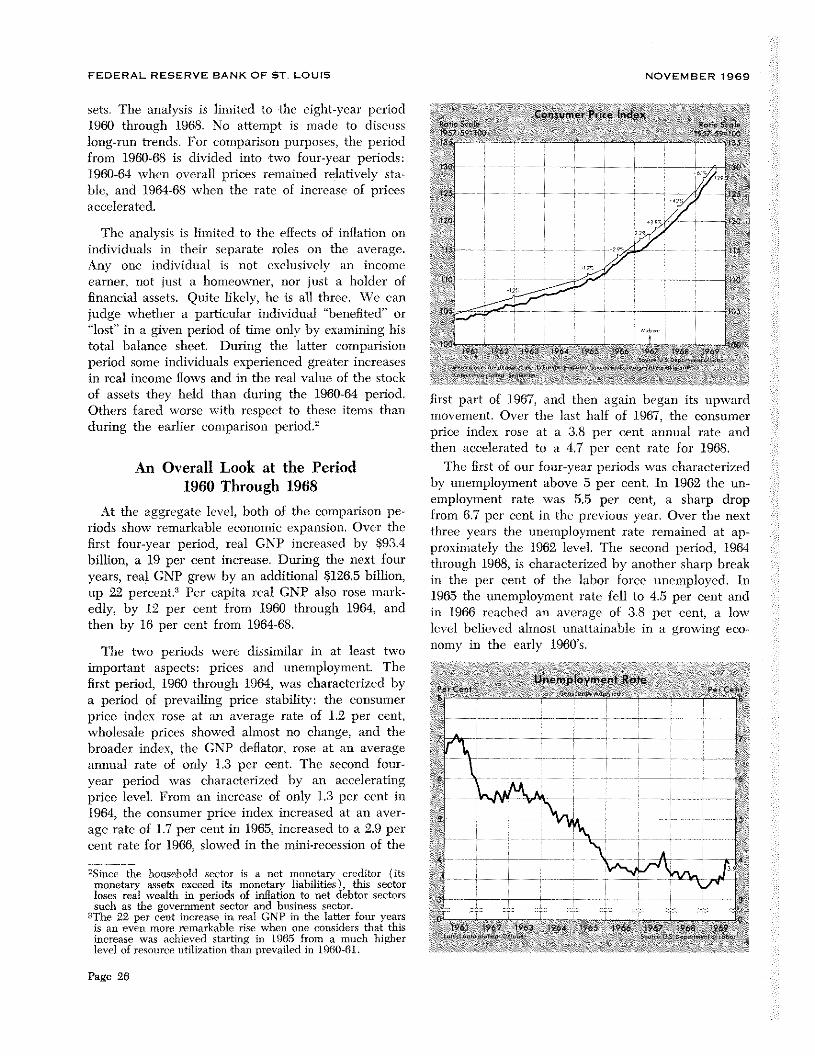
The two periods were dissimilar in at least twoimportant aspects: prices and unemployment. Thefirst period, 1960 through 1964, was characterized bya period of prevailing price stability: the consumerprice index rose at an average rate of 1.2 per cent,wholesale prices showed almost no change, and thebroader index, the GNP deflator, rose at an averageannual rate of only 1.3 per cent. The second four-year period was characterized by an acceleratingprice level. From an increase of only 1.3 per cent in1964, the consumer price index increased at an aver-age rate of 1.7 per cent in 1965, increased to a 2.9 percent rate for 1966, slowed in the mini-recession of the
2Since the household sector is a net monetary creditor (itsmonetary assets exceed its monetary liabilities), this sectorloses real wealth in periods of inflation to net debtor sectorssuch as the government sector and business sector.3The 22 per cent increase in real GNP in the later four yearsis an even more remarkable rise when one considers that thisincrease was achieved starting in 1965 from a much higherlevel of resource utilization than prevailed in 1960-61.
NOVEMBER 1969
first part of 1967, and then again began its upwardmovement. Over the last half of 1967, the consumerprice index rose at a 3.8 per cent annual rate andthen accelerated to a 4.7 per cent rate for 1968.
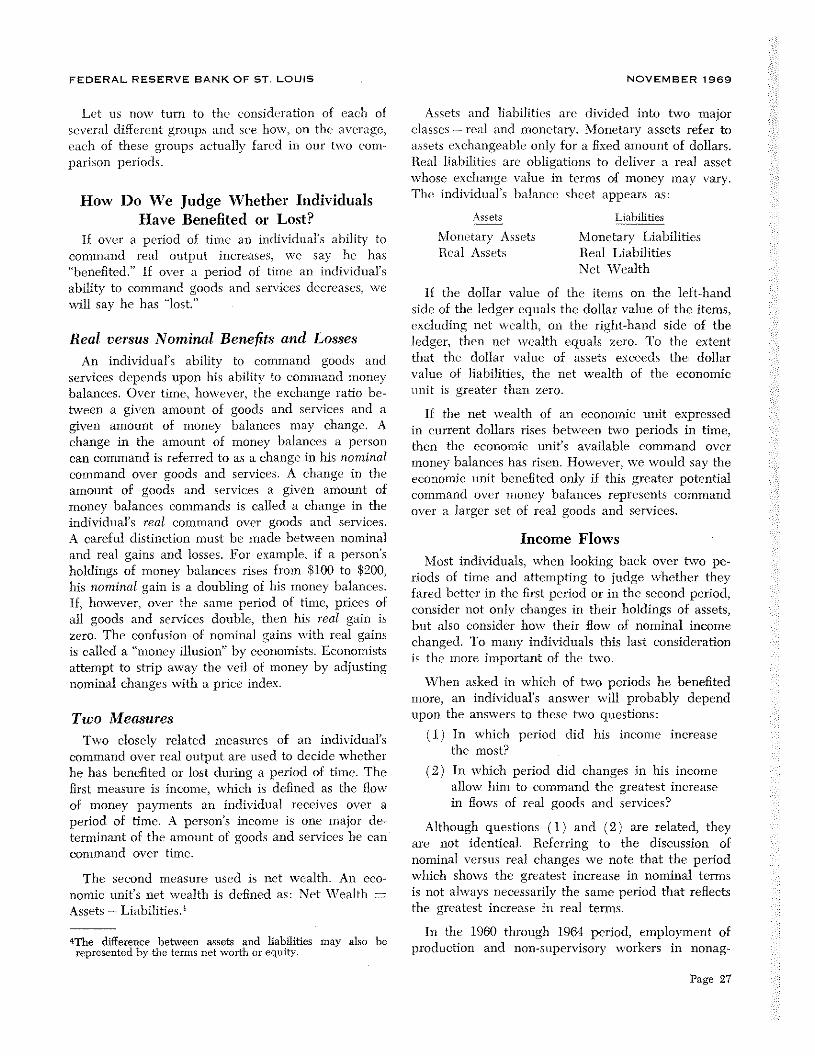
The first of our four-year periods was characterizedby unemployment above 5 per cent. In 1962 the un-employment rate was 5.5 per cent, a sharp dropfrom 6.7 per cent in the previous year. Over the nextthree years the unemployment rate remained at ap-proximately the 1962 level. The second period, 1964through 1968, is characterized by another sharp breakin the per cent of the labor force unemployed. In1965 the unemployment rate fell to 4.5 per cent andin 1966 reached an average of 3.8 per cent, a lowlevel believed almost unattainable in a growing eco-nomy in the early 1960’s.
- Unemployment RatePer I. el Pc’ r~.t
e ~__ ~___~ ~. :.“~~\ v•~..,
~~\\
:~t~
ii
1,
/~\\~ ~ ~. ~. /
Page 26
FEDERAL RESERVE BANK OF ST. LOUIS NOVEMBER 1969
Let us now turn to the consideration of each ofseveral different groups and see how, on the average,each of these groups actually fared in our two com-parison periods.
How Do We Judge Whether IndividualsHave Benefited or Lost?
If over a period of time an individual’s ability tocommand real output increases, we say he has“benefited.” If o\-er a period of time an individual’sability to command goods and services decreases, wewill say he has “lost.”
Real versus Nominal Benefits and Losses
An individual’s ability to command goods andservices depends upon his ability to command moneybalances. Over time, however, the exchange ratio be-tween a given amount of goods and services and agiven amount of money balances may change. Achange in the amount of money balances a personcan command is referred to as a change in his nominal
command over goods and services. A change in theamount of goods and services a given amount ofmoney balances commands is called a change in theindividual’s real command over goods and services.A careful distinction must be made between nominaland real gains and losses. For example, if a person’sholdings of money balances rises from $100 to $200,his nominal gain is a doubling of his money balances.If, however, over the same period of time, prices ofall goods and services double, then his real gain iszero. The confusion of nominal gains with real gainsis called a “money illusion” by economists. Economistsattempt to strip away the veil of money by adjustingnominal changes with a price index.
Two MeasuresTwo closely related measures of an individual’s
command over real output are used to decide whetherhe has benefited or lost during a period of time. Thefirst measure is income, which is defined as the flowof money payments an individual receives over aperiod of time. A person’s income is one major de-tenninant of the amount of goods and services he cancommand over time.
The second measure used is net wealth. An eco-nomic unit’s net wealth is defined as: N:et Wealth =
Assets — Liabilities.4
~The difference between assets and liabilities may also berepresented by time terms net worth or equity.
Assets and liabilities are divided into two majorclasses — real and monetary. Monetary assets refer toassets exchangeable only for a fixed amount of dollars.Real liabilities are obligations to deliver a real assetwhose exchange value in terms of money may vary.The individual’s balance sheet appears as:
Liabilities
Monetary LiabilitiesReal Liabilities
Net Wealth
If the dollar value of the items on the left-handside of the ledger equals the dollar value of the items,excluding net wealth, on the right-hand side of theledger, then net wealth equals zero. To the extentthat the dollar value of assets exceeds the dollarvalue of liabilities, the net wealth of the economicunit is greater than zero.
If the net wealth of an economic unit expressedin current dollars rises between two periods in time,then the economic unit’s available command overmoney balances has risen. However, we would say theeconomic unit benefited only if this greater potentialcommand over money balances represents commandover a larger set of real goods and services.
Income Flows
Most individuals, when looking back over two pe-riods of time and attempting to judge whether theyfared better in the first period or in the second period,consider not only changes in their holdings of assets,but also consider how their flow of nominal incomechanged. To many individuals this last considerationis the more important of the two.
When asked in which of two periods he benefitedmore, an individual’s answer will probably dependupon the answers to these two questions:
(1) In which period did his income increasethe most?
(2) In which period did changes in his incomeallow him to command the greatest increasein flows of real goods and services?
Although questions (1) and (2) are related, theyare not identical. Referring to the discussion ofnominal versus real changes we note that the periodwhich shows the greatest increase in nominal termsis not always necessarily the same period that reflectsthe greatest increase in real terms.
In the 1960 through 1964 period, employment ofproduction and non-supervisory workers in nonag-
Assets
Monetary AssetsReal Assets
Page 27
FEDERAL RESERVE BANK OF ST. LOUIS NOVEMBER 1969
4~\~ A To gain some insight into the relative income per-~ * ~ formanee of different categories of workers, let us
p ~ ~, ~ examine selected working groups as presented in data________ ________ of the Bureau of Labor Statistics.
t
:
Skilled Compared to Unskilled WorkersAs illustrated in Table I, both skilled and unskilledworkers experienced a more rapid rise in nominalwages in the most recent period than in the previousfour-year period. However, changes in real wagesshow quite a different picture. Since 1.964, as the rateof increase of prices rose year after year, the per-centage increase in real \vages of both skilled andunskilled workers was only about one-half as largeas in the 1960-64 period of relatively stable prices.Neither skilled nor unskilled workers benefited morein inflation than in the conmparison period of pricestability.
Comparatively unskilled ‘workers benefited least
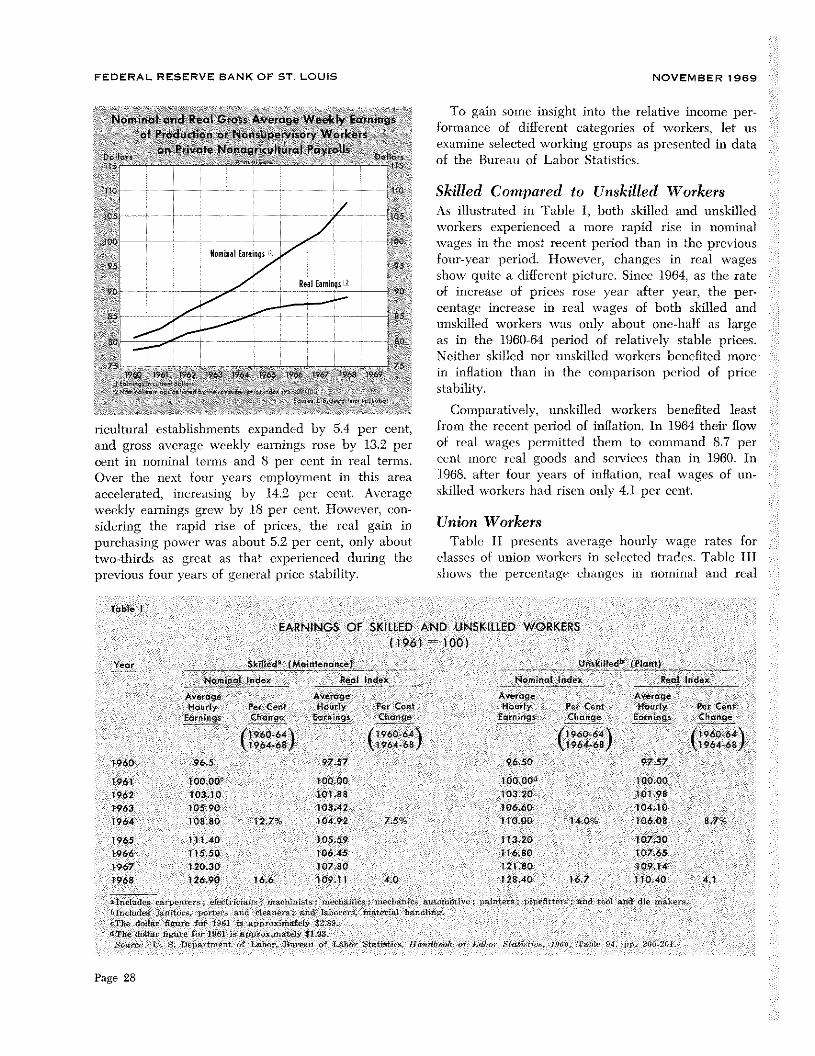
ricultural establishments expanded by 5.4 per cent. fronm the recent period of inflation, In 1964 their flowand gross aveia°c ss ckly earnmgs rose by 13.2 per of real wages p ‘rmitted them to conmmand 8.7 percent in nominal term and 8 per cent in real terms. cent more real goods and servic s than in 1960. InOver the next four years employment in this area 1968 after four years of inflation real wages of un-accelerated increasing by 14.~ per cent. Average skilled worker had risen onl 4.1 per cent.we kly eamnings gr~ by 18 per cent. However con-sid ‘ring the rapid ri c of prices the real gain in Union Workerspurchasing power was about 5.2 per cent only about Table II presents average hourly s~age rates fortwo thirds as great as that exp ‘rienced during the cia e of un~onworkems in selected trades. Table IIIprcviou four years of gencmal price stability, shows the percentag changes in nominal and real
Table I
EARNINGS OF SKILLED AND UNSKILLED WORKERS(1961 1001
Year Skile& (Matntenancsl tin ktltedb (Plant)No,nhsd Index Real Inde Nominal lnde~r Real Index
Average Average Average AveffigeReedy Per C in l’toerly Per Cent Hourly Per Cent Hoorly P r Centarnings Change Eq nrngs cheng Earnings Change Eq nings Change( 196064 196044\ 196064 194064
196468 196468/ 196468 1964481960 965 97.57 9650 9757
1961 10000 100,00 10000 100,001962 103.10 101 88 103.Z0 lOt 981963 105.90 103.42 106.60 104.101964 10820 127% 104.92 755’ 1 0.00 140 10608 87T
1965 111.40 105.59 113.20 107301966 115.50 106,45 114 80 107651967 120.30 107,80 123 80 109,143968 126.90 166 30911 4.0 12840 167 11040 41
tinelde eapo ,elctre,an,,nel,u,sts,nmcbn, a’ a m ,vc,p’nte ppefitr’ao o,Ianddsenmaeblelud anto po dcl ner.andlaborr ~n lhndmn’oTh dollar figure for 196 s gpnro matel 8 89‘tThe doll r figure for 1961 , a prox mat Il $1 9
~au . .Dpartmn ho,Brm,oftabor tat,st Hadboo a C ta . ,mg l’bl p-p. oe 1
z~. 9~4~ mS~ Wa ~t~ \.~\\\\.~..:~m:/\
~\~k\m\ \\/\
~
Page 28
FEDERAL RESERVE BANK OF ST. LOUIS NOVEMBER 1969
Table IIAVERAGE UNION WAG SCALES~ FOR 5ELEaED TRADES
(NOMINAL HOURLY WAGES)
LocalYear Building Printing Local Trucking Transit
Journey Helpers & Book News-man Laborers & Job papers Drivers Helper
1960 $386 $2.88 $308 $348 $2.68 $238 $2.37
1961 4,02 3 06 3 18 3.58 2.78 248 2 461962 415 315 324 366 289 255 2551963 4,31 3.26 3.37 3 75 3112 2 68 2.651964 446 3.40 347 324 3.14 2.79 2.76
1965 4 64 3.54 358 3.94 3.26 2 90 2 883966 483 3.67 369 407 339 300 3.001967 5.69 3.83 321 427 359 321 3221948 543 405 400 447 378 336 344
Tb eel rep them morn e te dud’ Cola Cu acaon point)
$ tlsnertnm ahab Pa uotab fir Ye ho Labar$tat ‘i’abl pflO
wages for each of these classes of umon skorkers in White Collar Workersthe two four-year comparison periods. These tables- . Table IV shows that a broad class of workers inillustrate that many of the unmon groups covered cx- . . - . -
white collar jobs experienced a more rapid rmse inperienced more substantial percentage increases in . -
nornmnai wages in the latter penod than in the 1960-64nominal wages over the 1964-68 pcrmod than dunng
- period. ~‘.evertheless, as was the case with most ofthe 1960-64 penod.
the unmon groups surveyed, white collar workers re-However, looking at changes in real wages in Table ceived a substantially smaller percentage increase
111, it appears that nmost union groups received smaller in real wages in the more recent four-year period.
percentage increases in real wages in the recent pe- In the 1964-68 period real wages of white collarriod of rapidly rising prices than in the 1960-64 workers included in Table IV rose only 3.5 per cent,period. The increases in the paymnents received for less than one.haif the increase in the 1960-64 periodproductive services by union workers in local truck- of widespread price stability.ing, building, and printing trades in the 1964-68 pe-riod represented suhst-antially smaller percentage Professtonal Workersincreases in their conunand over real goods and serv- A third category of workers is labeled professionalices than what they experienced in the previous four- workers. Examining Table V we see that, unlike theyear period. Only local transit workers, of the groups skilled or unskilled categories, or union and whiteconsidered, received the same percentage rise in real collar categories, the selected groups of professionalwages in both periods. workers in Table V received substantially larger in-
Table Ill
CHANGES IN UNION WAGES FOR SELECTED TRADES
8.silding _________ PrintingHelpers and
Journeyman Laborer Book & Jab NewspapersNominal Real Nominal Real Nominal Real Nominal Real
1960-64 1555’ 10.4% 181 ,, 125/o 127/ 75% 103% 5.25’196468 21.75’ 85/ 19.1 6.2% 153% 2.75’ 164/ 3.8/
Local Trucking — Local TransitDr vets Helpers
Nominal Real Nominal Real Nominal Real
196064 17.2% 11.9% 172°! 11.8% 165 110/
1964-68 20.4°/ 7,0% 204% 75~ 24.65’ 11 45’N 1w e. idea lte~lbydefiutig onm’al a iththu onto pric, nd a’ 30 100
Page 29
‘<a
aap
a—
-~
— ~6_
a-.
~2
o-~
-~~
0~
,~--
I-—
p0~
—C
pp
a CMa
-c-
I-—
a=
0~
1 ~a
tCM
~1 CM —V
ta
p ~a-
—a
~1-~
taa
a-°
~CM
0—
aC
~1
~CM
-~
Ca
Vt
a-o
—a
c-t
a-F
——
a-<
a;
oa’
a2-
~a
~~ —
aa
o ~pC
Ma-
a-a
~a
a-
0~
—
P~<
g;.
-i
0~a
a-a
~-~-
~
ao
-~
~2.
—rI-
c—
——
a‘<
CM•
CMa
~+-a
-~
oCM
oa
—~
Crt
Vt
a~
a~a
-c~
a-a o
a-a
E ~—C
M2-~
CM
p~
~B
a—
Ca-a
-~- ~
at,.
.a,
2-a
-c.
,C
Pa
—Q
Q~
CM
~c-
I-I-
~C
M<
0a~
_.
aa-
CM
E
CM
in~
_.a
-
a-
I-I-,—
L aC
aC
M0
a-~
-~B
CM
B
oP
aP
rtCM
C)L
a_
~~
a-a~
CM’<
P0
o~P
CM~
~I-
a2-
:Ca~
c-I-
Ca
-iV
ta-
ao
2.a
CCM
-~
aC
—~
a-H
°°’
a-a
~CM
cnP
Pa
~<-
~~
aa
a—
~CM
~O
CM
-o5fl
~—
——
Et
—a
aa
—~
aP
n—
CMa
—P
--I
~a
BCM
0)
a-CM
a~
~a
a-a-
aC-
-oaa~
. aa
aa
~<
a-a
—-
C;~
I--
I-I0
tap
~—
BEr
aaaaa
ap
a-
aa
——
I-I at
-
~ap
CM :s-2
~a-
I-I
—I~I
-oa
CO ~a
—.
CM a
m a Pt r Pt Ca P1 Pt Ca z 0 ‘1 Ca -1 r 0 C (a
a
CM
Ca
Pf~
—P
-CC
oa
CM
P—
Ic-g
oni
-c-
fll
/7
4I-
*•~
yt-
IU
I
~—
~-—
4-N
~to
1~
CMt9
~°
~
‘—F
—~
~
CM—
,
1~
0’
I-I-
nfl
<0‘c~
0~
_~
“~
-Q 0-0
-0,0
.p
0-0
.0-0
-4
-I-•
-c
<R
I-
:O
N~
fl~
40-;
8’t
~‘°~
‘,~
~‘
F’—
MW
0G
W
7-L
~~
~~
0~a
2co
C*a
b~.
‘
Qa
<0
,—p
-ii
a’m
—~
NN
O~
~0
~
—<
03
—<
03
p00
~%4
•CO
0’~
~-—
g~
4’
MI
Q -It
0~
0-tO
4.
4.
0—
on>
C000N
Q~
.pQ
~0
4C
O~
NO
OW
O~
p~
~a°
~~
-~at
~B
Ct’
IC
t-.,
~<
0—
.,
000 <
0-
I,0
—0
OI00N
N~
r~f
l-C
-’—
a—
fl_
p..
.aW
~(-P
<04—
‘0go
~---
g~-,
0’
-.
Un
fl
-I-
C — tt
z 0 P1 Ca P1 Co 01 CD
FEDERAL RESERVE BANK OF ST. LOUIS NOVEMBER 1969
For an analysis of the effects of inflation on theholders of financial assets we shall distinguish effectson the wealthholder’s nominal wealth from effects onhis real wealth; and the impact of inflation on hisflow of returns in nominal and real terms.
For purpose of analysis seven widely held financialassets were selected:
(1) savings and loan shares(2) mutual savings bank deposits(3) time deposits at commercial banks
(4) corporate bonds(5) U. S. Government bonds(6) municipal bonds
(7) common stock
Several major differences exist between groups ofthese assets. The first three, savings and loan shares,mutual savings bank deposits, and time deposits atcommercial banks, represent legal claims to fixedamounts of money. In most eases, this claim may beexercised on demand by the holder of the claim orafter only a short period of time. The next threeitems, corporate, U.S. Government, and municipalbonds, represent rights to a fixed amount of moneyonly at maturity, usually much longer into the future.From the time they are issued until maturity, theirmagnitude of exchange value in terms of moneydepends upon the valuation which market partici-pants place on the future flow of money paymentsthey offer, Our last financial asset, common stocks,does not represent a claim to any fixed money pay-ment, either currently or in the future,
Table VII
PERCENTAGE INCREASES IN VI LOS ONFIX D DOLLAR VALUE FINANCIAL ASSETS
Norninat Percernage Real PereeMageIn rease lacreese
960 1954 196Cm 964to t~ to to
1964 1968 1964 1968
Soiogsondtaah$bo 80 120’ 3 ‘-02,
8aving~*epa~t*qtMotol$v~ag Btmek 170 185 116 56
I me gad Sov’ttgs Depo aat Contine eat Sank 336 31.2 1 0
U. it 14 n Lee a or gerboeL,U .T
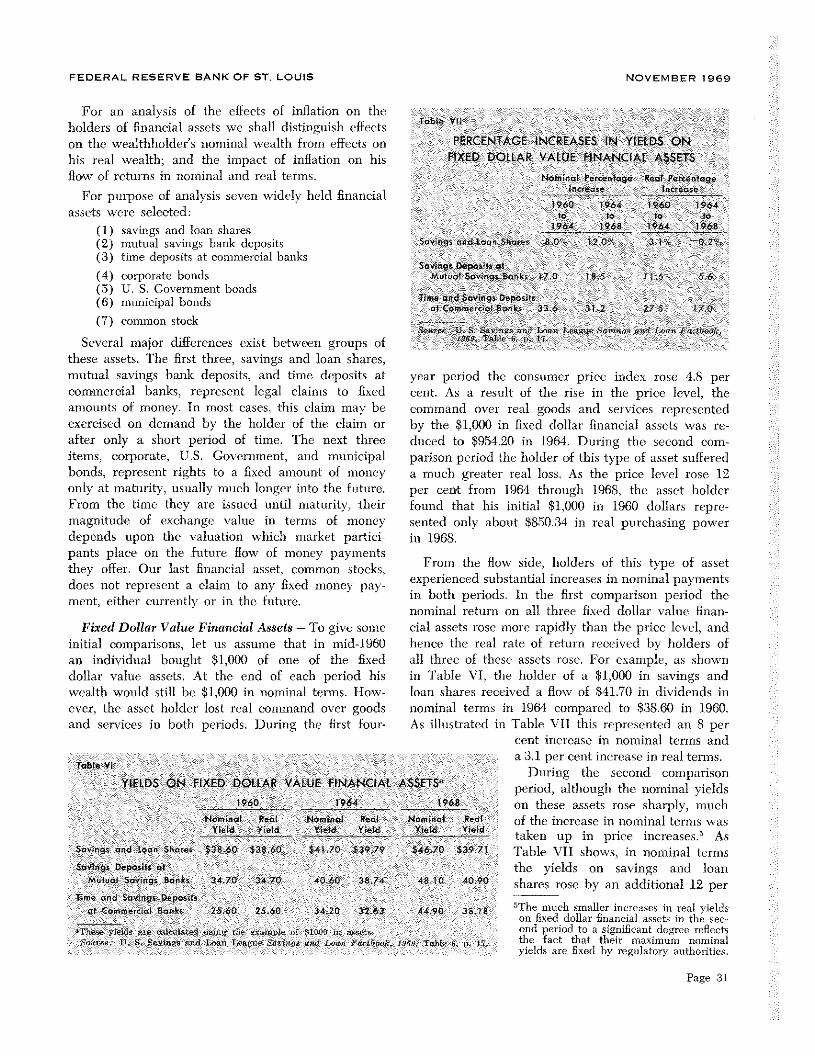
year period the consumer price index ros 4.8 percent. As a result of the rise in the price level, thecommand over real goods and services representedby the $1,000 in fixed dollar financial assets was re-duced to $954.20 in 1964. During the second com-parison period the holder of this type of asset suffereda much greater real loss, As the price level rose 12per cent from 1964 through 1968, the asset holderfound that his initial $1,000 in 1960 dollars repre-sented only about $850.34 in real purchasing powerin 1968.
VII this represented an 8 percent increase in nominal terms anda 3,1 per cent increase in real termns.
During the second comparisonperiod, although the nominal yieldson these assets rose sharply, muchof the increase in nominal terms wastaken up in price increases.5 AsTable VII shows, in nominal termsthe yields on savings and loanshares rose by an additional 12 per
mThe much smaller increases in real yieldson fixed dollar financial assets in the sec-ond period to a significant degree reflectsthe tact that their maximum nominalyields are fixed hy regulatory authorities.
From the flow side, holders of this type of assetexperienced substantial increases in nominal paymentsin both periods. In the first comparison period thenominal return on all three fixed dollar value finan-
Fixed Dollar Value Financial Assets — To give some cial assets rose more rapidly than the price level, andinitial comparisons, let us assume that in mid-1960 hence the real rate of return received by holders ofan individual bought $1,000 of one of the fixed all three of these assets rose. For example, as showndollar value assets. At the end of each period his in Table VI, the holder of a $1,000 in savings andwealth would still be $1,000 in nominal terms. flow- loan shares received a flo\v of $41.70 in dividends inever, the asset holder lost real command over goods nominal terms in 1964 compared to $38.60 in 1960.and services in both periods. During the first four’ As illustrated in Table
Table VI
YIELDS ON FIXED DOLLAR VALUE FINANCIAL ASSETS”1960 1964 1968
Naminal Real Nom’naj Real Naminal RealYield Y,ld Ykid Yield Yield Yield
Sa’vingc and Loan 5nare~ $38.60 538 60 54.130 539 Y9 $46.70 539 71
Savings Deposits atMt.t-jal Savings Banks 34 70 34./0 4060 ‘I. 74 18 10 40.90
I me and Savings Depositsat ca’nmr-rcial Bank 25.60 25.60 34.20 32.63 44 93 38 ‘8
‘,.~ ., ./-ni-, ,. ,.
S Sr_n,.— ,~ - I-an I ‘it-,,’ .‘,i-,.i—s’,- i ‘‘i,’ / i”.i’’~.‘C..”., 1,_ht,- t..
Page 31
FEDERAL RESERVE BANK OF ST. LOUIS NOVEMBER 1969
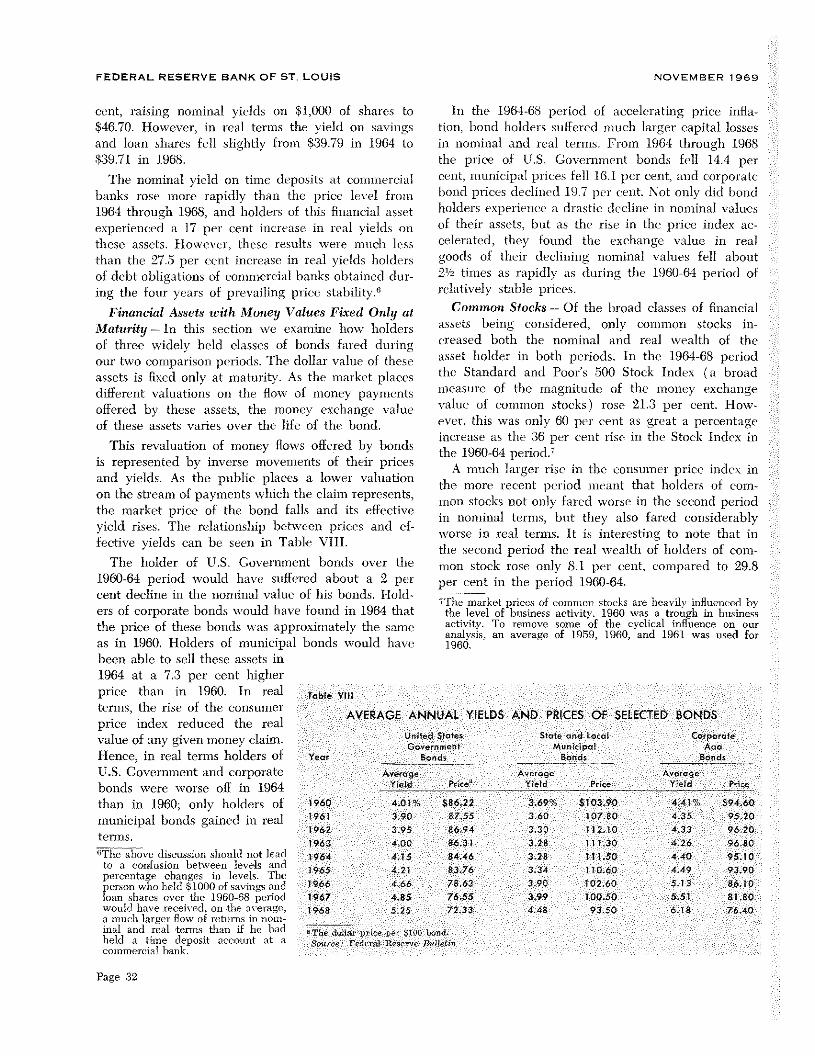
been able to sell these assets in1964 at a 7.3 per cent higherprice than in 1960, In realterms, the rise of the consumerprice index reduced the realvalue of any given money claim.Hence, in real terms holders ofU.S. Government and corporatebonds were worse off in 1964than in 1960; only holders ofmunicipal bonds gained in realterms.0
The above discussion should not leadto a condusion between levels andpercentage changes in levels. Theperson who held $1000 of savings andloan shares over the 1960-68 periodwould have received, on the average,a much larger flow of returns in nom-inal and real terms than if he hadheld a time deposit account at acommercial hank.
cent, raising nominal yields on $1,000 of shares to$46.70. However, in real tenns the yield on savingsand loan shares fell slightly from $39.79 in 1964 to$39.71 in 1968.
The nominal yield on time deposits at commercialbanks rose more rapidly than the price level from1964 through 1968, and holders of this financial assetexperienced a 17 per cent increase in real yields onthese assets. However, these results were much lessthan the 27.5 per cent increase in real yields holdersof debt obligations of commercial banks obtained dur-ing the four years of prevailing price stabihty.°
Financial Assets with Money Values Fixed Only at
Maturity — In this section we examine how holdersof three widely held classes of bonds fared duringour two comparison periods. The dollar value of theseassets is fixed only at maturity. As the market placesdifferent valuations on the flow of money paymentsoffered by these assets, the money exchange valueof these assets varies over the life of the bond.
This revaluation of money flows offered by bondsis represented by inverse movements of their pricesand yields. As the public places a. lower valuationon the stream of payments which the claim represents,the market price of the bond falls and its effectiveyield rises. The relationship between prices and ef’feetive yields can be seen in Table VIII.
The holder of U.S. Government bonds over the1960-64 period would have suffered about a 2 percent decline in the nominal value of his bonds. Hold-ers of corporate bonds would have found in 1964 thatthe price of these bonds was approximately the sameas in 1960. Holders of municipal bonds would have
in the 1964-68 period of accelerating price infla-tion, bond holders suffered much larger capital lossesin nominal and real terms. From 1964 through 1968the price of U.S. Government bonds fell 14.4 percent, municipal prices fell 16.1 per cent, and corporatebond prices declined 19.7 per cent. Not only did bondholders experience a drastic decline in nominal valuesof their assets, but as the rise in the price index ac-celerated, they found the exchange value in realgoods of their declining nominal values fell about2½times as rapidly as during the 1960-64 period ofrelatively stable prices.
Common Stocks — Of the broad classes of financialassets being considered, only common stocks in-creased both the nominal and real wealth of theasset holder in both periods. In the 1964-68 periodthe Standard and Poor’s 500 Stock Index (a broadmeasure of the magnitude of the money exchangevalue of common stocks) rose 21.3 per cent. How-ever, this was only 60 per cent as great a percentageincrease as the 36 per cent rise in the Stock Index inthe 1960-64 period.7
A much larger rise in the consumer price index inthe more recent period meant that holders of eom-mon stocks not only fared worse in the second periodin nominal terms, but they also fared considerablyworse in real terms. It is interesting to note that inthe second period the real wealth of holders of com-mon stock rose only 8.1 per cent, compared to 29.8per cent in the period 1960-64.
~Thc market prices of common stocks are heavily influenced bythe level of business acivity. 1960 was a trough in businessactivity. To remove some of the cyclical influence on ouranalysis, an average of 1959, 1960, and 1961 was used for1960.
Tabis. VIII
AVERAGE ANNUAL YIELDS AND PRICES OF SELECTED BONDS
Opted States Stats. ard Local Carpara’eGave. r.’nc,’ Mun,cipa’ Aaa
Year Ba., an - - Baras Bandi -
Average AQi’regc Ave’cne
P-cc Y;eld C Y~id - N1960 4.OF- $86.22 3.6~ $103.90 4.41 $9460
1961 3.93 87.55 360 13/BC 4.35 95.201962 3.95 86.94 3.33 112.10 433 9620963 ‘00 863l 3.28 111 30 4.26 9680
1964 4.15 84.46 328 111.50 4.40 95.10
1965 4.21 83/6 J 34 1:0.60 4.49 93.901966 466 76.63 3.9~ 102.6-3 5.13 86.101967 4.85 76.55 3.99 100.50 5.51 81.801968 5.25 /233 4.48 9350 6.’B 7640
tin In. I ‘‘
- ,n.. £ t, • ,I It,-.-- a..’,
Page 32
FEDERAL RESERVE BANK OF ST. LOUIS NOVEMBER 1969
En the first comparison period the dividend pay-ments received by stockholders rose from $13.4 billionto $17.8 bilhon, a 33 per cent increase. in the 1964-68period the flow of dividend payments rose to $24.6billion, a 38 per cent increase. In nominal tenns, thepercentage increases in the flow of payments tostockholders was somewhat greater in the latter pe-riod. However, the increased flow of dividends in thelatter period represented a somewhat smaller increasein real purchasing power, 23 per cent, compared to27 per cent in the earlier period.
The assertion that common stocks are a betterhedge against inflation than the other types of finan-cial assets we considered is borne out by the evi-dence. However, although stockholders fared betterin inflation relative to holders of the other financialassets we discussed, holders of common stock bene-fited much more in the earlier period of extensiveprice stability than in the latter period of rapidlyrising prices. It seems difficult to support an assertionthat stockholders benefited more in inflation when thepercentage increase in their real wealth was muchgreater under four years of generally stable pricesthan under four years of rapidly rising prices.
Real AssetsSometimes the general assertion is made that infla-
tion destroys the incentive to save by wiping out thereal value of wealth accumulated by past acts ofsaving. This statement fails to take into account thatsaving may occur by additions to wealth in the formof real assets as well as financial assets. As the magni-tude of the exchange value of money in terms of real
goods and services falls, holders of real assets benefitfrom inflation in nominal terms and suffer no loss inreal terms. To examine the effects of inflation onholders of real wealth we have selected two realassets, land and houses.
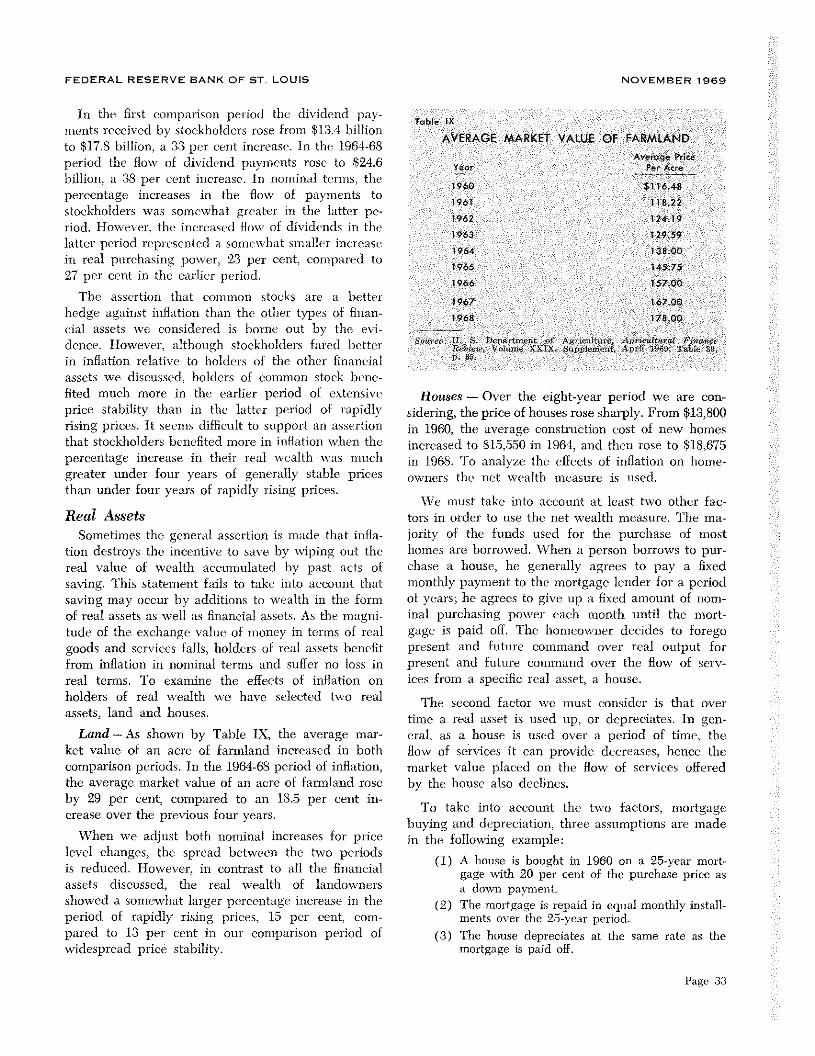
Land — As shown by Table IX, the average mar-ket value of an acre of farmland increased in bothcomparison periods. In the 1964-68 period of inflation,the average market value of an acre of farmland roseby 29 per cent, compared to an 18.5 per cent in-crease over the previous four years.
When we adjust both nominal increases for pricelevel changes, the spread between the two periodsis reduced. However, in contrast to all the financialassets discuss.ed, the real wealth of landownersshowed a somewhat larger percentage increase in theperiod of rapidly rising prices, 15 per cent, com-pared to 13 per cent in our comparison period ofwidespread price stability.
Table IX
AVERAGE MARKET VALUE OF FARMLAND
Avero~ePriceYear P r Acre
1960 $116.48
1961 11822
1962 12419
1963 129,59
1984 13800
1965 145.75
1966 157.00
1967 167.00
1968 17800
oarc, 11 Be ar0n n A eutn sad at @nR
5e V nnnexXrx Suppemnt.Ap114 P leS
p. 6
Houses — Over the eight-year period we are con-sidering, the price of houses rose sharply. From $13,800in 1960, the average construction cost of new homesincreased to $15,550 in 1964, and then rose to $18,675in 1968. To analyze the effects of inflation on home-owners the net wealth measure is used.
We must take into account at least two other fac-tors in order to use the net wealth measure. The ma-jority of the funds used for the purchase of mosthomes are borrowed. When a person borrows to pur-chase a house, he generally agrees to pay a fixedmonthly payment to the mortgage lender for a periodof years; he agrees to give up a fixed amount of nom-inal purchasing power each month until the mort-gage is paid off. The homeowner decides to foregopresent and future command over real output forpresent and future command over the flow of serv-ices from a specific real asset, a house.
The second factor we must consider is that overtime a real asset is used up, or depreciates. In gen~eral. as a house is used over a period of time, theflow of services it can provide decreases, hence themarket value placed on the flow of services offeredby the house also declines.
To take into account the two factors, mortgagebuying and depreciation, three assumptions are made
in the following example:
(1) A house is bought in 1960 on a 25-year mort-gage with 20 per cent of the purchase price asa down payment.
(2) The mortgage is repaid in equal monthly install-ments over the 25-year period.
(3) The house depreciates at the same rate as themortgage is paid off.
Page 33
FEDERAL RESERVE BANK OF ST. LOUIS NOVEMBER 1969
Using assumptions (1) through (3) in our example,we have:
Purchase price of a house in 1960 . $13,800Downpayment = 20 per cent of $13,800 = $ 2,760
Mortgage = 80 per cent of $13,800 = $11,040Yearly mortgage repayments =
$11,040 ÷25 years = $441.60
Yearly depreciation of house = $441.60
1960 BALANCE SHEETLiabilities
$11,040 = monetaryliability =
mortgage$ 2,760 = net wealth
At the end of 1964 the balance sheet has changed.Over the four years 1961 through 1964, the home-owner repays $1,776.40 of his mortgage (4 x $441.60),and his house depreciates by this amount. The mar-ket value of his house in 1964 equals the constructioncost of a new house ($15,500) less the depreciationof his home ($1,766.40).
1964 BALANCE SHEETLiabilities
$9,273.60 = outstandingmortgage
$4,511.00 = net wealth
At the end of 1968, the average homeowner hasrepaid an additional $1,766.40 on his mortgage, andhis house has depreciated by this amount. The marketvalue of his house in 1968 is $18,675 (the construc-tion cost of a new house) minus $3,532.80 (eightyears of depreciation).
1968 BALANCE SHEETLiabilities
$7,507.20 = outstandingmortgage
$7,635.00 = net wealth
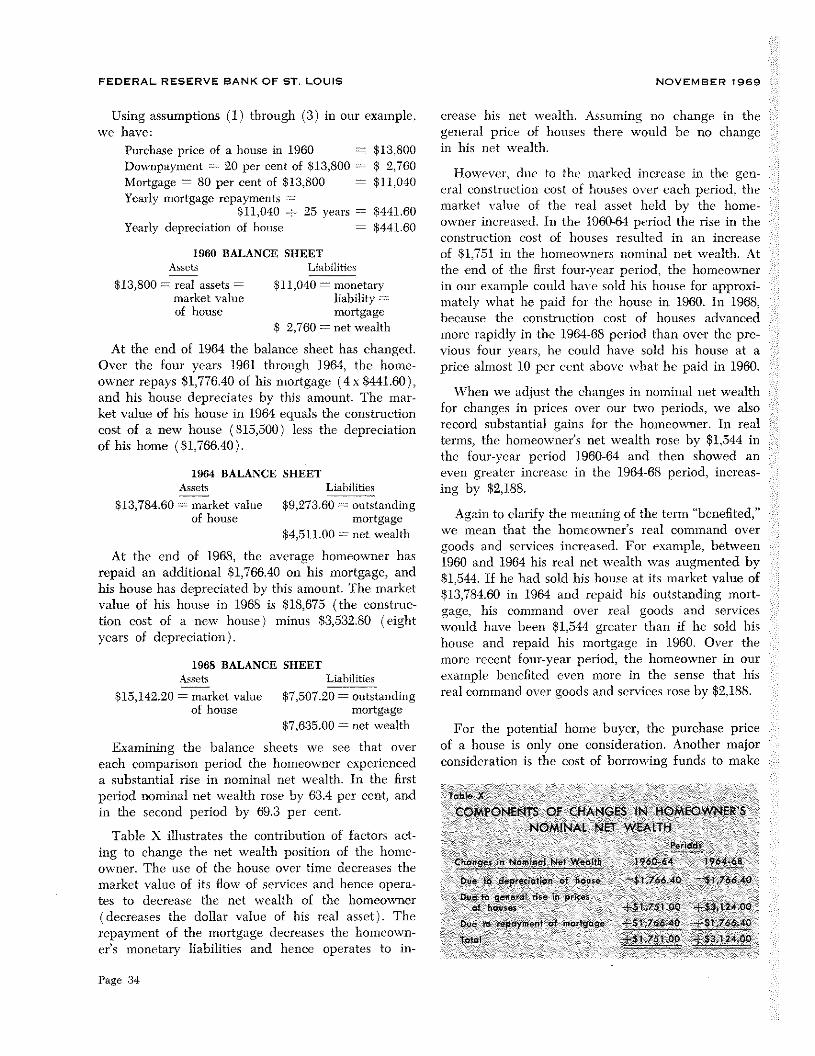
Examining the balance sheets we see that overeach comparison period the homeowner experienceda substantial rise in nominal net wealth. In the firstperiod nominal net wealth rose by 63.4 per cent, andin the second period by 69.3 per cent.
Table X illustrates the contribution of factors act-ing to change the net wealth position of the home-owner. The use of the house over time decreases themarket value of its flow of services and hence opera-tes to decrease the net wealth of the homeowner(decreases the dollar value of his real asset). Therepayment of the mortgage decreases the homeown-er’s monetary liabilities and hence operates to in-
crease his net wealth. Assuming no change in thegeneral price of houses there would be no changein his net wealth.
However, due to the marked increase in the gen-eral construction cost of houses over each period, themarket value of the real asset held by the home-owner increased. In the 1960-64 period the rise in theconstruction cost of houses resulted in an increaseof $1,751 in the homeowners nominal net wealth. Atthe end of the first four.year period, the homeownerin our example could have sold his house for approxi-mately what he paid for the house in 1960. In 1968,because the construction cost of houses advanced
more rapidly in the 1964-68 period than over the pre-vious four years, he could have sold his house at aprice almost 10 per cent above what he paid in 1960,
When we adjust the changes in nominal net wealthfor changes in prices over our two periods, we alsorecord substantial gains for the homeowner. In realterms, the homeowner’s net wealth rose by $1,544 inthe four-year period 1960-64 and then showed aneven greater increase in the 1964-68 period, increas-ing by $2,188.
Again to clarify the nieaning of the term “benefited,”we mean that the homeowner’s real command overgoods and services increased. For example, between1960 and 1964 his real net wealth was augmented by$1,544. If he had sold his house at its market value of813,784.60 in 1964 and repaid his outstanding mort-gage, his command over real goods and serviceswould have been $1,544 greater than if he sold hishouse and repaid his mortgage in 1960. Over themore recent four-year period, the homeowner in ourexample benefited even more in the sense that hisreal command over goods and services rose by $2,188.
be X
COMPONENT$ OF CHANG $ *4 HOMEOWNER SNOMINAL NET WEALTH
P t1~*
Chaages ‘a ftemhtal N t W~eIth 1960 64 1t6448
Due 1* deprecation ef h*u14 —$176640 $8, H40
Due Ia genetet rise frr pricesof belies $1, StOO $S,13404Y
18e 14 epflm itt of nlert9age 41,76640 $1 Th&40
elel $ISVSLeO $3,124 ~0
Assets
$13,800 = real assets =
market valueof house
Assets
$13,784.60 = market valueof house
Assets$15,142.20 = market value
of house
For the potential home buyer, theof a house is only one consideration.consideration is the cost of borrowing
purchase priceAnother majorfunds to make
Page 34
FEDERAL RESERVE BANK OF ST. LOUIS NOVEMBER 1969
the purchase. I)uring the first of our comparisonperiods the contract rate on conventional first mort-gages remained fairly stable at around 5.75 to 5.85per cent, On balance, it would not have cost ouraverage individual more in nominal terms to obtainfunds to finance the purchase of a home in 1964 thanearlier in the first period.
The second period shows quite a different picture.Over this period the cost of financing a home in-creased along with other market interest rates.Whereas the average cost of financing a new homeby a conventional first mortgage was 5.78 per cent in1964, this rate rose to an average of 6,83 per centfor 1968 and was at 7,08 per cent in the second halfof 1968. On balance, if instead of buying a home in1964, an individual had delayed buying a home un-til the second half of 1968, not only would the aver-age construction cost of the home have been about20 per cent higher, but the financing costs would haverisen by 22.5 per cent.
In real terms, if a person had financed a home ona conventional first mortgage during the period 1961through 1965, he would have gained in real termsduring the following three years. However, after1965 the current cost of mortgage financing rosefaster than the consumer price index. If a persondelayed buying a house in 1965, when niortgagerates were about 5.74 per cent, until 1966 whenmortgage rates rose to an average of 6.14 per cent,he would not have experienced a reduction of hisreal financing costs to the 1965 level until late 1968.
Suppose our average individual became an averagehomeowner in 1960. Using our example, we assumehe purchased a $13,800 house in 1960 with a 20 percent downpayment and the balance financed over 25years with a financing cost of 5.75 per cent. On thisbasis, his monthly payments would be $69.48. Ourindividual has decided to give up $69.48 a monthin nominal command over goods and services in ex-change for the flow of services from a house.
By 1964 the homeowner would still be giving up$69.48 a month in nominal purchasing power. How-ever, since the consunier price index rose by 4.8 percent over these four years, he would be giving upslightly less in real purchasing power each month,about $66.30 in real purchasing power.
In contrast, the average homeowner found that,in the four-year period since 1964, the real purchas-ing power he was giving up each month decreasedabout 2½times as rapidly as over the previous four
years of general price stability. In our illustrationthe real purchasing power of $69.48 in 1960 dollarsfell to $59.08 in 1968.
Retired Persons
One of the common maxims in most discussionsof the effects of inflation is that people on fixed in-comes, especially retired persons, lose” during peri-ods of inflation. Since inflation is a situation wherethe magnitude of the exchange value of money interms of real assets declines, individuals whose flowof money payments remains fixed find their incomecommands a smaller flow of real goods and servicesin an inflationary situation. The truth of the assertionthat retired persons lose during inflation dependsupon the assumption that their income payments re-main “fixed” and that net nominal increases in thevalue of their other assets do not offset their loss ofreal income.
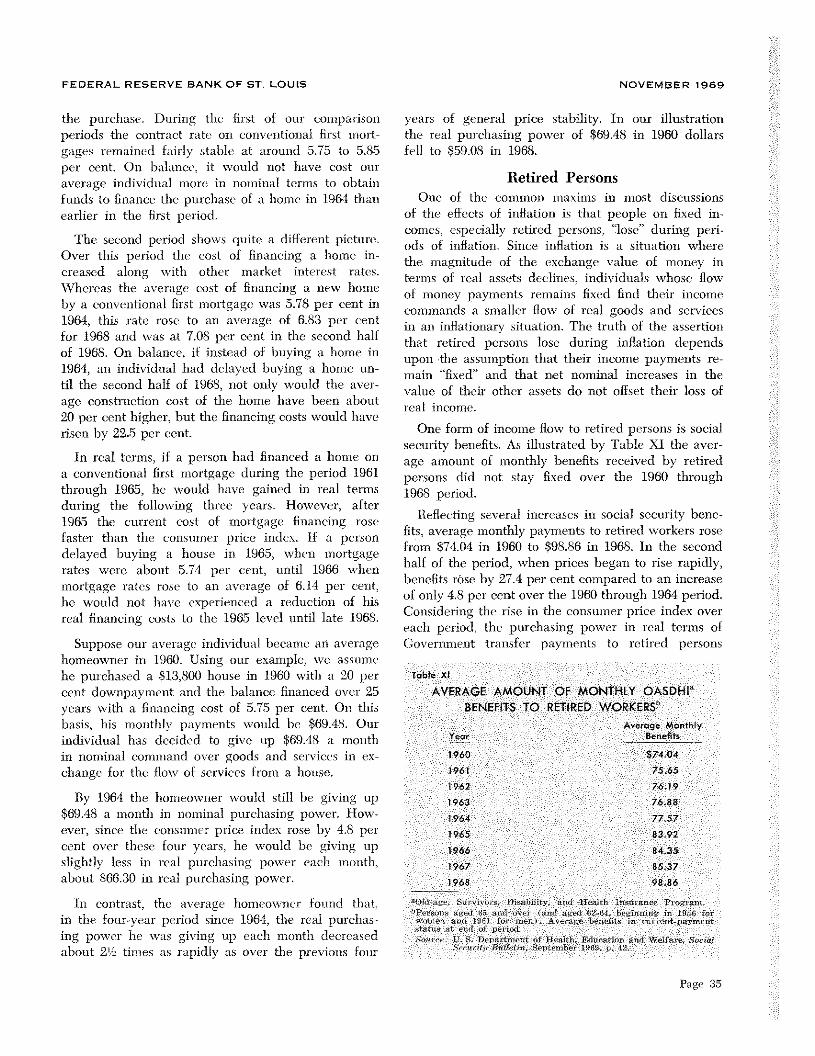
One form of income flow to retired persons is socialsecurity benefits. As illustrated by Table XI the aver-age amount of monthly benefits received by retiredpersons did riot stay fixed over the 1960 through1968 period.
Reflecting several increases in social security bene-fits, average monthly payments to retired workers rosefrom $74.04 in 1960 to $98.86 in 196$. In the secondhalf of the period, when prices began to rise rapidly,benefits rOse by 27.4 per cent compared to an increaseof only 4.8 per cent over the 1960 through 1964 period.Considering the rise in the consumer price mdc overeach period, the purchasing power in real terms ofGosrnment transfer payments to retired pcrsons
Table Xl
AVERAG AMOUNT OF MONTHLY OASDHIBENEFITS TO RETIRED WORKERS5
Average Monthly
Year Benefits1960 $7404
1961 7565
1962 7619
1963 76.88
1964 7757
1965 8392
1966 8435
1967 8537
1968 98.86
Old Srv 0~ D,abbm ad neat, a ne Pogwx,~Pe on agda. a 0 (an,a 62 ,1~ rmn inlOs or
on n 961fome A a bees t-aymntd p nod
,tr S Boa mntofflealth Edu -o n ci oe,alB Cc • S emS 060 8
Page 35

FEDERAL RESERVE BANK OF ST. LOUIS NOVEMBER 1969
was about the same in 1964 as in 1960, then increasedby approximately 13.6 per cent from 1964 through1968.8
For many retired persons, social security paymentscomprise only a portion of the income they dependupon after retirement, A portion of their incomederives from returns from financial assets they havepurchased over a period of years. Such assets includethe value of life insurance, savings and loan shares,hank deposits, bonds and common stock. In the sec-tion on the effects of inflation on holders of finaneia]assets, we saw that holders of these assets did notfare as well in the recent 1964-68 period of rapidprice inflation as in the 1960-64 period of much morestable prices.
To the extent that retired persons held real assets,
they were made no worse off by inflation and, de-pending on the asset, may have benefited. Manypeople, when they reach retirement age, have paidoff the mortgage on their home. As the price ofhomes has risen, the magnitude of the exchange valueof this asset in terms of other real assets has increased.Alternatively, since they are no longer net debtorswith regard to their house, they do not benefit asmuch from inflation as those individuals who are stillnet debtors on their homes.
On balancc. rapidly rising social security benefitsoffset part of the effects of inflation on retired persons.However, unless they were solely dependent uponsuch payments for retirement income, it does not ap-pear that retired persons made any real gains in theperiod from 1964 through 1968. In fact, compared tothe previous four years of price stability, in manycases retired persons may have suffered a decline intheir ability to command real output.
8The change in real purchasing power for retired persons mayhave been less than indicated by deflating by the consumerprice index. The prices ok many services, which might beexpected to weigh more heavily in retired person’s budgets.such as medical care, physicians’ fees, property taxes, andpublic fransportation, increased over 20 per cent during thisperiod, compared to a 12 per cent rise in the total index.
ConclusionsWe have concluded that, of all the classes of
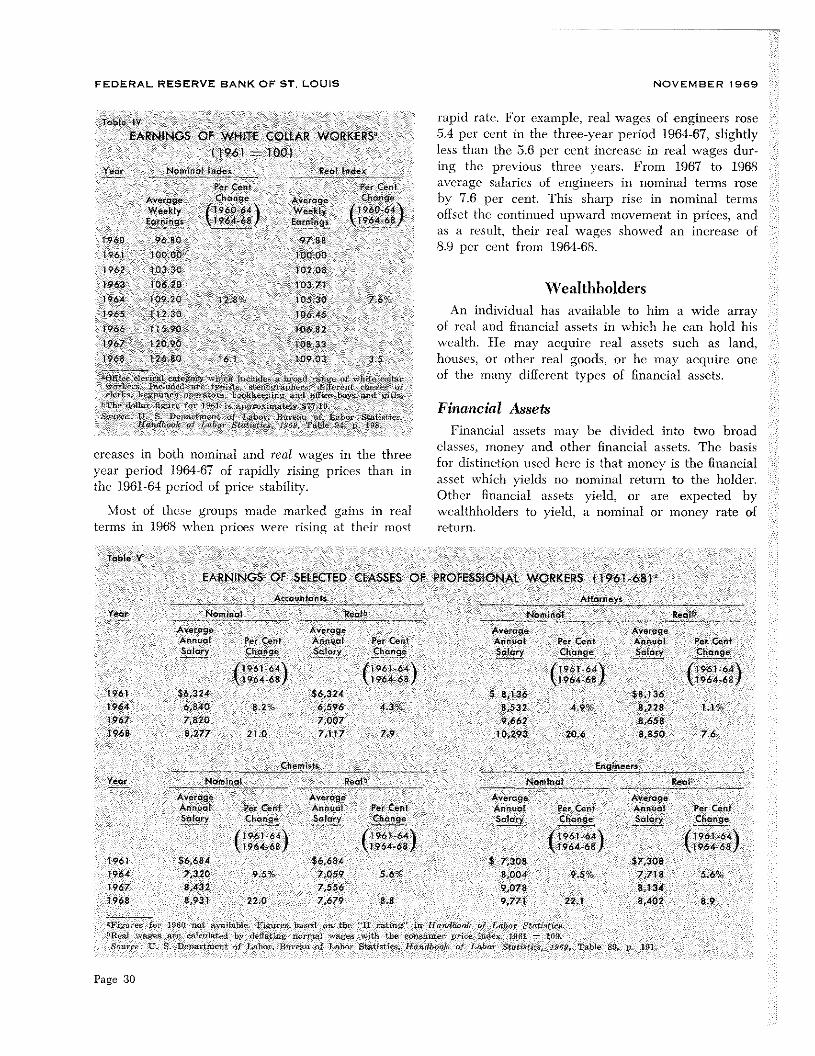
workers considered, only certain groups of profes-sional workers, such asac countants, attorneys, en-gineers, and chemists, could be said to have benefitedmore \vith respect to income flows in the 1964-68period of inflation thamm in the previous period ofgeneral price stability. The broad classes of skilledworkers, unskilled workers, umon workers, and whitecollar workers that were examined all benefited lessin time 1964-68 period than during the 1960-64 period.
Individuals, on the average, in their separate rolesas asset holders, benefited more in the 1964-68 periodthan in the 1960-64 period only in their roles asowners of real assets -~ land and houses, With respectto all financial assets considered except commonstocks, individual asset holders lost durimmg the latterperiod. Holders of common stocks, although they didnot lose in the 1964-68 period, benefited substantiallyless than during the 1960-64 comparison period.
Finally, to the extent that retired persons are solelydependent upon social security benefits, the sharpupward revisions of these transfer payments resultedin a rise in retired persons’ real command over goodsand services. However, to the extent that retired per-sons also depended upon insurance payments, fixeddollar value securities, and bonds, they lost real pur-chasing power in the 1964-68 period.
Any particmmlar in.dividual can only determine inwhich of our comparison periods he fared better byexamining his total balance sheets for both compari-son periods. This article has’ attempted to give a gen-eral framework in which the individual can completethis analysis. Rather than making broad assertionsabout the nebulous “evils of inflation,” a definition ofbenefit and loss has been presented for the reader.If the iudividuai is alerted to the dangers of confus-ing nomninai benefits with real benefits, he has ameans of judging the effects of the recent inflation onhis own ability to command real output.
This article is available as Reprint No. 48
Page 36