the elemental composition of pm2
TRANSCRIPT

The Elemental Composition of PM2.5 Collected During the Steubenville Comprehensive Air Monitoring Program Paper # 582 Daniel P. Connell, Stephen E. Winter, Vincent B. Conrad CONSOL Energy Inc. Research & Development, 4000 Brownsville Road, South Park, PA 15129 ABSTRACT The Steubenville Comprehensive Air Monitoring Program (SCAMP) was conducted from May 2000 through May 2002 to improve the understanding of fine particulate matter (PM2.5) concentration, composition, and exposure in the Steubenville, Ohio, region. As part of the program, water-soluble element concentrations were determined from 24-hr integrated PM2.5 samples collected every fourth day at a central outdoor monitoring site in Steubenville and at four surrounding sites, and acid-digestible element concentrations were determined from samples collected every fourth day at the Steubenville site. Elemental concentrations were determined using dynamic reaction cell (DRC) inductively coupled plasma-mass spectrometry (ICP-MS). Although it is a destructive technique, ICP-MS was selected over the more commonly used nondestructive X-ray fluorescence (XRF) technique because it affords better sensitivity than XRF for lower concentration elements of interest. This study is among the first to use ICP-MS equipped with a DRC to characterize the elemental composition of PM2.5. By using a gas that reacts with the interfering species to yield a neutral species or a species with a mass that differs from the analyte mass, the DRC eliminates many of the polyatomic interferences that limit the ability to determine low concentrations of several elemental components of PM2.5 (e.g., Fe, Ca, K, As, and Se) by conventional ICP-MS. This paper surveys noteworthy findings concerning the elemental composition of the water-soluble fraction of ambient PM2.5 in the Steubenville region as determined using DRC ICP-MS. (The composition of the acid-digestible fraction will be discussed in a future paper.) Key elements are characterized, including assessments of their temporal and spatial variability. This assessment may be useful for the design of future health effects studies, as several studies have suggested that elements in the water-soluble PM2.5 fraction may be associated with adverse health effects. Insights related to sources of PM2.5 in Steubenville are also discussed. INTRODUCTION Ambient concentrations of fine particulate matter (PM2.5) in Steubenville, Ohio, have received substantial attention from the scientific, regulatory, and environmental communities since the late 1970s. Concerns about PM2.5 in Steubenville were heightened when the landmark Harvard Six Cities Study1 reported an association between the city’s elevated PM2.5 concentrations and daily mortality, based on data collected between 1979 and 1985. Accompanied by changes in industry and population, Steubenville’s air quality has improved appreciably2 since the Six Cities Study measured a mean PM2.5 concentration of 29.6 µg/m3. Nevertheless, the Steubenville-
1

Weirton Metropolitan Statistical Area (MSA) is a nonattainment area under the National Ambient Air Quality Standard (NAAQS) for PM2.5, and will require the development of an implementation plan to reduce its ambient PM2.5 concentrations. Hence, a current assessment of PM2.5 in Steubenville is warranted. The Steubenville Comprehensive Air Monitoring Program (SCAMP) was conducted from May 2000 through May 2002 to provide such an assessment. PM2.5 data, fine particulate ionic and carbonaceous component data, and gaseous co-pollutant and meteorological data collected during this program have been presented and discussed in previous publications.2-4 This paper is the first to examine the elemental composition of PM2.5 collected during SCAMP. PM2.5 elemental composition data provide valuable information for use in source apportionment and in assessing the public health implications of PM2.5. Several papers have examined the elemental composition of PM2.5 in Steubenville using data collected during the Six Cities Study. For example, Koutrakis and Spengler5 identified six possible sources of fine particulate matter in Steubenville by applying specific rotation factor analysis to fine particle elemental data collected in 1984, and Laden et al.6 used elemental data collected from 1979 through the late 1980s to investigate associations of various source-related fractions of PM2.5 with daily mortality. However, these analyses are based upon data collected more than 15 years ago. Given the appreciable changes that have occurred in Steubenville, the SCAMP data provide a much-needed recent look at the elemental composition of PM2.5 in that city. Moreover, the elemental composition of PM2.5 collected during the Six Cities Study was determined using X-ray fluorescence (XRF). XRF is a non-destructive technique that is commonly used for the elemental analysis of filter-based particulate matter samples. However, this technique lacks the sensitivity to suitably determine several key elements of interest. Conrad et al.7 studied XRF determinations of 21 elements that are of interest to PM2.5 researchers, and found that only Ca, K, Al, Fe, Si, Zn, and Pb could be determined with less than 20% analytical uncertainty. Graney et al.8 similarly reported that 34 of 42 elemental constituents of PM2.5 analyzed using XRF were not quantifiable because of high analytical uncertainty. The list of non-quantifiable elements included a number of key species, such as Se, As, V, Mn, Ni, and Cd. The elemental composition of PM2.5 samples collected during SCAMP was determined using dynamic reaction cell (DRC) inductively coupled plasma-mass spectrometry (ICP-MS). Although it is a destructive technique and requires dissolution of the sampled PM2.5, ICP-MS exhibits superior sensitivity to XRF for the determination of elements present in trace (i.e., part-per-billion or part-per-trillion) amounts.7 However, conventional low-resolution ICP-MS has not commonly been used for the elemental analysis of PM2.5 samples because of isobaric and polyatomic interferences that limit the determination of isotopes such as 28Si, 39K, 40Ca, 51V, 52Cr, 56Fe, 75As, and 80Se. SCAMP is among the first studies to utilize ICP-MS equipped with a DRC to determine the elemental composition of PM2.5. By using a gas (e.g., CH4 or NH3) that selectively reacts with the polyatomic and isobaric species, converting them to non-interfering species, the DRC suppresses many of the interferences that often prevent the determination of desired isotopes such as those listed above.
2

This paper presents results concerning the elemental composition of the water-soluble fraction of PM2.5 samples collected during SCAMP. Data concerning the elemental composition of the acid-digestible (in HF, HNO3, and HCl) fraction of PM2.5 samples collected during SCAMP will be presented in a future publication. Elemental concentrations in the water-soluble PM2.5 fraction are of particular interest because they provide an indication of bioavailability. Recent toxicology studies have suggested that the pulmonary toxicity of urban air particulate matter is due to the soluble fraction rather than the concentration or composition of the insoluble fraction,9 and have identified specific groups of elements (e.g., Cu/Zn/V and Fe/Se/SO4
2-) in the water-soluble fraction of concentrated ambient particles that appear to be associated with specific health endpoints in human subjects.10 Hence, the data presented in this paper may be useful for the design of future health effects studies. Insights related to sources of PM2.5 in Steubenville are also discussed; these insights may aid the development of a State Implementation Plan (SIP) to bring Steubenville into compliance with the PM2.5 NAAQS. EXPERIMENTAL METHODS Details of the outdoor ambient air monitoring portion of SCAMP were provided previously.2,11 As part of the program, 24-hr integrated PM2.5 samples were collected each day from May 13, 2000, through May 14, 2002, at a central monitoring site in Steubenville and at four surrounding satellite sites. The Steubenville site (ST) was situated on the campus of Franciscan University of Steubenville atop a bluff overlooking the Ohio River, and was within several kilometers of Steubenville’s major industrial facilities. The four satellite sites were located 19 km to the north (N) near New Manchester, WV; 33 km to the south (S) in Wheeling, WV; 108 km to the east (E) in Latrobe, PA; and 22 km to the west (W) in Hopedale, OH. The PM2.5 samples were collected on Teflon filters using the Federal Reference Method (FRM) for PM2.5. Figure 1 shows the locations of the SCAMP outdoor ambient air monitoring sites, as well as the overall average PM2.5 concentration measured at each site during the program.
Figure 1: Average PM2.5 Concentrations (µg/m3)Measured at the Five SCAMP Monitoring Sites,
May 2000 – May 2002
SteubenvilleLatrobe
Wheeling
Hopedale
New Manchester
Pittsburgh
Pennsylvania
West Virginia
Ohio
Maryland
18.4
13.9
13.9
16.0
15.2Steubenville
Latrobe
Wheeling
Hopedale
New Manchester
Pittsburgh
Pennsylvania
West Virginia
Ohio
Maryland
SteubenvilleLatrobe
Wheeling
Hopedale
New Manchester
Pittsburgh
Pennsylvania
West Virginia
Ohio
Maryland
18.4
13.9
13.9
16.0
15.2
3

PM2.5 samples collected every fourth day at each site were analyzed to determine the elemental composition of their water-soluble fractions. The water-soluble components of each PM2.5 sample were extracted ultrasonically from the Teflon filter using deionized water containing 2% isopropanol (as a wetting agent), and an aliquot of the leachate was submitted for elemental analysis. An internal standard solution containing Ge and In was added to each aliquot so that instrument drift could be monitored and corrected. All elemental determinations during SCAMP were performed using a PerkinElmer ELAN 6100 DRC ICP-MS. Aside from the DRC, the instrument is a conventional quadrupole ICP-MS. The liquid sample to be analyzed is nebulized and passed through an argon plasma, which converts the analyte atoms into primarily singly charged ions. These ions are focused by a lens system and fed to a quadrupole mass spectrometer, which filters the ions according to their mass-to-charge ratio (m/z), allowing only those with a specific m/z to pass through. A discrete dynode detector is used to count the ions passing through the quadrupole. As discussed in the Introduction, interferences limit the ability of conventional ICP-MS to determine certain isotopes that are of interest to PM2.5 researchers. These interferences may result from isobaric species (e.g., 40Ar+, which interferes with the determination of 40Ca) or polyatomic species (e.g., 40Ar16O+, which interferes with the determination of 56Fe) that have the same m/z as the desired analyte. Certain sample matrices can increase the potential for interferences. For example, if the sample contains chloride, 40Ar35Cl+ can interfere with the determination of 75As, and 35Cl16O+ can interfere with the determination of 51V. The DRC is employed to minimize these interferences. Prior to entering the analyzing quadrupole, ionic species generated in the plasma pass through a reaction cell that contains an active quadrupole. A gas such as CH4 or NH3 that readily reacts with the interfering species but not with the desired analyte is introduced into the reaction cell. The reaction gas converts interfering species to uncharged species or species with masses that differ from that of the analyte. For example, NH3 reacts with 40Ar+ to form neutral 40Ar according to the following electron transfer reaction, which has a rate constant of 1.7 x 10⁻⁹ cm3 molecule-1 s-1: 12
40Ar+ + NH3 → 40Ar + NH3
+ (1)
The electron transfer reaction between 40Ca+ and NH3 is comparatively slow, having a rate constant of less than 10-13 cm3 molecule-1 s-1, and therefore does not occur to any appreciable extent.12 Hence, NH3 can be used to minimize the 40Ar+ interference on the determination of 40Ca. This process of using a reactive gas to selectively convert interfering ions to non-interfering species is termed “chemical resolution.” The quadrupole present in the reaction cell is used to control the m/z characteristics of the ion beam that is sent to the analyzing quadrupole. Species falling outside of a specific mass bandpass window are ejected from the cell, preventing the formation of new interferences (e.g., from reaction of the byproducts of chemical resolution). The DRC quadrupole is tuned appropriately to match the m/z being analyzed by the analyzing quadrupole. This process is termed “Dynamic Bandpass Tuning” (DBT). The combination of chemical resolution and DBT
4

substantially reduces many of the interferences that limit the capabilities of conventional ICP-MS. Elemental analyses conducted as part of SCAMP included the determination of 21 elements of interest. Table 1 shows these elements, and outlines the strategy used to determine each of them by DRC ICP-MS.
Table 1. Strategy and detection limits for the determination of elements in the water-soluble fraction of PM2.5 using DRC ICP-MS.
Element Isotope Reaction Gas Detection Limits (ng/m3 of ambient air)a
Al 27 NH3 0.1, 0.1, 0.1, 0.1 As 75 CH4 0.04 Ba 138 None 0.01 Ca 40 CH4 12
40 NH3 3, 1 44 None 27
Cd 111 None 0.01 114 None 0.01
Co 59 None 0.002 Cr 52 CH4 0.03 53 CH4 2.16
Cu 63 None 0.04 Fe 54 CH4 5.2, 1.8 56 CH4 0.2
K 39 CH4 69 39 NH3 0.5, 0.4, 0.3
Mg 24 None 0.1 25 None 0.2
Mn 55 CH4 0.8 Na 23 NH3 1
23 None 2 Ni 58 None 0.1 60 None 0.2
Pb 208 None 0.1 Se 80 CH4 0.05 82 None 0.26
Si 28 NH3 25, 7, 6 Sn 118 None 0.021 Ti 48 None 0.07 V 51 CH4 0.08 Zn 66 None 0.2
68 None 0.2 aMultiple detection limits are listed for isotopes that were determined under different
reaction gas flow rates. As the table indicates, the method included multiple determinations of many elements, including determinations of different isotopes of the element, determinations of the same isotope using different reaction gases (or no reaction gas), and determinations of the same isotope using different flow rates of the same reaction gas. Because of this strategy, multiple detection limits were obtained for many of the elements. (Detection limits shown in Table 1 were converted to units of ng/m3 of sampled ambient air for ease of comparison with the ambient air concentration
5
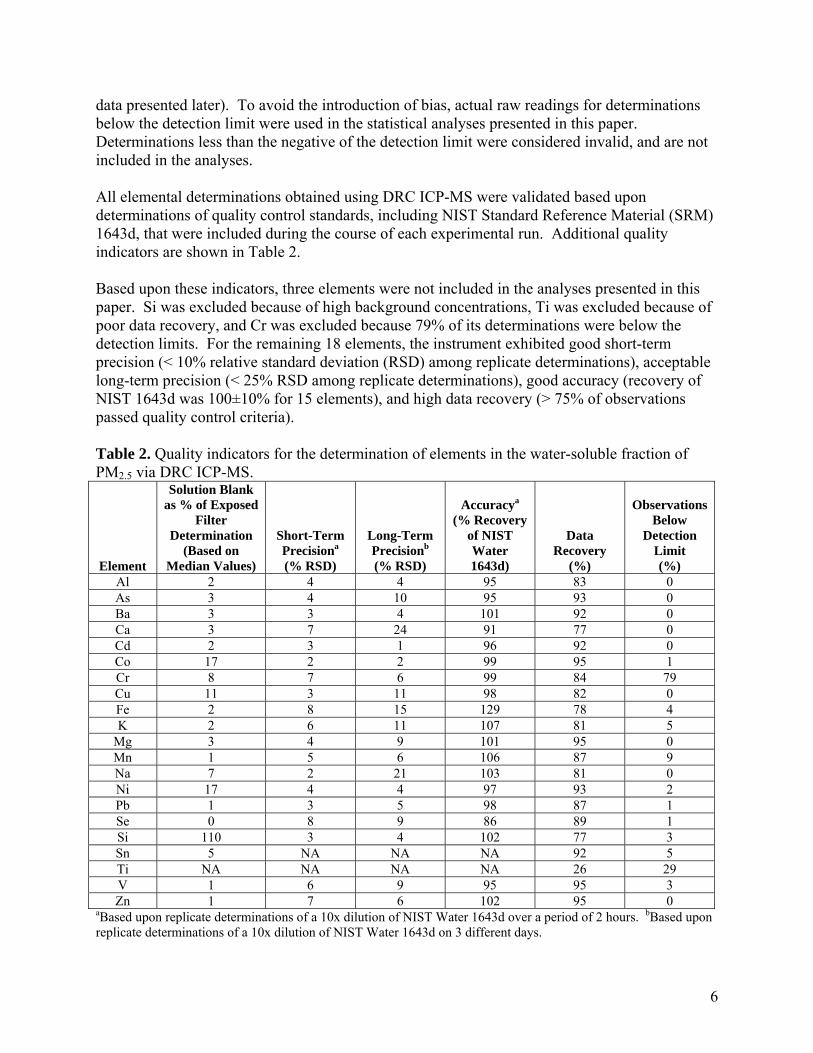
data presented later). To avoid the introduction of bias, actual raw readings for determinations below the detection limit were used in the statistical analyses presented in this paper. Determinations less than the negative of the detection limit were considered invalid, and are not included in the analyses. All elemental determinations obtained using DRC ICP-MS were validated based upon determinations of quality control standards, including NIST Standard Reference Material (SRM) 1643d, that were included during the course of each experimental run. Additional quality indicators are shown in Table 2. Based upon these indicators, three elements were not included in the analyses presented in this paper. Si was excluded because of high background concentrations, Ti was excluded because of poor data recovery, and Cr was excluded because 79% of its determinations were below the detection limits. For the remaining 18 elements, the instrument exhibited good short-term precision (< 10% relative standard deviation (RSD) among replicate determinations), acceptable long-term precision (< 25% RSD among replicate determinations), good accuracy (recovery of NIST 1643d was 100±10% for 15 elements), and high data recovery (> 75% of observations passed quality control criteria). Table 2. Quality indicators for the determination of elements in the water-soluble fraction of PM2.5 via DRC ICP-MS.
Element
Solution Blank as % of Exposed
Filter Determination
(Based on Median Values)
Short-Term Precisiona (% RSD)
Long-Term Precisionb (% RSD)
Accuracya (% Recovery
of NIST Water 1643d)
Data Recovery
(%)
Observations Below
Detection Limit (%)
Al 2 4 4 95 83 0 As 3 4 10 95 93 0 Ba 3 3 4 101 92 0 Ca 3 7 24 91 77 0 Cd 2 3 1 96 92 0 Co 17 2 2 99 95 1 Cr 8 7 6 99 84 79 Cu 11 3 11 98 82 0 Fe 2 8 15 129 78 4 K 2 6 11 107 81 5
Mg 3 4 9 101 95 0 Mn 1 5 6 106 87 9 Na 7 2 21 103 81 0 Ni 17 4 4 97 93 2 Pb 1 3 5 98 87 1 Se 0 8 9 86 89 1 Si 110 3 4 102 77 3 Sn 5 NA NA NA 92 5 Ti NA NA NA NA 26 29 V 1 6 9 95 95 3 Zn 1 7 6 102 95 0
aBased upon replicate determinations of a 10x dilution of NIST Water 1643d over a period of 2 hours. bBased upon replicate determinations of a 10x dilution of NIST Water 1643d on 3 different days.
6
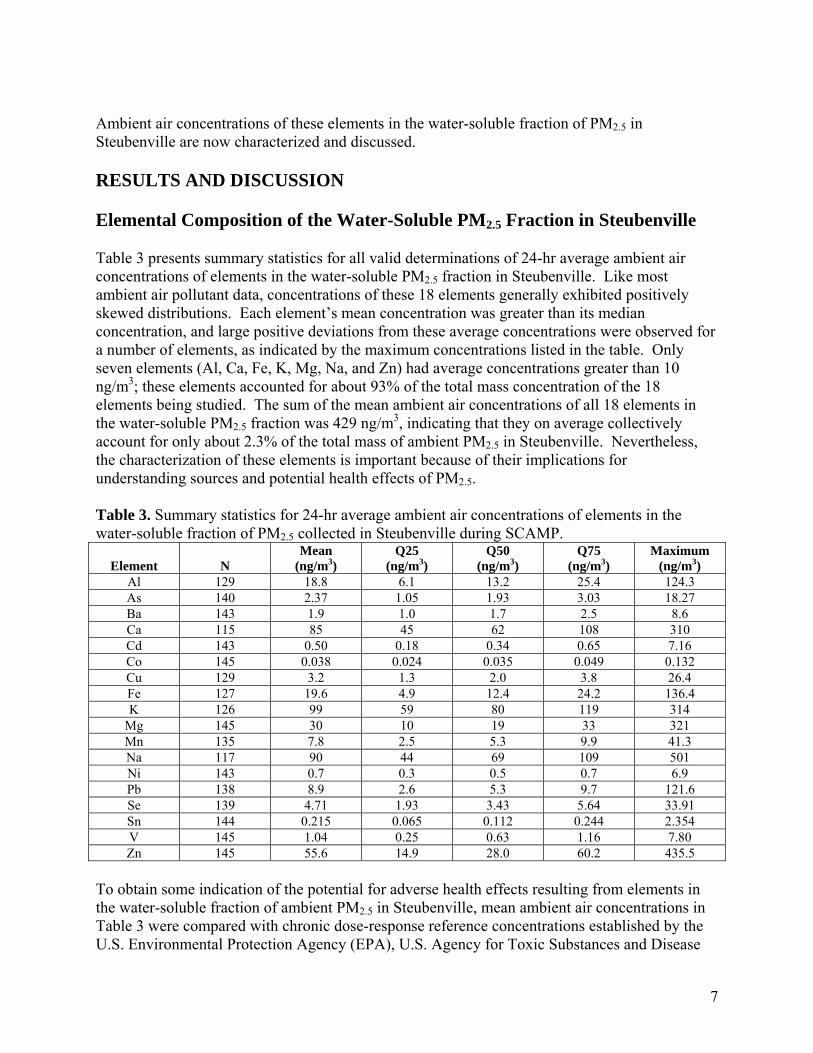
Ambient air concentrations of these elements in the water-soluble fraction of PM2.5 in Steubenville are now characterized and discussed. RESULTS AND DISCUSSION Elemental Composition of the Water-Soluble PM2.5 Fraction in Steubenville Table 3 presents summary statistics for all valid determinations of 24-hr average ambient air concentrations of elements in the water-soluble PM2.5 fraction in Steubenville. Like most ambient air pollutant data, concentrations of these 18 elements generally exhibited positively skewed distributions. Each element’s mean concentration was greater than its median concentration, and large positive deviations from these average concentrations were observed for a number of elements, as indicated by the maximum concentrations listed in the table. Only seven elements (Al, Ca, Fe, K, Mg, Na, and Zn) had average concentrations greater than 10 ng/m3; these elements accounted for about 93% of the total mass concentration of the 18 elements being studied. The sum of the mean ambient air concentrations of all 18 elements in the water-soluble PM2.5 fraction was 429 ng/m3, indicating that they on average collectively account for only about 2.3% of the total mass of ambient PM2.5 in Steubenville. Nevertheless, the characterization of these elements is important because of their implications for understanding sources and potential health effects of PM2.5. Table 3. Summary statistics for 24-hr average ambient air concentrations of elements in the water-soluble fraction of PM2.5 collected in Steubenville during SCAMP.
Element N Mean
(ng/m3) Q25
(ng/m3) Q50
(ng/m3) Q75
(ng/m3) Maximum
(ng/m3) Al 129 18.8 6.1 13.2 25.4 124.3 As 140 2.37 1.05 1.93 3.03 18.27 Ba 143 1.9 1.0 1.7 2.5 8.6 Ca 115 85 45 62 108 310 Cd 143 0.50 0.18 0.34 0.65 7.16 Co 145 0.038 0.024 0.035 0.049 0.132 Cu 129 3.2 1.3 2.0 3.8 26.4 Fe 127 19.6 4.9 12.4 24.2 136.4 K 126 99 59 80 119 314
Mg 145 30 10 19 33 321 Mn 135 7.8 2.5 5.3 9.9 41.3 Na 117 90 44 69 109 501 Ni 143 0.7 0.3 0.5 0.7 6.9 Pb 138 8.9 2.6 5.3 9.7 121.6 Se 139 4.71 1.93 3.43 5.64 33.91 Sn 144 0.215 0.065 0.112 0.244 2.354 V 145 1.04 0.25 0.63 1.16 7.80 Zn 145 55.6 14.9 28.0 60.2 435.5
To obtain some indication of the potential for adverse health effects resulting from elements in the water-soluble fraction of ambient PM2.5 in Steubenville, mean ambient air concentrations in Table 3 were compared with chronic dose-response reference concentrations established by the U.S. Environmental Protection Agency (EPA), U.S. Agency for Toxic Substances and Disease
7
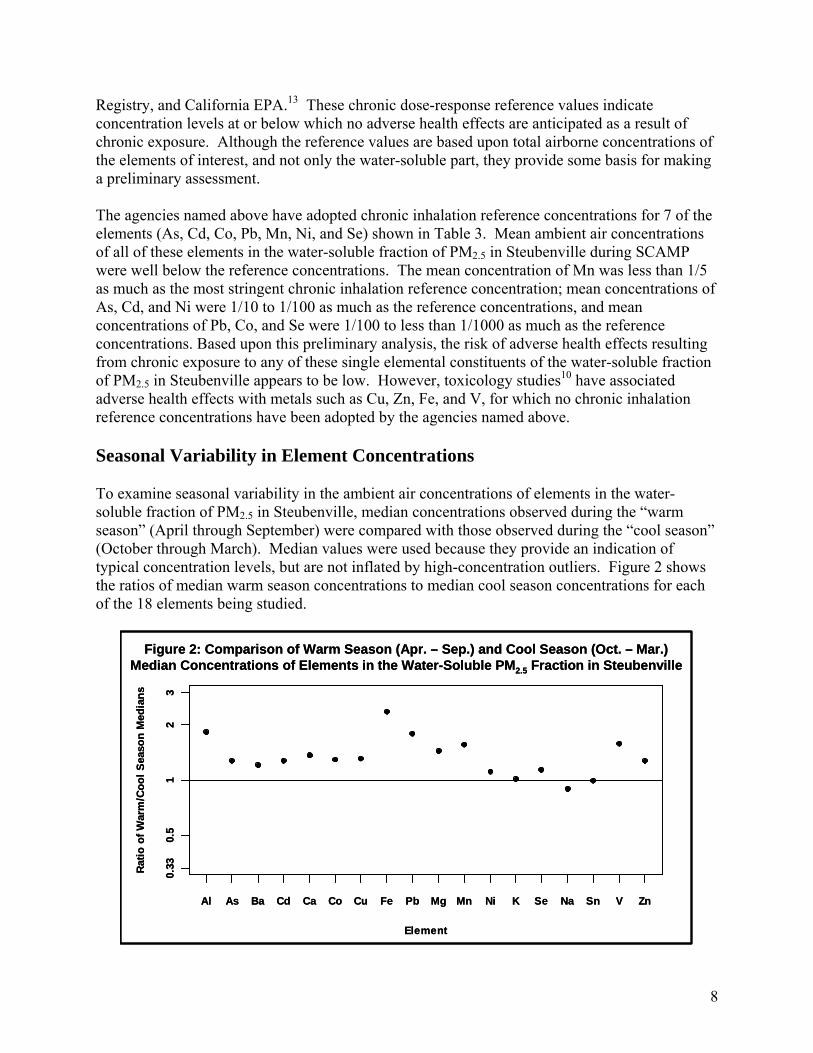
Registry, and California EPA.13 These chronic dose-response reference values indicate concentration levels at or below which no adverse health effects are anticipated as a result of chronic exposure. Although the reference values are based upon total airborne concentrations of the elements of interest, and not only the water-soluble part, they provide some basis for making a preliminary assessment. The agencies named above have adopted chronic inhalation reference concentrations for 7 of the elements (As, Cd, Co, Pb, Mn, Ni, and Se) shown in Table 3. Mean ambient air concentrations of all of these elements in the water-soluble fraction of PM2.5 in Steubenville during SCAMP were well below the reference concentrations. The mean concentration of Mn was less than 1/5 as much as the most stringent chronic inhalation reference concentration; mean concentrations of As, Cd, and Ni were 1/10 to 1/100 as much as the reference concentrations, and mean concentrations of Pb, Co, and Se were 1/100 to less than 1/1000 as much as the reference concentrations. Based upon this preliminary analysis, the risk of adverse health effects resulting from chronic exposure to any of these single elemental constituents of the water-soluble fraction of PM2.5 in Steubenville appears to be low. However, toxicology studies10 have associated adverse health effects with metals such as Cu, Zn, Fe, and V, for which no chronic inhalation reference concentrations have been adopted by the agencies named above. Seasonal Variability in Element Concentrations To examine seasonal variability in the ambient air concentrations of elements in the water-soluble fraction of PM2.5 in Steubenville, median concentrations observed during the “warm season” (April through September) were compared with those observed during the “cool season” (October through March). Median values were used because they provide an indication of typical concentration levels, but are not inflated by high-concentration outliers. Figure 2 shows the ratios of median warm season concentrations to median cool season concentrations for each of the 18 elements being studied.
Element
Ratio
of W
arm
/Coo
l Sea
son
Med
ians
0.33
0.5
12
3
Al As Ba Cd Ca Co Cu Fe Pb Mg Mn Ni K Se Na Sn V Zn
Figure 2: Comparison of Warm Season (Apr. – Sep.) and Cool Season (Oct. – Mar.) Median Concentrations of Elements in the Water-Soluble PM2.5 Fraction in Steubenville
Element
Ratio
of W
arm
/Coo
l Sea
son
Med
ians
0.33
0.5
12
3
Al As Ba Cd Ca Co Cu Fe Pb Mg Mn Ni K Se Na Sn V Zn
Figure 2: Comparison of Warm Season (Apr. – Sep.) and Cool Season (Oct. – Mar.) Median Concentrations of Elements in the Water-Soluble PM2.5 Fraction in Steubenville
8

All of the elements in the water-soluble PM2.5 fraction except for Na and Sn had higher median ambient air concentrations during the warm season than during the cool season. Overall PM2.5 concentrations in Steubenville exhibit a similar seasonal pattern, which is driven largely by seasonal variations in sulfate concentrations.2 While this overall pattern can be attributed to increased photochemical formation of secondary sulfate during summertime, the observed trend in elemental concentrations is more difficult to explain. Because the trend is observed for a number of diverse elements, it is probably not caused by seasonal variations in primary particulate emissions from a single particular source or source class. One possible explanation is that increased numbers of ambient fine particles during the summertime provide more surface area upon which various primary metal species can collect, thereby allowing these species to accumulate in the ambient air. Another plausible explanation is that certain PM2.5 constituents (e.g., secondary sulfates) that are more prevalent during summertime than during wintertime interact with ambient metals to increase their solubility. The trend may also result from seasonal variations in meteorology that affect atmospheric transport and stagnation or that influence the partitioning of various elements between their water-soluble and insoluble forms. Seasonal patterns in element concentrations will be studied further when data concerning the elemental composition of the acid-digestible (total) PM2.5 fraction become available. Spatial Variability in Element Concentrations As discussed earlier, ambient air concentrations of elements in the water-soluble PM2.5 fraction were determined at all five SCAMP monitoring sites. To evaluate the amount of homogeneity in PM2.5 component concentrations measured across these five sites, coefficients of divergence14 (CD) were computed for each site pair using mean concentrations of the 18 elements shown in Table 3, as well as mean concentrations of SO4
2-, NO3-, and NH4
+ measured at each site. The CD is a measure of the degree of similarity or difference between sites, and is self-normalizing, meaning that PM2.5 components are weighted equally regardless of the magnitudes of their average concentrations. It is defined by the following equation:
∑=
⎟⎟⎠
⎞⎜⎜⎝
⎛
+−
=n
i ikij
ikijjk xx
xxn
CD1
21 (2)
where j and k represent two sampling sites, xij represents the mean concentration of component i at site j, and n is the number of chemical components. The CD for a site pair will equal zero if the average PM2.5 component concentrations measured at the two sites are identical for all of the components being studied. Greater CD values indicate less similarity among the sites. Coefficients of divergence computed for each SCAMP site pair are plotted in Figure 3. In all cases, CDs for the Steubenville site / satellite site pairs were greater than those for the satellite site / satellite site pairs. This indicates that PM2.5 component concentrations measured at Steubenville were relatively dissimilar to those measured at other sites throughout the region, and suggests the influence of local emission sources on the concentrations of many PM2.5 constituents in Steubenville. The pair comprising the northern and western satellite sites had the lowest CD, suggesting that these were the most similar of the SCAMP sites. The northern and western sites also had the lowest overall average PM2.5 concentrations (13.9 µg/m3) of the
9

SCAMP sites, and were not generally situated downwind of Steubenville. Hence, for the purposes of this analysis, these sites are assumed to be representative of regional “background” concentrations in the Steubenville area. The background concentration measured on a given day is taken as the average concentration measured at the northern and western sites on that day.
Site Pair
Coe
ffici
ent o
f Div
erge
nce
0.10
0.15
0.20
0.25
0.30
ST /
NST
/ S
ST /
EST
/ W
N /
SN
/ E
N /
WS
/ ES
/ WE
/ W
Figure 3: Intersite Coefficients of Divergence Based Upon 21 PM2.5 Components
Site Pair
Coe
ffici
ent o
f Div
erge
nce
0.10
0.15
0.20
0.25
0.30
ST /
NST
/ S
ST /
EST
/ W
N /
SN
/ E
N /
WS
/ ES
/ WE
/ W
Figure 3: Intersite Coefficients of Divergence Based Upon 21 PM2.5 Components
Based on this assumption, Connell et al.2 estimated that local sources contribute 4.6 µg/m3 to Steubenville’s overall average PM2.5 concentration of 18.4 µg/m3; SO4
2- accounts for about 1.1 µg/m3 of this local contribution, NH4
+ and NO3- respectively account for about 0.5 µg/m3 and 0.4
µg/m3, and other components (i.e., carbonaceous species, crustal materials, and trace elements) account for the remaining 2.6 µg/m3. Similar estimates are now made for elements in the water-soluble fraction of PM2.5. Table 4 summarizes the estimated average contribution of local sources to ambient air concentrations of elements in the water-soluble PM2.5 fraction in Steubenville. The estimated local source contribution for each element was computed as the mean of the paired differences between 24-hr average concentrations at the Steubenville site and 24-hr average background concentrations. For 10 of the 18 elements shown in Table 4, 24-hr average concentrations measured at the Steubenville site were greater than corresponding background concentrations at least 70% of the time. Only three elements (Co, Se, and Sn) had estimated local source contributions that were negative, indicating that ambient air concentrations of the water-soluble forms of these elements tended to be higher at the background sites than at the Steubenville site. These results suggest that local sources in Steubenville contribute appreciably to ambient levels of a number of elements in the water-soluble fraction of PM2.5. Although the 18 elements listed in Table 4 collectively account for only about 0.1 µg/m3 (this number does not include the mass of species that are associated with these elements in chemical compounds) of the total local source contribution to Steubenville’s ambient PM2.5 concentration, the data presented in the table provide insights that are useful for the identification of major sources of PM2.5 in Steubenville. Four of the elements listed in Table 4 (Fe, Mg, Mn, and Zn) had concentrations at Steubenville
10

that were on average more than 100% greater than (double the) corresponding background concentrations. These data will be referenced in the following section on source apportionment. Table 4. Estimated local source contributions to ambient air concentrations of elements in the water-soluble PM2.5 fraction in Steubenville.
Element
Percentage of Observations for which
[Steubenville] > [Background]
Estimated Average Steubenville Local
Source Contribution (ng/m3)
Estimated Local Source Contribution as a
Percentage of Average [Background]
Al 71 4.8 49 As 73 0.66 43 Ba 79 0.7 65 Ca 73 28 46 Cd 71 0.10 31 Co 43 -0.004 -10 Cu 59 0.7 31 Fe 71 11.8 106 K 59 16 21
Mg 79 18 145 Mn 83 4.5 154 Na 73 19 32 Ni 47 0.1 11 Pb 69 3.1 78 Se 54 -0.44 -9 Sn 38 -0.017 -9 V 63 0.44 66 Zn 75 25.5 140
Source Apportionment To gain insights regarding sources of PM2.5 in Steubenville, the EPA Unmix 2.3 receptor model was applied to water-soluble PM2.5 composition data from the Steubenville site. Unmix is a multivariate receptor model that combines factor analysis with various geometric constraints, which ensure that estimated source contributions and profiles are non-negative (within errors). The model has been described thoroughly in the literature.15 For a given set of PM2.5 concentration and composition data, Unmix estimates the number of contributing sources, the composition of each source (with uncertainties), and the contributions of the individual sources to the total PM2.5 mass of each observation. Receptor models are typically applied to elemental data resulting from analyses of total PM2.5 samples, because most of the source profile data to which the results are compared do not distinguish between soluble and insoluble forms of elements. However, the models are mathematically suitable for application to elemental data from the water-soluble PM2.5 fraction as well. Therefore, to preliminarily analyze possible sources of PM2.5 in Steubenville, Unmix was applied to elemental and ionic composition data from the water-soluble fraction of PM2.5 samples collected at the Steubenville site during SCAMP. Some preliminary data concerning the elemental composition of the total (acid-digestible) PM2.5 samples were used to aid in interpreting the results. More thorough source apportionment will be performed once these total elemental composition data become fully available.
11

A number of Unmix runs were performed to systematically explore the effects of including various ionic and elemental species. Several satisfactory four-source solutions were obtained; one of these solutions is now discussed in greater detail. This solution resulted from the inclusion of SO4
2-, NH4+, Cd, Mn, V, and Zn in the Unmix model. Because of missing values,
only 128 valid cases were included in the model run. Diagnostic indicators for the solution (i.e., R2, strength, signal-to-noise ratio) met or exceeded specifications provided with the software. Table 5 presents Unmix-derived source profiles and single-standard-deviation (σ) uncertainties for the four-source solution. Figure 4 compares 24-hr average PM2.5 concentrations predicted by the Unmix model with actual 24-hr average PM2.5 concentrations measured at Steubenville. The model was generally successful in predicting total PM2.5 mass concentrations at Steubenville; the R2 resulting from simple linear regression of predicted versus observed values is 0.94. Table 5. Source profiles and 1σ uncertainties (ng/m3) derived by applying UNMIX to elemental data from the water-soluble fraction of PM2.5 samples collected at Steubenville during SCAMP.
Source 1 Source 2 Source 3 Source 4 PM2.5 1724 ± 774 1321 ± 841 4700 ± 1227 9584 ± 1680 SO4
2- 386 ± 259 441 ± 259 1105 ± 419 3867 ± 701 NH4
+ 181 ± 104 164 ± 96 379 ± 167 1495 ± 255 Cd 0.04 ± 0.02 0.33 ± 0.07 0.09 ± 0.04 0.04 ± 0.02 Mn 0.1 ± 0.4 0.8 ± 0.6 6.0 ± 1.0 1.0 ± 0.5 V 0.96 ± 0.18 0.04 ± 0.09 -0.03 ± 0.07 0.09 ± 0.05 Zn -6.2 ± 3.5 10.8 ± 5.1 51.8 ± 8.3 -0.8 ± 3.2
As shown in Table 5, a number of the Unmix estimates have an appreciable degree of uncertainty associated with them. This is not surprising given the limited number of cases included in the model run. Uncertainties are particularly prevalent in the profiles of Sources 1 and 2, which contribute an estimated 1.7 µg/m3 and 1.3 µg/m3, respectively, to Steubenville’s total average PM2.5 concentration. In fact, the estimated contribution of Source 2 is not significantly different from zero based upon 2σ error bars. The least uncertain species in Source 1 is V; the estimated mass concentration of V in this source is an order of magnitude greater than that in any other source. The least uncertain species in Source 2 is Cd; the estimated Cd concentration in Source 2 is more than three times greater than the concentrations in the other three sources. Due to the uncertainties associated with Sources 1 and 2, however, no firm conclusions can be drawn regarding their identities. Nevertheless, particular attention will be given to V and Cd in future source apportionment runs using total elemental composition data collected during SCAMP. Source 4 accounts for the largest portion of the total average mass of PM2.5 in Steubenville, contributing about 9.6 µg/m3. The most prominent and least uncertain species in this source are SO4
2- and NH4+, which respectively account for about 40% and 16% of the total PM2.5 mass
associated with the source. Hence, Source 4 likely represents secondary sulfate-dominated PM2.5. The 44% of the source’s mass not accounted for by SO4
2- and NH4+ may include other
secondarily formed PM2.5 species (e.g., organic compounds and nitrates), as well as primary PM2.5 species that agglomerate with the secondary species and are transported with them. The prevalence of a secondary sulfate-dominated source is expected, as Steubenville is situated in the Ohio River Valley region, which contains many large point source emitters of sulfur dioxide.
12

Most of the satisfactory Unmix solutions included a source characterized by elevated concentrations of Mn and Zn. In the solution presented here, this is Source 3, which contributes about 4.7 µg/m3 to Steubenville’s overall PM2.5 concentration. Estimated mass concentrations of Mn and Zn in Source 3 are more than four times greater than the concentrations of these species in any other source. According to the U.S. EPA’s 2001 Toxic Release Inventory (TRI) for air emissions,16 the primary metals industry accounts for 93% of Zn emissions and 83% of Mn emissions from stationary sources in Jefferson County, OH, where Steubenville is located. The approximate ratio of the mass of Mn to the mass of Zn emitted by these facilities is 0.16 based upon the TRI data.
0 10000 20000 30000 40000 50000
010
000
2000
030
000
4000
050
000
Observed PM2.5 (ng/m3)
UN
MIX
Pre
dict
ed P
M2.
5 (ng
/m3 )
Figure 4: Predicted vs. Observed PM2.5Concentrations in Steubenville
0 10000 20000 30000 40000 50000
010
000
2000
030
000
4000
050
000
Observed PM2.5 (ng/m3)
UN
MIX
Pre
dict
ed P
M2.
5 (ng
/m3 )
Figure 4: Predicted vs. Observed PM2.5Concentrations in Steubenville
To estimate the Mn/Zn ratio in Source 3, concentrations of these species in the total PM2.5 fraction were estimated based on determinations of elements in the total PM2.5 fraction that have been performed thus far as part of SCAMP. Linear regression was used to develop equations relating ambient air concentrations (ng/m3) in the total PM2.5 fraction (TOT) with ambient air concentrations in the water-soluble PM2.5 fraction (WS); these equations are shown below:
[Mn]TOT = 1.71⋅ [Mn]WS + 0.61 (3) [Zn]TOT = 1.02 ⋅ [Zn]WS + 21.95 (4)
After substituting values of [Mn]WS and [Zn]WS from the Source 3 profile into these equations, the estimated ratio of [Mn]TOT to [Zn]TOT for Source 3 is 0.14. This agrees remarkably well with the TRI value of 0.16. Hence, Source 3 likely represents the contribution of the local primary metals industry, and possibly other industries located nearby, to ambient PM2.5 concentrations in Steubenville. To further explore this finding, the daily PM2.5 mass contributions of each Unmix-derived source were compared with daily estimates of the contribution of local sources to Steubenville’s PM2.5
13

concentration. These estimated local source contributions were computed by subtracting daily measured background PM2.5 concentrations from corresponding daily PM2.5 concentrations measured at Steubenville. Results of the comparisons are shown in the scatter plots (with parity lines) presented in Figure 5. Figure 5c shows that the daily PM2.5 concentrations attributed to Source 3 exhibit a relatively strong positive association with the daily PM2.5 concentrations attributed to local sources in Steubenville. The Spearman correlation coefficient (rs) describing this association is 0.78. Conversely, associations between the PM2.5 concentrations attributed to the other three Unmix-derived sources and the PM2.5 concentrations attributed to local sources in Steubenville are relatively weak; all have rs values less than 0.4. These comparisons provide further evidence that Source 3 is representative of local source contributions to PM2.5 in Steubenville. The results are also consistent with the data presented in Table 4, which suggest that concentrations of Mn and Zn (as well as Fe and Mg) are particularly enriched by local sources in Steubenville.
0 10000 20000 30000
040
0080
0012
000
Local PM2.5 (ng/m3)
Sour
ce 1
PM
2.5 (
ng/m
3 )
0 10000 20000 30000
050
0015
000
2500
0
Local PM2.5 (ng/m3)
Sour
ce 2
PM
2.5 (
ng/m
3 )
0 10000 20000 30000
010
000
2000
030
000
Local PM2.5 (ng/m3)
Sour
ce 3
PM
2.5 (
ng/m
3 )
0 10000 20000 30000
010
000
3000
0
Local PM2.5 (ng/m3)
Sour
ce 4
PM
2.5 (
ng/m
3 )(a) Source 1 (b) Source 2
(c) Source 3 (d) Source 4
Figure 5: Comparison of UNMIX-Derived Source Contributions with Estimated Local Source Contributions in Steubenville
rs = 0.37 rs = 0.36
rs = 0.78 rs = 0.31
0 10000 20000 30000
040
0080
0012
000
Local PM2.5 (ng/m3)
Sour
ce 1
PM
2.5 (
ng/m
3 )
0 10000 20000 30000
050
0015
000
2500
0
Local PM2.5 (ng/m3)
Sour
ce 2
PM
2.5 (
ng/m
3 )
0 10000 20000 30000
010
000
2000
030
000
Local PM2.5 (ng/m3)
Sour
ce 3
PM
2.5 (
ng/m
3 )
0 10000 20000 30000
010
000
3000
0
Local PM2.5 (ng/m3)
Sour
ce 4
PM
2.5 (
ng/m
3 )(a) Source 1 (b) Source 2
(c) Source 3 (d) Source 4
Figure 5: Comparison of UNMIX-Derived Source Contributions with Estimated Local Source Contributions in Steubenville
rs = 0.37 rs = 0.36
rs = 0.78 rs = 0.31
14

CONCLUSIONS Dynamic reaction cell ICP-MS was used to determine the elemental composition of the water-soluble fraction of PM2.5 samples collected between May 2000 and May 2002 at monitoring sites in Steubenville, OH, and four surrounding locations. Analysis of these data led to the following conclusions: • DRC ICP-MS exhibited adequate accuracy, precision, and sensitivity to determine the
concentrations of 18 elements of interest (Al, As, Ba, Ca, Cd, Co, Cu, Fe, K, Mg, Mn, Na, Ni, Pb, Se, Sn, V, and Zn) in the water-soluble fraction of PM2.5.
• Average ambient air concentrations of these 18 elements in the water-soluble PM2.5 fraction collectively account for about 0.4 µg/m3 (about 2%) of the total mass concentration of PM2.5 in Steubenville.
• Mean ambient air concentrations of As, Cd, Co, Pb, Mn, Ni, and Se in the water-soluble PM2.5 fraction in Steubenville were 1/5 to less than 1/1000 as much as chronic inhalation reference concentrations established by the U.S. EPA and other government agencies. No reference concentrations are available for some elements such as Cu, Zn, Fe, and V, which have been associated with adverse health effects in particulate matter toxicology studies.
• Sixteen of the 18 elements being studied had higher median concentrations during the warm season (April through September) than during the cool season (October through March). This is consistent with the seasonal patterns exhibited by PM2.5 and sulfate, its most major component in Steubenville.
• Local sources in Steubenville contribute appreciably to ambient air concentrations of a number of elements in the water-soluble fraction of PM2.5. For 10 of the 18 elements being studied (Al, As, Ba, Ca, Cd, Fe, Mg, Mn, Na, and Zn), concentrations at Steubenville were greater than regional background concentrations at least 70% of the time. Mg, Mn, Zn, and Fe showed the greatest percent urban increment at Steubenville.
• Application of the Unmix source apportionment model to ionic and elemental data from the water-soluble fraction of PM2.5 samples collected at Steubenville resulted in a four-source solution. An ammonium sulfate-dominated source accounted for more than half of the total PM2.5 mass, and a source characterized by elevated concentrations of Mn and Zn accounted for more than 25% of the total PM2.5 mass. The estimated Mn/Zn ratio for this latter source was similar to the Mn/Zn ratio reported in EPA’s 2001 TRI for air emissions from Steubenville’s primary metals industry. In addition, PM2.5 contributions from this source were well correlated with local source contributions estimated from measured data, suggesting that this source represents the contributions of Steubenville’s primary metals industry (and perhaps other local industries) to ambient PM2.5 concentrations in that city. The remaining two sources were characterized by elevated concentrations of V and Cd; because of high uncertainties in the estimated source profiles, no definitive conclusions could be drawn regarding these sources.
The elemental composition of PM2.5 in Steubenville will be further analyzed based upon determinations of the elemental composition of the total (acid-digestible) fraction of PM2.5 samples collected during SCAMP. Results of these analyses will be presented in a future publication.
15

ACKNOWLEDGMENTS The authors thank all who participated in the collection and analysis of data presented here. This group includes Ohio University, Wheeling Jesuit University, Saint Vincent College, Franciscan University of Steubenville, Optimal Technologies, and the staff of CONSOL Energy Inc. Research & Development. The outdoor ambient air monitoring portion of SCAMP was funded by the United States Department of Energy’s National Energy Technology Laboratory. Additional funders of SCAMP include the Ohio Coal Development Office within the Ohio Air Quality Development Authority, Electric Power Research Institute, American Petroleum Institute, National Mining Association, American Iron and Steel Institute, Edison Electric Institute, National Institute of Environmental Health Sciences, U.S. Environmental Protection Agency, and CONSOL Energy Inc. This paper was prepared with the support of the U.S. Department of Energy, under Award No. DE-FC26-00NT40771. However, any opinions, findings, conclusions, or recommendations expressed herein are those of the authors and do not necessarily reflect the views of the DOE. REFERENCES 1. Dockery, D.W.; Pope, C.A.; Xu, X.; Spengler, J.D.; Ware, J.H.; Fay, M.E.; Ferris, B.G.;
Speizer, F.E. An Association between Air Pollution and Mortality in Six U.S. Cities; N. Engl. J. Med. 1993, 329, 1753-1759.
2. Connell, D.P.; Withum, J.A.; Winter, S.E.; Statnick, R.M.; Bilonick, R.A. The Steubenville
Comprehensive Air Monitoring Program (SCAMP): Overview and Statistical Considerations; J. Air & Waste Manage. Assoc., in press.
3. Connell, D.P.; Withum, J.A.; Winter, S.E.; Statnick, R.M.; Bilonick, R.A. The Steubenville
Comprehensive Air Monitoring Program (SCAMP): Associations Among PM2.5, Co-Pollutants, and Meteorological Conditions; J. Air & Waste Manage. Assoc., in press.
4. Connell, D.P.; Withum, J.A.; Winter, S.E.; Statnick, R.M.; Bilonick, R.A. The Steubenville
Comprehensive Air Monitoring Program (SCAMP): Analysis of Short-Term and Episodic Variations in PM2.5 Concentrations Using Hourly Air Monitoring Data; J. Air & Waste Manage Assoc., in press.
5. Koutrakis, P.; Spengler, J.D. Source Apportionment of Ambient Particles in Steubenville,
OH Using Specific Rotation Factor Analysis; Atmos. Environ. 1987, 21, 1511-1519. 6. Laden, F.; Neas, L.M.; Dockery, D.W.; Schwartz, J. Association of Fine Particulate Matter
from Different Sources with Daily Mortality in Six U.S. Cities; Environ. Health Perspect. 2000, 108, 941-947.
7. Conrad, V.B.; Winter, S.E.; Krofcheck, D.S. ICP-MS and X-Ray Fluorescence: A
Comparative Study for the Elemental Analysis of Fine Particulate Matter; Presented at the
16

International Symposium on Measurement of Toxic and Related Air Pollutants, Research Triangle Park, NC, September 2000.
8. Graney, J.R.; Landis, M.S.; Norris, G.A. Concentrations and Solubility of Metals from
Indoor and Personal Exposure PM2.5 Samples; Atmos. Environ. 2004, 38, 237-247. 9. Adamson, I.Y.; Prieditis, H.; Vincent, R. Pulmonary Toxicity of an Atmospheric Particulate
Sample is Due to the Soluble Fraction; Toxicol. Appl. Pharmacol. 1999, 157, 43-50. 10. Huang, Y.C.; Ghio, A.J.; Stonehuerner, J.; McGee, J.; Carter, J.D.; Grambow, S.C.; Devlin,
R.B. The Role of Soluble Components in Ambient Fine Particles-Induced Changes in Human Lungs and Blood; Inhal. Toxicol., 2003, 15, 327-342.
11. Connell, D.P.; Withum, J.A.; Winter, S.E.; Bilonick, R.A. The Steubenville Comprehensive
Air Monitoring Program (SCAMP): An Overview of Outdoor Ambient Results; In Proceedings of A&WMA’s 97th Annual Conference & Exhibition, Indianapolis, IN, June 22-25, 2004; A&WMA: Pittsburgh, PA, 2004; Paper 619.
12. Tanner, S.D.; Baranov, V.I. Theory, Design, and Operation of a Dynamic Reaction Cell for
ICP-MS; Atomic Spectroscopy, 1999, 20 (2), 45-52. 13. U.S. Environmental Protection Agency, Technology Transfer Network, Air Toxics Website.
“Sources of Chronic Dose-Response Information.” http://www.epa.gov/ttn/atw/toxsource/ chronicsources.html (accessed 12/24/04).
14. Wongphatarakul, V.; Friedlander, S.K.; Pinto, J.P. A Comparative Study of PM2.5 Ambient
Aerosol Chemical Databases; Environ. Sci. Technol. 1998, 32, 3926-3934. 15. Lewis, C.W.; Norris, G.A.; Conner, T.L.; Henry, R.C. Source Apportionment of Phoenix
PM2.5 Aerosol with the Unmix Receptor Model; J. Air & Waste Manage. Assoc. 2003, 53, 325-338.
16. U.S. Environmental Protection Agency, Toxics Release Inventory (TRI) Program.
http://www.epa.gov/tri (accessed 1/14/05). KEY WORDS PM2.5, dynamic reaction cell ICP-MS, source apportionment, Steubenville, air toxics
17