the elements of probability and statistics - buffalo.edu · ideas of probability basic statistics...
TRANSCRIPT

Ideas of ProbabilityBasic StatisticsSpread of items
DistributionMore Probability
Making Predictions
The Elements of Probability and Statistics
E. Bruce Pitman
The University at Buffalo
CCR Workshop – July 3, 2013
E. Bruce Pitman The Elements of Probability and Statistics

Ideas of ProbabilityBasic StatisticsSpread of items
DistributionMore Probability
Making Predictions
Outline
1 Ideas of Probability
2 Basic Statistics
3 Spread of items
4 Distribution
5 More Probability
6 Making Predictions
E. Bruce Pitman The Elements of Probability and Statistics

Ideas of ProbabilityBasic StatisticsSpread of items
DistributionMore Probability
Making Predictions
E. Bruce Pitman The Elements of Probability and Statistics

Ideas of ProbabilityBasic StatisticsSpread of items
DistributionMore Probability
Making Predictions
Definitions
The probability P of an event A is the fraction of possiblefavorable outcomes – the number of favorable outcomes f dividedby the total number of outcomes n.
P(A) = f /n
E. Bruce Pitman The Elements of Probability and Statistics

Ideas of ProbabilityBasic StatisticsSpread of items
DistributionMore Probability
Making Predictions
Definitions 2
The probability of drawing an ace from a standard deck of cards is4/52.What this really means is that if I draw one card from a deck andsee whether or not it is an ace and then replace the card andshuffle well, and repeat this exercise infinitely many times, thenover the long haul I will find an ace 7.69% of the time.
E. Bruce Pitman The Elements of Probability and Statistics

Ideas of ProbabilityBasic StatisticsSpread of items
DistributionMore Probability
Making Predictions
Definitions 3
However, suppose you are playing a game in which all outcomesare equally likely (e.g., rolling dice), and you are on a losing streak.You commit the Gamblers Fallacy if you believe your losing streakmakes it more likely that youll roll the numbers you want on thenext roll (because youre “due”). The truth is that your odds don’tchange; you start over with each roll.
E. Bruce Pitman The Elements of Probability and Statistics

Ideas of ProbabilityBasic StatisticsSpread of items
DistributionMore Probability
Making Predictions
Definitions 4
A sample space is the set of all possible outcomes of anexperiment.An event is a specific outcome of an experiment.So if you are rolling a die, the sample space is the setA = {1, 2, 3, 4, 5, 6}. The event ‘roll an odd number’ is the setE = {1, 3, 5}.
E. Bruce Pitman The Elements of Probability and Statistics

Ideas of ProbabilityBasic StatisticsSpread of items
DistributionMore Probability
Making Predictions
One perspective
E. Bruce Pitman The Elements of Probability and Statistics
Ideas of ProbabilityBasic StatisticsSpread of items
DistributionMore Probability
Making Predictions
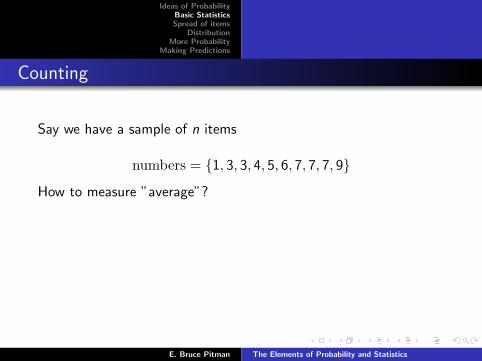
Counting
Say we have a sample of n items
numbers = {1, 3, 3, 4, 5, 6, 7, 7, 7, 9}
How to measure ”average”?
mean x = sumnumber = 1+3+3+4+5+6+7+7+7+9
10 = 5210 = 5.2
median = middle value = 5.5
mode is the item that occurs with the highest frequency = 7
E. Bruce Pitman The Elements of Probability and Statistics

Ideas of ProbabilityBasic StatisticsSpread of items
DistributionMore Probability
Making Predictions
More counting
For a different sample, say morenumbers = {1, 5, 7, 8, 9}, themean = 6 and the median = 7
E. Bruce Pitman The Elements of Probability and Statistics

Ideas of ProbabilityBasic StatisticsSpread of items
DistributionMore Probability
Making Predictions
Independent items
Two events are independent if the occurrence of one of the eventsgives us no information about whether or not the other event willoccur; that is, the events have no influence on each other.If events A and B are independent, then the probability of A and Bhappening is just the product p(A)p(B).If events are not independent, the joint probability is not theproduct – but we don’t know what it is without more information.
So, for instance, whether it rains tomorrow, and whether or nottomorrow is a friday, are - really - independent.
E. Bruce Pitman The Elements of Probability and Statistics
Ideas of ProbabilityBasic StatisticsSpread of items
DistributionMore Probability
Making Predictions
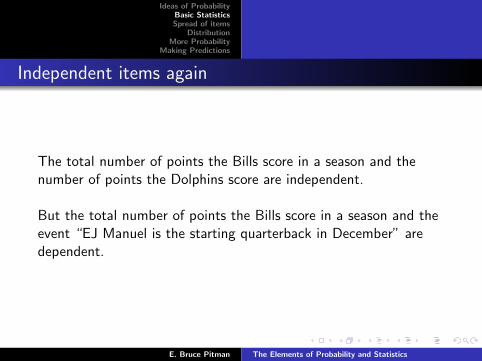
Independent items again
The total number of points the Bills score in a season and thenumber of points the Dolphins score are independent.
But the total number of points the Bills score in a season and theevent “EJ Manuel is the starting quarterback in December” aredependent.
E. Bruce Pitman The Elements of Probability and Statistics

Ideas of ProbabilityBasic StatisticsSpread of items
DistributionMore Probability
Making Predictions
So now we know some statistics
E. Bruce Pitman The Elements of Probability and Statistics

Ideas of ProbabilityBasic StatisticsSpread of items
DistributionMore Probability
Making Predictions
Variance
Variance is how wide of a spread is pesent in the data
σ2 =1
n − 1
n∑j=1
(x − x)2
For morenumbers, we have
σ2 =1
4[(1− 6)2 + (5− 6)2 + (7− 6)2 + (8− 6)2 + (9− 6)2]
=1
4[25 + 1 + 1 + 4 + 9] =
1
4(40) = 10
The standard deviation is the square root of the variance =√σ2
For our data, σ =√
10
E. Bruce Pitman The Elements of Probability and Statistics

Ideas of ProbabilityBasic StatisticsSpread of items
DistributionMore Probability
Making Predictions
Quartiles
Divide the sample set into quarters and plot the marks of first andthird quartile.
Think of it this way - the first quartile is the median of the itemsbelow
¯the median. The third quartile is median of the items above
¯the median.
One could do a similar thing in tenths.
E. Bruce Pitman The Elements of Probability and Statistics

Ideas of ProbabilityBasic StatisticsSpread of items
DistributionMore Probability
Making Predictions
Box plot
A diagram that show the maximum, minimum, the first and thirdquartiles, and the median.boxnumbers = {12, 20, 35, 38, 45, 60, 62, 70, 78, 90, 99}
If there are a whole lot of numbers and the max/min are way out,you sometimes mark the 10% and 90% points.
E. Bruce Pitman The Elements of Probability and Statistics

Ideas of ProbabilityBasic StatisticsSpread of items
DistributionMore Probability
Making Predictions
Histogram
Plot items using rectangles to represent the number of itemswithin a range of values.agenumbers = {1, 2, 2, 3, 3, 3, 3, 4, 4, 5, 6}
E. Bruce Pitman The Elements of Probability and Statistics

Ideas of ProbabilityBasic StatisticsSpread of items
DistributionMore Probability
Making Predictions
Histograms
You need to decide how many rectangles to include. Too fewdoesn’t give a sense of numbers and frequency.
Too many is both more work and often doesn’t give a goodfrequency reading – most of the time the numbers who appear areunique.
This is referred to as “binning”.
E. Bruce Pitman The Elements of Probability and Statistics

Ideas of ProbabilityBasic StatisticsSpread of items
DistributionMore Probability
Making Predictions
More histograms
Name Grade
Bullwinkle 84Rocky 91Bugs 75Daffy 68Wylie 98Mickey 78Minnie 77Lucy 86Linus 94Charlie 64Patty 59Donld 54Sam 89Taz 76E. Bruce Pitman The Elements of Probability and Statistics

Ideas of ProbabilityBasic StatisticsSpread of items
DistributionMore Probability
Making Predictions
More histograms-2
E. Bruce Pitman The Elements of Probability and Statistics

Ideas of ProbabilityBasic StatisticsSpread of items
DistributionMore Probability
Making Predictions
More histograms-3
E. Bruce Pitman The Elements of Probability and Statistics

Ideas of ProbabilityBasic StatisticsSpread of items
DistributionMore Probability
Making Predictions
Normal Distribution
What happens then when there are infinitely many bins - one forevery real number? You get a probability distribution – a function.The grandaddy of distributions is the “Normal distribution”. Thenormal distribution is the bell-shaped distribution you haveprobably seen.
E. Bruce Pitman The Elements of Probability and Statistics
Ideas of ProbabilityBasic StatisticsSpread of items
DistributionMore Probability
Making Predictions
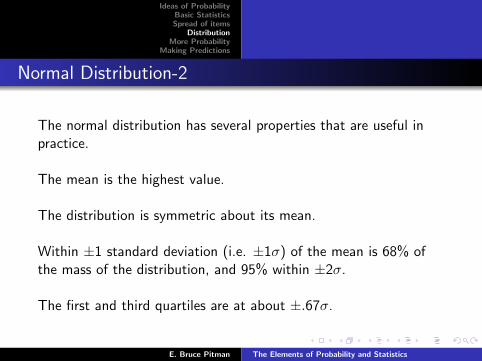
Normal Distribution-2
The normal distribution has several properties that are useful inpractice.
The mean is the highest value.
The distribution is symmetric about its mean.
Within ±1 standard deviation (i.e. ±1σ) of the mean is 68% ofthe mass of the distribution, and 95% within ±2σ.
The first and third quartiles are at about ±.67σ.
E. Bruce Pitman The Elements of Probability and Statistics

Ideas of ProbabilityBasic StatisticsSpread of items
DistributionMore Probability
Making Predictions
Normal Distribution-3
E. Bruce Pitman The Elements of Probability and Statistics

Ideas of ProbabilityBasic StatisticsSpread of items
DistributionMore Probability
Making Predictions
Other distributions
Log-normal, Chi, and there are others.Useful in many applications.But they (usually) don’t have the nice properties above.(Although, for example, the log-nomal is always positive.)
E. Bruce Pitman The Elements of Probability and Statistics

Ideas of ProbabilityBasic StatisticsSpread of items
DistributionMore Probability
Making Predictions
Scatter plot
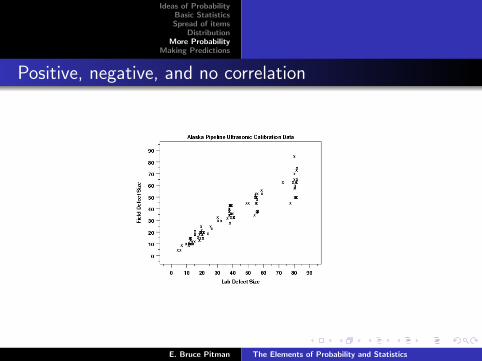
A scatter plot is a diagram showing two variables of a dataset.
E. Bruce Pitman The Elements of Probability and Statistics

Ideas of ProbabilityBasic StatisticsSpread of items
DistributionMore Probability
Making Predictions
Conditional probability
If a probability represent the odds of something happening – saythe odds of event A happening, or p(A), then the “conditionalprobability” is the odds of something happening given additionalinformation – the odds of A given that B has occurred, or p(A|B).
Lots of words but the idea is simple. A conditional probabilityaccounts for additional information that informs the odds.
So the odds of rolling a 3 with a single die is 1/6. What is theconditional probability of rolling a 3 given the roll was odd? It is1/3. That is, A = {1, 3, 5}, so P(3|odd) = 1/3.
E. Bruce Pitman The Elements of Probability and Statistics

Ideas of ProbabilityBasic StatisticsSpread of items
DistributionMore Probability
Making Predictions
Conditional probability-2
Formally the conditional probability is given as
p(A|B) =p(A ∩ B)
p(B)
Notice how this works for rolling a 3. Since rolling a 3 and rollingan odd number are dependent, the probability of rolling a 3 ANDodd is the same as rolling a 3.
p(3|odd) = p(3∩odd)p(odd) = 1/6
1/2 = 1/3
E. Bruce Pitman The Elements of Probability and Statistics

Ideas of ProbabilityBasic StatisticsSpread of items
DistributionMore Probability
Making Predictions
Exercise in counting
A fair coin is flipped three times. What is the probability of atleast one head? Given that the first flip came up tails, what is theprobability of at least one head?
E. Bruce Pitman The Elements of Probability and Statistics

Ideas of ProbabilityBasic StatisticsSpread of items
DistributionMore Probability
Making Predictions
Exercise in counting-2
The sample spaceS = {HHH,HHT ,HTH,THH,HTT ,THT ,TTH,TTT}.The event “at least 1 head” isE1 = {HHH,HHT ,HTH,THH,HTT ,THT ,TTH} which has a7/8 probability.The event “first flip tails” is E2 = {THH,THT ,TTH,TTT}. SoP(at least one head|first flip tails) = 3/4.
E. Bruce Pitman The Elements of Probability and Statistics

Ideas of ProbabilityBasic StatisticsSpread of items
DistributionMore Probability
Making Predictions
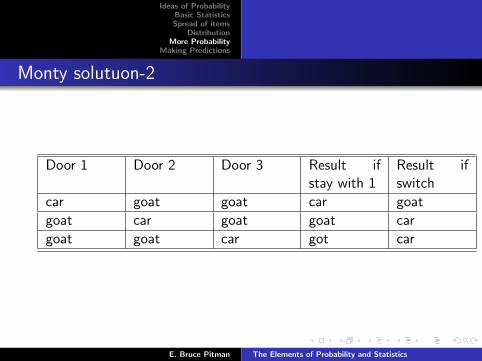
Monty Hall problem
Monty lets you choose a door from 3 possibilities. Behind one ofthe doors is a new car, behind the other two are goats. You choosea door. Monty reveals what is behind one of the remaining doors(he knows where the car is), and asks you Do you want to switchdoors or stick with your original choice?What should you do?
E. Bruce Pitman The Elements of Probability and Statistics

Ideas of ProbabilityBasic StatisticsSpread of items
DistributionMore Probability
Making Predictions
Monty solution
E. Bruce Pitman The Elements of Probability and Statistics
Ideas of ProbabilityBasic StatisticsSpread of items
DistributionMore Probability
Making Predictions
Monty solutuon-2
Door 1 Door 2 Door 3 Result ifstay with 1
Result ifswitch
car goat goat car goat
goat car goat goat car
goat goat car got car
E. Bruce Pitman The Elements of Probability and Statistics

Ideas of ProbabilityBasic StatisticsSpread of items
DistributionMore Probability
Making Predictions
Conditional probability again
One half percent of the population has a particular disease. A testis developed for the disease. The test gives a false positive 3% ofthe time and a false negative 2% of the time.(a) What is the probability that Joe (a random person) testspositive?(b) Joe just got the bad news that the test came back positive;what is the probability that Joe has the disease?
E. Bruce Pitman The Elements of Probability and Statistics

Ideas of ProbabilityBasic StatisticsSpread of items
DistributionMore Probability
Making Predictions
Conditional probability again-2
Let D be the event that Joe has the disease, ND that he doesn’t.Let T be the event that Joe’s test comes back positive. We aretold that p(D) = 0.005, since 1/2% of the population has thedisease, and Joe is just an average guy. We are also told thatp(T |D) = .98 since 2% of the time a person having the disease ismissed (false negative). We are told that p(T |ND) = .03 sincethere are 3% false positives.(a) We want to compute p(T ). We do so by conditioning onwhether or not Joe has the disease:
p(T ) = p(T |D)p(D) + p(T |ND)p(ND)
= (.98)(.005) + (.03)(.995) = 0.03475
E. Bruce Pitman The Elements of Probability and Statistics

Ideas of ProbabilityBasic StatisticsSpread of items
DistributionMore Probability
Making Predictions
Conditional probability-3
(b) We want to compute
p(D|T ) =p(D ∩ T )
p(T )=
p(T |D)p(D)
p(T |D)p(D) + p(T |ND)p(ND)
=(.98)(.005)
(.98)(.005) + (.03)(.995)= .14
What a relief! There is only a 14% chance Joe has the disease,even though the test came back positive! The issue here is thatthe false-positive and false-negative percentages are in fact high,relative to the occurrence of the disease.
Why such a low chance that Joe is ill?
E. Bruce Pitman The Elements of Probability and Statistics

Ideas of ProbabilityBasic StatisticsSpread of items
DistributionMore Probability
Making Predictions
Conditional probability -4
The background rate is very low – half of a percent. And thecorresponding false positive rate is (relatively) large.Consider that happens is the background rate is 5%? Repeatingthe calculation
p(D|T ) =p(D ∩ T )
p(T )=
p(T |D)p(D)
p(T |D)p(D) + p(T |ND)p(ND)
=(.98)(.05)
(.98)(.05) + (.03)(.95)= .63
A huge change!!
E. Bruce Pitman The Elements of Probability and Statistics

Ideas of ProbabilityBasic StatisticsSpread of items
DistributionMore Probability
Making Predictions
Conditional probability -5
A different way of thinking about what is happening:
Out of a thousand people, 5 will be ill
Of these 5, all of them (just about) will get a positive test
But 30 other people will also test positive for the disease (3%)
So 35 people out one thousand test positive...but only 1/7 ofthem are ill!!
Notice that in the alternative scenario with a 5% background rate,you would see 50 out of a thousand who are ill and will testpositive, in addition to the 30 false positives – thus the 63%.
E. Bruce Pitman The Elements of Probability and Statistics

Ideas of ProbabilityBasic StatisticsSpread of items
DistributionMore Probability
Making Predictions
So now we know more statistics
E. Bruce Pitman The Elements of Probability and Statistics

Ideas of ProbabilityBasic StatisticsSpread of items
DistributionMore Probability
Making Predictions
Correlation and causation
In statistics, dependence refers to any statistical relationshipbetween two random variables or two sets of data. Correlationrefers to any of a broad class of statistical relationships involvingdependence.Because two things are correlated does not mean one causes theother.A correlation between age and height in children is fairly causallytransparent, but a correlation between mood and health in peopleis less so. Does improved mood lead to improved health, or doesgood health lead to good mood, or both? Or does some otherfactor underlie both? In other words, a correlation can be taken asevidence for a possible causal relationship, but cannot indicatewhat the causal relationship, if any, might be.
E. Bruce Pitman The Elements of Probability and Statistics

Ideas of ProbabilityBasic StatisticsSpread of items
DistributionMore Probability
Making Predictions
Measure of correlation
There is a definition of a coefficient of correlation
ρ(X ,Y ) =E [(X − x)(Y − y)]
σXσY
E. Bruce Pitman The Elements of Probability and Statistics
Ideas of ProbabilityBasic StatisticsSpread of items
DistributionMore Probability
Making Predictions
Positive, negative, and no correlation
E. Bruce Pitman The Elements of Probability and Statistics

Ideas of ProbabilityBasic StatisticsSpread of items
DistributionMore Probability
Making Predictions
Positive, negative, and no correlation-2
E. Bruce Pitman The Elements of Probability and Statistics

Ideas of ProbabilityBasic StatisticsSpread of items
DistributionMore Probability
Making Predictions
Positive, negative, and no correlation-3
E. Bruce Pitman The Elements of Probability and Statistics

Ideas of ProbabilityBasic StatisticsSpread of items
DistributionMore Probability
Making Predictions
Correlation and causation-2
In a widely studied example, numerous epidemiological studiesshowed that women who were taking combined hormonereplacement therapy (HRT) also had a lower-than-averageincidence of coronary heart disease (CHD), leading doctors topropose that HRT was protective against CHD. But randomizedcontrolled trials showed that HRT caused a small but statisticallysignificant increase in risk of CHD. Re-analysis of the data fromthe epidemiological studies showed that women undertaking HRTwere more likely to be from higher socio-economic groups, withbetter-than-average diet and exercise regimens. The use of HRTand decreased incidence of coronary heart disease were coincidenteffects of a common cause (i.e. the benefits associated with ahigher socioeconomic status), rather than cause and effect, as hadbeen supposed.
E. Bruce Pitman The Elements of Probability and Statistics
Ideas of ProbabilityBasic StatisticsSpread of items
DistributionMore Probability
Making Predictions
Correlation and causation-3
As ice cream sales increase, the rate of drowning deaths increasessharply. Therefore, ice cream consumption causes drowning.
E. Bruce Pitman The Elements of Probability and Statistics

Ideas of ProbabilityBasic StatisticsSpread of items
DistributionMore Probability
Making Predictions
Correlation and causation-4
E. Bruce Pitman The Elements of Probability and Statistics

Ideas of ProbabilityBasic StatisticsSpread of items
DistributionMore Probability
Making Predictions
Correlation and causation-5
Feeding children a diet rich in fish could prevent violent andanti-social behaviour in their teens, according to research to beannounced this week which suggests the root causes of crime maybe biological rather than social. The study raises major questionsover the extent to which criminals exercise free will, as well asfuelling fresh debate over whether simple childhood interventionsmight be more use in preventing crime than blaming parents ororganising draconian crackdowns on crime.
E. Bruce Pitman The Elements of Probability and Statistics

Ideas of ProbabilityBasic StatisticsSpread of items
DistributionMore Probability
Making Predictions
Correlation and causation-6
E. Bruce Pitman The Elements of Probability and Statistics

Ideas of ProbabilityBasic StatisticsSpread of items
DistributionMore Probability
Making Predictions
Statistical Predictions
If you have a large sample size, you can make predictions aboutbehavior in the aggregate.For example, Amazon uses your own buying habits and those ofothers like you, to give you recommendations for other purchases.The Federal Reserve makes predictions on the growth of theeconomy.
E. Bruce Pitman The Elements of Probability and Statistics

Ideas of ProbabilityBasic StatisticsSpread of items
DistributionMore Probability
Making Predictions
Statistical Predictions - 2
A different kind of prediction arises from statistical transitions. Forexample, data on home ownership shows that, if you live in a singlefamily home currently, odds are 95% that you will be in a singlefamily home next year. On the other hand, if you live in anapartment/multi-household setting currently, odds are 15% thatyou will live in a single family unit next year. We have enough datato be able to make a claim like this.
E. Bruce Pitman The Elements of Probability and Statistics

Ideas of ProbabilityBasic StatisticsSpread of items
DistributionMore Probability
Making Predictions
Statistical Predictions - 3
We can create an array that explains the situation, showing thecurrent status on the left, and your status next year from the top. single multi
single 0.95 0.05multi 0.15 0.85
You can repeat this for subsequent years too.
E. Bruce Pitman The Elements of Probability and Statistics

Ideas of ProbabilityBasic StatisticsSpread of items
DistributionMore Probability
Making Predictions
Statistical Predictions - 4
Be wary of the variability in your predictions.The average weather in WNY is 53◦ and a 40% chance ofprecipitation.The varibility – that is, variance – matters!
E. Bruce Pitman The Elements of Probability and Statistics

Ideas of ProbabilityBasic StatisticsSpread of items
DistributionMore Probability
Making Predictions
Now that you are an expert
E. Bruce Pitman The Elements of Probability and Statistics