‘the european cluster landscape:
DESCRIPTION
European Commission. Enterprise and Industry DG. ‘The European cluster landscape: Project and networks for clusters and small and medium-sized companies' Aachen, 19 October 2006. Astrid Severin European Commission DG Enterprise & Industry Innovation Policy Development. - PowerPoint PPT PresentationTRANSCRIPT

Astrid SeverinEuropean Commission
DG Enterprise & IndustryInnovation Policy Development
European CommissionEnterprise and Industry DG
‘The European cluster landscape:
Project and networks for clusters and small and medium-sized companies'
Aachen, 19 October 2006

Why European cluster projects networks?
• Strong interest of Member States and regions (National reform programmes)
• Strong interest at company level (Innobarometer Survey 2006)
• Phenomenon of globalisation > company partnerships before launching into the global market
• Closer cooperation of industry and research

Why European cluster projects networks?
• Common market > choosing dynamic, innovation-friendly locations!
• Need for smart local innovation systems attracting:– Competent people– Entrepreneurs and innovative companies– Researchers and research institutions– Investors, …

The role of the European Commission
• Providing a European dimension to cluster activities > internationalisation
• Commission Communication “Putting knwledge into practice: A broad-based innovation strategy for the EU” > importance of trans-national cluster cooperation
• European cluster networks and projects > no subsidies for clusters
Building blocks of European cluster activities
• Europe INNOVA– Cluster mapping– Networking of clusters at
sectoral level
• PRO INNO Europe– Trans-national cooperation at
policy level– Joint actions

Why Cluster Mapping ?
• level of regional specialisation
• competitive strengths and weaknesses
• statistical development of a given cluster
• monitor the evolution of clusters in a region

Methodology
• Porter’s cluster methodologyVery few efforts in EU so far: UK, SE
• EUROSTAT data except for EE, LA, SL, CY from National Institutes
• Employment data 41 NUTS-2 regions, 38 cluster categories
• 10 country visits (qualitative information)

41 Nuts-2 Regions and 38 cluster categories

Cluster and cluster policy mapping
Employment size (a star, if > 15.000 employees)
Degree of dominance ( a star, if > 7% cluster sector employment in a
location) Degree of specialization (a star, if >75% more employment
in a given sector)
21 clusters
137 clusters
365 clusters
Statistical findings

Apparel
Food Processing
Textiles
Financial Services
Fishing Products
Hospitality and Tourism
Oil & Gas
Tobacco
Building Fixtures and Services
Construction Materials
Education and Knowledge Creation
Transportation and Logistics
‘Star’ cut-off
Cluster and cluster policy mapping
Reg
iona
l Clu
ster
Por
tfol
ios:
Lith
uani
a
0,0
0,5
1,0
1,5
2,0
2,5
3,0
0% 2% 4% 6% 8% 10% 12% 14%

Cluster and cluster policy mapping
0 2 4 6 8 10 12 14 16 18
Ostrava, CZKielce, PLOpole, PL
Ústí nad Labem, CZMalta
Olsztyn, PLSzeged, HU
CyprusSzékestehérvár, HU
Białystok, PLDebrecen, HU
Žilina, SKLublin, PLGyör, HU
Košice, SKEstonia
Plzén, CZRzeszów, PLSzczecin, PL
Bratislava, SKPraha Region, CZ
LatviaGdańsk, PL
PécsGorzów Wielkopolski, PL
Brno, CZOlomouc, CZ
Nitra, SKŁódź, PL
Praha City, CZMiskolc, HU
Bydgoszcz, PLSlovenia
Wrocław, PLLiberec, CZ
LithuaniaPoznań, PLKraków, PL
Budapest, HUKatowice, PL
Warszawa, PL
3 stars
2 stars
1 star
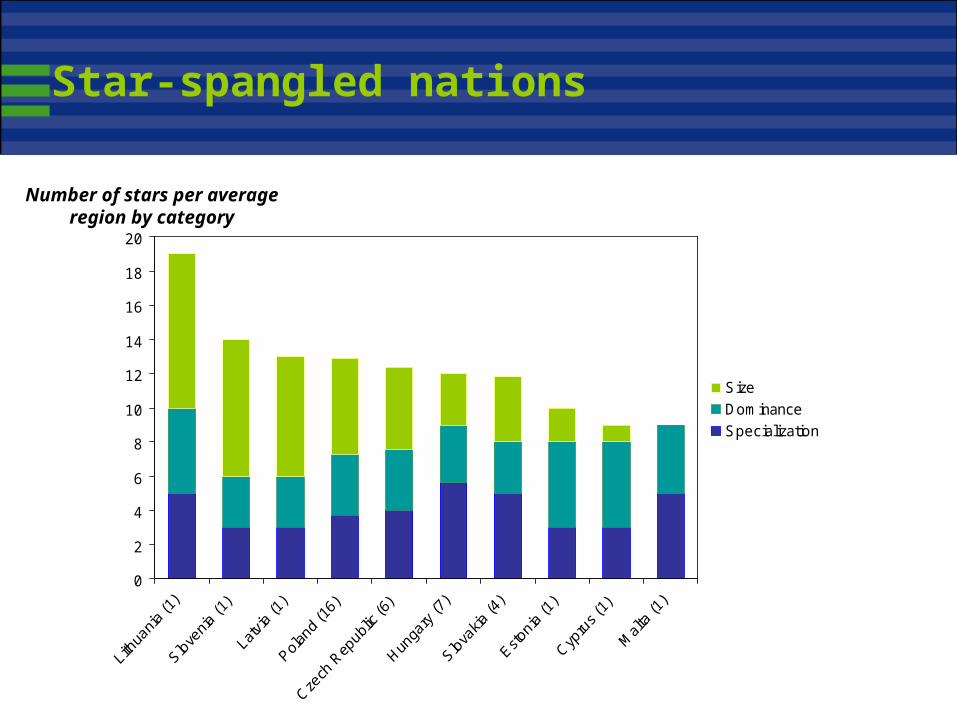
Star-spangled nations
0
2
4
6
8
10
12
14
16
18
20
Size
Dominance
Specialization
Number of stars per average region by category

Star-spangled nations: changes in star clusters
-4 -2 0 2 4 6 8 10
DebrecenUsti nadSlovenia
GyörGdansk
PrahaLithuania
LatviaKielceOpole
BrnoGorzów
MaltaSzékesteh
CyprusOstrava
WarszawaPlzén
EstoniaSzczecin
ZilinaBialystok
Praha CityOlomouc
LodzPoznanOlsztyn
NitraBratislava
LiberecPécs
MiskolcSzeged
LublinBudapestRzeszów
KrakówWroclaw
KosiceKatowice
Bydgoszcz
3 stars
2 stars
1 star
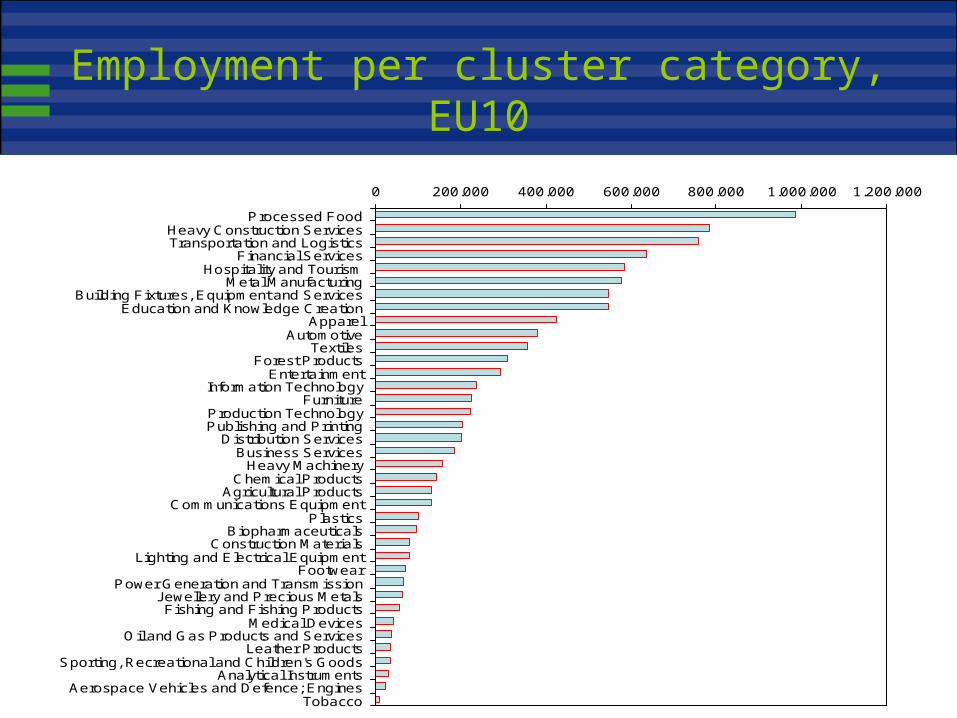
Employment per cluster category, EU10
0 200.000 400.000 600.000 800.000 1.000.000 1.200.000
Processed FoodHeavy Construction ServicesTransportation and Logistics
Financial ServicesHospitality and Tourism
Metal ManufacturingBuilding Fixtures, Equipment and Services
Education and Knowledge CreationApparel
AutomotiveTextiles
Forest ProductsEntertainment
Information TechnologyFurniture
Production TechnologyPublishing and Printing
Distribution ServicesBusiness Services
Heavy MachineryChemical Products
Agricultural ProductsCommunications Equipment
PlasticsBiopharmaceuticals
Construction MaterialsLighting and Electrical Equipment
FootwearPower Generation and Transmission
Jewellery and Precious MetalsFishing and Fishing Products
Medical DevicesOil and Gas Products and Services
Leather ProductsSporting, Recreational and Children's Goods
Analytical InstrumentsAerospace Vehicles and Defence; Engines
Tobacco

Employment changes per cluster category, EU10
-40.000
-20.000
0
20.000
40.000
60.000
80.000
100.000
120.000
140.000

Key observations: Regional dimension
• Specialization profile of the EU-10– Overrepresented natural resource-driven sector– Bias towards labour-intensive and manufacturing-driven cluster categories– Weak in advanced services and knowledge-intensive cluster categories
• Specialization profile across regions of the EU-10– Large differences across regions in terms of specialization – The absolute employment level in a region is one important driver– Strong indications that legacy, location, and specific business environment
conditions, policies and institutions are important drivers as well
• Changes in specialization profile– Clear evidence of tremendous structural change in terms of regions’
specialization– Initial conditions (total size, established position) do not guarantee success or
predetermine failure
• Specialization and economic performance– Clear evidence of the strengths of regional cluster portfolios being an important
determinants of economic performance

Key observations: The cluster dimension
• Level of geographic concentration in the cluster sector– Significantly lower than in the U.S. but only slightly lower than in
the EU-15
• Geographic concentration profile across cluster categories in the EU-10– Large differences across cluster categories in geographic
concentration
• Changes in specialization profile– Clear evidence of tremendous structural change in terms of
geographic distribution of activities within cluster categories

Policy recommendations: Enhancing geographical specialisation
• Europe needs to create better conditions for regional clusters to develop
• Pursue further market integration in Europe
• Mobilize European policies to facilitate structural change
• Remove European policies that work against structural change

Europe needs to create better conditions for regional cluster initiatives to increase the effectiveness of regional clusters:
•Create a widely-available European cluster mapping database
•Invest in metrics and data to measure the impact of cluster policies
•Launch a European cluster initiative alliance to spread best practices
•Provide a methodology tool box available for cluster initiatives
•Support the creation of networks of regional clusters
Policy recommendations

Cluster mapping: next steps
• Cluster Mapping study in EU 15 + Bulgaria, Romania, Turkey, Norway, Switzerland, Iceland and Israel
• Same methodology
• European Cluster database for the first time end 2007
• Better idea for cluster policies at national, regional and sectoral level

Europe INNOVA
• Networking of clusters at sectoral level– Joint business strategies– Joint (research) projects– Workshops / training for
cluster managers– Etc…
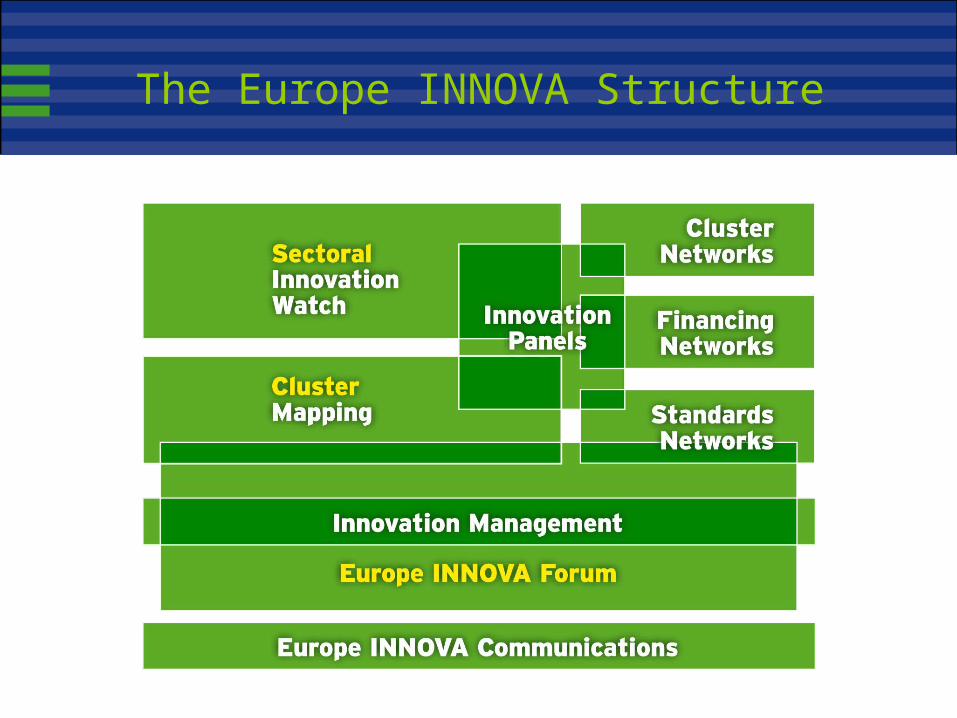
The Europe INNOVA Structure

Europe INNOVA cluster networks
• Automotive: BELCAR, TCAS• Biotechnology: NETBIOCLUE• Eco-innovation: CENCE• Food: ABC-Network• ICT: OMNI-NET
mCLUSTERSNICE
• Optics: ENOC• Space: CASTLE• Textile: INNOTEX

The Europe INNOVA Conference
• Valencia, 26-28 Nov 2006• Two awards:
– ‘ClusterPreneur of the Year’ - the initiator and driving force behind the change to a more innovative and competitive cluster
– ‘Cluster Manager of the Year’ - the professional coordinator and facilitator responsible for the implementation of joint actions in the cluster

PRO INNO Europe
• Trans-national cooperation at policy level– Launch joint regional calls – Implement joint
programmes– Integrated efforts– Etc…

PRO INNO Europe Cluster AlliancePRO INNO Europe Cluster Alliance
BSR InnoNetThe Baltic Sea Region Innovation Network
Coordinator.: Nordic Innovation Centre (NO)
12 Partners:
Nordic Council of Ministers (DK)VINNOVA (SE)Ministry of Economic & Business Affairs – FORA (DK)TEKES (FI)Innovation Norway (NO)TBI Technologie-Beratungs-Institut GmbH (DE)Enterprise Estonia (EE)Estonian Ministry of Economic Affairs and Communications (EE)Latvian Investment and Development AgencyZachodniopomorska Agencja Rozwoju Regionalnego S.A. (PL)Viesoji istaiga Lietuvos inovaciju centras (LT)Icelandic Centre for Research (ICL)
PRO INNO Cluster MemorandumPRO INNO Cluster Memorandum
Cluster Advisory Group20 Members representing national and regional
governments and cluster experts
Europe INNOVA Cluster Mapping
Coordinator: Stockholm School of Economics - Centre for Strategy and Competitiveness (SE)
Partners: The Cluster Competitiveness Group, S.A.Competitiveness (ES)Fondation Sophia Antipolis (FR)Oxford Research AS (NO)
INNETNetworking of national/regional funding and innovation organisations for the involvement of SMEs in technology-based innovation clusters in Europe.
Coordinator: OSEO anvar (FR)
17 Partners:
Region Ile-de-France (FR)Ville de Grenoble (FR)VDI/VDE Innovation + Technik GmbH(DE)ZAB ZukunftsAgentur Brandenburg GmbH (DE) TSB Technology Foundation Berlin (DE)City of Dresden (DE)Pera Innovation Ltd (UK)East Midlands Development Agency (UK)Sviluppo Italia Toscana (IT)Veneto Innovazione (IT)Centro para el Desarrollo Technologico Ind (ES)Ministry of Industry, Tourism and Trade, SME (ES)Asociacion Eurobulegoa Agencia Vasca (ES)IWT (B)Innovationsbron (SE)Hellenic Oerganisation of SMEs & Handicraft (GR)Polish Agency for Enterprise Development (PL)
CEE-ClusterNetworkCluster policy Networking and exchange via the themes of internationalisation and incubation
Coordinator: Oberoesterreichische Technologie- und
Marketinggesellschaft m.b.H.TMG (AT)
10 Partners:
Ecoplus (AT)Innovations und Technologietr Salzburg (AT)Tiroler Zukunftsstiftung (AT)CAN-S-Tirol (IT)Czechinvest - Investment and
Business Development Agency (CZ)West Pannon Regional Devel. Agency (HU)Mariborska razvojna agencija (SI)BIC Bratislava spol. s r.o. (SK)Industrial Development Agency (PL)Autonome Provinz Bozen (IT)
CLUNET
Cluster policy Networking and exchange via the themes of internationalisation and incubation
Coordinator: Northwest Development Agency (UK)
14 Partners:
Ministry of Economic and Labour Affairs Hamburg (DE)Economic Development Dept. Karlsruhe (DE)ZAB ZukunftsAgentur Brandenburg GmbH (DE)Fundacion para el Conocimiento madri+d (ES)Instituto Technologico de Aragon (ES)Region Abruzzo (IT)Finanziaria Laziale di Sviluppo – FILAS (IT)Etruria Innovazionz ScPA (IT)Mediterranee Technologies (FR)Bretagne Innovation (FR)One NorthEast (UK)Municipality of Ljubjana (SI)South Great Plain Regional Devel. Agency (HU)Lahti Regional development Agency Ltd (FI)

Further information at:
www.europe-innova.org