the european forest and agricultural sector optimization model (eufasom) uwe a. schneider research...
Post on 20-Dec-2015
220 views
TRANSCRIPT

The European Forest and The European Forest and Agricultural Sector Optimization Agricultural Sector Optimization
Model (EUFASOM)Model (EUFASOM)
Uwe A. SchneiderUwe A. Schneider
Research Unit Sustainabilty and Global ChangeResearch Unit Sustainabilty and Global Change
Hamburg UniversityHamburg University

FASOM HistoryFASOM History
US (1993)US (1993)
EU (2004)EU (2004)
Global (2006)Global (2006)

FASOMFASOM
Partial Equilibrium Model Partial Equilibrium Model
Maximizes sum of consumer and producer Maximizes sum of consumer and producer surplussurplus
Constrained by resource endowments, Constrained by resource endowments, technologies, policiestechnologies, policies
Spatially explicit, discrete dynamicSpatially explicit, discrete dynamic
Integrates environmental effectsIntegrates environmental effects
Programmed in GAMSProgrammed in GAMS

Purpose and ObjectivesPurpose and Objectives
To To advice policy makersadvice policy makers about the about the agricultural and forestry sector response agricultural and forestry sector response to to structural changesstructural changes
a)a) PoliciesPolicies
b)b) Environmental changeEnvironmental change
c)c) Technical changeTechnical change
d)d) Socioeconomic changeSocioeconomic change
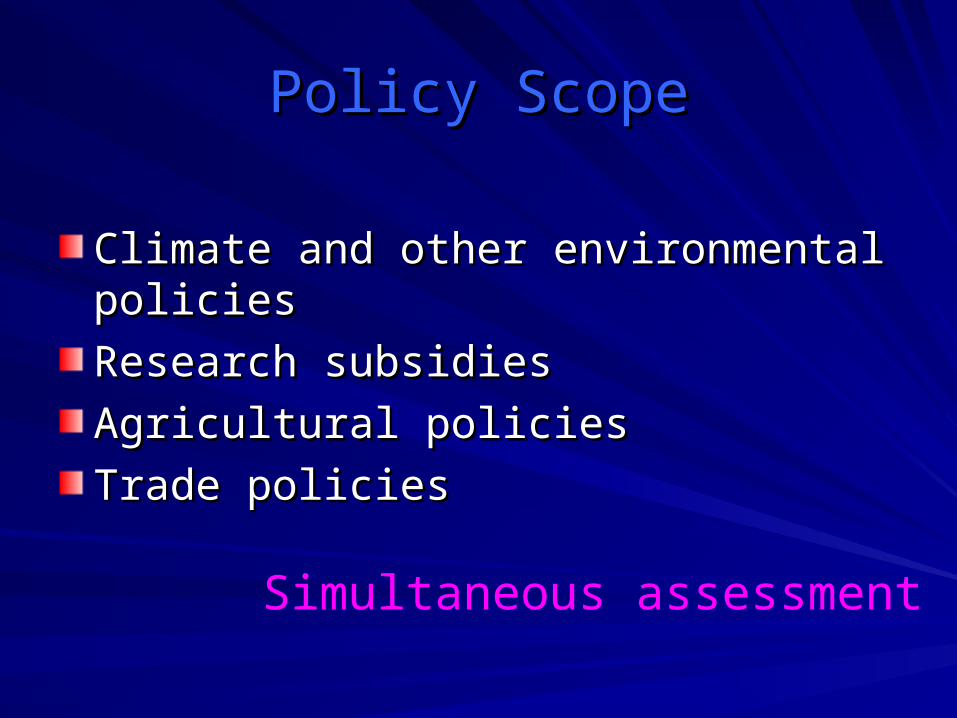
Policy ScopePolicy Scope
Climate and other environmental policiesClimate and other environmental policies
Research subsidiesResearch subsidies
Agricultural policiesAgricultural policies
Trade policiesTrade policies
Simultaneous assessment

FoodTimberFiber
BioenergyBiomaterial
Carbon Sinks
Land use competition Nature
Reserves
SealedLand
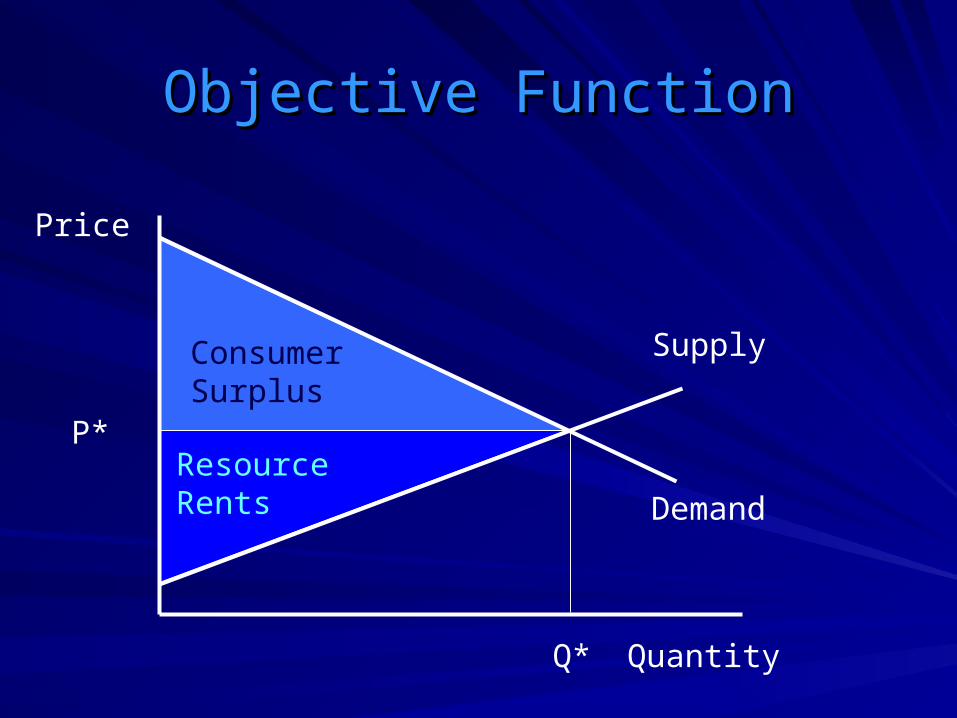
Objective FunctionObjective Function
Demand
Supply
Price
Quantity
P*
Q*
ResourceRents
ConsumerSurplus

Surplus MaximizationSurplus Maximization
Impl
icit
Sup
ply
and
Dem
and
For
est I
nven
tory
Lan
d S
uppl
yW
ater
Sup
ply
Lab
or S
uppl
yA
nim
al S
uppl
yN
atio
nal I
nput
s
Impo
rt S
uppl
y
Pro
cess
ing
Dem
and
Fee
d D
eman
dD
omes
tic D
eman
dE
xpor
t Dem
and
CS
P
S
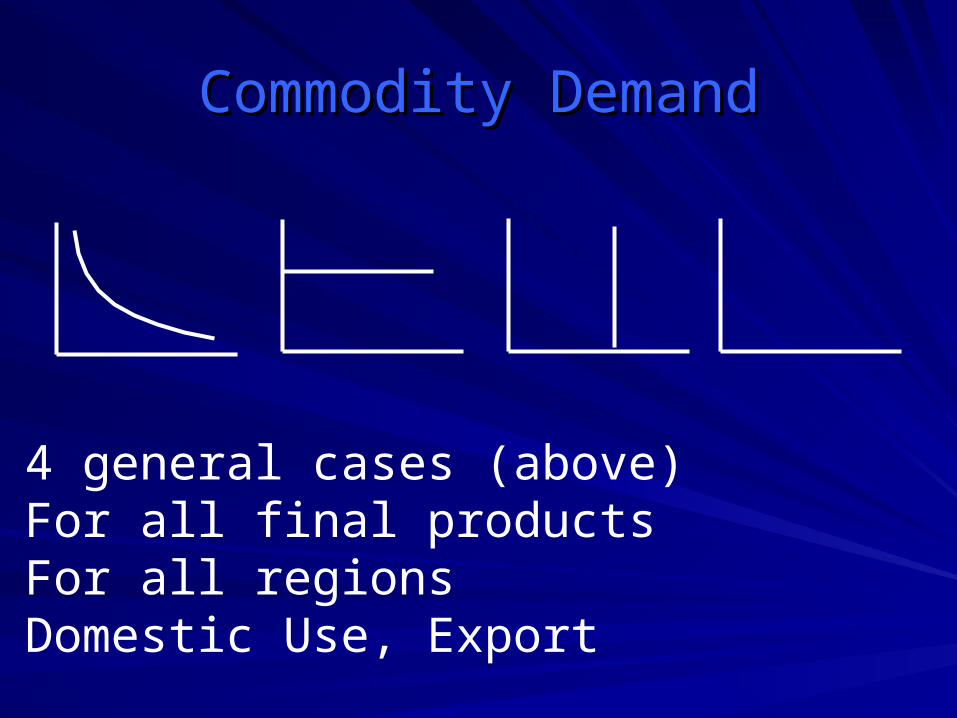
Commodity DemandCommodity Demand
• 4 general cases (above) • For all final products• For all regions• Domestic Use, Export

Model StructureModel Structure
Resources Land Use
Technologies
Processing Technologies
Products Markets
Inputs
Limits
Supply Functions
Limits
Demand Functions,Trade
Limits
Environmental Impacts

Processing
Markets
Feed mixing
Labor
Pasture
Other Inputs
Cropland
Water
Livestock production
Forestry, Nature,Crop
productionExport
Domestic demand
Import
Model StructureModel StructureForest
Inventory
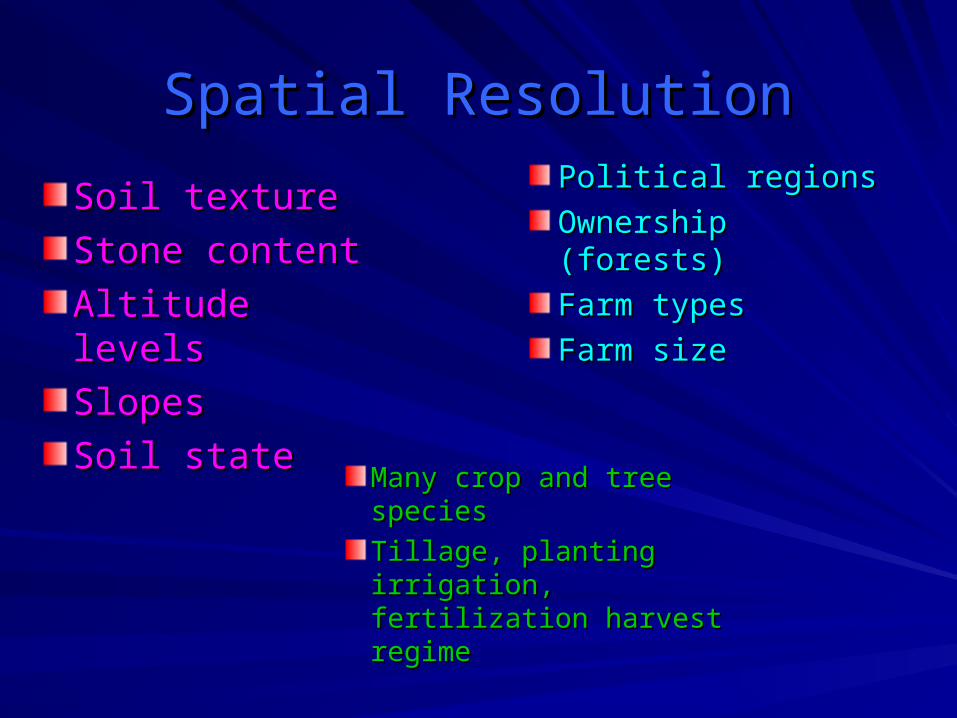
Spatial ResolutionSpatial Resolution
Soil textureSoil texture
Stone contentStone content
Altitude levelsAltitude levels
SlopesSlopes
Soil stateSoil state
Political regionsPolitical regions
Ownership (forests)Ownership (forests)
Farm typesFarm types
Farm sizeFarm size
Many crop and tree Many crop and tree speciesspecies
Tillage, planting Tillage, planting irrigation, fertilization irrigation, fertilization harvest regimeharvest regime

Altitude:1. < 300 m2. 300-600 m3. 600-1100 m4. >1100 m
Texture:1. Coarse2. Medium3. Medium-fine4. Fine 5. Very fine
Soil Depth:1. shallow2. medium3. deep
Stoniness:1. Low content2. Medium content3. High content
Slope Class:1. 0-3%2. 3-6%3. 6-10%4. 10-15%5. …
Homogeneous Response Units
DE13
DE12
DE11
DE14

EUFASOM DynamicsEUFASOM Dynamics
5 (to 20) year time steps5 (to 20) year time steps
State of forests (and soil organic matter)State of forests (and soil organic matter)
Technical progressTechnical progress
Demand & industry growthDemand & industry growth
Resource and global changeResource and global change
Policy scenariosPolicy scenarios
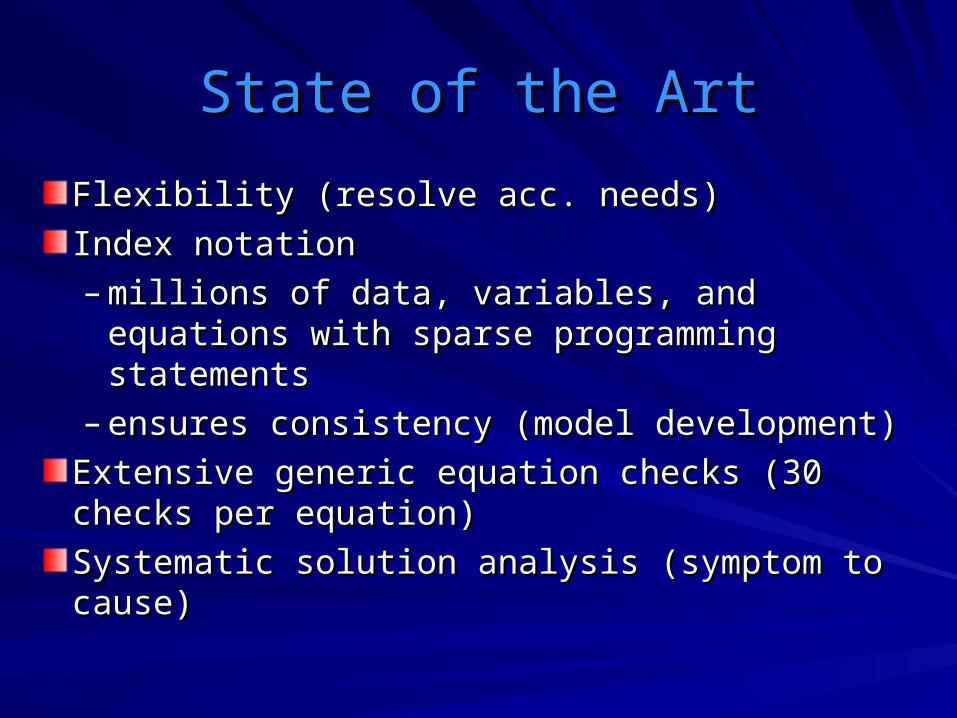
State of the ArtState of the Art
Flexibility (resolve acc. needs)Flexibility (resolve acc. needs)
Index notationIndex notation
– millions of data, variables, and equations millions of data, variables, and equations with sparse programming statementswith sparse programming statements
– ensures consistency (model development)ensures consistency (model development)
Extensive generic equation checks (30 checks Extensive generic equation checks (30 checks per equation)per equation)
Systematic solution analysis (symptom to Systematic solution analysis (symptom to cause)cause)
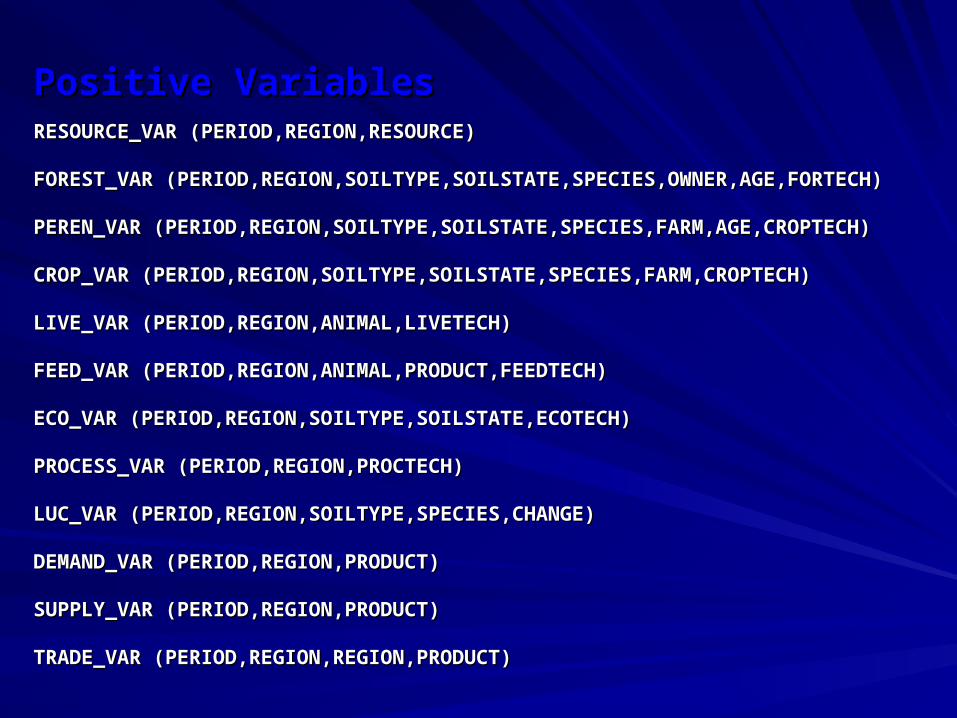
Positive VariablesPositive VariablesRESOURCE_VAR (PERIOD,REGION,RESOURCE) RESOURCE_VAR (PERIOD,REGION,RESOURCE)
FOREST_VAR (PERIOD,REGION,SOILTYPE,SOILSTATE,SPECIES,OWNER,AGE,FORTECH) FOREST_VAR (PERIOD,REGION,SOILTYPE,SOILSTATE,SPECIES,OWNER,AGE,FORTECH)
PEREN_VAR (PERIOD,REGION,SOILTYPE,SOILSTATE,SPECIES,FARM,AGE,CROPTECH) PEREN_VAR (PERIOD,REGION,SOILTYPE,SOILSTATE,SPECIES,FARM,AGE,CROPTECH)
CROP_VAR (PERIOD,REGION,SOILTYPE,SOILSTATE,SPECIES,FARM,CROPTECH) CROP_VAR (PERIOD,REGION,SOILTYPE,SOILSTATE,SPECIES,FARM,CROPTECH)
LIVE_VAR (PERIOD,REGION,ANIMAL,LIVETECH) LIVE_VAR (PERIOD,REGION,ANIMAL,LIVETECH)
FEED_VAR (PERIOD,REGION,ANIMAL,PRODUCT,FEEDTECH)FEED_VAR (PERIOD,REGION,ANIMAL,PRODUCT,FEEDTECH)
ECO_VAR (PERIOD,REGION,SOILTYPE,SOILSTATE,ECOTECH) ECO_VAR (PERIOD,REGION,SOILTYPE,SOILSTATE,ECOTECH)
PROCESS_VAR (PERIOD,REGION,PROCTECH) PROCESS_VAR (PERIOD,REGION,PROCTECH)
LUC_VAR (PERIOD,REGION,SOILTYPE,SPECIES,CHANGE) LUC_VAR (PERIOD,REGION,SOILTYPE,SPECIES,CHANGE)
DEMAND_VAR (PERIOD,REGION,PRODUCT) DEMAND_VAR (PERIOD,REGION,PRODUCT)
SUPPLY_VAR (PERIOD,REGION,PRODUCT) SUPPLY_VAR (PERIOD,REGION,PRODUCT)
TRADE_VAR (PERIOD,REGION,REGION,PRODUCT) TRADE_VAR (PERIOD,REGION,REGION,PRODUCT)

EquationsEquationsOBJECTIVE_EQU OBJECTIVE_EQU
RESOURCEBAL_EQU (PERIOD,REGION,RESOURCE) RESOURCEBAL_EQU (PERIOD,REGION,RESOURCE)
RESOURCEMAX_EQU (PERIOD,REGION,RESOURCE) RESOURCEMAX_EQU (PERIOD,REGION,RESOURCE)
SOILSTATE_EQU (PERIOD,REGION,SOILTYPE,SOILSTATE) SOILSTATE_EQU (PERIOD,REGION,SOILTYPE,SOILSTATE)
FORINVENT_EQU (PERIOD,REGION,SOILTYPE,SOILSTATE,SPECIES,OWNER,AGE,FORTECH) FORINVENT_EQU (PERIOD,REGION,SOILTYPE,SOILSTATE,SPECIES,OWNER,AGE,FORTECH)
LUC_EQU (PERIOD,REGION,SOILTYPE,SPECIES,CHANGE) LUC_EQU (PERIOD,REGION,SOILTYPE,SPECIES,CHANGE)
LUCLIMIT_EQU (PERIOD,REGION,SOILTYPE,SPECIES,CHANGE) LUCLIMIT_EQU (PERIOD,REGION,SOILTYPE,SPECIES,CHANGE)
STOCK_EQU (PERIOD,REGION,STOCK)STOCK_EQU (PERIOD,REGION,STOCK)
EMIT_EQU (PERIOD,REGION,SUBSTANCE)EMIT_EQU (PERIOD,REGION,SUBSTANCE)
PRODUCTBAL_EQU (PERIOD,REGION,PRODUCT) PRODUCTBAL_EQU (PERIOD,REGION,PRODUCT)
MINFEED_EQU (PERIOD,REGION,ANIMAL,NUTRIENT) MINFEED_EQU (PERIOD,REGION,ANIMAL,NUTRIENT)
MAXFEED_EQU (PERIOD,REGION,ANIMAL,NUTRIENT) MAXFEED_EQU (PERIOD,REGION,ANIMAL,NUTRIENT)

DataDataFOREST_DATA (PERIOD,REGION,SOILTYPE,SOILSTATE,SPECIES,FARM,AGE,ALLTECH,ALLITEM)FOREST_DATA (PERIOD,REGION,SOILTYPE,SOILSTATE,SPECIES,FARM,AGE,ALLTECH,ALLITEM)
PEREN_DATA (PERIOD,REGION,SOILTYPE,SOILSTATE,SPECIES,FARM,AGE,ALLTECH,ALLITEM)PEREN_DATA (PERIOD,REGION,SOILTYPE,SOILSTATE,SPECIES,FARM,AGE,ALLTECH,ALLITEM)
CROP_DATA (PERIOD,REGION,SOILTYPE,SOILSTATE,SPECIES,FARM,ALLTECH,ALLITEM)CROP_DATA (PERIOD,REGION,SOILTYPE,SOILSTATE,SPECIES,FARM,ALLTECH,ALLITEM)
ECO_DATA (PERIOD,REGION,SOILTYPE,SOILSTATE,ALLTECH,ALLITEM)ECO_DATA (PERIOD,REGION,SOILTYPE,SOILSTATE,ALLTECH,ALLITEM)
LIVE_DATA (PERIOD,REGION,ANIMAL,ALLTECH,ALLITEM)LIVE_DATA (PERIOD,REGION,ANIMAL,ALLTECH,ALLITEM)
FEED_DATA (PERIOD,REGION,PRODUCT,ALLTECH,ALLITEM)FEED_DATA (PERIOD,REGION,PRODUCT,ALLTECH,ALLITEM)
PROCESS_DATA (PERIOD,REGION,ALLTECH,ALLITEM)PROCESS_DATA (PERIOD,REGION,ALLTECH,ALLITEM)
PRODUCT_DATA (PERIOD,REGION,PRODUCT,ALLITEM)PRODUCT_DATA (PERIOD,REGION,PRODUCT,ALLITEM)
MARKET_DATA (PERIOD,REGION,ALLITEM,SDTYPE,SDITEM)MARKET_DATA (PERIOD,REGION,ALLITEM,SDTYPE,SDITEM)
TRADE_DATA (PERIOD,REGION,REGION,PRODUCT,ALLITEM)TRADE_DATA (PERIOD,REGION,REGION,PRODUCT,ALLITEM)
RESOURCE_DATA (PERIOD,REGION,ALLRESOURCE,SDITEM)RESOURCE_DATA (PERIOD,REGION,ALLRESOURCE,SDITEM)
STOCK_DATA (PERIOD,REGION,PRODUCT,ALLITEM)STOCK_DATA (PERIOD,REGION,PRODUCT,ALLITEM)
LUC_DATA (PERIOD,REGION,SOILTYPE,SPECIES,ALLCHANGE,ALLITEM)LUC_DATA (PERIOD,REGION,SOILTYPE,SPECIES,ALLCHANGE,ALLITEM)

Pre-Solution AnalysisPre-Solution Analysis
Identifies structural errorsIdentifies structural errors– Missing dataMissing data– Misspecified dataMisspecified data– Wrong signsWrong signs
More than 30 general variable and More than 30 general variable and equation checksequation checks

Mitigation PotentialsMitigation Potentials
0
50
100
150
200
250
300
350
400
450
500
0 100 200 300 400 500 600 700 800
Car
bon
pric
e (E
uro/
tce)
Mitigation (mmtce)
TechnicalPotentialCompetitive
Potential

-10
-8
-6
-4
-2
0
2
4
6
8
0 20 40 60 80 100
Bill
ion
Eu
ros
Carbon Equivalent (CE) Prices in Euros per Ton
Changes in Welfare Accounts
Gross Ag-Producer Surplus
Emission Payments
Net Ag-Producer Surplus
Ag-Consumer Surplus

GHG Mitigation and MarketsGHG Mitigation and Markets
20
40
60
80
100
120
140
160
180
200
220
0 50 100 150 200 250 300
Fis
her
ind
ex
Carbon price (Euro/tce)
Crop prices
Livestock prices
Livestock production
Crop productionNet exports

Afforestation PotentialsAfforestation Potentials
0
100
200
300
400
500
0 50 100 150 200 250 300
Car
bon
pric
e (E
uro/
tce)
Emission reduction (mmtce)
Technical Potential
Economic PotentialCompetitive
Economic Potential

Forest Policy: Crop EmissionsForest Policy: Crop EmissionsE
mis
sion
s (k
g C
/ha)
Carbon price (Euro/tce)
-15
-10
-5
0
5
10
15
0 50 100 150 200 250 300
Nitrogen Fertilizer
Ag-Soil Carbon
Irrigation Use
Fossil Fuel Use
0
50
100
150
200
250
300
350
400
450
500
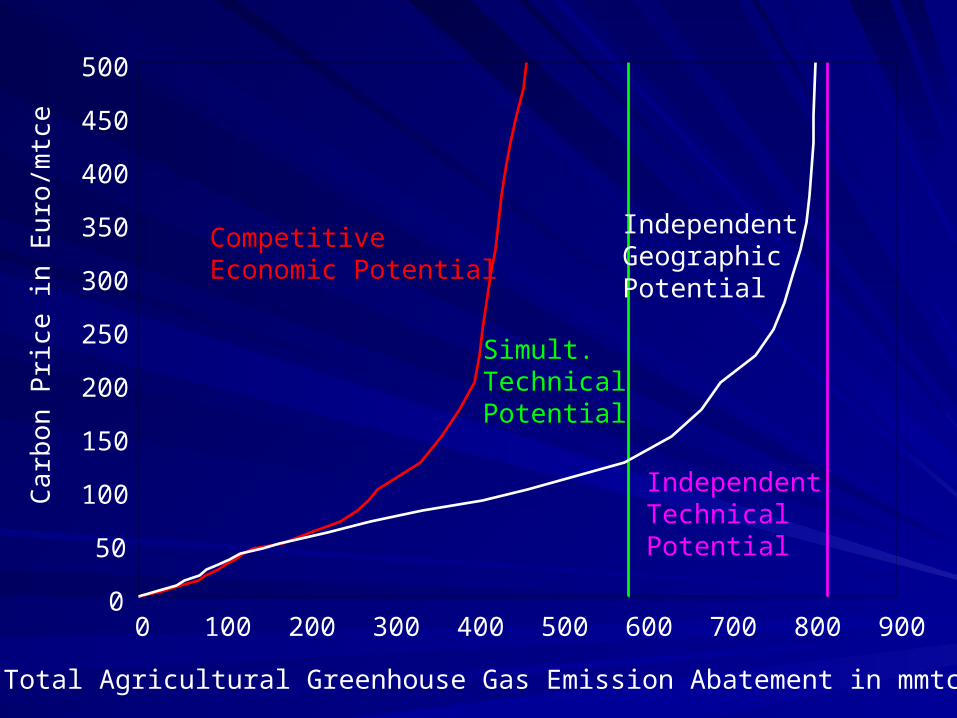
0 100 200 300 400 500 600 700 800 900
Car
bon
Pri
ce in
Eur
o/m
tce
Total Agricultural Greenhouse Gas Emission Abatement in mmtce
Competitive Economic Potential
Simult. Technical Potential
Independent Geographic Potential
IndependentTechnical Potential

0
50
100
150
200
250
300
350
400
450
500
0 100 200 300 400 500 600 700
Car
bon
Pri
ce in
Eur
o/m
tce
Total Agricultural and Forest Greenhouse Gas Emission Abatement in mmtce
Crop Area Fixed
Crop Area and
Prices Fixed
Crop Area and Prices Endogenous
Prices Fixed

0
10
20
30
40
50
60
70
80
0 20 40 60 80 100
Ene
rgy
Cro
ps (
mil
lion
hec
tare
s)
Carbon tax on energy (Euro/ton of carbon)
2010 Capacity
2030 Capacity
2050 Capacity
UnrestrictedCapacity
Power Plant Biomass SupplyPower Plant Biomass Supply

Thanks Thanks