the european market for organic food - fibl - · pdf filethe european market for organic food...
TRANSCRIPT

The European Market for Organic FoodHelga Willer and Julia Lernoud, Forschungsinstitut für biologischen Landbau (FiBL), Frick Diana Schaack, Agrarmarkt Informationsgesellschaft (AMI), Bonn, Germany
BIOFACH 2014, 13.2.2014

www.fibl.org 2
The World of Organic Agriculture 2014
› The 15th edition of ‚The World ofOrganic Agriculture‘, was publishedby FiBL and IFOAM in February2014.*
› Contents:› Results of the survey on organic
agriculture worldwide;› Organic agriculture in the regions and
country reports;› Australia, Canada, Croatia, the Pacific
Islands, United Arab Emirates, andThe United States of America.
› Chapters on the global market, standards & legislations, voluntarystandards , PGS, European market andtea production in China
› Numerous tables and graphs. › The book can be ordered via
IFOAM.org and shop.FiBL.org. › *Willer, H, Lernoud, J, (2014) The
World of Organic Agriculture. Statisticsand Emerging Trends 2014. FiBL, Frick, and, IFOAM,Bonn

www.fibl.org

www.fibl.org
Recent developments
› IFOAM EU Group celebrates10th anniversary in 2013
› TP Organics was granted official status as a “technology platform” in 2013
› Review of the EU’s political and legal framework › Revision of organic regulation› New action plan in 2014
› New legislation on the European Union’s agri-environmental programs.
4

www.fibl.org 5
Europe: Organic agricultural land by country 2012

www.fibl.org
Organic agriculture in Europe: Key data/indicators 2012
› 11.2 million hectares of agricultural land are organic (EU 10 million hectares).
› This constitutes 2.3 percent of the agricultural land in Europe (EU 5.6 percent).
› The organic agricultural land increased by 0.63 million hectares (EU 0.54 million hectares) or six percent in 2012
› Amost 320’000 producers were reported (EU 250’000) . › The market was 22.8 billion euros (EU 20.9); six percent
more than in 2011.
Source: FiBL Survey 2014 6

www.fibl.org
Europe: The ten countries with the most organic agricultural land 2012
7
477'685
488'658
523'627
533'230
590'009
661'956
1'032'941
1'034'355
1'167'362
1'593'197
0 500'000 1'000'000 1'500'000 2'000'000
Sweden
Czech Republic
Turkey
Austria
United Kingdom
Poland
France
Germany
Italy
Spain
Hectares
Europe: The ten countries with the largest organic area 2012Source: OrganicDataNetwork Survey 2013 based on national data sources and FiBL‐AMI survey 2014
www.fibl.org
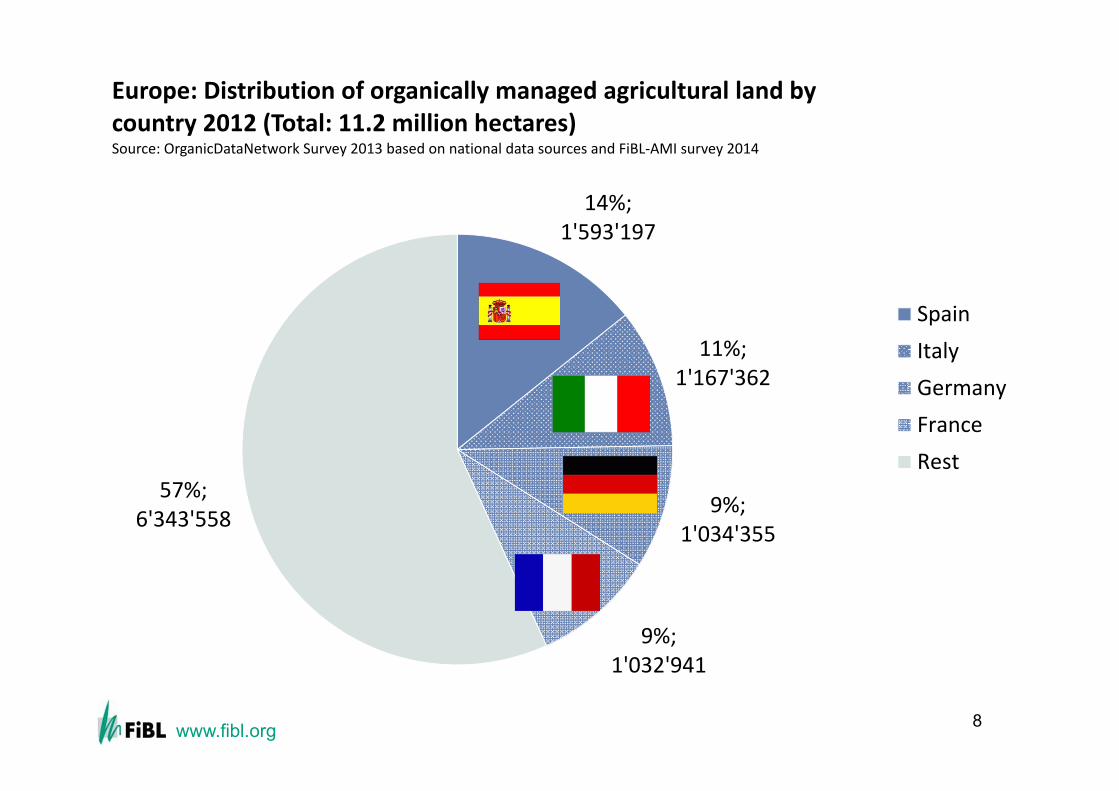
14%;1'593'197
11%;1'167'362
9%;1'034'355
9%;1'032'941
57%;6'343'558
Europe: Distribution of organically managed agricultural land bycountry 2012 (Total: 11.2 million hectares)Source: OrganicDataNetwork Survey 2013 based on national data sources and FiBL‐AMI survey 2014
SpainItalyGermanyFranceRest
Europe: Distribution of organically managed agricultural land by country 2012 (Total: 11.2 million hectares)
8

www.fibl.org
Europe: The ten countries with the highest shares of organic agricultural land 2012
9
8.7%
8.8%
9.1%
10.8%
11.5%
12.0%
15.3%
15.6%
19.7%
29.6%
0% 5% 10% 15% 20% 25% 30% 35%
Finland
Slovakia
Italy
Latvia
Czech Republic
Switzerland
Estonia
Sweden
Austria
Liechtenstein
Europe: The countries with the highest share of organic agricultural land 2012Source: OrganicDataNetwork Survey 2013 based on national data sources and FiBL‐AMI survey 2014

www.fibl.org 10

www.fibl.org
Growth of the organic agricultural land 1999-2012
11.0
37.5
0
5
10
15
20
25
30
35
40
1999 2000 2001 2002 2003 2004 2005 2006 2007 2008 2009 2010 2011 2012
Million he
ctares
Growth of the organic agricultural land worldwide 1999‐2012Source: FiBL‐IFOAM‐SOEL‐Surveys 1999‐2014

www.fibl.org
Development of organic agricultural land in the regions 1999-2012
12
1.1
0.0
3.23.7
11.2
1.2
6.8
0.7
3.0
5.3
12.2
0
2
4
6
8
10
12
14
1999 2000 2001 2002 2003 2004 2005 2006 2007 2008 2009 2010 2011 2012
Million he
ctares
Growth of the organic agricultural land by continent 1999‐2012Source: FiBL‐IFOAM‐SOEL‐Surveys 1999‐2014
Africa Asia Europe Latin America Northern America Oceania

www.fibl.org
Europe: Development of organic agricultural land 1985-2012
4.55.4 5.8 6.2 6.4
6.87.3
7.88.3
9.210.0
10.511.2
4.35.0
5.4 5.7 5.86.2
6.77.1
7.68.3
9.0 9.410.0
0.0
2.0
4.0
6.0
8.0
10.0
12.0
2000 2001 2002 2003 2004 2005 2006 2007 2008 2009 2010 2011 2012
Milli
on H
ecta
res
Europe: Development of organic agricultural land 1985-2012Source: FiBL-AMI-SOEL survey 2000-2012 - OrganicDataNetwork
EuropeEU

www.fibl.org
Development of organic land use types in Europe 2004-2012
2.2
2.7 2.93.2 3.3
3.74.1
4.44.7
0.5 0.5 0.7 0.7 0.81.0 1.0 1.1 1.1
3.1 3.03.3 3.3
3.94.1
4.54.8 4.9
0
1
2
3
4
5
6
2004 2005 2006 2007 2008 2009 2010 2011 2012
Million he
ctares
Development of the organic land by land use type 2004‐2012Source: FiBL‐IFOAM‐SOEL‐Surveys 1999‐2014
Arable crops
Permanent crops
Permanent grassland

www.fibl.org
Europe: Use of organic agricultural land 2012 (total: 11.2 million hectares)
15
Permanent grassland
44%
Arable crops42%
Permanent crops10%
Other agricultural
land3%
Agricultural land and crops, no details1%
Europe: Use of agricultural organic land 2012Source: Source: OrganicDataNetwork Survey 2013 based on national datasources and FiBL‐AMI survey 2014
Land use types 2012
105.2193.5244.3
1'898.21'987.1
0 1'000 2'000 3'000
VegetablesOilseeds
Protein cropsCereals
Green fodder
Thousand hectares
Key arable crops
34.20119.66172.39
241.73456.37
0 200 400 600
Citrus fruitFruit, temperate
NutsGrapesOlives
Thousand hectares
Key permanent crops
www.fibl.org
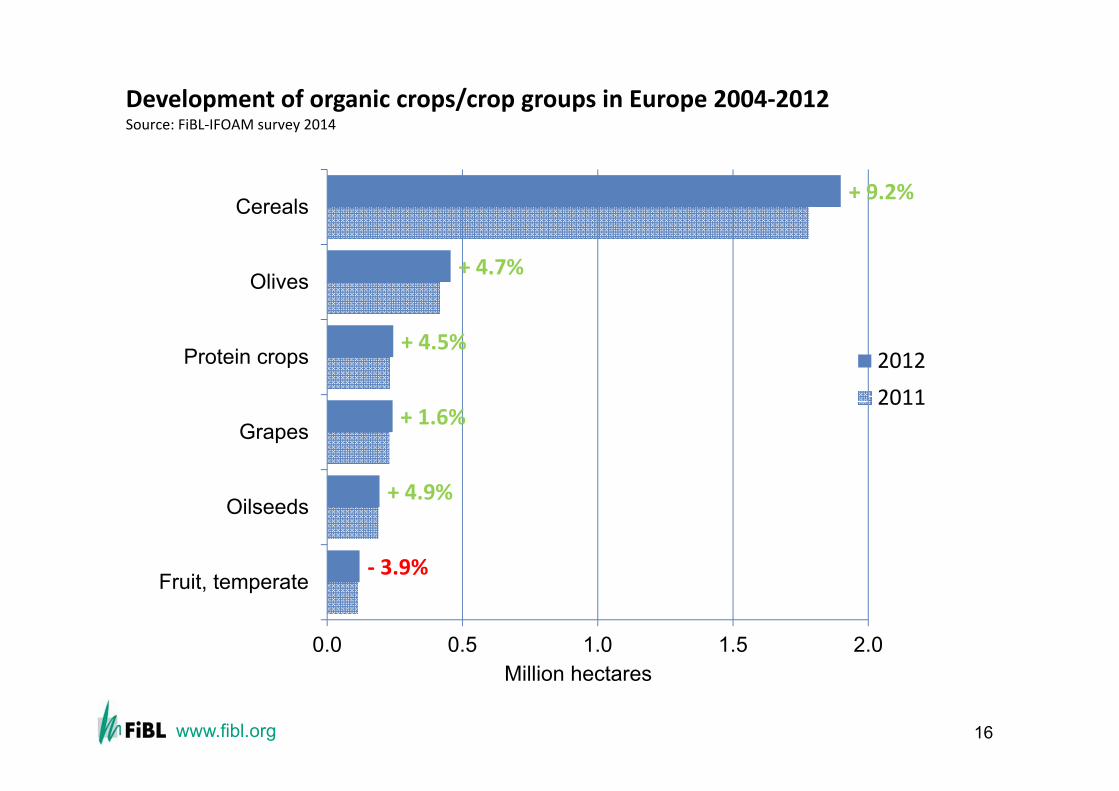
Development of organic crops/crop groups in Europe 2004‐2012
16
‐ 3.9%
+ 4.9%
+ 1.6%
+ 4.5%
+ 4.7%
+ 9.2%
0.0 0.5 1.0 1.5 2.0
Fruit, temperate
Oilseeds
Grapes
Protein crops
Olives
Cereals
Million hectares
Development of organic crops/crop groups in Europe 2004‐2012Source: FiBL‐IFOAM survey 2014
20122011

www.fibl.org
Europe: Growth of the Organic Market 2004-2012
11.012.1
13.515.3
17.018.2
19.621.5
22.8
10.2 11.212.6
14.315.9 17.0
18.219.8 20.9
0.0
5.0
10.0
15.0
20.0
25.0
2004 2005 2006 2007 2008 2009 2010 2011 2012
Billion
euros
Europe and European Union: Market development 2004‐2012Source: FiBL‐AMI Surveys 2006‐2014, OrganicDataNetwork Survey 2013
Europe European Union

www.fibl.org
The European market for organic food and drink: The countries with the highest sales 2012
7918879059981'065
1'5201'8851'950
4'0047'040
0 1'000 2'000 3'000 4'000 5'000 6'000 7'000 8'000
NetherlandsDenmarkSwedenSpain
AustriaSwitzerland
ItalyUnited Kingdom
FranceGermany
Million euros
The European market for organic food and drink: The countries with the highest sales 2012Source: FiBL‐AMI Surveys 2006‐2014, OrganicDataNetwork Survey 2013
18

www.fibl.org
Distribution of organic retail sales by country worldwide 2012
19
44%
14%
8%
4%
4%
4%
3%
19%
Global market: Distribution of retail sales value by countrySource: FiBL‐AMI‐OrganicDataNetwork survey 2014, based on retail sales with organic food
USAGermanyFranceCanadaUnited KingdomItalySwitzerlandOthers

www.fibl.org
44%
41%
4%3%
2% 6%
Global market: Distribution of retail sales value by single markets2012Source: FiBL‐AMI‐OrganicDataNetwork survey 2014, based on retail sales with organic food
USAEUCanadaSwitzerlandJapanOthers
Global market: Distribution of total retail sales value by single markets (total: 47.8 billion) Euros 2012

www.fibl.org
Development of the Organic Market in Selected European Countries 2004-2012
3'500
7'040
1'762
4'004
1'785 1'950
1'0501'885
305 887767
1'520
0
1'000
2'000
3'000
4'000
5'000
6'000
7'000
8'000
2004 2005 2006 2007 2008 2009 2010 2011 2012
Million Euros
Development of the Organic Market in Selected European Countries 2004‐2012Source: FiBL‐AMI survey 2014
Germany
France
UnitedKingdomItaly
Denmark
Switzerland

www.fibl.org
61
62
72
86
95
127
129
143
159
189
0 50 100 150 200
France
Canada
USA
Germany
Sweden
Austria (2011)
Liechtenstein
Luxembourg
Denmark
Switzerland
Per capita consumption in euros
The ten countries with the highest per capita consumption 2012Source: FiBL‐AMI‐OrganicDataNetwork survey 2014
The ten countries with the largest per capita consumption for 2012

www.fibl.org 23

www.fibl.org
Conclusions
› Both the organic area and the organic market grew byapproximately 6 percent in 2012.
› It is expected that both area and markets will continue togrowincreasing demand, continued policy support, increasingresarch activities and the policy work of the IFOAM EU Group and TP Organics.
› Major challenge: Domestic market development in manyNew EU Member States and the (Potential) Candidatecountries.
24