the european radon mapping project - sbpr.org.br · pdf filethere is almost unanimous...
TRANSCRIPT

IX Latin American IRPA Regional Congress on Radiation Protection and Safety - IRPA 2013
Rio de Janeiro, RJ, Brazil, April 15-19, 2013 SOCIEDADE BRASILEIRA DE PROTEÇÃO RADIOLÓGICA - SBPR
THE EUROPEAN RADON MAPPING PROJECT
Bossew P.1, Tollefsen T.
2, Gruber V.
2, De Cort M.
2
1 German Federal Office for Radiation Protection
Köpenicker Allee 120 – 130, 10318 Berlin, Germany
2 European Commission − DG Joint Research Centre, Institute for Transuranium Elements
Via E. Fermi 2749, I-21027 Ispra (VA), Italy
[email protected], [email protected], [email protected].
ABSTRACT There is almost unanimous agreement that indoor radon (Rn) represents a hazard to human health. Large-scale
epidemiological studies gave evidence that Rn is the second-most important cause of lung cancer after smoking
and that also relatively low Rn concentrations can be detrimental. This has increasingly led to attempts to limit
Rn exposure through regulation, mainly building codes. The proposed Euratom Basic Safety Standards (BSS)
require Member States to establish Rn action plans aimed at reducing Rn risk, and to set reference values for
limiting indoor Rn concentration.
In 2006 the JRC started a project on mapping Rn at the European level, in addition and complementary to (but
not as a substitute for) national efforts. These maps are part of the European Atlas of Natural Radiation project,
which is planned eventually to comprise geographical assessments of all sources of exposure to natural
radiation. Started first, a map of indoor Rn is now in an advanced phase, but still incomplete as national Rn
surveys are ongoing in a number of European countries. A European map of geogenic Rn, conceptually and
technically more complicated, was started in 2008.
The main difficulty encountered is heterogeneity of survey designs, measurement and evaluation methods and
database semantics and structures. An important part of the work on the Atlas is therefore to harmonize data and
methods.
We present the current state of the Rn maps and discuss some of the methodological challenges.
1. THE EUROPEAN ATLAS OF NATURAL RADIATION:
RATIONALE OF THE PROJECT
The European radon maps are part of the European Atlas of Natural Radiation (EANR)
project which was started some years ago by the Radioactivity Environmental Monitoring
(REM) group of the Joint Research Centre (JRC) of the European Commission according to
its mission (based on Euratom Treaty, Art. 39 [1]) to collect and provide information about
the levels of radioactivity in the environment.
The objective of the Atlas is to familiarise the public with the radioactive environment and
give a more balanced view of the annual dose from natural radioactivity, as well as provide
reference material and generate harmonised data for the scientific community. The Atlas
should display the geographic distribution of certain physical quantities which are related to
sources of natural radiation at different stages in the chain of physical causality, from its very
generation up to derived phenomena, which are themselves sources of risk or hazard. This
should result in a collection of maps covering radon-related quantities; but also maps of other

IRPA 2013, Rio de Janeiro, RJ, Brazil.
sources of exposure to natural radiation are planned, such as cosmic and terrestrial gamma
radiation. A more detailed presentation of the project can be found in [2] (after [3]).
As the Atlas aims at a European scale, its main focus is synopsis on that geographical level.
This implies that it is not supposed to, nor does it substitute, national approaches to radiation
surveillance in general, and of Rn action plans including maps, in particular.
2. THE EUROPEAN INDOOR RADON MAP
The Atlas project started with a map of indoor Rn, given its dominant radiological
significance. In most cases, at least in Europe, exposure to indoor Rn (its progenies, to be
more accurate), provides the largest contribution to the budget of exposure to ionizing
radiation. Epidemiological studies have shown that already relatively low exposure
(corresponding indoor Rn concentration of 100 Bq/m³) yields significantly enhanced risk of
lung cancer, and that likely a linear – no-threshold relationship between dose and risk applies.
For an overview of studies and epidemiological results, see the WHO’s handbook on indoor
radon [4].
A study performed by the JRC in 2005 [5] showed that while most European countries had
Rn survey programs and produced Rn maps, practically no two countries had applied the
same methodology, in terms of design of the survey, the mapped quantity, mapping methods
and radiometry. The resulting maps were therefore not compatible across borders, and results
difficult to interpret on a synoptic, European level.
2.1. Methodology
This finding motivated the creation of a European indoor Rn map as first priority. The matter
was proposed and discussed at the 8th Rn workshop, Prague 2006 [6], and a decision taken.
The mapped quantity was chosen to be the long-term mean Rn-concentration in ground-floor
living rooms; compilation, evaluation and mapping is done by the JRC; and the mapping
units are 10 km x 10 km cells aligned to a common coordinate system. In order to guarantee
privacy, no individual measurement data are transmitted to the JRC, but statistics over grid
cells, namely the arithmetical mean (AM) and the standard deviation (SD), AM and SD of ln-
transformed data, number of measurements per cell, and minimum, median and maximum Rn
concentrations. To a large degree, this choice was made for pragmatic reasons in view of data
availability and technical feasibility. The JRC performs plausibility checks and calculates
further derived statistics.
As said, methods of data acquisition, viz. design of survey and measurement, are quite
different between participating countries. To understand better the differences and their
possible impact on the result, and as an additional QA tool, a questionnaire has been sent to
all participants addressing possibly relevant methodological questions.
Although conceptualized as an indoor Rn map and though the mapped quantity is the indoor
Rn concentration, the map is in fact a compromise between an indoor Rn and a radon
potential (RP) map. The reason is that statistics over the chosen quantity do not represent the
ones of exposure, but rather spatial means within grid cells, irrespective of population density

IRPA 2013, Rio de Janeiro, RJ, Brazil.
and house characteristics. In reality most people do not live in ground-floor rooms (in
particular in cities with high population density) but on higher floors where Rn exposure is in
general lower than on ground floor. For the purpose of mapping exposure, either data must
result from a carefully designed survey which reflects demographic and sociological reality
(samples representative for population density and house and dwelling characteristics), or
model-based correction to account for demographic representativeness must be performed.
Since few national radon surveys are designed that way, and on the other hand the
demographic data are not yet available to us, neither the “design-based” nor the “model-
based” approach could be chosen for generating a European radon exposure map; it must
therefore be left to future efforts [7].
Further details about procedures and preliminary results can be found in [8] and [9].
2.2. Current state of the map
The latest status (by end-2012) is shown in a JRC report [7]. The current state of the map is
shown in figure 1. So far 25 European countries participate, and we have more than 18,000
non-empty cells filled with data, based on more than 800,000 individual measurements in
total. Descriptive statistics are summarized in table 1. Again we stress that the mean over cell
means, 100.2 Bq/m³, is not the mean exposure proxy, but an estimate of the spatial mean.
(Neither is it the mean of the individual data (136 Bq/m³) nor the mean over country means
(106).) The thresholds 100 and 300 Bq/m³ are motivated by proposals given by the WHO [4]
and in the draft European Basic Safety Standards (BSS; still under discussion: the final
version can be expected to be somewhat different from the quoted one) [10].
Evidently coverage of Europe is still far from complete. Reasons are (apart from uninhabited
areas, which are however very few) missing data, either because Rn surveys are still ongoing
or because the national Rn strategy does not rely on indoor data, or incompatibility of data
with the European project. It can be expected that the map will fill up slowly in the future but
will probably never be perfectly complete. For countries whose survey preferentially covered
regions known for high radon potential, the estimated spatial country mean is clearly biased.
Table 1. Descriptive statistics of the dataset on which the European Indoor Radon Map
is based, as of December 2012.
Number of non-empty cells 18,734
Total number of measurements 818,704
Measurements per cell, MED ± MAD 4 ± 3
Min/Max number of measurements per cell 1 / 23,993
Cell mean, AM ± CV % 100.2 Bq/m3 ± 152 %
Cell median, MED ± MAD 64.9 ± 33.1 Bq/m3
Percentage cell AM > 300 Bq/m3
4.51 %
Percentage cell AM > 100 Bq/m3
31.0 %
CV within cells, MED ± MAD (55.4 ± 27.6) %
GSD within cells, MED ± MAD 1.87 ± 0.40
CV – coefficient of variation, CV = SD/AM. MAD (median absolute deviation) := MED(|x-MED(x)|).

IRPA 2013, Rio de Janeiro, RJ, Brazil.
Figure 1: Arithmetic means over 10 km x 10 km cells of the long-term
Rn concentration in ground-floor rooms.
3. THE EUROPEAN MAP OF GEOGENIC RADON
3.1. The concept of Radon Potential
The idea of the RP is to capture the property of the ground (rock and soil) to make Rn
available for exhalation into the atmosphere or for infiltration into houses or, briefly, “what
earth delivers in terms of radon”. Different quantities have been proposed to measure this
property.
Shortly recall the physical pathway, or rather network, “from rock to risk”, shown as
simplified scheme in figure 2. In the geogenic compartment of this pathway Rn is generated
and made available. Some therefore term the RP as quantifying the hazard associated to Rn.

IRPA 2013, Rio de Janeiro, RJ, Brazil.
Only anthropogenic factors turn the geogenic hazard into a risk: constructional properties of
houses and factors related to living habits actually control to which degree available Rn is
allowed to infiltrate a building and to accumulate in a room. The idea of the geogenic map is
thus to visualize the purely natural Rn hazard, i.e. independently of anthropogenic factors
which are subject to secular changes, as building styles and living habits change with time
and vary also regionally, while the geogenic RP is constant over geological eras.
Figure 2: Network of radon-related quantities, “From rock to risk”; simplified!
A physical quantity RP should therefore quantify the concept of the RP such as to account for
the “transfer” from geogenic hazard to indoor Rn risk. Candidates mostly include Rn
concentration in soil air, permeability, radium (226
Ra) concentration and emanation power as
numerical, or geological classes and lithology as categorical controls. One simple definition
which has physical plausibility is the so-called Neznal RP, based on a suggestion by M.
Neznal et al. [11],
RP := C / (-lg(k) -10) ,
where C denotes the equilibrium Rn concentration in soil air (kBq/m³), k the air
permeability (m²) and lg the decadic logarithm. In most real soils or rocks C is an ill-defined
quantity which for practical purposes is replaced by an operational definition of the Rn
concentration, namely the outcome of an observation protocol. It can be shown that the
“Neznal RP” equals C(soil) × k up to leading factors for medium permeability (k on the order

IRPA 2013, Rio de Janeiro, RJ, Brazil.
of 10-12
m²) and higher terms in the expansion of the logarithm, but is numerically more
convenient. (For more extreme permeabilities the RP definition smoothes against C × k.)
From the full transport equation of Rn in soil one can see that this is the advective component
of radon flux across a pressure threshold, normalized to the pressure gradient; this is chosen
so as to account for real occurring Rn infiltration from the ground into buildings which is
essentially controlled by advective flux, driven by pressure differences generated by
buildings. Diffusive transport contributes little in general, and is therefore ignored for the
purpose of the RP definition.
An important issue is to establish valid and verifiable (for the given purpose) observation
protocols, but this will not be discussed further here; see e.g. [12] and [3].
In a different approach, one cross-tabulates physical, mostly categorical factors which control
the concept of the RP. The entries of the (possibly multi-dimensional) table are classified into
RP classes. These factors are typically base and surface geology, lithology, granulometry (as
a proxy of permeability), hydrological properties, tectonics, and occurrence of “special
features” such as caves, mines or other anthropogenically modified conditions which may
enhance or reduce the natural RP. Yet another, so-to-say top-down approach starts with
observed indoor Rn. Applying models the value is transformed to a standard situation
(ground-floor room, presence of basement etc.), this way essentially eliminating the influence
of anthropogenic control factors. The resulting value, although given as indoor Rn
concentration, essentially represents the geogenic control only. One elaborate example of this
approach has been by presented by H. Friedmann [13].
For a more extensive discussion of concepts and methods the reader is referred to [3].
3.2. Methodology
At a workshop under the aegis of the 8th
International Geological Congress, Oslo, August
2008, the generation of a European geogenic Rn map was decided as the next step after the
indoor map, without at the time specifying the technical details. These were subjects of a
series of subsequent meetings organized by the JRC.
However, generating a harmonized European geogenic map turned out far more complicated
than the indoor map. While data of indoor Rn concentration are available in many countries,
of which a reasonably harmonized map can be generated relatively easily, this is not the case
for the RP, however it is defined. Although a number of observable physical quantities can be
taken as proxies of the RP, more or less satisfactorily, such as geochemical quantities,
external dose rate or a “top-down” RP, “transfer” models from each of these to the RP must
be established.
At the 11th
International Radon Workshop in Prague, September 2012 [14], a “zero-th”
version of the European geogenic Rn map was shown (presentation 03, Gruber et al., ibid.),
which uses only geological units as mapping units. Four RP classes were proposed,
representing low to high RP index. The geological units were classified according to
numerical RP data available in Germany, Belgium and the Czech Republic. The underlying
geological legend, which defines the units, follows the scheme proposed by the OneGeology
project [15]. This was seen as a way to circumvent the heterogeneity, by legends, of geologic

IRPA 2013, Rio de Janeiro, RJ, Brazil.
maps between European countries. At the same time it was maintained that in a more
advanced state the European geogenic Rn map should display the numerical “Neznal” RP.
Among the problems of the “geology-only” approach are: (1) not all European countries
participate in OneGeology, so that no compatible geological legend is available for these
countries; (2) the OneGeology scheme is not very well adapted to classifying the RP; (3) it
turns out that the OneGeology scheme is indeed not entirely consistent across national (or
even regional) borders; (4) natural variability of the RP within geological units is high so that
the ranges of the RP assigned to a class largely overlap; (5) often the RP is dominated by
regional or even local peculiarities which are not accounted for in geological maps.
3.3. Current state of the map
The current “zero-th” version of the European geogenic map is shown in Figure 3 (from
Gruber et al. in [14]). Large portions of Europe are evidently missing. This is due to a lack of
data, so that the geological units occurring in these parts could not yet be assigned RP
indices. First discussions have shown that also existing parts may in some cases have been
mis-estimated. An improved version is currently under construction.
Figure 3: Preliminary “zero-th” version of a geology-based
geogenic radon map of (parts of) Europe.
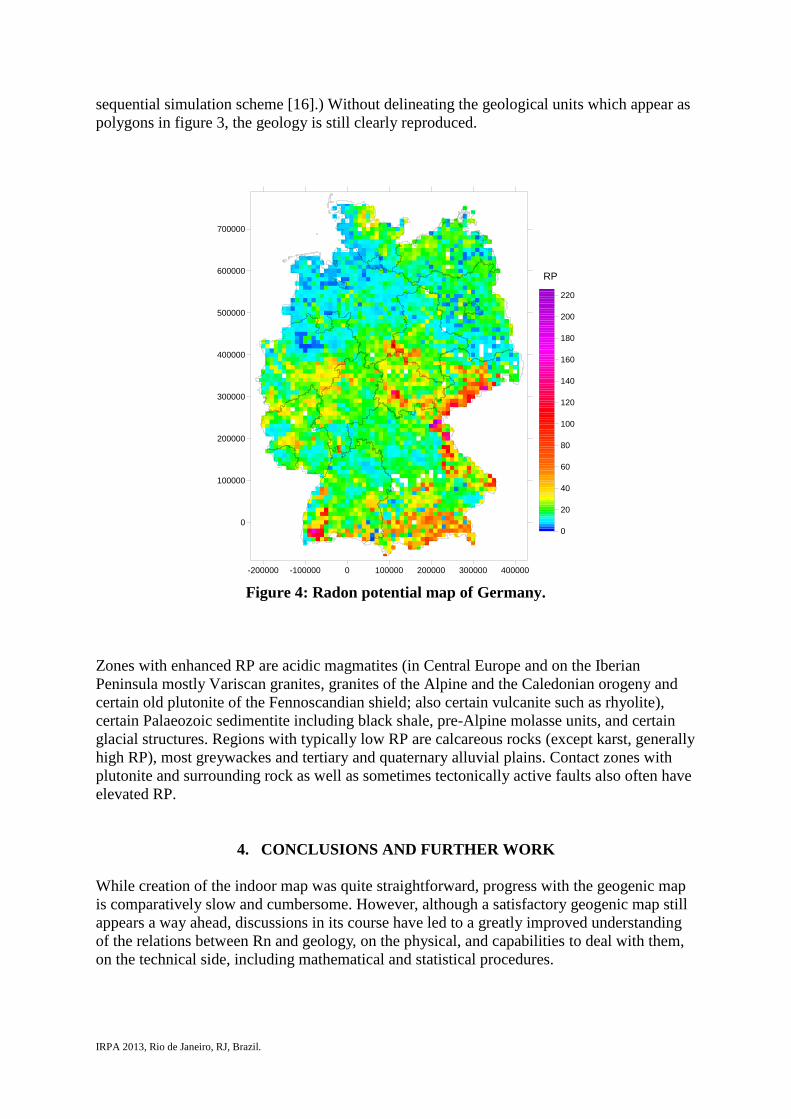
As an alternative, a “pixel”-based RP map is shown in figure 4, for Germany only. Here
numerical values are assigned to 10 km x 10 km cells. (Technically, the values are
expectations of the RP at centres of the cells estimated as AMs over realizations of a
IRPA 2013, Rio de Janeiro, RJ, Brazil.
sequential simulation scheme [16].) Without delineating the geological units which appear as
polygons in figure 3, the geology is still clearly reproduced.
-200000 -100000 0 100000 200000 300000 400000
0
100000
200000
300000
400000
500000
600000
700000
0
20
40
60
80
100
120
140
160
180
200
220
RP
Figure 4: Radon potential map of Germany.
Zones with enhanced RP are acidic magmatites (in Central Europe and on the Iberian
Peninsula mostly Variscan granites, granites of the Alpine and the Caledonian orogeny and
certain old plutonite of the Fennoscandian shield; also certain vulcanite such as rhyolite),
certain Palaeozoic sedimentite including black shale, pre-Alpine molasse units, and certain
glacial structures. Regions with typically low RP are calcareous rocks (except karst, generally
high RP), most greywackes and tertiary and quaternary alluvial plains. Contact zones with
plutonite and surrounding rock as well as sometimes tectonically active faults also often have
elevated RP.
4. CONCLUSIONS AND FURTHER WORK
While creation of the indoor map was quite straightforward, progress with the geogenic map
is comparatively slow and cumbersome. However, although a satisfactory geogenic map still
appears a way ahead, discussions in its course have led to a greatly improved understanding
of the relations between Rn and geology, on the physical, and capabilities to deal with them,
on the technical side, including mathematical and statistical procedures.

IRPA 2013, Rio de Janeiro, RJ, Brazil.
The main methodical problems are related to semantic and data heterogeneity. The former
concerns geological classification, while the latter deals with the variety of quantities which
are being measured, and for the same nominal quantities, the diversity of protocols. Since it
would be unrealistic to achieve harmonization by forcing identical rules everywhere – after
all, large amounts of data already exist, if yet partly incompatible – “transfer” rules between
them must be established. Some success has already been achieved in this respect.
-1500000 -1000000 -500000 0 500000 1000000 1500000
-1500000
-1000000
-500000
0
500000
1000000
1500000
2000000
2500000
20
30
40
50
60
70
80
90
100
110
120
130
140
150
external dose ratenSv/h
Figure 5: External dose rate (interpolated).
Clearly the European Atlas of Natural Radiation will not be finished very soon. Apart from
the ongoing indoor and geogenic maps, there are ideas to map other Rn-related quantities,
such as outdoor Rn concentration, exhalation rates, and derived radiologically relevant ones
such as exposure or dose. Surely all these will turn out to have their own technical problems.
A rough map of external dose rate is shown in figure 5 as an example (data: EURDEP [17]
raw data, AM June 2006; cosmic contribution, internal background and Rn peaks included;
ordinary block kriging, 10 km x 10 km cells).
Apart from Rn, candidates for mapping are cosmic radiation, geochemical concentrations or
terrestrial dose rate. A target, certainly still affording years of work, would be a map showing
spatially resolved budgets of the contributions of the various sources to total dose.
The Atlas will not only consist of maps. These will be accompanied by articles about the
physical and radiological background, as well as about sampling and measurement methods,

IRPA 2013, Rio de Janeiro, RJ, Brazil.
discussions of mapping, and more generally statistical techniques and their problems, and
about the technical experiences gained in course of the project. An essential part is
conclusions drawn from the synopsis which could not be derived from its constituents alone.
Altogether, one must not forget that one element of the rationale of the work is generation
and distribution of knowledge.
In a nearer perspective, the indoor map will be continued to be filled. In parallel development
of the geogenic map continues. At the same time surveying and mapping of Rn mapping are
ongoing tasks in almost all European countries, some having started surveys only recently,
others studying the impact of Rn remediation and of energy saving on Rn exposure. National
projects, diverse as they are, prove fruitful for the synoptic endeavour while the joint project
has turned out to have its impact on directions as well as on methodologies of regional
projects.
REFERENCES
1. Text at http://eur-lex.europa.eu/en/treaties/dat/12006A/12006A.htm (acc. 23.1.2013)
2. De Cort M., Gruber V., Tollefsen T., Bossew P. and Janssens A. (2011): Towards a
European atlas of natural radiation: goal, status and future perspectives. Radioprotection
46, 737 – 743.
3. Gruber V., Bossew P., De Cort M., Tollefsen T. (2013): The European map of the
geogenic radon potential. J. Radiol. Protection 33 (1), 51 – 60.
4. WHO (2009): World Health Organisation, WHO handbook on indoor radon – a public
health perspective. ISBN 978 92 4 154767 3. Download (acc. 22.1.2013):
http://www.who.int/ionizing_radiation/env/radon/en/index1.html
5. Dubois G. (2005): An Overview of Radon Surveys in Europe. Report EUR 21892 EN,
ISBN 92-79-01066-2. Download (acc. 22.1.2013):
http://rem.jrc.ec.europa.eu/RemWeb/Publications.aspx
6. Barnet I., Neznal M. and Pacherová P. (2006), eds.: Radon investigations in the Czech
Republic XI and the 8th
international workshop on the Geological Aspects of Radon Risk
Mapping. Proceedings, Czech Geological Survey, Radon v.o.s. & JRC, Prague 2006.
ISBN 80-7075-661-6.
7. Tollefsen T., Gruber V., Bossew P. and De Cort M. (2013): The European Indoor Radon
Map; status 2012. JRC scientific and policy reports JRC 78822.
8. Dubois, G., Bossew, P., Tollefsen, T., De Cort, M. (2010). First steps towards a European
atlas of natural radiation: status of the European Indoor Radon Map. Journal of
Environmental Radioactivity, 101, 786–798. doi: 10.1016/j.jenvrad.2010.03.007
9. Tollefsen, T., Gruber, V., Bossew, P., De Cort, M. (2011). Status of the European Indoor
Radon Map. Radiation Protection Dosimetry 145 (2–3), 110–116. doi:
10.1093/rpd/ncr072.
10. European Commission (2011): Proposal for a Council Directive laying down basic safety
standards for protection against the dangers arising from exposure to ionizing radiation.
Draft presented under Article 31 Euratom Treaty for the opinion of the European
Economic and Social Committee, Brussels, 29.9.2011 (2011/0254 (NLE)).
http://ec.europa.eu/energy/nuclear/radiation_protection/doc/com_2011_0593.pdf (acc.
8.1.2013).

IRPA 2013, Rio de Janeiro, RJ, Brazil.
11. Neznal, M., Neznal, M., Matolin, M., Barnet, I., Miksova, J. (2004): The new method for
assessing the radon risk of building sites. Czech Geol. Survey Special Papers, 16, Czech
Geol. Survey, Prague, 47 p.; http://www.radon-vos.cz/pdf/metodika.pdf (acc. 23.1.2013)
12. Bossew P., Gruber V., De Cort M. (2012): The European map of the geogenic radon
potential. Presentation, NARE, Hirosaki (Japan), 29.2. – 3.3.2012;
http://133.63.22.22/resnet/nare2012/pres.php (acc. 22.1.2013)
13. Friedmann H. (2005): Final results of the Austrian radon project. Health Physics, 89 (4),
339 – 348.
14. Barnet I., Neznal M. and Pacherová P. (2012), eds.: 11th
International Workshop on the
Geological Aspects of Radon Risk Mapping. Proceedings, Czech Geological Survey and
Radon v.o.s., Prague 2006. ISBN 978-80-7075-789-5. Presentations and minutes of round
tables, download http://www.radon.eu/workshop2012/ (acc. 22.1.2013)
15. Baker G. R. and Jackson I. (2010): OneGeology-Europe, Final Report ECP-2001-GEO-
317001 (some information available at www.onegeologyeurope.org , acc. 22.1.2013)
16. Bossew P. (2013): A map of the geogenic radon potential of Germany. Report of the
German Office of Radiation Protection (BfS), under preparation.
17. JRC / ITU / REM: EURDEP, https://eurdep.jrc.ec.europa.eu/ (acc. 23.1.2013)