the ev megatrend – responsibly sourced lithium the “new oil”
TRANSCRIPT
The recommendations and opinions expressed in this research report accurately reflect the research analyst's personal, independent, and objective views about any and all the companies and securities that are the subject of this report discussed herein. For important information, please see the Important Disclosures on page 18 of this document.
Page 01 of 19
Monday, 29 March 2021
RESEARCH REPORT
Lake Resources (LKE.AX) plans to develop its 100% owned 4.4Mt Kachi lithium deposit, located in Argentina, using Lilac Solutions Inc’s patented direct lithium extraction technology. Lilac’s flowsheet is simple and supports fast development of the upstream, which is often plagued by long lead times. Kachi emissions, water and waste footprints will be low with no mining or evaporation ponds required and its 99.97% battery grade lithium carbonate, which enables improved battery performance, should achieve premium pricing in a rising market. First production planned early 2024.
Battery capacity forecasts for 2030 just keep rising. In December 2020 Benchmark Minerals Intelligence (BMI) forecast 181 EV gigafactories globally by 2030 however, recent forecasts have already risen to 192 and with continued policy support, forecasts only appear to have more upside. The problem is, the localisation of supply chains away from China combined with rising capacity forecasts are not being met by a wave of new developments and rising lithium carbonate prices reflect this new reality.
Europe is coming for you America – EV’s are now a core business segment for German car manufacturer VW, which now plans to expand aggressively into Europe and the USA. In Europe it plans to construct six 40Gwh battery megafactories, which could consume~200,000t of lithium/year or 60% of the lithium market in 2019. But that is just one company; BMI expects global battery capacity could grow from 184Gwh in 2018 to just over 3,000Gwh by 2030. A big challenge as lithium output would need to grow from 0.3Mt in 2019 to around 2.4Mt/year by 2030 to meet this demand. The maths is crazy! Every project currently on the drawing board needs to quickly double production and some!
The demise of the Internal Combustion Engine (ICE) – BMI suggests, the cost of an EV battery has declined from US$1,000/kwh in 2010 to a low of just US$110/kwh in December 2020. Soon, the cost of an EV will fall below the cost of an ICE at ~US$100/kwh. This proximity to breakeven is already causing EV sales to dominate new car sales in Europe. This reality is now clear, as both Tesla and VW believe they can get costs down a further 50% from here. The electrification revolution is real and with policy support in both Europe and the USA, EV demand will surge past its current 1% share of the vehicle market.
ESG & e-mobility megatrends collide as investors pursue low emissions, low waste and socially aware investments. The challenge is to find those investments that are disrupting the view that mining is just a dirty business. Cleaner/low emissions footprints and high quality products are also likely better placed to secure off-take agreements and funding. A fact not lost on investors. LKE is one of these companies.
Project valuation – The Kachi Pre Feasibility Study (PFS) was recently refreshed to reflect rising LCE prices. LKE suggests a 40% rise in price to US$15,500/t over 25-years increases NPV8 by ~110% US$1.58Bn or A$2.02Bn. On this basis, LKE is trading at A$324m or just 18% of its NPV8.
Valuation upside – The PFS also forms the basis of our corporate model and the potential doubling of Kachi production to 51,000t/year forms the basis of valuing the assets inherent optionality. Each phase is valued and risked separately. Using a NPV8, we value LKE on a risked basis at $0.98/share today and trading at 75% of value yields a 12-month target of $0.73/share. As announcements are made, the project value will increase as will the 12-month target. As Kachi progresses through its list of catalysts the model will de-risk through time. Within 3-years, value could rise towards $2.31/share (refer page-13), approaching its PFS value. De-risking of an expansion option could add additional value.
Analyst: Di Brookman, BSc (Hons) AR1283213
Company Information ASX Ticker LKE
OTC Ticker LLKKF
ASX Price (/share) A$0.31
52-week range (/share) A$0.02-0.47
Position relative to 52-week high -32.98%
Shares on Issue 1,018m
Fully Diluted Shares on Issue 1,047m
Market Capitalisation A$324.7m
ASX & ChiX Av. Daily Volume (1Q21) 28m
OTC Av. Daily Volume (1Q’21) 4m
Source: Factset
Market Model
Unit Market cap A$m 325 Cash A$m 25 Debt A$m - Enterprise value (EV) A$m 300 EV / NPV8 as in PFS refresh 19% Cash % market cap % 8%
* PFS refresh dated March 2021 NPV8 (real, post tax) of US$1.58Bn
Key Personnel Stephen Promnitz MD & CEO
Stuart Crow Chairman & NED
Dr Nick Lindsay NED
Robert Trzebski NED
LKE PRICE Chart
Source: Factset
The EV Megatrend – Responsibly sourced lithium the “new oil” Ultra pure battery grade lithium supply opportunity
Share Price & Estimated
Future Price
Current Price $0.31
Price in 12-months* $0.73
Implied Increase/Dec +135%

Monday, 29 March 2021
RESEARCH REPORT
Page 02 of 19
The EV Megatrend – responsibly sourced lithium the “new oil” Ultra pure battery grade lithium supply opportunity
Company Summary Investment thesis - Electric cars are going from being a niche product to a volume product LKE aims to become a major global producer of high quality battery grade lithium carbonate. It holds 100% equity in four significant Argentinian brine assets situated in the Lithium Triangle. LKE is using disruptive lithium extraction technology to produce lithium for sales into the US, Europe and Asia. With its clean tech partner Lilac Solutions, LKE is moving fast to bring a low carbon, low water, low waste, no acid products, light footprint, low-cost and high value project to market. With the DFS due early 2022, construction could start mid 2022 and production of high purity lithium could commence early 2024.
Recent corporate activities include; • PFS refreshed –NPV8 increased 100% to US$1.6Bn on lithium price increase to US$15,500/t (March ’21) • Two joint financial advisors appointed (March ’21) • Positive Novonix Ltd (NVX.AX) battery cell testing - better than other commercially available Tier-1 product • Raised $24.7m (Jan ’21) • Fully funded DFS underway (Jan ‘21) • Hazen produced 99.97% battery quality lithium carbonate from Kachi pilot samples (Oct ’20)
Catalysts - timeline (source Lakes Resources)
Kachi Project Valuation – PFS refreshed (real terms) LKE recently refreshed the April 2020 PFS to include a lithium price assumption of US$15,500 (cif Asia) up from the earlier US$11,000. Why? Lithium prices are presently rising strongly in China and with few projects under construction/expansion it is considered buyers could pay ~US$3,000/t premium for the cleaner, consistently high quality lithium for use in battery cathodes. LKE reported no other assumptions were altered to achieve an NPV8 upgrade from US$748m to US$1.58Bn (A$2.1Bn). The project’s EBITDA/year increased from US$155m to US$257m. Breaking this down, the real gross profit/t within the refreshed PFS increased 65% from US$6,822/t to US$11,322/t.
Company Valuation Summary – (nominal terms) Our corporate model is based on the original PFS however; it uses a lower lithium price of US$14,500/t. The model also includes an expansion option, which currently carries a 10% probability of proceeding. Compared to the PFS, we value from today and not from early 2024 and use a nominal NPV10 for corporate costs and a higher forex of A$/US$0.75 to reach a value today of $0.98/share. In 3-years, taking dilution into account, the value could rise towards $2.31/share and beyond after start-up.
Reserves – Kachi (net 100%) Kachi is one of four deposits located in Argentina., which LKE plans to develop to produce 25,500t LCE/year. The PFS suggests the 25-year project life would consume ~20% of the total resource. The high tech plant will be modular and scalable. JORC RESERVES Measured Indicated Inferred Measured & Measure, Indicated in mt LCE Resource Resource Resource Indicated Resource & Inferred Resource Kachi (net 100%) 0.00 1.01 3.40 1.01 4.41

Monday, 29 March 2021
RESEARCH REPORT
Page 03 of 19
The EV Megatrend – responsibly sourced lithium the “new oil” Ultra pure battery grade lithium supply opportunity
Lithium Supply & Demand Lithium is common to all battery types – VW says “the irreplaceable element for the electric era” Battery cathode chemistries can be highly variable NMC532, 622, 811 (nickel, manganese, cobalt), NCA (nickel, cobalt, aluminium), NMx (nickel, manganese) and LPF (lithium, iron, phosphate); however, the common thread to each of these battery cell chemistries is lithium. Why…because it is highly conductive, thermally stable and super light. Lithium ion is the corner stone of battery technology today and tomorrow solid-state batteries are likely containing a lithium metal anode.
Lithium in batteries is here to stay and has been designated a strategic critical raw material in the USA, EU & Japan and a central tenant of EV, storage, iphone and tablet batteries.
Affordable rechargeable batteries are also making it possible to store electricity and harvest renewable energy. Lithium with purity above 99.5% is designated EV battery grade. Only ~35% of all lithium is qualified as battery grade. Lower grade lithium will be reprocessed into battery grade and feed power and personal tech.
How big could lithium demand be? BMI considers global demand for all lithium-ion applications could increase from 300kt in 2018 to ~400kt LCE in 2021. However, to feed EV, storage and personal tech demand BMI suggests that 192 gigafactories with battery capacity of ~3,500Gwh (3.5Twh) of will be required by 2030. We estimate the lithium required to meet this incremental demand is ~2.5mt/year an increase of 625% over 2021 levels…the trouble is the gigafactory forecast was only 181 factories globally a few months ago…demand is building fast and supply chains and projects need to be secured if supply is to meet these lofty demand forecasts.
Benchmark Minerals Intelligence suggests one 30Gwh gigafactory produces ~0.5m cars/year and requires ~25kt of lithium that the average gigafactory in the EU to 2030 would be sized at 32.6Gwh much larger than the global average of 18Gwh. A
In Europe 550Gwh of battery capacity was forecast for Europe by 2030. VW plans to construct 240Gwh of which one is already under construction, taking Europe’s total revised capacity to around 750Gwh by 2030. Stay with me! If all of this demand were to be met by local production rather than via China… some twenty five 25,000t operations, each the size of Kachi, would be required to back up battery production. Well, this is NOT going to happen! Significant imports of lithium and later recycling will still be required for a long time to come and still meeting forecasts will be challenging.
What is driving demand for EV’s and lithium in particular? A confluence of factors are driving EV demand such as: the regionalisation of supply chains, the EV approaching the cost of the ICE, policy support, legislative change, a growing number of EV models and a growing customer and investor consciousness that points to a systemic change in thinking and behaviour.
Lithium may be geologically plentiful but not all lithium deposits are created equal and there are not a lot of deposits that are ready to develop.
To feed the looming shortage in most battery materials - especially lithium by 2024 – we believe all projects presently on the table will need to be developed to meet the forecast +1,000% growth in supply required to meet current 2030 demand forecasts.
It is clear in the short to medium term; that there is a paradigm shift to the e-mobility megatrend brought about by ESG/green investment and the desire to localize supply chains in the shortest time possible. These powerful and concurrent drivers are enabling disruptive technologies across the entire battery supply chain. LKE with its technology partner Lilac Solutions is positioned well to capitalize on material that will be central to battery chemistries for some time to come.
The Solid-State battery is the next generation battery with a solid replacing the liquid electrolyte. The anode in this case, is not graphite but rather lithium metal. The battery is still in development phase and when it arrives will use more lithium/battery but its energy density will be 10 times greater. This may be the solution to the apparent mismatch in supply versus demand for lithium
A NMC622 lithium ion battery cell contains lithium and precursor materials of 60% Nickel, 20% Manganese and 20% Cobalt and a NMC811 battery cell contains 80% nickel, 10% manganese and 10% Cobalt. The more nickel in the cathode the higher the energy density and driving range and unfortunately the greater the cost. The lithium iron phosphate (LFP) batteries are significantly cheaper, thermally stable and used for smaller driving ranges. Recent doping of the cell chemistry with manganese has increased driving range putting the LFP in direct competition with the NMC battery chemistries. More lithium is used in a LFP battery cathode.

Monday, 29 March 2021
RESEARCH REPORT
Page 04 of 19
The EV Megatrend – responsibly sourced lithium the “new oil” Ultra pure battery grade lithium supply opportunity
Is the trebling of EV demand late 2020 likely to continue? In Europe, which is now the fastest growing EV centre globally, EV sales rose 109% in 2H20 despite total car sales declining 23% during the pandemic. The European Automobile Association recently suggested that 10% of all cars sold in 3Q20 were electric up from just 3% a year earlier. In September 2020, the European Commission Vice President estimated that during this decade demand for lithium in the EU could grow up to 18-fold by 2030 and 60-fold by 2050. These forecasts are significantly ahead of those from BMI, which are often referred to in this document. Even so, with next to no development in recent years the market is not ready to meet demand and this reality is being reflected in growing pricing pressure. A bottleneck to this bullish outlook is that suppliers have long memories and the fall in price from 2018, as EV demand eased is still fresh to many. Scaling up the supply chain in a timely manner will require more than just a rising lithium price. It will require nerve and time. However, current growth projections suggest time there is not. Thus, it seems likely OEM’s, battery cell makers and Governments will need to get involved upstream to reduce development risk and, in the context of national security, speed up the delivery of supply. A life line will be required to close the loop as a vast percentage of battery material resources are held in the hands of the small to medium cap companies, which find financing of growth challenging.
Lithium prices rise a dramatic 68% in Jan-Feb 2021 as European EV demand rises ~43%yoy The reality is it is near impossible to feed surging demand without initiating a strong price response. BMI expects global battery grade lithium carbonate prices to hit highs of about US$16,100/t, in 2024. Ultra high quality lithium with a high ESG footprint would be likely to receive a premium price in a tight green lithium carbonate world
The upwards pressure is real and BMI noted that lithium carbonate prices rose 68% in the first 2-months of 2021. Despite this rise, prices are still over 40% below peak pricing for battery grade lithium in 2018 of ~US$24,000/t.
As product demand has not been matched by capital investment and with lithium, demand expected to quadruple by 2030 and if all cars on the road today would convert to LIB, then lithium would need to increase 30-fold…and that does not take into account grid storage or other personal technology like iphones and ipads.
The last lithium project approved for development was Ganfeng/Lithium Americas JV in Cauchari in 2018-2019. The lack of new development exposes the sector to upwards pricing pressure. With recent supply cutbacks and delays due to COVID-19, the market has not developed new supply to meet demand in the mid-term, which will place upward continued upwards pressure on pricing. To deal with this reality and given lithium is the central tenant of the cathode chemistries those battery cells with less of the expensive components like nickel, cobalt and aluminium will likely grow in demand and this trend to LFP batteries is exactly what this theme is about. We suspect this thematic will continue to grow.
With most of the existing lithium production contracted it is clear that many new projects need to be developed and fast. Hard rock does do faster but not with the benefits or scale up of Direct Lithium Extraction. We suspect more of these types of lithium extraction projects will occur driven by a greener and less wasteful footprint
Environmental consciousness awakens and will drive costs down further In Europe there are 500m people and 3.8m EV’s and in the US there are 330m people and 1.8m EV’s in stock. Uptake has been slow to date but as costs come down and European bans on new ICE sales from 2025/2030 become effective, demand for battery materials will only become more frantic
Countries that have pledged to end the sale of new ICE vehicles in less than 10-years include Germany, Netherlands, Denmark, Iceland, Ireland, Slovenia, Sweden, Israel and India. China, the UK and California are looking at 2035 and Canada and France 2040. Will Australia restart its automotive industry or continue to import foreign EV’s. We have the materials, now we need a plan.
With legislation in place car companies are embracing the EV and recent announcements for new car sales include;
• Tesla - predicts 50% of all new car sales will be electric by 2032 • Ford – new sales will be all-electric by 2030. It will inject US$1Bn into a German plant with first production in 2023.
Recently Ford announced a partnership with Google and a $7Bn injection into autonomous technology • General Motors - will release 30 new EV models by 2025 and an all-electric fleet by 2035 • Daimler/Mercedez Benz - to launch 16 new EV models by 2022 and Daimler to inject Euro70Bn into e-mobility and plans
to be CO2 neutral by 2039 • VW - aims for 22 million EV’s in 10-years. Building six 40Gwh battery factories in Europe by 2030. Wants 25% of its sales
to be EV’s by 2025. Injecting US$41Bn into EV’s. Plans for 75 new EV models by 2030 • Volvo will only sell EV’s by 2030, after launching first EV in 2020 • Jaguar to go all-electric from 2025…in just 4 years and its stable mate Land Rover will phase out diesel from 2026 and
axe petrol and diesel (hybrid) altogether by 2036 • Bentley only sell luxury EV’s by 2030; and • Now they just need the battery materials – but no new production has come on line - GAME ON!

Monday, 29 March 2021
RESEARCH REPORT
Page 05 of 19
The EV Megatrend – responsibly sourced lithium the “new oil” Ultra pure battery grade lithium supply opportunity
Lithium Price Forecasts –Strong Growth Gigafactories Announced (192 factories March’21)
Source: Benchmark Mineral Intelligence Forecast Jan 2021 Source: European Commission “Action Plan on Critical Raw Materials” (mid range selected);
Financial Times 31 August 2020; Benchmark Mineral Intelligence Dec 2020
Strong Demand Led Price Response Forecast Ebitda
Source: Benchmark Mineral Intelligence Mar2021 Source: Lakes Resources and Corporate Connect Research
Environmental, Social & Governance - ESG a growing focus by the investment community
Source: SQM

Monday, 29 March 2021
RESEARCH REPORT
Page 06 of 19
The EV Megatrend – responsibly sourced lithium the “new oil” Ultra pure battery grade lithium supply opportunity
The Supply Chain – localising supply chain and focus on circular economy
The US under Biden makes EV’s and securing supply chains a priority Global EV sales totalled 2.3m in 2020 and EV and plug-in hybrid cars had combined sales of 3.24m up a dramatic and surprising 43% during COVID from year earlier levels. With global passenger car sales of nearly 60m in 2020, the EV now has a market share of 3% and the combined EV/hybrid has a market share of 5%. Still a long way to go, however this performance was encouraging given global ICE sales in 2020 were down 14% during the pandemic.
In 2020, Europe passed China as the growth centre for EV’s where EV sales increased 137%, whilst in China sales increased 12% and US sales increased 4% with Tesla accounting for 80% of US sales. Despite Tesla’s gallant efforts the lack of prior policy support has caused the US to lag drastically behind.
In the US the new Biden administration has declared a “clear emphasis on a low-carbon or zero-carbon future.” It is aligning with Europe’s mission for the first time in many years. Further policy support will be required through the chain however, to date, Biden has pledged to;
• Convert the 650,000 Government owned vehicles • Convert 500,000 school buses into electric vehicle made in the USA • Invest US$5Bn into battery research and build 500,000 charging stations by 2030; and • Commitment to carbon-free electricity by 2035 ensures
In a clear showing of what can happen when policy support aligns with customer needs, GM announced the very next day that it would ban the sale of new ICE vehicles by 2035 and commit US$27Bn to bring 30 new models to market and by the end of that week, carmaker Ford also announced it would double its investment in EV’s to US$22Bn. Further, VW recently announced plans to have 50% of its US EV sales electric by 2030. VW now consider EV’s a core business segment as they transition aggressively away from the ICE.
Dramatic supply chain shifts are aggravating the lack of development The US and Europe are exposed as they have very little to zero operating lithium mining capacity at the moment and battery cell production is minimal with China manufacturing 73% of lithium-ion battery cells.
China clearly controls the supply chain, especially in cathodes and anodes) and as a result there is considerable sovereign risk around battery cell and battery supply. Surging Chinese EV sales, up more than threefold in January from a year earlier, fuel concerns that battery materials may be used to gain political leverage or worse sales could be with held all together. In 2010 China stopped exports of rare earths to Japan in retaliation to a dispute over the uninhabited Diaoyu Islands in the East China Sea. Also a threat by China last year to halt rare earth exports to the US has really sealed the deal for the EU and the US in particular as they move aggressively to build domestic supply chains or supply chains with friendly countries. The recognised fragility of supply chains resulted in lithium amongst others being designated as critical raw materials in the USA, EU & Japan.
Not all lithium is created equal – in 2020 some 26,700 plug-in hybrid electric vehicles were affected in BMW’s recall. BMW explained the issue was due to “impurities in the lithium production process of the battery cells.” BMW’s cells are supplied by China’s CATL and South Korea’s Samsung SDI. This only affirms that Europe and the US need to control the supply chain themselves. Recent Hyundai Kona and Chevy Bolt recalls with LG Chem batteries further demonstrate the issue.
The de-globalisation of all EV materials is resulting in significant supply chain rationalisation. However, project development can take years and until then existing relationships outside of China will likely play an important role in meeting demand.
Some points you should consider:
• 83% of the worlds lithium supply presently comes from either South America (salt brine) and Australia’s (hard-rock spodumene)
• The spodumene ore is transported to China, where it is converted to lithium hydroxide and the brine is generally converted to lithium carbonate on-site
• China refines 59% of the worlds lithium, and controls 83% of global cathode and anode production and 73% of battery cell manufacturing
• Europe produces NO lithium, NO refining of battery chemicals, NO cathode or anode capacity, and today produces only 6% of global cell manufacturing capacity
• The US is not much better, importing 96% of its lithium materials requirements, 100% of cathode and anode requirements and 90% of its battery cell requirements. All of this is about to change!
• However, a new mine = 10-years and a new chemical facilities = 5-years. Each step in the supply chain has a different timeline…each has different risk profile.

Monday, 29 March 2021
RESEARCH REPORT
Page 07 of 19
The EV Megatrend – responsibly sourced lithium the “new oil” Ultra pure battery grade lithium supply opportunity
World production of lithium – Europe nil, US only 1% - seeking clean tech supplies There are two main areas of production being hard rock spodumene production in Australia (53%) and salt brines situated in the Lithium Triangle (~40%). There is no current lithium production in Europe and the US~1% and China 9% of world supply
Currently, all of the spodumene concentrate from Australia is shipped to China where it is refined into battery grade lithium chemicals. In effect, China controls the midstream battery chain. China also controls 59% of chemical refining, 61% of cathode manufacturing and 73% of battery manufacturing.
Although, Europe may be the fastest growing EV market in the world it has no lithium production, no chemical processing and no anode or cathode production facilities. It does however, have 6% of global cell manufacturing capacity meaning it is a massive importer of the before mentioned.
According to BMI the US global market share is 1% for lithium mining, 4% for lithium chemical refining and 10% for cell manufacturing. The US has no cathode or anode production and it imports 100% of its battery cell requirements. Recognising the national vulnerability here, the US is now building out 3 battery hubs. The Tesla West hub with Tesla at 263Gwh, the New Detroit hub with General Motors at 48Gwh and the EV South hub with Daimler, Ford, VW and BMW at 48Gwh.
Surprisingly, only minimal upstream contracts have been signed to underwrite the midstream and downstream EV build-out. It seems obvious to us that this will change across the battery supply chain soon. Why? Contracts with quality sponsors are essential when trying to secure low cost debt funding.
Lithium to grow faster than nickel due to rise in LFP batteries Due to the low energy density of the LFP battery and thus low mileage/charge, the LFP battery has really only been favoured for short hauls as in China. However, China recently discovered that by adding manganese to the LFP cathode chemistry, the energy density increased significantly. This may explain why increasing demand for an LFP battery is driving demand for lithium carbonate.
With projects favouring lithium hydroxide to meet high demand for high nickel batteries, lithium carbonate prices to meet growing LFP demand have started to rise strongly. Some potential lithium producers, which may have been considering a LiOH flowsheet may now be considering the less complex flowsheet to produce LCE rather than LiOH.
By far the longest and riskiest aspect of the supply chain is the battery raw materials themselves.
Kachi’s lithium is very high quality and produced using clean tech In October 2020, Hazen produced 99.97% battery quality lithium carbonate from Kachi lithium chloride produced from Lilac Solution’s pilot plant. This was exciting news as battery grade purity start at 99.5%. At 99.97% Kachi’s impurities are only 0.03%, which means 1/ 16th the level of impurities found at the low end of battery grade. High purity lithium in a lithium ion battery yields superior conductivity, energy density and improved battery performance.
Samples of the lithium carbonate produced by Hazen were then sent to Novonix (NVX.AX) in Nova Scotia for battery cell testing. Novonix counts its Tier-1 customers as Panasonic, CATL, Samsung, SK Innovations, LG Chem and Bosch. Dr Jeff Dahn recently joined Novonix as its chief scientist. Dr Dahn also holds the same role at Tesla. What is important for LKE here is it is mixing with the who’s who in the battery ecosystem!
Along with other sustainably acquired precursors, LKE’s lithium carbonate was put into a NMC622 cathode cell. Early results suggest LKE’s lithium carbonate exhibited “improved capacity retention and better electrochemical behaviour” compared to other Tier-1 products. Samples of the NMC622 cell have been sent to Tier-1 customers, like those mentioned above, for further battery testing against commercial peers
Lilac and Hazen continue to scale up samples to Novonix, demonstrating repeatability and homogeneity of both the product and the process.

Monday, 29 March 2021
RESEARCH REPORT
Page 08 of 19
The EV Megatrend – responsibly sourced lithium the “new oil” Ultra pure battery grade lithium supply opportunity
What makes Direct Lithium Extraction technology disruptive? Producing lithium from South American salt brines is fairly standard and accounts for ~40% of lithium produced globally. However, Kachi will be developed using ion-exchange Direct Lithium Extraction (DLE) method.
Think of a problem and then solve it. In this case the evaporation of vast water in a desert environment was considered unsustainable. LKE wanted a consistent high purity product that was more sustainable so that its lithium footprint could be easily traceable and considered responsibly sourced by buyers.
Californian based Lilac Solutions Inc. owns the patented technology. The process involves ion exchange technology, used for decades in the water purification industry. The plant is modular in design and construction can be scaled to meet market demand.
Shareholders of Lilac’s include the Breakthrough Energy Ventures, which is helmed by Bill Gates. Investors in the Venture Fund include Jeff Bezos, Jack Ma, Richard Branson and Warren Buffet amongst others.
DLE has been proven to operate economically as part of the process of producing lithium carbonate at Livent’s Fenix facility in Argentina, using feedstock from the Salar del Hombre Muerto.
Key disruptive features of Clean Tech as outlined by Lilac and LKE; • No mining, crushing or evaporation ponds required • Simple project flowsheet is more efficient (lower cost and fast!) • LCE extracted in hours rather than 9-24months. Evaporation is generally a slow
process • Doubles lithium recoveries - from 45% to 85% effectively doubling reserves • No water politics - as (99% of brine is re-injected back into the reservoir) • 90% smaller physical project footprint; and • Delivers a constant product quality.
The process is fast; construction is fast…just what is needed to meet unprecedented demand growth.
How does the Direct Lithium Extraction process work? Wells are drilled into the salt brine at around 100m-400m, which then flows to surface and nearby plant and fibreglass tanks. Up to 23 -million litres of brine will be continually processed each year. The tanks contain special ion exchange beads, which latch on to the lithium over a few hours. The beads collect around 83% of the lithium in solution and are then stripped of the lithium and re-used. The brine, ex the lithium, is then returned to the aquifer. The purified lithium chloride concentrate, from Lilac’s process, is further concentrated, purified and fed into a conventional lithium carbonate plant.
This process is an example of a closed circular system the EU and others are seeking as we move to a low carbon, low waste era.
Lilac Solutions – Direct Extraction Concept Using Direct Lithium Extraction
Direct Lithium Extraction has a lower carbon and waste footprint, uses minimal water, does not use acid by products or evaporation ponds, which can make up to 50% of project capex.

Monday, 29 March 2021
RESEARCH REPORT
Page 09 of 19
The EV Megatrend – responsibly sourced lithium the “new oil” Ultra pure battery grade lithium supply opportunity
The Kachi Lithium Project (LKE net 100%) • Refreshed PFS consumes ~15% of total JORC resource over a 25-year life of project • High purity battery grade lithium deposit with product qualified by Hazen at 99.97% lithium carbonate; and • High quality tech partners, Hazen, Hatch, Lilac Solutions and Novonix
The Kachi project is located in Catamarca Province Argentina has an indicated JORC resource of 1.01mt LCE and an indicated and inferred JORC resource of 4.4mt LCE. Resource upside still exists at Kachi as only 15% of the current lease has been explored. In addition, further upside exists at Cauchari (LKE 100%) located within proximity to Ganfeng and Orocobre’s producing assets.
The Kachi resource remains open laterally and at depth allowing for a potential extension to the life of the mine or expansion to production. Exploration is underway to prove up the reserve required to FID the project
Over the current 25-year project life, LKE plans to produce 0.625mt or ~62% of the indicated resource and 15% of the total resource. Potential for a phase-2 expansion exists if the current resource can be further upgraded by drilling that is currently underway. At this stage, the project has enough resource to support 4 modular driven expansions each at the rate of 25,000t/year.
The sodium chloride rich brine aquifer is located at a depth of ~100 - 800m and has a lithium concentration of 250g/mg/L. The resource has very low level of impurities, meaning it does not contain elevated boron or magnesium etc. At the same time costs associated with removal of these impurities is not required.
Lithium chloride samples from Lilac’s DLE pilot plant in California were sent to Hazen, which devised a simple and effective flow sheet to convert the eluate into a high quality lithium carbonate. These samples were then sent to Novonix for testing in NMC622 battery cells. These cells, which performed well against Tier-1 competitors, are now undergoing additional battery performance testing at the Novonix Nova Scotia plant.
In all, the excellent results highlight the low levels of impurities and high battery performance of the Kachi lithium carbonate.
Source: Lakes Resources

Monday, 29 March 2021
RESEARCH REPORT
Page 10 of 19
The EV Megatrend – responsibly sourced lithium the “new oil” Ultra pure battery grade lithium supply opportunity
Kachi – Drill Holes & Seismic Lines Used in Resource Estimation
Source: Lakes Resources
Monday, 29 March 2021
RESEARCH REPORT
Page 11 of 19
The EV Megatrend – responsibly sourced lithium the “new oil” Ultra pure battery grade lithium supply opportunity
Funding Strategy • LKE tells market discussions are ongoing with partners, off-takers & debt providers • Lithium prices +68% ex China first 2-months of 2021; and • Kachi high purity lithium targeting pricing premium
LKE is presently funded through to construction, which is expected to commence mid 2022, followed by 18 to 24-months of construction. Production is expected early 2024.
Joint financial advisors have recently been appointed. SD Capital Advisory and GKB Ventures Ltd will structure and arrange project financing. LKE hopes to secure ~70% project finance. The question will be at what cost? GKB aims to secure lower cost funding from Export Credit Agencies (ECA’s). If successful, this should lower the overall cost of funds for the project. In total, we have assumed a funding rate of 7.5%, which is considerably higher than the current 10-year bond rate of 1.34%.
ECA funding is usually only available to credit worthy partners with quality contractual off-takers. However, small companies need access to funds to give quality off-takers confidence that they can fund development. . This “chicken and the egg” process is a serious issue and if Europe and the US are serious about securing domestic supply chains to protect national security, one suspects government backed ECA’s will need to go deep into the supply chain to secure battery materials on behalf of their governments
If up to 70% debt funding can be achieved, then equity could be called to fund 30% or US$163m of the capex outlined in the PFS.
Given high level demand for quality battery grade lithium it is expected that contracts will have a minimum 10-year life with high level take or pay clauses included. This strategy will assist the company to achieve best in class financing despite having no credit rating.
LKE recently raised $20m at $0.165/share. Funds were raised to complete the DFS, exploratory drilling, pre-construction works and provide sufficient working capital to FID.
Definitive Feasibility Study (DFS) – to underwrite, funding, partnerships and off-take arrangements • The DFS is funded, underway and should complete early 1Q22 • On site solar power could reduce gas usage and improve value; and • Construction expected to start within 6-months of DFS completion
The Kachi DFS, which commenced in in January 2021 and is expected to complete early 2022, will incorporate the high purity battery test results from both Hazen and Novonix, results from the planned Demonstration plant and market demand projections.
Project de-risking is essential ahead of finalizing the DFS being run by international engineering consultant Hatch. This process, which includes above, although not yet complete, is well under way and will confirm the projects final plant capacity.
The Demonstration plant, which will support the DFS work, is expected to be a 3-5x scale up of the successful pilot plant, which was a 1,000x scale up from original bench-scale testing. (Refer; 20 October 2020 ASX release). In effect scale-up risk has already been significantly reduced and as such the smaller scale up, which is modular in design, is unlikely to yield materially different results.
The DFS will reassess pricing assumptions as indicated in the refresh of the PFS results, recently released to the market. In establishing scale, Hatch will also consider demand for LKE’s high purity 99.97% battery quality lithium carbonate, which according to Novonix, performs well compared to other commercially available lithium carbonate used by Tier-1 customers in a NMC622 battery cell.
Amongst other assumptions, the DFS is expected to look at:
• Reducing onsite costs/t of LCE, which along with contingency totalled 51% of the total US$544m capex, detailed in the PFS; and
• Potential to install cheaper and cleaner solar power and/or wind power rather than buying gas at US$21/MMbtu, as was assumed in the PFS.
The recent $20m raising will fund the DFS, additional drilling to prove up a reserve of size, construction of the on site Demonstration plant and working capital needs.
LKE recently confirmed that associated work-streams to run in parallel with the Kachi DFS include the environmental and social impact study (ESIA) as well as continued community engagement. The DFS is also expected to rate CO2e project emissions and provide transparency around the Kachi supply chain so that customers and the market alike can better understand ESG benefits.
Monday, 29 March 2021
RESEARCH REPORT
Page 12 of 19
The EV Megatrend – responsibly sourced lithium the “new oil” Ultra pure battery grade lithium supply opportunity
Pre Feasibility Study (PFS) – price assumption recently refreshed • PFS completed by Hatch in April 2020 and refreshed mid March 2021 • Lithium price increased 40% from 11,000/t to US$15,500/t • No other assumptions were changed from original PFS leading to; • A 110% increase in after tax project NPV8 from US$758m to US$1,580m
The original PFS performed by Hatch was released in April 2020 to an approximate -20% to +30% level of accuracy for capital and operating costs. The DFS, which is also being undertaken by Hatch, is expected to tighten this range of accuracy to 10% to 15%.
The original PFS demonstrated that the Kachi project was both technically and financially viable at a lithium price of US$11,000/t.
The PFS was recently refreshed to reflect strong demand and rising LCE prices. We acknowledge there is no futures price for lithium and thus market transparency is not as clear as other battery chemicals. However, the lithium price upgrade from US$11,000/t to US$15,500/t (cif Asia) remains in line with other recently released PFS’s and is still over 30% below peak pricing of 2018. [to arrive at our valuation we use US$14,500/t]. The risk this assumption is too high is ameliorated by the 99.97% purity qualification by its battery grade lithium carbonate. Other highlights of the PFS refresh include;
• Kachi annual EBITDA was increased from US$155m to US$260m (+67%) • The life of project EBITDA was increased from US$3.9Bn to US$6.4Bn • The life of project sales was increased from US$7Bn to US$9.8Bn (+40%) • The years to breakeven was reduced from 5 to 3-years • Suggests the DFS will continue to keep production at 25,500t/year • Capex & opex remained unchanged at US$544m & US$4,168/t respectively. The US$90m contingency is unchanged; and • No provision for price or cost escalation was made. All cost inputs remain in 2019 US$.
LKE recently announced advisors continue to seek Export Credit Agency Debt.
CCR Valuation & Comparative Analysis
CCR Model STEP-1 – Risk the refreshed PFS by 50%
CCR modelled the Kachi project along the lines of the original PFS assumptions used by Hatch and then recalibrated further to align with the LKE results of the refreshed PFS. We call this a Phase-1 development and effectively de-risk the PFS by 50%. The remaining 50% of Phase-1 value could be achieved as catalysts like off-take agreements, funding, partners etcetera are achieved. By the time FID is declared, the project might be considered 80% de-risked. Ultimate, de-risking could occur with a successful commissioning of the project. This forms the base case of our Phase-1 valuation. Given strong demand and 3.8mt of LCE remaining un-modelled in the total resource category, it is quite reasonable to assume the company might seek to develop as much resource as demand for its product enables…GOTO to step-2.
STEP-2 – Risk a potential expansion by 90%, that is, use only 10% of potential NPV8
Optionality is considered through a Phase-2 development. Over recent weeks, the CEO has suggested Kachi could be doubled to 51,000t/year. Obviously, this is an aspirational target but from a market perspective we consider it entirely possible. We have modelled a doubling and taken comments made over the last 6-months to frame our upside model. We then de-risk the Phase-2 expansion to just 10% of value, in other words we have only taken 10% of that value and added it to our base case outcomes. Once again, as clarity around how any expansion might look, as we progress through time might lead to further de-risking.
STEP-3 – Value other inherent optionality in asset portfolio
The Cauchari Brine project is “located adjacent to major world class brine projects in production or construction, including Orocobre’s Olaroz lithium production and adjoins the Ganfeng Lithium/Lithium Americas’ Cauchari project.
Drilling at LKE’s Cauchari project has intercepted lithium brines over a 506m interval with high grades averaging 493mg/L lithium (117-460m) to 540mg/L lithium. These results are similar to lithium brines in adjoining leases and infer an extension and continuity of these brines into LKE’s leases”. Based on the early stage of exploration here we ascribe a value of $40m to the Cauchari brine lease. We recognise that this project could be developed or could be used as a funder for the Kachi development.
We then push our updated Kachi project into our nominal corporate model, which takes account of corporate costs, cost and revenue inflation, asset depreciation taxes and funding. When valuing LKE, we apply a discount rate of 8% (in line with industry practices) to real project cashflows and a nominal post tax WACC of 10% to corporate costs.

Monday, 29 March 2021
RESEARCH REPORT
Page 13 of 19
The EV Megatrend – responsibly sourced lithium the “new oil” Ultra pure battery grade lithium supply opportunity
Some of the assumptions we have used in our CCR model include;
• Phase-1 production of 25,500t/year for 25-years, in line with original and refreshed PFS, produces 62% of the indicated resource and ~15% of the total resource
• Phase-2 the half-year accounts suggest production could be doubled from 25,500t to 51,000t/year. As there is only sufficient indicated resource for 20-years, we assume production will only double from year 5 for duration of 20-years. The price of LKE’s high purity lithium is priced at US$14,500/t in real terms (less than the US%15,500 used in the PFS).
• We assume tax of 25%, royalty of 3% and an export tax of 5% in line with other Argentinian producers • We understand that depreciation can be accelerated and model this in line with PFS expectations • Opex/t should decline with economies of scale and the use of solar power over more expensive gas on site. Consequently,
we have lowered costs from US$4,168/t reported for Phase-1 to US$3,300/t for a two phase expanded project; and • Discussions with the company suggest using the six-tenth rule for capex when doubling production as outlined in the
AUSIMM monograph 27 within the Cost Estimation Handbook. This results in an increase in capex to US$842m (assuming the contingency remains at 16%).
PROJECT ASSUMPTIONS PFS outcomes PFS upgrade CCR Upside Option Leases hectares 220,000 220,000 220,000 JORC Indicated Resource mt LCE 1.0 1.0 1.0 Construction period yrs 2 2 2 Project life yrs 25 25 25
Production rate LCE t/yr 25,500 25,500 51,000 Li grade to DLE plant Mg/L 250 250 250 Recovery % 83% 83% 83%
Capex (start-up) US$m 544 544 840 Cash cost (Opex) US$/t 4,178 4,178 3,300 Lithium carbonate price (cif Asia) US$/t 11,000 15,500 14,500
PFS Financial Outcomes Sales, average annual US$m 280 400 792 EBITDA, average annual US$m 155 257 558 Sales, life of project US$m 7,030 9,845 17,828 EBITDA, life of project US$m 3,890 6,402 12,478
Payback year year 4 3
Un-risked Un-risked Un-risked NPV8 (real, post tax) US$m 748 1,580 3,035 NPV8 (real, post tax) A$m 997 2,107 4,046 IRR (post tax) % 22 35 44
CCR option value – provides upside The lithium price reached a peak of US$24,000/t in 2018 before unwinding over the last few years as EV’s failed to gain traction. This time does appear to be different, as big scale storage technology has developed enough to support energy integration between the grid, house and car. Volkswagen is leading aggressively in this area bringing digitization, the cloud and electrification together to accelerate its rollout of carbon neutral EV’s.
Our modelling, based on the original and refreshed PFS, and expansion option, suggests a valuation today of $0.98/share rising to $2.51/share by 2023/4, if project de-risking occurs as outlined below.
Risked/BLENDED $/share NOW 1Yr 2Yr 3Yr Phase-1 Risking 50% 70% 85% 100% Phase-2 Risking 10% 10% 35% 50% No of Shares (Fully Diluted) 1,047m 1,047m 1,246m 1,246m NPV Post Tax / Share $0.98 $1.53 $2.51 $3.09 12-Month Target Price (based on 75% correlation to NPV $0.73 $1.14 $1.88 $2.31

Monday, 29 March 2021
RESEARCH REPORT
Page 14 of 19
The EV Megatrend – responsibly sourced lithium the “new oil” Ultra pure battery grade lithium supply opportunity
RISKED EARNINGS FORECAST, CASHFLOW & BALANCE SHEET
PROFIT AND LOSS (Year End June) PRODUCTION ESTIMATES (Net)Year ending 30 June Unit 2020A 2021F 2022F 2023F 2024F Year ending 30 June Unit 2020A 2021F 2022F 2023F 2024FRevenue A$m - - - - 40.9 PROJECTSExpenses A$m (4.5) (4.8) (3.0) (3.2) (13.7) Brine treated mcm - - - 4 18EBITDA A$m (4.5) (4.8) (3.0) (3.2) 27.2 Brine grade mg/L Li - - 250 250 250Depreciation A$m (0.0) (0.0) (0.0) (0.0) (0.0) Contained lithium t LCE - - 5,080 23,850 29,150EBIT A$m (4.5) (4.8) (3.0) (3.2) 27.2 Recovery % - - 83% 83% 83%Net interest (expense) A$m (0.5) - - - (10.4) Recovered lithium t LCE - - 4,228 19,848 24,259PBT A$m (5.0) (4.8) (3.0) (3.2) 16.8Tax expense A$m (0.0) - - - -NPAT (pre-abnormal) A$m (4.9) (4.8) (3.0) (3.2) 16.8 PRICING & FOREX ASSUMPTIONSAbnormal items A$m - - - - - Year ending 30 June Unit 2020A 2021F 2022F 2023F 2024FNPAT (reported) A$m (4.9) (4.8) (3.0) (3.2) 16.8 PRICES
Lithium carbonate US/kg 16 16 16 16CASH FLOW Lithium carbonate (LCE) US/t 14,500 14,863 15,234 15,615Year ending 30 June Unit 2020A 2021F 2022F 2023F 2024F Lithium carbonate (LCE) A$/t 19,333 19,817 20,312 20,820OPERATING CASHFLOW CURRENCYNPAT A$m (5) (5) (3) (3) 17 AUD/USD (PFS) A$/US$ 0.75 0.75 0.75 0.75 0.75Add: non-cash items A$m 1 2 0 0 (4)Change in working capital A$m - - - - -Operating cash flow A$m (3.5) (3) (3) (3) 12 MARKET MODELINVESTING CASHFLOW Year ending 30 June UnitPP&E (Capex less depreciation) A$m - - - (110) (263) Market cap A$$m 325Exploration & evaluation A$m (4) (3) (10) (11) (5) Cash A$$m 25Sustaining capital (from 2028) A$m - - - - - Debt A$$m -Rehabilitation charge A$m - - - - - Enterprise value (EV) A$$m 300Investing cash flow A$m (4) (3) (10) (121) (269)FINANCING CASHFLOW EV / NPV8 as in PFS refresh 19%Share issues A$m 6 20 - - -Project equity A$m - - - 119 - Cash % market cap % 8%Project debt A$m - - - 278 - No of shares m 1,047Other A$m (1) - - - -Financing cash flow A$m 5 20 - 397 -Surplus Cashflow A$m (3) 14 (13) 273 (256) DISCOUNTED CASHFLOW MODEL
Unrisked Unrisked Risked BALANCE SHEET NPV8 (Post tax) NPV ($m) $/sh RiskingNPV ($m) $/shYear ending 30 June Unit 2020A 2021F 2022F 2023F 2024FASSETS Kachi Lithium Phase-1 1,690 1.61 50% 837 0.80Cash (incl. raising) A$m 0 14 1 274 29 Kachi Expansion Phase-2 1,597 1.53 10% 152 0.14Accounts receivable A$m 0.3 0.3 - - - Total Asset Level Cashflow 3,288 3.14 989 0.94PP&E (Capex less depreciation) A$m - (0) (0) 110 373 Other Lithium Assets 53 0.05 100% 53 0.05Exploration & evaluation assets A$m 17 20 31 41 46 -Corporate Costs (40) (0.04) 100% (40) (0.04)Other A$m 0 - - - - +Net Cash 25 0.02 100% 25 0.02Total assets A$m 18 35 32 426 448 -Debt - - 100% - -LIABILITIESCreditors A$m 1 1 1 1 1 Equity value 3,326 3.18 100% 1,027 0.98Provisions A$m - - - - -Borrowings A$m - - - 278 278 Equity value 1,027Other A$m 0 0 0 0 0 NoSh - diluted (m) 1,047Total liabilities A$m 1 1 1 279 279 Value per share ($/sh) 0.98SHAREHOLDER'S EQUITYShare capital A$m 35 57 57 177 183Reserves A$m 3 3 3 3 3 VALUATION SENSITIVITIESRetained earnings A$m (22) (27) (30) (33) (16) LITHIUM PRICES US$/t $m $/sh % diffTotal equity A$m 17 34 31 147 170 Base 14,500 1,027 0.98Diluted weighted average NoSh m 1,047 1,047 1,246 1,246 1,246 -15% Low 12,325 750 0.72 -27%
+15% High 16,675 1,327 1.27 29%RATIOS EXCHANGE RATE (long term) AUD/USD $m $/sh % diffASSETS Unit 2020A 2021F 2022F 2023F 2024F Base 0.75 1,027 0.98Net Cash (Debt) A$m 0 14 1 (4) (250) +0.1 Low 0.85 919 0.88 -11%Net Debt/Equity % 0% 0% 0% 3% 147% -0.1 High 0.65 1,206 1.15 17%EPS cps (0) (0) (0) (0.00) 0.01 WACC (post tax) $m $/sh % diffPE ratio ratio -66.2x -67.4x -129.3x -120.1x 23.0x Base 8.0% 1,027 0.98Ebitda ratio ratio - - - 0.0x 0.7x Low 7.0% 1,174 1.12 14%EV/Ebitda ratio ratio - - - -126.0x 14.9x High 9.0% 930 0.89 -9%
PRICE: $0.31
Monday, 29 March 2021
RESEARCH REPORT
Page 15 of 19
The EV Megatrend – responsibly sourced lithium the “new oil” Ultra pure battery grade lithium supply opportunity
Appendix
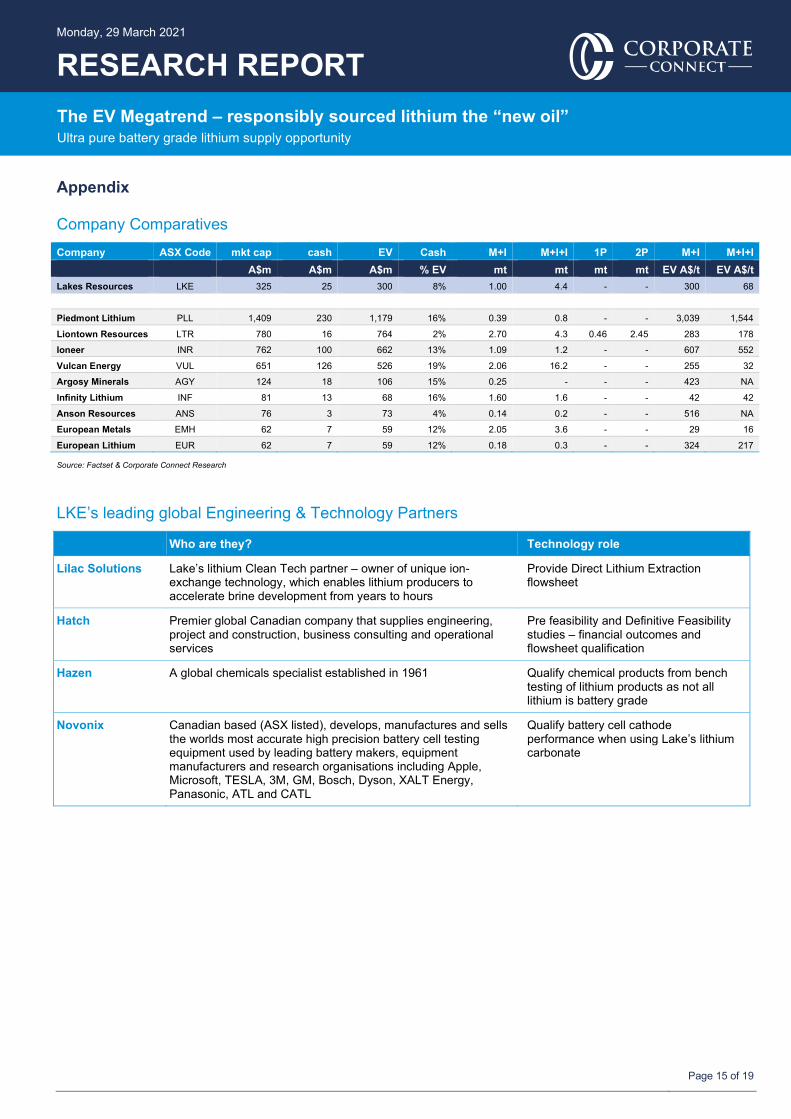
Company Comparatives Company ASX Code mkt cap cash EV Cash M+I M+I+I 1P 2P M+I M+I+I A$m A$m A$m % EV mt mt mt mt EV A$/t EV A$/t Lakes Resources LKE 325 25 300 8% 1.00 4.4 - - 300 68
Piedmont Lithium PLL 1,409 230 1,179 16% 0.39 0.8 - - 3,039 1,544
Liontown Resources LTR 780 16 764 2% 2.70 4.3 0.46 2.45 283 178
Ioneer INR 762 100 662 13% 1.09 1.2 - - 607 552
Vulcan Energy VUL 651 126 526 19% 2.06 16.2 - - 255 32
Argosy Minerals AGY 124 18 106 15% 0.25 - - - 423 NA
Infinity Lithium INF 81 13 68 16% 1.60 1.6 - - 42 42
Anson Resources ANS 76 3 73 4% 0.14 0.2 - - 516 NA
European Metals EMH 62 7 59 12% 2.05 3.6 - - 29 16
European Lithium EUR 62 7 59 12% 0.18 0.3 - - 324 217
Source: Factset & Corporate Connect Research
LKE’s leading global Engineering & Technology Partners
Who are they? Technology role
Lilac Solutions Lake’s lithium Clean Tech partner – owner of unique ion-exchange technology, which enables lithium producers to accelerate brine development from years to hours
Provide Direct Lithium Extraction flowsheet
Hatch Premier global Canadian company that supplies engineering, project and construction, business consulting and operational services
Pre feasibility and Definitive Feasibility studies – financial outcomes and flowsheet qualification
Hazen A global chemicals specialist established in 1961 Qualify chemical products from bench testing of lithium products as not all lithium is battery grade
Novonix Canadian based (ASX listed), develops, manufactures and sells the worlds most accurate high precision battery cell testing equipment used by leading battery makers, equipment manufacturers and research organisations including Apple, Microsoft, TESLA, 3M, GM, Bosch, Dyson, XALT Energy, Panasonic, ATL and CATL
Qualify battery cell cathode performance when using Lake’s lithium carbonate

Monday, 29 March 2021
RESEARCH REPORT
Page 16 of 19
The EV Megatrend – responsibly sourced lithium the “new oil” Ultra pure battery grade lithium supply opportunity
Board & Management Stephen Promnitz is Managing Director, bringing to bear his broad technical and financial perspectives and experiences within the mining industry from exploration to production with a focus on South America in particular.
Prior to Lake, Stephen was CEO of listed Australian gold explorer Indochine Mining, and 2IC of Kingsgate Consolidated, a listed Pacific Rim gold producer with assets in Chile. Prior to this Stephen held senior corporate finance roles with both Westpac and Citi.
He started his career as a geologist with global mining heavyweight Rio Tinto before managing Western Mining Corporation’s mining operations in Argentina. He holds a Bachelor of Science Honours (Natural Resources) from Monash University and is fluent in Spanish.
Stuart Crow is Chairman and Non Executive Director. Stuart has global experience in financial services, corporate finance, investor relations, international markets, salary packaging and stock broking. Is also a Non Executive Director of listed Ironridge Resources and Todd River Resources.
Dr Nick Lindsay is an Executive Technical Director and has over 25 years’ experience in Argentina, Chile and Peru in technical and commercial roles in the resources sector with major and mid-tier companies, as well as start-ups. A fluent Spanish speaker, he has successfully taken companies in South America, such as Laguna Resources, which he led as Managing Director, from inception to listing, development and subsequent acquisition.
He is currently CEO of Manuka Resources Ltd, an unlisted company, having previously held the position of President – Chilean Operations for Kingsgate Consolidated Ltd. Nick is a member of the AusIMM and the AIG and holds a Bachelor of Science (Honours) in Geology, a PhD in Metallurgy and Materials Engineering as well as an MBA.
Robert Trzebski is a Non Executive Director is an international mining executive, who has substantial operational, commercial and technical experience in global mining markets including Argentina.
He is currently Chief Operating Officer of Austmine Ltd and holds a degree in Geology, a PhD in Geophysics, a Masters in Project Management and has more than 30 years’ professional experience in project management and mining services. Dr Trzebski is a fellow of the Australian Institute of Mining and Metallurgy and is fluent in Spanish, German and English.
Company Risks Significant risks are associated with the development and commissioning of any operation. The main risk areas include work health and safety, mining operations, processing operations, environmental, transport, market, financial and regulatory. We have yet to see a project risk assessment, which will be required to better access LKE’s project and corporate risk.
This outstanding, we assess key risks below as;
Political Risk – Operating in foreign jurisdictions comes with risk. A concern in South America has been the use of large evaporation ponds. The Kachi project will not use ponds and water extracted will return to the rocks minus the lithium. This we believe greatly reduces single political risk against this project. Regional risk can be further reduced through insurance during the operational phase and funding from ECA's will also reduce political risk as these are considered more Government-to-Government funding in nature.
Market Risk – Mitigated by the use of lithium in all battery settings. The slump in lithium prices has greatly impacted the developments of lithium projects globally. With EV demand forecast surging, supply chains localizing away from China and EV green deal initiatives in Europe and the US likely to follow, lithium prices have responded rising considerably since November 2020.
Forex & Commodity Price Risk – Fluctuations in lithium prices and currencies may adversely impact the company’s earnings and valuation. This is in part mitigated by the ESG advantage that Kachi development carries and strong growth forecasts suggesting demand will increase between 8 – 18 times by 2030. Supply will not meet demand unless profitability is returned to the sector. It is noted that lithium carbonate prices have already risen 40% from lows in October 2020.
New Disruptive Technology Risk – Direct Lithium Extraction technology risk is mitigated in part by Lakes successful pilot program that extracted LCE at 99.97% making it the most pure LCE extracted globally to date. DLE in the minerals space is gaining traction as evidenced by Vulcan Energy, Standard Lithium and Livent. Scaling risk remains as it does with all operations and is in part mitigated through the use of modules that are identical to those used in the successful pilot plant.
Water Risk – Mitigated by the use of direct lithium extraction (DLE) rather than evaporating valuable and sparse water from large ponds, which has caused political and social angst. At Kachi the brine undergoes DLE where the lithium is extracted from the water and then re-injected back into the rocks where the original brine was produced. Evaporation is negligible.
Reserve & Project Risk – Mitigated in part by the development of 63% of existing indicated reserves and 16% of indicated and inferred resources. Further exploration and migration of resource to the reserve category is required to better control this risk. At this stage relative to where Lake is in its development we consider reserve risk to be low.

Monday, 29 March 2021
RESEARCH REPORT
Page 17 of 19
The EV Megatrend – responsibly sourced lithium the “new oil” Ultra pure battery grade lithium supply opportunity
Funding Risk – Mitigated by high quality lithium, robust project financials and 100% ownership of the Kachi Project as well as other exploration blocks held within Lakes Resources Argentinian lithium portfolio. New funds can be raised through project equity sell-downs, sale of other permits, the issuance of new equity and Government grants.
Country Risk – We expects that country risk will be mitigated through the use of insurance and ECA funding.
Battery Cell Risk – Following the US ban on SK Innovation, there is a risk that the US battery cell supply chain will not be able to meet surging demand for EV’s. This risk is mitigated in part for LKE by the momentum the project has as a result of its low carbon footprint. Staying at the front of the queue will be paramount.
COVID Risk – continues to fluctuate as it does around the world. The on-site Demonstration Plant is expected to commission end 2021. There is risk that this commissioning could be delayed and that this delay could push out the start up date of the Kachi Project beyond mid 2022. The vaccination rollout will in part mitigates interruption risk.
Top 20 Shareholders
Lake Resources N.L. Security Class: LKE - Ordinary Shares
As at Date: 29-Mar-2021
Display top: 20
Position Holder Name Holding % IC
1 CITICORP NOMINEES PTY LIMITED 85,935,076 8.44% 2 MERRILL LYNCH (AUSTRALIA) NOMINEES PTY LIMITED 51,299,736 5.04% 3 ACUITY CAPITAL INVESTMENT MANAGEMENT PTY LTD <ACUITY CAPITAL HOLDINGS A/C> 40,000,000 3.93% 4 BNP PARIBAS NOMS PTY LTD <DRP> 34,465,592 3.39% 5 BNP PARIBAS NOMINEES PTY LTD <IB AU NOMS RETAILCLIENT DRP> 24,895,420 2.45% 6 MR SIMON JAMES KALINOWSKI 16,772,541 1.65% 7 MR STEPHEN PROMNITZ 13,830,658 1.36% 8 HSBC CUSTODY NOMINEES (AUSTRALIA) LIMITED 12,162,763 1.19% 9 RAYMOND JAMES <JAMES SUPER FUND> 10,119,046 0.99% 10 SYDNEY BUSINESS ADVISERS PTY LTD <CF SUPER FUND NO2 A/C> 10,000,000 0.98% 11 MR DANIEL RUBEN BONAFEDE 9,500,000 0.93% 12 NATIONAL NOMINEES LIMITED 9,392,934 0.92% 13 PURPLE MANGGIS PTY LTD <PURPLE MANGGIS A/C> 9,194,832 0.90% 14 202 LIMITED 9,075,152 0.89% 15 J P MORGAN NOMINEES AUSTRALIA PTY LIMITED 8,633,775 0.85% 16 HSBC CUSTODY NOMINEES (AUSTRALIA) LIMITED - A/C 2 6,736,365 0.66% 17 OUTBACK FORMWORK PTY LTD <WILLATON SUPER FUND A/C> 6,367,364 0.63% 18 FLUID INVESTMENTS PTY LTD 6,120,000 0.60% 19 MR ANDREW ROBERT POWELL <THE PAN FAMILY A/C> 5,832,500 0.57% 20 MS AINSLEY RUTH WILLIAMS 5,722,618 0.56%
Totals 376,056,372 36.93% Total Issued Capital 1,018,190,431 100.00%
Report Generated on 29-Mar-2021 at 12:21 PM

Monday, 29 March 2021
RESEARCH REPORT
Page 18 of 19
The EV Megatrend – responsibly sourced lithium the “new oil” Ultra pure battery grade lithium supply opportunity
Corporate Connect Research Pty Ltd Independent Research Report Disclaimer General disclaimer and copyright
Corporate Connect Research Pty Ltd Independent Research Report Disclaimer General disclaimer and copyright This report (“report” or “Research”) has been commissioned by the Company the subject of this report (“Antisense Therapeutics”) and prepared and issued by (Dianne Brookman, AR number 1283213) of Corporate Connect Research Pty Ltd (“Corporate Connect Research”) (ABN 95640 464 320 – Corporate Authorised Representative (1283213) of Australian Financial Services Licence (AFSL) Number 88045) in consideration of a fee payable by the Company. Corporate Connect Research may be paid additional fees for the provision of additional services to the Company but Corporate Connect Research is not remunerated for any investment banking or similar services. Corporate Connect Research never accepts payment in stock, options or warrants for any of its services. Where Corporate Connect Research has been commissioned to prepare content and receives fees for its preparation, fees are paid upfront in cash and NO part of the fee, compensation or employee remuneration paid will either directly or indirectly impact the content provided. Accuracy of content: All information used in the publication of this report has been compiled from publicly available sources that are believed to be reliable, however Corporate Connect Research does not guarantee the accuracy or completeness of this report and has not sought for this information to be independently verified. Opinions contained in this report represent those of the analyst of Corporate Connect Research (Dianne Brookman, AR number 1283213) at the time of publication. The analyst has received assistance from the Company in preparing this document. The Company has provided the analyst with access to senior
Accuracy of content:
All information used in the publication of this report has been compiled from publicly available sources that are believed to be reliable, however Corporate Connect Research does not guarantee the accuracy or completeness of this report and has not sought for this information to be independently verified.
Opinions contained in this report represent those of the analyst of Corporate Connect Research (Marc Sinatra, AR number 1283214) at the time of publication.
The analyst has received assistance from the Company in preparing this document. The Company has provided the analyst with access to senior management and information on the Company and industry. The analyst does not hold an economic interest in the securities covered in this report or other securities issued by the subject issuer.
From time to time, Corporate Connect Research’s representatives or associates may hold interests, transact or hold directorships in, or perform paid services for, companies mentioned in this report. Corporate Connect Research and its associates, officers, directors and employees, may, from time to time, hold securities in the companies referred to in this report and may trade in those securities as principal and in a manner that may be contrary to recommendations mentioned in this report.
As part of due diligence, the analyst has independently and critically reviewed the assistance and information provided by the Company to form the opinions expressed in the report. However, due diligence site visits have not been undertaken at this time. Care has been taken by the analyst to maintain objectivity in preparing this report and making any recommendation. The analyst is responsible for ensuring that this report accurately reflects his or her view of the matters set out in it and that it was prepared in an independent manner.
Forward-looking information or statements in this report contain information that is based on assumptions, forecasts of future results and estimates of amounts not yet determinable, and therefore involve known and unknown risks, uncertainties and other factors, which may cause the actual results, performance or achievements of their subject matter to be materially different from current expectations. This report is prepared as at the date stated in it, and to the maximum extent permitted by law, Corporate Connect Research (on its own behalf and on behalf of the analyst) disclaims any responsibility to inform any recipient of this report of any matter that subsequently comes to its notice, which may affect any of the information contained in this report.
Exclusion of liability:
To the fullest extent allowed by law, Corporate Connect Research (on its own behalf and on behalf of the analyst) shall not be liable to any person for any direct, indirect or consequential losses, loss of profits, damages, costs or expenses incurred or suffered by you or any other person arising out or in connection with the access to, use of or reliance on any information contained in this report.
No guarantees or warranties regarding accuracy, completeness or fitness for purpose are provided by Corporate Connect Research (on its own behalf and on behalf of the analyst), and under no circumstances will any of Corporate Connect Research’s analysts, representatives, associates or agents be liable for any loss or damage, whether direct, incidental or consequential, caused by reliance on or use of the content.
General Advice Warning
This report and any other Research must not be construed as personal advice or recommendation nor as an inducement to trade the report’s named company or any other security. Corporate Connect Research encourages investors to seek independent financial advice regarding the suitability of investments for their individual circumstances and recommends that investments be independently evaluated. Investments involve risks and the value of any investment or income may go down as well as up. Investors may not get back the full amount invested. Past performance is not indicative of future performance. Estimates of future performance are based on assumptions that may not be realised. If provided, and unless otherwise stated, the closing price provided is that of the primary exchange for the issuer’s securities or investments. The information contained within the Research is published solely for information purposes and is not a solicitation or offer to buy or sell any financial product or participate in any trading or investment strategy.
Analysis contained within the Research is based upon publicly available information and may include numerous assumptions. Investors should be aware that different assumptions can and do result in materially different results. The Research is distributed only as may be permitted by law. It is

Monday, 29 March 2021
RESEARCH REPORT
Page 19 of 19
The EV Megatrend – responsibly sourced lithium the “new oil” Ultra pure battery grade lithium supply opportunity
not intended for distribution or use by any person or entity located in a jurisdiction where distribution, publication, availability, or use would be prohibited. Corporate Connect Research makes no claim that the Research content may be lawfully viewed or accessed, whether inside or outside of Australia. Access to the Research content may not be legal for certain persons and in certain jurisdictions. If you access this service or content from outside of Australia, you are responsible for compliance with the laws of your jurisdiction and/or the jurisdiction of the third party receiving such content. The Research is provided to our clients through its website and our distribution partners (www.sharecafe.com.au and www.informedinvestor.com.au).
Some Research products may also be made available to its clients via third party vendors or distributed through alternative electronic means as a convenience. Such alternative distribution methods are at Corporate Connect Research’s discretion.
Access and use
Any access to, or use of, the Research is subject to the Terms and Conditions of Corporate Connect Research. By accessing or using the Research you hereby agree to be bound by our Terms and Conditions [https://corporateconnect.com.au/financialservices-guide/] and hereby consent to Corporate Connect Research collecting and using your personal data (including cookies) in accordance with our Privacy Policy (https://corporateconnect.com.au/privacy/), including for the purpose of a) setting your preferences and b) collecting readership data so Corporate Connect Research may deliver an improved and personalised service to you. If you do not agree to our Terms and Conditions and/or if you do not consent to Corporate Connect Research’s use of your personal data, please do not access this service.
Copyright of the information contained within the Research (including trademarks and service marks) are the property of the irrespective owners. The Research, or any portion thereof, may not be republished, reprinted, sold, or redistributed without the prior and written consent of Corporate Connect Research.
Australia
Corporate Connect Research Pty Ltd is a Corporate Authorised Representative (1283214) of PacReef Asset Management Pty Ltd who holds an Australian Financial Services Licence (Number: 488045) which allows Corporate Connect Research to offer financial service advice to wholesale clients. Any advice given by Corporate Connect Research is general advice only and does not consider your personal circumstances, financial situation, needs or objectives. You should, before acting on this advice or making any investment decision or a decision about whether to acquire or dispose of a financial product mentioned in any Research, consider the appropriateness of the advice, having regard to your objectives, financial situation, and needs. If our advice relates to the acquisition, or possible acquisition, of a particular financial product you should read any relevant Product Disclosure Statement or like instrument, and also seek independent financial, legal and taxation advice.
New Zealand
The research in this document is intended for New Zealand resident professional financial advisers or brokers This is not a solicitation or inducement to buy, sell, subscribe, or underwrite any securities mentioned or in the topic of this document. For the purpose of the FAA, the content of this report is of a general nature, is intended as a source of general information only and is not intended to constitute a recommendation or opinion in relation to acquiring or disposing (including refraining from acquiring or financial advice, is intended only as a “class service” provided by Corporate Connect Research within the meaning of the FAA (i.e. without taking into account the particular financial situation or goals of any person). As such, it should not be relied upon in making an investment decision.
United Kingdom
This document is prepared and provided by Corporate Connect Research for information purposes only and should not be construed as an offer or solicitation for investment in any securities mentioned or in the topic of this document. A marketing communication under FCA Rules, this document has not been prepared in accordance with the legal requirements designed to promote the independence of investment research and is not subject to any prohibition on dealing ahead of the dissemination of investment research.
This Communication is being distributed in the United Kingdom and is directed only at (i) persons having professional experience in matters relating to investments, i.e. investment professionals within the meaning of Article 19(5) of the Financial Services and Markets Act 2000 (Financial Promotion) Order 2005, as amended (the "FPO") (ii) high net-worth companies, unincorporated associations or other bodies within the meaning of Article 49 of the FPO and (iii)
persons to whom it is otherwise lawful to distribute it. The investment or investment activity to which this document relates is available only to such persons. It is not intended that this document be distributed or passed on, directly or indirectly, to any other class of persons and in any event and under no circumstances should persons of any other description rely on, or act upon, the contents of this document.
This Communication is being supplied to you solely for your information and may not be reproduced by, further distributed to or published in whole or in part by, any other person.
United States
Corporate Connect Research relies upon the "publishers' exclusion" from the definition of investment adviser under Section202(a)(11) of the Investment Advisers Act of 1940 and corresponding state securities laws. This report is a bona fide publication of general and regular circulation offering impersonal investment-related advice, not tailored to a specific investment portfolio or the needs of current and/or prospective subscribers. As such, Corporate Connect
Research does not offer or provide personal advice and the research provided is for informational purposes only. No mention of a particular security in this report constitutes a commendation to buy, sell or hold that or any security, or that any particular security, portfolio of securities, transaction or investment strategy is suitable for any specific person.