the experiment and analysis of active mechanisms for
TRANSCRIPT

University of Nebraska - LincolnDigitalCommons@University of Nebraska - LincolnArchitectural Engineering -- Dissertations andStudent Research Architectural Engineering
7-2016
THE EXPERIMENT AND ANALYSIS OFACTIVE MECHANISMS FOR ENHANCINGHEAT AND MASS TRANSFER IN SORPTIONFLUIDSziqi shenUniversity of Nebraska-Lincoln, [email protected]
Follow this and additional works at: http://digitalcommons.unl.edu/archengdiss
Part of the Civil Engineering Commons, Environmental Engineering Commons, and theNanoscience and Nanotechnology Commons
This Article is brought to you for free and open access by the Architectural Engineering at DigitalCommons@University of Nebraska - Lincoln. It hasbeen accepted for inclusion in Architectural Engineering -- Dissertations and Student Research by an authorized administrator ofDigitalCommons@University of Nebraska - Lincoln.
shen, ziqi, "THE EXPERIMENT AND ANALYSIS OF ACTIVE MECHANISMS FOR ENHANCING HEAT AND MASSTRANSFER IN SORPTION FLUIDS" (2016). Architectural Engineering -- Dissertations and Student Research. 42.http://digitalcommons.unl.edu/archengdiss/42

THE EXPERIMENT AND ANALYSIS OF ACTIVE
MECHANISMS FOR ENHANCING HEAT AND MASS
TRANSFER IN SORPTION FLUIDS
by
Ziqi Shen
A THESIS
Presented to the Faculty of
The Graduate College at the University of Nebraska
In Partial Fulfillment of Requirements
For the Degree of Master of Science
Major: Architectural Engineering
Under the Supervision of Professor Yuebin Yu
Lincoln, Nebraska
July, 2016
THE EXPERIMENT AND ANALYSIS OF ACTIVE
MECHANISMS FOR ENHANCING HEAT AND MASS
TRANSFER IN SORPTION FLUIDS
Ziqi Shen, M.S.
University of Nebraska, 2016
Advisor: Yuebin Yu
This project was funded by American Society of Heating, Refrigerating, and
Air-Conditioning Engineers (ASHRAE RP-1462). It is a three years’ research,
including the literature review, labs construction, experiments and data analysis.
In this thesis, first of all, we conducted literature review of mechanism motion
influence on heat and mass transfer and additive effect in absorption chiller. This
part helps us understand the basic idea of how mechanism motion affects the heat
and mass transfer of sorption fluids and gives us reference on how to select the
experiment instrument and the experiment operation range.
In the second part, the instrument selection and lab construction are introduced.
A commercial absorption chiller, a vertical vibration table and a statistic water loop
system are used in our lab. This test facility has the capability of realizing
mechanism motion in real systems with adjustable wide range vibration and long
term stabilized auxiliary water supply. A commercial absorption chiller with a

capacity of 10kW is utilized in this project. A water loop system was constructed
to maintain a repetitive experimental condition when the outdoor conditions change.
We also installed a data acquisition system for in-line measurement of the solution
concentration and temperature and flow rate of the solution and water loops. We
can use these measurements to calculate the heat and mass transfer capacity in the
absorber in steady-state. The enhancement is obtained by comparing the
temperature differences, before a vibration and during a vibration.
In the third section, we illustrate the methodology of how to analyze the heat
and mass transfer in the absorber and the data under different conditions. We
separate the experiment into three big groups, including the conditions without
additive, with n-octanol additive and with 2-ethylhexanol(2EH) additive. Different
film thickness (spray amount), vibration frequency, and vibration amplitude
comparisons were considered under each condition. And we also cross-compared
all these three groups. The results of this project revealed the optimal frequency
and amplitude combinations (at 25 Hz & 0.2mm) for the absorption chiller tested
in this study. The results of this project provided information filling the knowledge
gap about the influence of mechanical motion in absorption chiller technology.
ACKNOWLEDGEMENTS
I would like to express my deepest gratitude to my advisor Dr. Yuebin Yu. He
is very patient and gave me huge help in my last few years’ research and study. He
pointed out my shortage and help me improve my time management, writing habits
and a lot of things I am lack of. And he is also a professor with an open mind. He
encouraged and helped me improve my ideas and systematic analysis of anything
new. He always gave me useful and great advices on how to improve this research.
His encouragement and persistence have inspired me to become consistent, reliable,
and hard-working, traits that I believe will continue to help me throughout my entire
life.
My gratitude also goes to Dr. Josephine Lau. She is one of the most important
members in this research. She led me into the research area and taught me how to
seriously treat research and study. This will help not only in my study, but also in
my further work.
I would like to thank Dr. Zhang Tian and Dr. Moe. You gave me precious
comments and advices. I also want to thank the engineers who build the lab for our
experiment. Shuangliang Energy Cooperation, Dongling LTD and Dingtuo INC. I
would like to thank Tianjin University of Commerce who provides huge help to
this project.

Finally, I want to thank my dad for the support. Without him, the experiment
could not be conducted such smoothly. He used almost all of his resource to help
our group build the lab and finish the experiments. And I want to thank my mom;
she is always supportive to me. And thank you all the friends who helped and
encouraged me in the past few years.

TABLE OF CONTENTS
Chapter 1 Introduction ...................................................................................................... 1
1.1 Introduction ........................................................................................................................1
1.2 Increase additive performance ............................................................................................4
1.3 Using inertia force to help form droplet ...............................................................................4
1.4 Thin out and surface fluctuation ..........................................................................................4
Chapter 2 Aims of the Project ............................................................................................ 6
Chapter 3 Literature review .............................................................................................. 7
3.1 Heat and mass transfer enhancement via active mechanisms ...............................................9
3.1.1 Flow-Induced vibration ........................................................................................................... 10
3.1.2 Vibration of a heat pipe .......................................................................................................... 11
3.1.3 Vibration of a wire and a coated metal .................................................................................. 13
3.1.4 Vapor-liquid interfacial vibration ............................................................................................ 14
3.1.5 Vibration of LiBr-H2o falling film absorber ............................................................................. 16
3.1.6 Vibration of an absorption chiller ........................................................................................... 17
3.1.7 Ultrasound vibration ............................................................................................................... 19
3.2 Passive techniques in absorbers for heat and mass transfer enhancement .......................... 23
3.3 Compound techniques in falling film absorbers .................................................................. 29
3.4 Discussion ......................................................................................................................... 30
3.5 Concluding Remarks .......................................................................................................... 31
Chapter 4 Lab Construction ............................................................................................. 32
4.1 There are challenges we are facing to accomplish constructing the test-rig: ........................ 33
4.2 Technical analysis and mechanism motion method ............................................................ 34
4.3 Absorption chiller introduction .......................................................................................... 35
4.4 Vibration table introduction .............................................................................................. 36
4.5 Sensing and data acquisition system .................................................................................. 37
4.6 In-line concentration measurement ................................................................................... 40
4.7 Thermostatic water loop systems ...................................................................................... 42
4.7.1 Chiller water unit .................................................................................................................... 44
4.7.2 Water tanks ............................................................................................................................. 44
4.7.3 Electric boiler .......................................................................................................................... 44
4.7.4 Water pumps .......................................................................................................................... 44
4.8 Equipment installation ...................................................................................................... 45
Chapter 5 Methodology and Data Analysis ...................................................................... 47
5.1 Mass transfer analysis ....................................................................................................... 47
5.2 Heat transfer analysis ........................................................................................................ 49
Chapter 6 Experiment plan introduction .......................................................................... 51
Chapter 7 Experiment result and analysis ........................................................................ 53
7.1 Short-term tests ............................................................................................................... 53

7.2 Long-term tests ................................................................................................................. 56
7.2.1 Different solution flow rate enhancement (Without additive) .............................................. 59
7.2.2 Different amplitude enhancement (25Hz) (Without additive) ............................................... 61
7.2.3 Different amplitude enhancement (15Hz) (Without additive) ............................................... 63
7.2.4 Different frequency enhancement (Without additive) ........................................................... 65
7.2.5 Different solution flow rate enhancement (With 2EH additive) ............................................. 67
7.2.6 Different amplitude enhancement (With 2EH additive) ......................................................... 69
7.2.7 Different frequency enhancement (With 2EH additive) ......................................................... 71
Chapter 8 Summary and discussions ................................................................................ 73
Chapter 9 Further study .................................................................................................. 75
References .......................................................................................................................... 76
Appendix ............................................................................................................................. 80
A. Continuous heat & mass transfer and cooling performance results (with 2EH additive) .............. 80
A.1. 15Hz 0.2mm ................................................................................................................................. 80
A.2. 20Hz 0.2mm ................................................................................................................................. 82
A.3. 25Hz 0.2mm ................................................................................................................................. 84
A.4. 30Hz 0.2mm ................................................................................................................................. 86
B. Parameters of the key sensors .................................................................................................. 88
C. Summary of long-term experiment results ................................................................................ 89
C.1. Detail information of different solution flow rates enhancement (Without additive) ............... 89
C.2. Detail information of different amplitudes enhancement (25Hz) (Without additive) ................ 91
C.3. Detail information of different frequencies enhancement (Without additive) .......................... 92
C.4. Detail information of different solution flow rates enhancement (With 2EH additive) ............. 93
C.5. Detail information of different amplitudes enhancement (With 2EH additive) .......................... 94
C.6. Detail information of different frequencies enhancement (With 2EH additive) ......................... 95

1
Chapter 1 Introduction
1.1 Introduction
Today social and economic development is facing the threat of primary energy being
increasingly exhausted. A lithium bromide absorption chiller is an effective refrigeration
system that can use low-grade thermal energy for cooling. However, the refrigeration
efficiency of an absorption chiller is not high compared to a mechanical vapor compression
cycle. Heat and mass transfer reinforcement for a lithium bromide absorption chiller has
been the main direction of research.
Producing cooling effect from absorption refrigeration systems can be traced back to
almost a century ago. In their emerging stage, however, with relatively low coefficient of
performance (COP), they could not keep pace with the popularity of vapor compression
systems that were commercialized later. In recent years, with ever-growing prices of
energy from one hand, and the existing battle against greenhouse gases (GHG) emissions
from the other, absorption refrigeration systems caught the attention of researchers and
industries. They are becoming commercially more accessible for various applications and
climatic conditions through the introduction of modified and adapted machines.
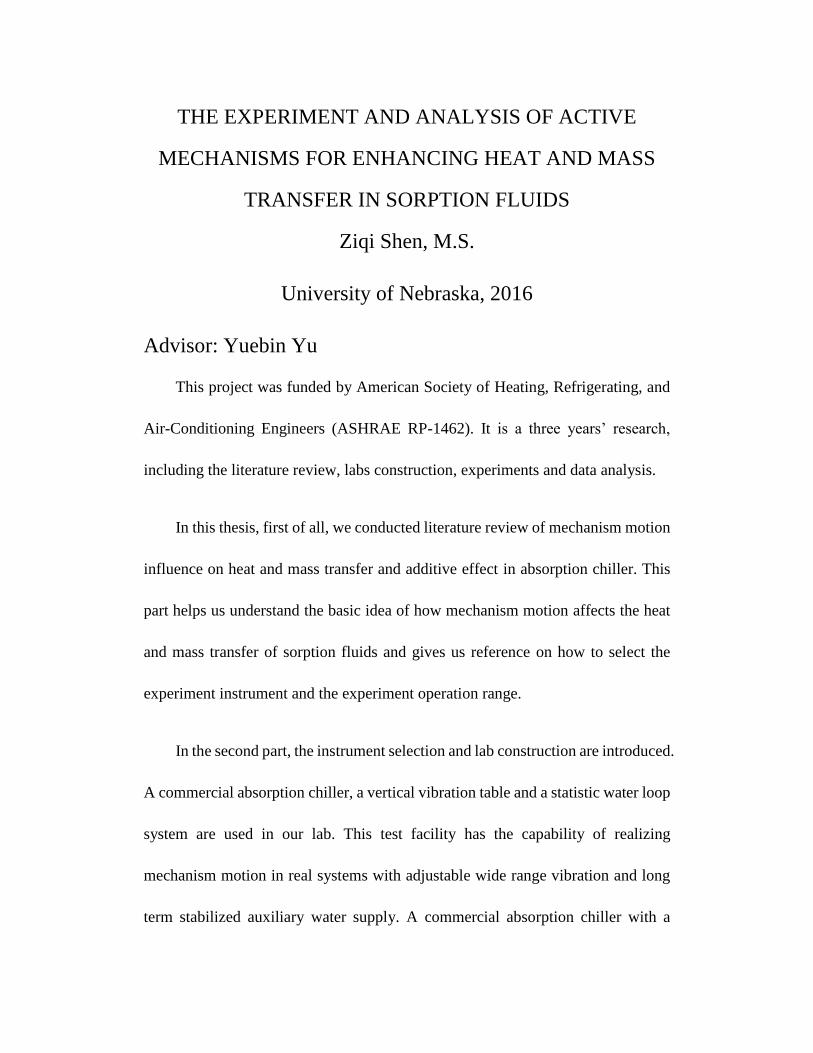
Similar to the physical processes in a conventional vapor compression cycle, the
absorption system uses its thermal compressor (including a generator, absorber, pump and
heat exchangers) to vaporize the water out of a lithium bromide/water solution and
compress the water vapor to a higher pressure. The cycle is illustrated in Fig. 1-1. The
2
compressed hot refrigerant vapor then condenses to the liquid state in a condenser. Heat is
rejected from the high-pressure refrigerant water inside the condenser into the cooling
water flowing through the condenser. The high-pressure liquid water then passes through
a throttling valve to reduce its pressure. Then, the low-pressure liquid water enters the
evaporator and evaporates from the liquid phase to the vapor phase; heat is absorbed from
the chilled water into the refrigerant vapor in the vaporization process. Vapor is
continuously removed out from the evaporator by the strong lithium bromide in the
absorber. The lithium bromide solution is used as the absorbent and water is used as the
refrigerant.
Figure 1-1: Illustration of a single-effect Li-Br absorption chiller.

3
Absorption cooling has attracted a lot of attention as an alternative to conventional
vapor compression cooling. Among the components, the absorber is the most important
element of the absorption cooling cycle, and its characteristics have significant effects on
the entire system’s performance. A typical absorber of a conventional Lithium Bromide
absorption system includes a bundle of horizontal tubes and drippers. The solution is
introduced on the tubes as droplets from the drippers and flows as liquid film on the tubes.
This style of falling-film absorber is used in most absorption machines because it has
several advantages, such as high heat transfer coefficient, relatively low pressure drop, and
a sufficient absorption process compared to other tube arrangements. The absorption
phenomena depend on many parameters such as solution flow rate, tube parameters, and
surface condition, which governs flow around and between the tubes. Some simplified
smooth laminar falling-film models have been done by several researchers (e.g. Islam,
2007, Bredow et. al., 2008).
Even the absorption chiller uses waste heat as the energy resource, the general
adoption is still constrained by the low COP. The main barrier of the performance is the
heat and mass transfer in the absorber. Scientists and researchers have been working on
this issue for decades. Adding additive and using different kinds of tubes have been proven
effective in enhancing the system performance and applied in industrial. However, to
couple with the heat transfer in other elements of absorption system, the performance of
absorber still has a lot of space to improve. Thus our research focuses on a new method to
improve the absorption chiller system: the mechanism motion. The mechanism motion was
barely used in industrial to enhance the heat and mass transfer. Only very few research was

4
conducted in this area; however the output seems very prospective. The mechanism motion
may increase the heat and mass transfer in an absorber from the following aspects.
1.2 Increase additive performance
Although the additive effect is still in debate, the most accepted theory is that the
additive could reduce the surface tension and arouse Marangoni vortex (Frances and Ojer,
2004). Mechanism motion could further break the surface tension, thus make the falling
film distribute on the tubes more evenly. Adding mechanism motion may also increase
Marangoni vortex intensity and correspondingly increase absorber performance. But, there
is barely any literature discussing how mechanism affects the absorption chiller. Different
additives have different characteristics, and different kinds of mechanism motion may also
affect the additive performance in different degrees. A real experiment is very necessary
for understanding absorption additive performance under a vibration situation.
1.3 Using inertia force to help form droplet
Inertia force will be accompanied with mechanism motion. Obviously, the vibration
makes equipment move up and down. The moving direction of equipment changes during
the vibration. Inertia force appears when the direction changes. When the tubes begin to
move from downward to upward, there is still a downward inertia force on the falling film.
This inertia force compels the solution move down to next tube.
1.4 Thin out and surface fluctuation
In previous studies, which will be introduced in the literature review in this thesis,
researchers conducted various experiments to demonstrate that vibration could reduce the
surface tension and film equilibrium (Aoune and Ramshaw 1999; Cheng et al. 2009;

5
Ellenberger and Krishna 2002; Liu t al.2004). They found films with less thickness were
formed and the surface of film introduced some fluctuation during vibration. These two
phenomena play positive role in absorption process. A thinner film reduces the heat transfer
resistance through the film and a fluctuating surface increases mass transfer across the film
liquid-vapor interface. If the LiBr solution remains on the falling film too long after
saturation, the system would have no future performance improvement during the
absorption and saturation period. With a given flow rate, a thinner film means the droplets
fall sooner from the top to the end of the absorber. Making the falling-film droplet fall
sooner after it is saturated is one of the investigations in attempt to increase the chiller
performance in our experiment. Enhancing heat transfer would benefit the mass transfer
correspondingly. In summary, it is expected that “thinning out” the falling film could
enhance the heat and mass transfer from several aspects.
6
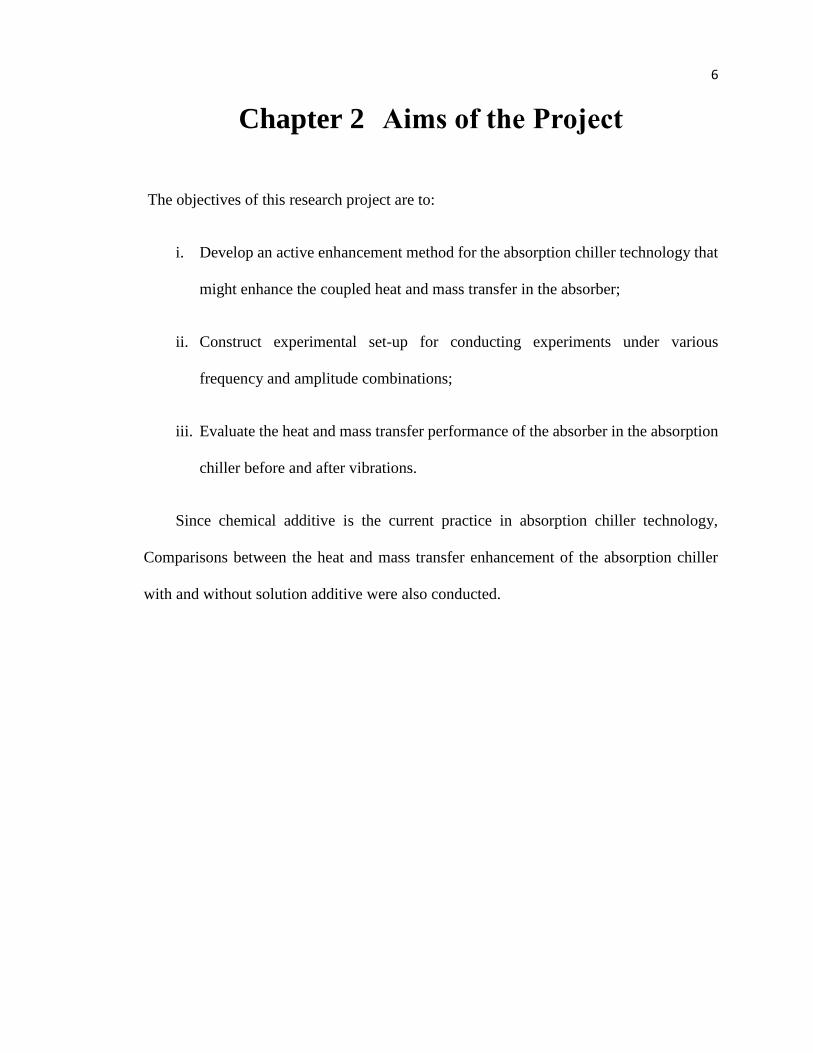
Chapter 2 Aims of the Project
The objectives of this research project are to:
i. Develop an active enhancement method for the absorption chiller technology that
might enhance the coupled heat and mass transfer in the absorber;
ii. Construct experimental set-up for conducting experiments under various
frequency and amplitude combinations;
iii. Evaluate the heat and mass transfer performance of the absorber in the absorption
chiller before and after vibrations.
Since chemical additive is the current practice in absorption chiller technology,
Comparisons between the heat and mass transfer enhancement of the absorption chiller
with and without solution additive were also conducted.

7
Chapter 3 Literature review
To gain a better understanding of this issue, we conducted plenty of literature review,
including almost all previous research on mechanism motion enhancing sorption liquid,
heat and mass transfer enhancement method and the influence from different kinds of
additives.
The refrigeration effect is obtained via a heat-driven cycle in which an absorbent
auxiliary fluid enables the main refrigerant to complete its refrigeration cycle through
absorption process in the absorber. Two absorption systems based on the lithium bromide-
water and ammonia-water are among the highly used working fluids in absorption
refrigerating systems and consequently, have been the subject of research from different
aspects. The absorption phenomenon, technical performance, falling film modeling and
sizing (Kim et al. 1995; Yigit 1999; Jeong and Garimella 2002; Nosoko et al. 2002; Babadi
and Farhanieh 2005; Seol and Lee 2005; Kyung et al. 2007; Sultana et al. 2007; Bredow et
al. 2008; Islam 2008; Lee et al. 2012; Papaefthimiou et al. 2012), as well as the heat and
mass transfer enhancement and surface tension reduction (Hoffmann et al. 1996; Kim et al.
1999; Yuan and Herold 2001; Kulankara and Herold 2002; Park et al. 2004; Soto Frances
and Pinanzo Ojer 2004; Jun et al. 2010) of absorption refrigeration systems with various
designs and sizes have been experimentally and theoretically investigated in the literature.
Among these works on absorption refrigeration systems, not all of the aspects received
adequate attention. One of the areas that has received limited research efforts is the effect
8
of vibration mechanism on heat and mass transfer on falling film absorbers used in the real
absorption machines.
In recent years, there has been a continuous attempt to improve the relatively poor
COP of absorption refrigeration systems by cycle design modification. Generator absorber
heat exchanger (GAX) cycles were proposed to reuse the absorber heat to assist generate
more refrigerant vapor (Garimella et al. 1996; Rameshkumar et al. 2009; Barrera et al.
2012). In these systems, the absorber heat is supplied to the low-temperature part of the
generator and therefore, reduces the external heat source energy consumption. Multi-effect
cycles, such as double-effect, triple effect and so on, have been designed to recover the
rejected heat of the condenser through additional generators or another cycle (Arun et al.
2000; Tierney 2007; Garousi Farshi et al. 2013). Recently, in order to improve the
entrainment ratio of the ejector and enhancing cooling effect inside the evaporator, a flash
tank was added between the condenser and evaporator to a solar combined ejector–
absorption refrigeration system(Sirwan et al. 2013).
It is true that the COP of an absorption system increases significantly through multi-
effect cycles (Gomri 2010), but, there could be serious obstacles in their practical
applications, especially in triple-effect machines. Firstly, the solution and additives
stabilities could be compromised in considerably high solution temperatures, which also
accelerate the corrosion process in chillers (ASHRAE 2010). Secondly, excessive pressure
in the first effect generator requires expensive pressure devices (ASHRAE 2010). Thirdly,
the overall cost, weight and size of the machine increases significantly due to replication
of several components of the same type in the whole unit. Above all, since the total

9
performance of the system is obtained from both the cycle design and components’
performance, therefore, moving toward higher COPs is hinged with the improvement of
the two factors, cycle modification and individual components performances,
simultaneously. In this work, special attention is paid to the absorber, as the most important
component of the system, to identify potential enhancement of heat and mass transfer
coefficients, with or without additives, via vibration mechanism, and consequently to
increase the efficiency of the whole system without the need for major cycle modification.
3.1 Heat and mass transfer enhancement via active mechanisms
There are many different types of active methods all of which aim to accelerate heat
and mass transfer through the motion mechanism. Transfer coefficients were significantly
improved in a heat pump in the study by Aoune and Ramshaw (1999) over thin fluid films
via rotating disks. Mechanically induced vibration, as another active technique, also was
studied in several researches including the study of flow induced vibration effect on heat
exchangers by Cheng et al. (2009), and the experimentation of interfacial mixing effect of
vibration in absorbers by Tsuda and Perez-Blanco (2001). As another active mechanism,
ultrasound vibration enhancement method was investigated by Kiani et al. (2012).
Regardless of the type of the oscillating motion, almost in all cases, in presence of vibration,
heat and/or mass transfer were improved. More examples of active techniques could be
found in the study by Bergles and Manglik (2013). This section is focused on heat and
mass transfer enhancement through mechanical excitation or vibration.

10
3.1.1 Flow-induced vibration
The kinetic energy of a working fluid within a component can generate vibration on
its whole body or a specific segment. A unique design of heat exchanger was proposed by
Cheng et al. (2009) to transform a part of the energy of the fluid flow into useful vibration
on heat exchanger tubes. This vibration aims to firstly, improve the heat transfer coefficient,
and secondly, decrease the fouling resistance in the tubes. The newly designed heat
transfer apparatus consists of elastic tube bundles (A, B, C, and D) of looped curved beams,
which a couple of them are positioned horizontally in layers above one another in the heat
exchanger chamber. Two solid joints (E, F) connect these semicircular beams together to
create a closed loop of the fluid inside the bundle (as shown in Fig. 3-1)
Figure 3-1: In-plane nonlinear heat transfer device. Source:(Cheng et al. 2009)
Dynamic sub structure method was utilized to analyze the vibration of the tube bundle
after which the first six natural frequencies of the system were obtained. Three of these
modal shapes were out-plane and the rest were in-plane vibrations. In the experimental
study, the convective heat transfer coefficient 𝛼 was measured with the Newton’s law of
cooling:
11
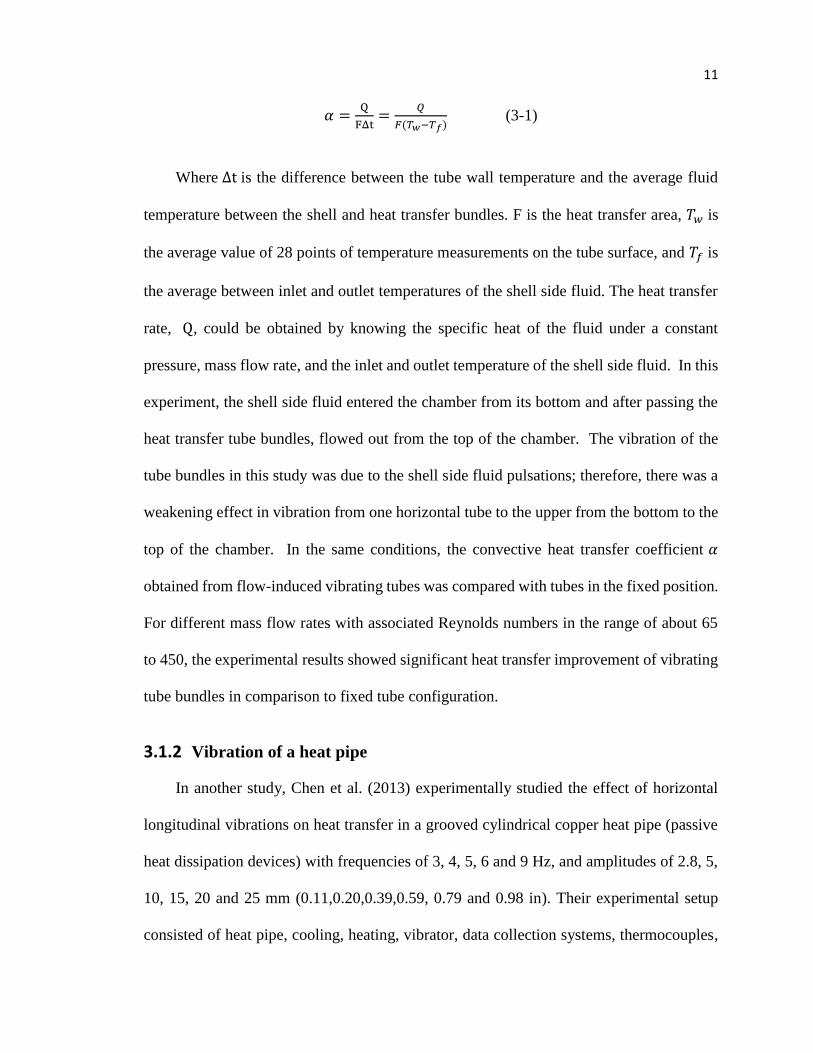
𝛼 =Q
FΔt=
𝑄
𝐹(𝑇𝑤−𝑇𝑓) (3-1)
Where Δt is the difference between the tube wall temperature and the average fluid
temperature between the shell and heat transfer bundles. F is the heat transfer area, 𝑇𝑤 is
the average value of 28 points of temperature measurements on the tube surface, and 𝑇𝑓 is
the average between inlet and outlet temperatures of the shell side fluid. The heat transfer
rate, Q, could be obtained by knowing the specific heat of the fluid under a constant
pressure, mass flow rate, and the inlet and outlet temperature of the shell side fluid. In this
experiment, the shell side fluid entered the chamber from its bottom and after passing the
heat transfer tube bundles, flowed out from the top of the chamber. The vibration of the
tube bundles in this study was due to the shell side fluid pulsations; therefore, there was a
weakening effect in vibration from one horizontal tube to the upper from the bottom to the
top of the chamber. In the same conditions, the convective heat transfer coefficient 𝛼
obtained from flow-induced vibrating tubes was compared with tubes in the fixed position.
For different mass flow rates with associated Reynolds numbers in the range of about 65
to 450, the experimental results showed significant heat transfer improvement of vibrating
tube bundles in comparison to fixed tube configuration.
3.1.2 Vibration of a heat pipe
In another study, Chen et al. (2013) experimentally studied the effect of horizontal
longitudinal vibrations on heat transfer in a grooved cylindrical copper heat pipe (passive
heat dissipation devices) with frequencies of 3, 4, 5, 6 and 9 Hz, and amplitudes of 2.8, 5,
10, 15, 20 and 25 mm (0.11,0.20,0.39,0.59, 0.79 and 0.98 in). Their experimental setup
consisted of heat pipe, cooling, heating, vibrator, data collection systems, thermocouples,
12
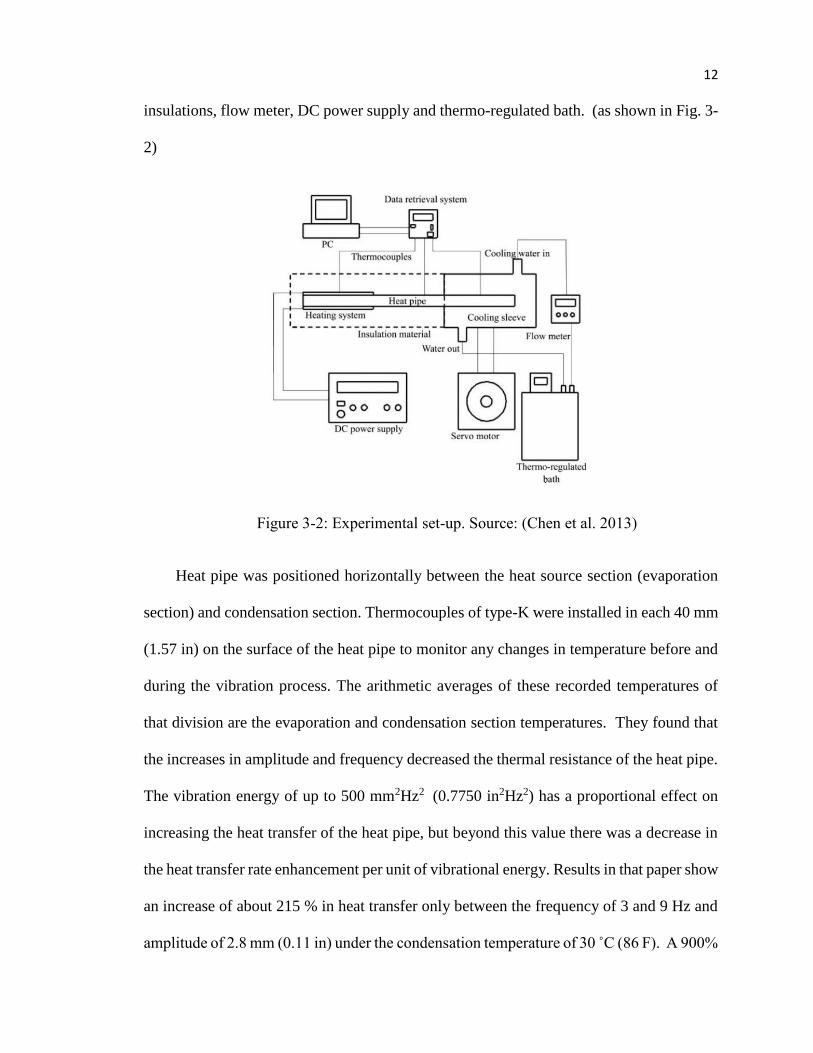
insulations, flow meter, DC power supply and thermo-regulated bath. (as shown in Fig. 3-
2)
Figure 3-2: Experimental set-up. Source: (Chen et al. 2013)
Heat pipe was positioned horizontally between the heat source section (evaporation
section) and condensation section. Thermocouples of type-K were installed in each 40 mm
(1.57 in) on the surface of the heat pipe to monitor any changes in temperature before and
during the vibration process. The arithmetic averages of these recorded temperatures of
that division are the evaporation and condensation section temperatures. They found that
the increases in amplitude and frequency decreased the thermal resistance of the heat pipe.
The vibration energy of up to 500 mm2Hz2 (0.7750 in2Hz2) has a proportional effect on
increasing the heat transfer of the heat pipe, but beyond this value there was a decrease in
the heat transfer rate enhancement per unit of vibrational energy. Results in that paper show
an increase of about 215 % in heat transfer only between the frequency of 3 and 9 Hz and
amplitude of 2.8 mm (0.11 in) under the condensation temperature of 30 ̊ C (86 F). A 900%

13
increase in the maximum heat transfer rate enhancement was recorded between the
amplitude of 2.5 mm (0.10 in) and 25 mm (0.98 in), and frequency of 3 Hz under the
condensation temperature of 30˚C (86 ˚F).
3.1.3 Vibration of a wire and a coated metal
Lemlich (1955) experimentally studied the effect of vibration on heat transfer
coefficient between the air as the fluid (film over the wire), and three wires of different
diameters. In this experiment, wires were concurrently subject to vibration in the range of
39 to 122 Hz, and electrical current for heating purposes. Natural convection between the
air and heated and vibrated wire was measured through the measurement of the temperature,
with a calibrated thermocouple, in the middle of the wire. Within the specific range of
amplitude in this work, heat transfer coefficient improved as the frequency and amplitude
increasing. It also showed that the heat transfer enhancement is more significant when the
temperature difference between the wire and air is small. Its reason, as explained in that
paper, is that higher natural convection causes a higher level of disturbance. In this context,
the increased disturbance due to the increase in vibration excitation accounts for a lower
proportion in whole existing disturbance around the fluid films. The researcher also
proposed, but not proved, that the vibrating wire allows the air to create a stretched film
over the entire path of the motion, and therefore, air does not follow the wires back and
forth movement.
Lemlich and Levy (1961) investigated the effect of vibration on mass transfer
coefficient through the vibration of a coated metal of Aluminum or steel covered with
naphthalene or d-camphor. The sublimation of this substance into the room air through

14
mass transfer was the main mechanism of the experiment. The vibrating metals were
suspended within a cradle from a main wire in the room area. Main wire itself was in
contact with an oscillator to receive the vibration necessary to the test runs. After each run
of the test, the specimens were reweighted and the diameters were re-measured. The mass
transfer coefficient increased due to this vibration of up to 660%. Influence of the
amplitude increase was more than that of frequency.
3.1.4 Vapor-liquid interfacial vibration
Another active mechanism to enhance mass transfer is the direct application of
vibration on surface area of the falling film of solution. In a study by Tsuda and Perez-
Blanco (2001), an active enhancement technique to improve the overall absorbing
performance of the LiBr-water solution-based absorber with a special focus on enhancing,
through vibration, of the interfacial mixing between the refrigerant and the solution in the
absorber was devised and tested. As illustrated in Fig. 3-3, the proposed absorber consists
of a vertical plate over which the working fluid flows; this fluid has a complete contact
with the plate from both side; a screen which is meshed with thin vibrating wires is
positioned with a distance almost equal to the film fluid thickness.

15
Figure 3-3: Schematic of the vibrating plate mechanism. Source:(Tsuda and Perez-
Blanco 2001)
The whole apparatus seems to be capable of simulating the condition exists in an
absorber. The effect of vibrating screen on mass transfer rate was obtained through
comparison with the case of absorption rates under no vibrating screen. While pressure was
kept constant at 5.99 mmHg (0.24 inHg), different mass transport rates were resulted from
any different combination of Reynolds number, frequency and amplitude. With amplitude
of vibration of 0.2 mm (0.008 in), mass transfer has its highest rate around frequency of 40
Hz in low Reynolds numbers in the range of 20 and 60, and around 60 Hz in high Reynolds
numbers between 80 and 300. At configuration with Reynolds number of 80, frequency
of 60 and amplitude of 1 mm (0.04 in), a peak value of 14.7 Kg/h-m2 (348.84 lbs/h-ft2)
was recorded for the refrigerant mass flux into the solution plate. This shows around 150
percent improvement in respect to mass flux rate of 5.9 Kg/h-m2 (140.01 lbs/h-ft2) at
Reynolds number of 80 without vibration. A limitation of this method would be the
physical presence of the screen wires as an obstruction; screens with more vibrating wires,
16
to intensify the mixing effect, would obstruct the contact between the gas and fluid and
deteriorates the absorption rate, on the other hand, screens with a lot of free area could not
mix the solution interface effectively.
3.1.5 Vibration of LiBr-H2O falling film absorber
As a rare example, the effect of vibration on transfer coefficients in an absorber
apparatus with horizontal tubes and LiBr-water solution as working fluid was
experimentally tested by Kostin and Gorshkov (1990). According to the literature review
conducted by Kostin and Gorshkov on similar processes, vibration could improve the heat
and mass transfer coefficients. The hermetically sealed experimental set-up of the absorber
consisted of a single row of horizontal tubes arranged one above the other, through which
cooling water flowed to remove the heat of absorption. LiBr-water solution was sprayed
down on tube bank and flowed down into two wells at the bottom of the tube tank. Heaters
in the wells separated the water from solution through evaporation process, and caused the
remains of strong solution. This solution then passed through a heat exchanger which
removed the excessively generated heat due to heaters in wells. The heaters’ power in the
wells was varied to control the steam flow rate over the tube bank in this experiment. To
complete the circulation process, the solution coming out of the heat exchanger, then, was
pumped to the sprayers. The absorber apparatus was subjected to vibration after which a
set of parameters were measured:

17
Variation of the main parameters in the course of experiment
Absorption
Pressure pa
(psi)
Strong solution
concentration %
Spray mass
flow rate
kg/hr/m
(lb/hr/ft)
Strong solution
temperature ˚C
(˚F)
Cooling water
˚C (˚F)
666.61 to
2666.44 (0.097
to 0.387
54-60 500-960
(335.984-
645.090)
30-50 (86-122) 5-36 (41-96.8)
Table 3-1: Parameters for the LiBr-water heat and mass transfer experiment
As a result, the effect of mechanical vibration was found beneficial on improving the
absorption process. In the test an average enhancement of 15% was reported for heat
transfer in the absorber apparatus.
3.1.6 Vibration of an absorption chiller
Liu Y. L. (2004) used vibration test to emulate a working absorption chiller on a boat
in motion. A vibration generator was applied to mimic the sea wave effect on the absorber.
The test-rig included the signal generator, vibrator, absorber, generator, data collector, and
so on. The experiments were conducted for both static and vibrating conditions. With other
variables in the system remained the same, the flow rate of the weak solution, vibration
frequency, and inclination angle were modulated to investigate the impact of vibration on
heat and mass transfer enhancement of the absorber. The results are reproduced in Fig. 3-
4.

18
Figure 3-4: Heat and mass transfer comparison (reproduced from Liu Y. L. 2004)
The upper two figures show the heat and mass transfer coefficient under vibration
status and normal static status. They demonstrated that vibration remarkably enhanced the
heat and mass transfer. The enhancement of mass transfer is notably high, almost 100%
higher than static status. Heat transfer enhancement, which is not as high as mass transfer,
also has a 20% increase. The bottom two figures reflect the relationship between heat/mass
transfer and the frequency/inclination angle. With the same inclination angle, increase of
frequency below 0.4 leads to the increase of both the heat transfer and mass transfer. The
reasons are that the increase of vibration frequency, on the one hand, amplifies the radial
and tangential speed of the liquid on the absorber tubes and therefore enhances the heat
Heat transfer coefficient and solution sprinkling
rate Mass transfer coefficient and solution sprinkling
rate
Heat transfer coefficient and vibration frequency
under different inclination angles Mass transfer coefficient and vibration
frequency under different inclination angles

19
convection, and on the other hand, speeds up the fluctuation of the tube surface and the
replacement of the saturated vapor/liquid close to the tube surface. However, the heat and
mass transfer is better when the inclination angle is relatively lower. From the plots, we
could see that the 2-degree slope has a better performance than the 4-degree one. The
authors concluded that there was a critical value for both vibration frequency and amplitude
(inclination angle in this case). The absorption will enhance at the beginning of vibration,
but when vibration reaches the critical value, the absorption process will be weakened.
Another point that should be considered in this paper is, the frequency is very low in this
experiment because the waves on the sea are not controllable and the vibration is subject
to the boat stability.
3.1.7 Ultrasound vibration
Ultrasound vibration, as another active mechanism to intensify the transfer
coefficients in different devices, has also been tested experimentally. Melendez (2010)
attempted to develop an air scrubbing system, a countercurrent single stage scrubber,
capable of influencing the gas-liquid mass transfer with Nano chemistry, and then to
investigate the enhancement potential of ultrasound vibration on mass transfer
phenomenon in the designed apparatus. To test this potential, Melendez, conducted a
number of experiments with and without the application of ultrasound action on the
designed apparatus. This device consists of a cylindrical container in the middle of which
some horizontal perforated sieve plates were installed. The air and water then were blown
and pumped into the scrubber to start the process of the absorption of oxygen into water.
In this cylindrical container, the gas entered from the bottom of the apparatus and was in
contact with flowing water over sieve plates. The remaining gas, after absorption, exited
20
from the top. The enhancement was measured by comparing the amount of oxygen
absorbed in the scrubber in the cases of with and without ultrasound vibration. Although
a literature review conducted by Melendez showed that ultrasound might enhance the
liquid phase mass transfer coefficient, experimental results completed by Melendez failed
to present any significant improvement of the mass transfer under the application of
ultrasound vibration.
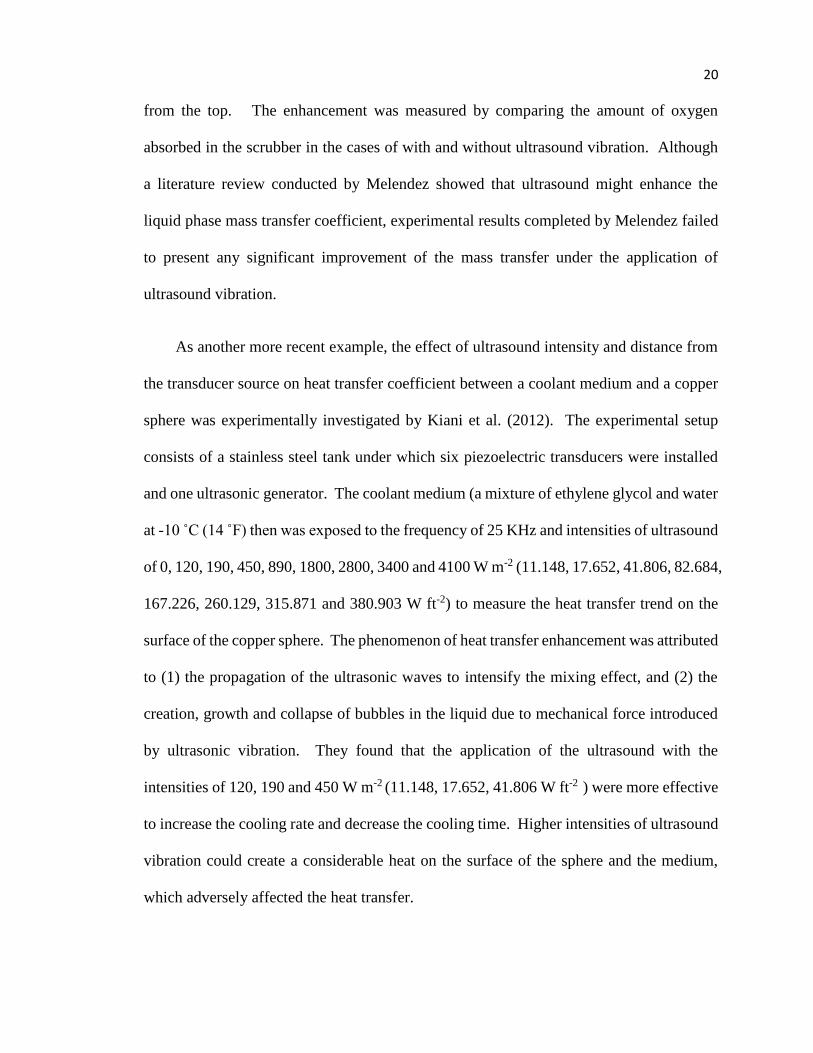
As another more recent example, the effect of ultrasound intensity and distance from
the transducer source on heat transfer coefficient between a coolant medium and a copper
sphere was experimentally investigated by Kiani et al. (2012). The experimental setup
consists of a stainless steel tank under which six piezoelectric transducers were installed
and one ultrasonic generator. The coolant medium (a mixture of ethylene glycol and water
at -10 ̊ C (14 ̊ F) then was exposed to the frequency of 25 KHz and intensities of ultrasound
of 0, 120, 190, 450, 890, 1800, 2800, 3400 and 4100 W m-2 (11.148, 17.652, 41.806, 82.684,
167.226, 260.129, 315.871 and 380.903 W ft-2) to measure the heat transfer trend on the
surface of the copper sphere. The phenomenon of heat transfer enhancement was attributed
to (1) the propagation of the ultrasonic waves to intensify the mixing effect, and (2) the
creation, growth and collapse of bubbles in the liquid due to mechanical force introduced
by ultrasonic vibration. They found that the application of the ultrasound with the
intensities of 120, 190 and 450 W m-2 (11.148, 17.652, 41.806 W ft-2 ) were more effective
to increase the cooling rate and decrease the cooling time. Higher intensities of ultrasound
vibration could create a considerable heat on the surface of the sphere and the medium,
which adversely affected the heat transfer.

21
So
ur
ce
s Method Interactive
media
HTE MTE Apparatus Amplitude Frq
Ch
eng
et a
l. (
20
09
)
Flow-
induced
vibration
Water-heated
tubes
Around 250 %
enhancement in
Heat transfer
coefficient
N/A Newly
designed heat
exchanger
with rows of
in-plane
curved tube
bundles
N/A 8.75
Hz
for
the
first
mod
e of
vibr
atio
n
Ch
en e
t a
l.(2
013
)
Vibration of
a heat pipe
Distilled water
and copper heat
pipe surface
Up to 900 %
enhancement in
maximum heat
transfer rate
N/A Integrated
Heat pipe
device
2.8, 5, 15, 20,
25 mm
(0.1102,
0.1968,
0.3937,
0.5905,
0.7874 and
0.9842 in)
3, 4,
5, 6,
9 Hz
Lem
lich
(19
55
)
Vibration of
wires in
contact to air
Air-Heated
wires
Up to 400 %
enhancement in
heat transfer
coefficient
N/A Horizontal
heated
Nichrome
wire under
sinusoidal
vibration
created by a
buzzer
0.055-0231
inch (1.397-
0.58674 mm)
39-
122
Hz
Lem
lich
an
d
Lev
y (
196
1) Vibration of
coated
cylindrical
metals
Naphthalene or
d-camphor -
room air
N/A Up to
660%
Assembly of
wire,
oscillator,
amplifier and
cradle
Double
amplitude:
0.46 to 7.66
mm
(0.01811024 -
0.3015748 in)
20-
118
Hz
Tsu
da
, P
erez
-
Bla
nco
(2
00
1) Solution-gas
interfacial
mixing due
to the
vibration of
a screen of
wires
Coolant water
tubes-Lithium
Bromide water
solution-water
vapor
N/A Up to 150
percent
depending
on
different
situation
Plate absorber
equipped with
a vibrating
screen
0.2-1 mm 20-
100
Hz
Ko
stin
an
d
Go
rsh
ko
v
(19
90
)
Vibration of
the absorber
apparatus
LiBr-water
solution and
water vapor
15 % N/A falling-film
absorber
apparatus with
horizontal
tube bank
2A = 3 mm
(0.11811 in)
14
Hz
Liu
an
d X
u,
(20
04
)
Vibration
(swing)
20% 90% Absorber
Chiller
equipped with
a Vibration
Generator
2-4 degree 0.2-
0.6
Hz

22
Mel
end
ez
(20
10)
Ultrasound
vibration
Oxygen and
water
N/A Non Single-stage,
Sieve plate
scrubber for
lab purposes
N/A 20
KHz
Kia
ni,
Su
n
an
d Z
ha
ng
20
12
Ultrasound
vibration
Ethylene glycol
and water
mixture
Between 2 and
400 %
N/A Suspended
copper sphere
in fluid tank in
vicinity of a
transducer
N/A 25
KHz
Table 3-2: Summary-heat and mass transfer enhancement via vibration
Note: HTE- heat transfer effect, MTE- mass transfer effect, Frq- frequency.
Table 3-2 compared the reported heat and mass transfer enhancements due to the
active mechanism of vibration in the discussed literature including the amplitude and
frequency of the vibration. Collected research works in this table presented completely
different approaches for testing the effects of vibrations on transfer coefficients. Their
testing apparatus, sources of vibration, types of vibration, frequencies and amplitudes,
temperatures, measurement devices, and mediums varied from one experiment to the other.
From Table 3-2, the vibration type could be roughly divided in two groups of low frequency
(0-150 Hz), and ultrasonic vibration (above 20 kHz). For frequencies in the range of the
0-150 Hz, the amplitude is between 0.2 to 25 mm (0.008 to 0.984 in). For both categories
of vibration, considerable heat transfer improvements were reported with the maximum
heat transfer improvement of 900% obtained from the effect of vibration on a heat pump.
For other studies, which operation mechanism bears more resemblance to absorbers,
improvement of around 300% was reported. Unlike the heat transfer, there are fewer
studies on the effect of vibration on mass transfer coefficient. However, from these research
works, a good number of them showed considerable mass transfer improvements in the
presence of an oscillatory source.

23
3.2 Passive techniques in absorbers for heat and mass transfer
enhancement
Passive techniques are more developed, proved useful and widely used to enhance
heat and mass transfer in absorbers. Their application in falling film absorbers with
horizontal tubes could be divided into two main categories as (1) tube surface transmutation
and (2) solution additives. From these, increasing the wettability of tubes, reducing surface
tension and increasing the mixing effect in the solution are main sought-after outputs. The
positive enhancement effect of passive techniques including the surface treatments and
roughness, inserted enhancement devices, swirl-flow devices and geometrical
modifications have been tested on variety of different components and devices(Bergles and
Manglik 2013). Not surprisingly, the effect of the surface treatment and roughness on
transfer coefficients of falling film absorbers also could be found in literature (Hoffmann
et al. 1996; Park et al. 2004). In this section the effect of solution additives on the falling
film absorbers with horizontal tubes will be reviewed. Additives are widely used in
commercial absorption chillers and are relatively easier and less expensive to apply than
other passive methods.
While additives increase the mixing effects in the working solution through
Marangoni effect, they increase the wettability through surface tension reduction. The
surface tension of LiBr-H2O and distilled water was tested with four different additives
and two different solution concentrations by (Kulankara and Herold 2002). The drop
weight method was used to measure the surface tension through weighing the drops falling
from a small diameter nuzzle of a stainless steel tube attached to a liquid container.

24
Figure 3-5: Surface tension measurement apparatus. Source: (Kulankara and Herold
2002)
The formula from Harkins (1952) was used to obtain the surface tension:
𝑊 = 2𝜋𝑟𝜎𝑓(𝑟
𝑉𝑑
13
) (3-2)
Where σ is the unknown surface tension, W is the weight of the drop falling on the
apparatus collection tray, r is the tip’s radius, and Vd represents the volume of the drop.
The remaining water at the tip when a drop falls was taken into account by the Harkins
Brown correction factor of f-function. Based on the measurements, they found considerable
surface tension reduction due to the additives in the solution.
A more germane understanding of the enhancing effect of additives to absorber
performance is obtained through direct measurements of heat and mass transfer rates. Kim
et al. (1999) experimentally studied the effect of eight pairs of solution and additive
mixtures of 50, 60, 68 and 70% and n-octanol, 2-octanol, 3-octanol, and 2-ethyl-1-hexanol
respectively on mass transfer in a newly designed simple stagnant pool absorber. From
these eight combinations, four of them consisted of the same solution of Lithium Bromide
and water vapor with different additives and the rest, have the same additive of 2-ethyl-1-

25
hexanol and different solution (as shown in Table 3-2). The procedure consisted of
weighing carefully the solution, with desired amount of additives, before and after the
experiment, to find the absorbed water vapor in each 3-minute absorption period in the
solution. During the experiments, a considerable surface turbulence was observed from
the transparent façade of the apparatus during absorption process with the use of additives.
As a result, considerable mass transfer enhancement was recorded with the use of additives.
In another example, the 2EH and 1-octanol additives effect on the heat transfer
enhancements in a LiBr falling film solution absorber was experimentally tested on two
types of plain and treated horizontal tubes by Hoffmann et al. (1996). The experimental
setup consists of horizontally arranged tubes with the solution dripping over from the top.
Then the gathered solution was pumped from the bottom of the pool and recirculated to
complete the process. They obtained a total U value for the absorber from the formula of:
�̇�𝑡𝑜𝑡𝑎𝑙 = 𝑈𝑡𝑜𝑡𝑎𝑙𝐴𝛥𝑇𝑙𝑜𝑔𝑚𝑒𝑎𝑛 (3-3)
𝛥𝑇𝑙𝑜𝑔𝑚𝑒𝑎𝑛 is the mean logarithmic temperature difference between the equilibrium
temperature of the solution and the cooling water temperature. 𝑈𝑡𝑜𝑡𝑎𝑙 is the total heat
transfer coefficient of the absorber which consists of the effects of solution and cold water
heat transfer coefficients, 𝛼𝑠𝑜𝑙 and 𝛼𝑐𝑤 :
1
𝑈𝑡𝑜𝑡𝑎𝑙≈
1
𝛼𝑐𝑤+
1
𝛼𝑠𝑜𝑙 (3-4)
Total heat flux �̇�𝑡𝑜𝑡𝑎𝑙 is calculated from:
�̇�𝑡𝑜𝑡𝑎𝑙 = �̇�𝑐𝑤𝑐𝑐𝑤(𝑇𝑐𝑤,𝑜𝑢𝑡 − 𝑇𝑐𝑤,𝑖𝑛 ) (3-5)
26
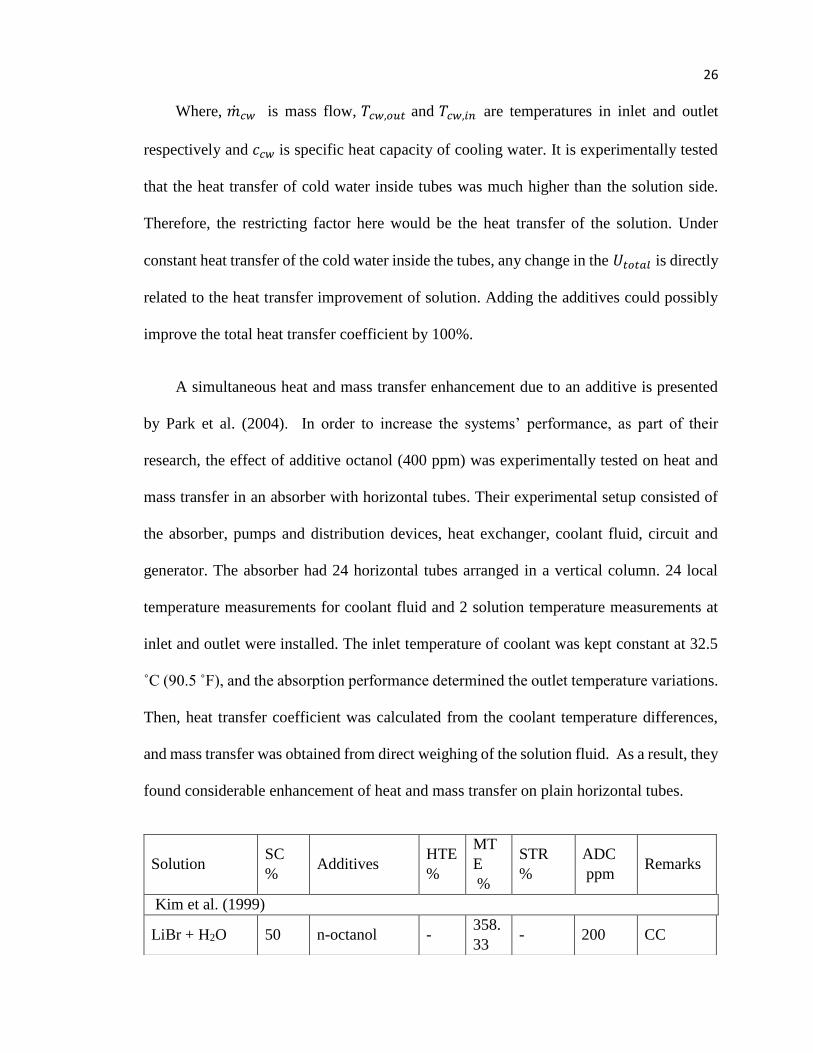
Where, �̇�𝑐𝑤 is mass flow, 𝑇𝑐𝑤,𝑜𝑢𝑡 and 𝑇𝑐𝑤,𝑖𝑛 are temperatures in inlet and outlet
respectively and 𝑐𝑐𝑤 is specific heat capacity of cooling water. It is experimentally tested
that the heat transfer of cold water inside tubes was much higher than the solution side.
Therefore, the restricting factor here would be the heat transfer of the solution. Under
constant heat transfer of the cold water inside the tubes, any change in the 𝑈𝑡𝑜𝑡𝑎𝑙 is directly
related to the heat transfer improvement of solution. Adding the additives could possibly
improve the total heat transfer coefficient by 100%.
A simultaneous heat and mass transfer enhancement due to an additive is presented
by Park et al. (2004). In order to increase the systems’ performance, as part of their
research, the effect of additive octanol (400 ppm) was experimentally tested on heat and
mass transfer in an absorber with horizontal tubes. Their experimental setup consisted of
the absorber, pumps and distribution devices, heat exchanger, coolant fluid, circuit and
generator. The absorber had 24 horizontal tubes arranged in a vertical column. 24 local
temperature measurements for coolant fluid and 2 solution temperature measurements at
inlet and outlet were installed. The inlet temperature of coolant was kept constant at 32.5
˚C (90.5 ˚F), and the absorption performance determined the outlet temperature variations.
Then, heat transfer coefficient was calculated from the coolant temperature differences,
and mass transfer was obtained from direct weighing of the solution fluid. As a result, they
found considerable enhancement of heat and mass transfer on plain horizontal tubes.
Solution SC
% Additives
HTE
%
MT
E
%
STR
%
ADC
ppm Remarks
Kim et al. (1999)
LiBr + H2O 50 n-octanol - 358.
33 - 200 CC

27
LiBr + H2O 50 2-octanol - 316.
67 - 200 CC
LiBr + H2O 50 3-octanol - 308.
33 - 400 CC
LiBr + H2O 50 2-ethyl-1-
hegxanol -
333.
33 - 200 CC
LiBr + H2O 60 2-ethyl-1-
hegxanol -
156.
41 - 200 CC
LiBr + H2O
+HO(CH2)2OH
(LiBr/
HO(CH2)2OH
= 4.5 by mass)
68 2-ethyl-1-
hegxanol -
200.
00 - 190 CC
LiBr + H2O +
LiI (LiBr/LiI =
4 by mole)
60 2-ethyl-1-
hegxanol -
202.
78 - 200 CC
LiBr + H2O +
ZnCl2
(LiBr/ZnCl2= 1
by mass)
70 2-ethyl-1-
hegxanol -
181.
25 - 300 CC
Kulankara and Herold (2002)
LiBr + H2O 53
2-ethyl-1-
hegxanol(2EH
)
- - 56.53 106 CC
LiBr + H2O 53
2-methyl-1-
hexanol
(MHX)
- - 60.63 135 CC
LiBr + H2O 53
3,5,5-
trimethyl-1-
hexanol
(TMHX)
- - 57.83 58 CC
LiBr + H2O 53
3-phenyl-1-
propanol
(PHPP)
- - 54.21 >1500 CC
LiBr + H2O 60
2-ethyl-1-
hegxanol(2EH
)
- - 55.93 55 CC
LiBr + H2O 60
2-methyl-1-
hexanol
(MHX)
- - 60.63 58 CC
LiBr + H2O 60 3,5,5-
trimethyl-1-- - 56.22 15 CC

28
Table 3-3. Summary heat and mass transfer via additives
Note: HTE- heat transfer effect, MTE- mass transfer effect, STR- surface tension
reduction, SC- solution concentration, ADC- additive concentration, CC-critical
concentration
Table 3-3 collects the most relevant efforts on improving the transfer coefficients of
falling-film absorbers through the usage of solution additives. LiBr-water solution with
two additives of 2EH and Octanol is dominant working fluid. Research works in this table
are more comparable than the information in Table 3-2, since most of them are experiments
on falling film absorbers with horizontal tubes. Still, the operation parameters (e.g. the
temperature, pressure and solution flow rate during the test), the purity of additives,
geometry, size and material of the absorber are the factors that might cause the results
variations which were not investigated in this review.
hexanol
(TMHX)
LiBr + H2O 60
3-phenyl-1-
propanol
(PHPP)
- - 55.22 >500 CC
Hoffman et al. (1996)
LiBr + H2O 56 2-ethyl-1-
hegxanol 100 - - 40
CC
HTE is
average
enhancem
ent in
𝛼𝑠𝑜𝑙
Park et al (2004)
LiBr + H2O 61 Octanol 406.
56 376 - 400
HTE is
enhancem
ent in
Nusselt
Number
𝑁𝑢

29
3.3 Compound techniques in falling film absorbers
The exercise of two or more heat and mass transfer enhancing techniques in a machine
is known as a compound method. Studying transfer coefficients enhancement in falling
film absorbers is further complicated with the application of compound methods, especially
when many of the enhancing techniques have not yet been tested individually. Nevertheless,
a few existing compound techniques presented in the literature, may not explicitly named
as compound method, could provide a ground toward the development and eventually,
implementation of these techniques in real machines.
A unique attempt to study the heat transfer coefficient improvement due to the tube
surface roughness together with solution additives is presented by Hoffmann et al. (1996).
Although their apparatus is a falling film horizontal tube heat exchanger, its geometry
composition is similar to commercial absorbers. With additive concentration of 80 ppm of
2-ethyl-1-hexanol in the solution of LiBr-water, depending on mass flow rate, on knurled
surface tubes, they reached 55 to 85% of improvement in heat transfer coefficient.
Park et al. (2004) later presented another work of the same type by combining the
effects of surface roughness and additives. Tube surfaces were roughened with micro-scale
hatches of 0.39 – 6.97 µm (15.354 to 274.410µin), and normal Octanol with a concentration
of 400 ppm was used as the solution additive. Results showed significant improvement of
the absorption performance of 4.5 times for the roughened tubes in presence of the solution
additives than that for the plain tubes without the usage of additives.

30
3.4 Discussion
Application of active, passive or compound methods in a falling film absorber with
horizontal tubes and LiBr-water as working solution, leads to different levels of
improvement, or possibly deteriorations, of these two transfer coefficients. The similar heat
and mass transfer enhancements found in the literature due to the vibration could be
executed in falling film absorbers. Vibration of tubes potentially enhances heat and mass
transfer. It disturbs the solution bulk and solution-vapor interface which improves the
mixing effect, diffusivity and eventually mass transfer rate in solution bulk. This theory
could be better supported by considering the relatively high viscosity of LiBr-H2O
solutions. This viscosity is the reason for the entire film of solution disturbance by the
vibration movement.
Vibration movement path could be divided in three general forms of up-down, right-
left, or circulatory paths, regardless of which, from one hand, the film solution on the tubes
tends to keep its initial moving path due to its inertia force, and from the other, is dragged
by the tube movement path due to the friction force of the tube surface. However, its real
movement behavior falls somewhere in between. Namely, there would be constant
scrubbing between tube wall and solution bulk, and in the meanwhile, the solution bulk
undergoes a disturbance due to the vibration movement. This mechanism increases the
heat transfer coefficient between the tube wall and solution bulk, and concurrently
encourages the mixing effect. Naturally, this contention, though is true to the best of the
knowledge of authors, needs to be proved via theoretical and experimental tests.

31
3.5 Concluding Remarks
Investigating the development of active enhancement mechanisms for heat and mass
transport processes in absorption devices is an essential step prior to onset of
experimentation and modeling to provide design tools for any of these techniques. In this
thesis, a literature review was carried out with the aim to firstly identify the potential of
heat and mass transfer enhancement in absorbers and secondly, to consider the
simultaneous application of an active mechanism with a widely used passive technique.
The enhancement potentials of each individual technique of vibration and solution
additives were described and summarized. After each technique reviewed, experimental
conditions and results were gathered in tables to provide a qualitative and quantitative
comparison. Based on the reviewed literature, it was hypothesized that a great
enhancement potential in heat and mass transfer of the falling-film absorbers with
horizontal arrangement of tubes is obtainable by combining vibration effect, as an active
mechanism, with solution additives such as 2EH and Octanol. Although a considerable
heat and mass transfer enhancement due to vibration could be expected within the schema
of a promising prospect, the current studies did not provide a comprehensive and consistent
conclusion on the approach, mechanism and performance that support a generalization in
falling film absorbers, more research is needed to understand the interchangeable effect in
terms of the nature and the magnitude of the simultaneous use of this active method with
passive techniques in falling film absorbers with horizontal arrangement of tubes.

32
Chapter 4 Lab Construction
This part focuses on the lab introduction and the operation sequence. The objective of
the project is to investigate the impacts on absorption chillers with mechanism
enhancement. In this part, we illustrate the apparatus which could be used to develop a
model of heat and mass transfer in absorber. And we also state the challenges which are,
the fulfillment of mechanism motion to driving extra heat and mass transfer in absorber,
and the measurement of the variables and the stable & repeatability. To explain how we
overcome the challenges, we demonstrate the detail of the equipment for absorption chiller,
vibrator and auxiliary water loop system and how they work in the experiment. This part
provides information of mechanism experiment setup and test methodology for the
researchers in the same area who may conduct related work.
The structure of a Li-Br absorption chiller is illustrated in Fig. 1-1. Among the four
main components (i.e. a generator, a condenser, an evaporator, and an absorber), the
absorber is a key component that significantly impacts the overall performance of chiller.
By continuously removing the boiled vapor out of the evaporator, the absorber creates a
required low-pressure in the close loop and ensures the continuous stability of the system.
Its structure and performance determine the overall size, capacity and efficiency of a chiller.
Absorber performance also affects the unit cost and operating economics. Therefore,
improving the performance in terms of heat and mass transfer efficiency in an absorber is
an important issue facing the academia.
33
4.1 Experimental challenges
It is expected that, with the designed test-rig and experiments, we could provide solid
data with a big range of vibration amplitude and frequency and operation parameters to
identify the relationships between the heat and mass transfer and vibration amplitude,
vibration frequency and other influencing factors. The comprehensive data collected from
the test-rig could be used to develop modeling tools to quantify the vibration effect on
absorption chillers. This analysis will fill the blank of heat and mass transfer of horizontal-
tube falling film sorption system.
There are challenges for the constructing the test-rig:
i. Mechanism motion and its fulfillment: mechanism motion includes basically
vibration and rotation and it can be locally on the absorber or expanded to the
whole chiller. Meanwhile, implementation of such a mechanism needs to
consider the cost and feasibility. Potential negative impact to the chiller which
needs to maintain a vacuum environment should be avoided.
ii. Measurements of the variables: the absorber is one component of the close loop
system. To determine the mass and heat transfer, measurements on temperature,
flow rate, pressure, and concentration of the strong and weak solution are
needed. In addition to the measurement quantity is the quality. Accuracy of the
sensors should satisfy the component level and system level heat and mass
transfer error analysis.
iii. Stable and repetitive environment: as a close loop system, any change on the
four thermal components of the chiller could impact the system operation. To
serve Objective-ii, a controllable steady-state condition needs to be maintained

34
with and without mechanism motion during the operation. A set of artificial
thermal source and sink should be constructed and controlled for this purpose.
In the following section, we describe the solutions corresponding to the afore mentioned
three challenges.
4.2 Technical analysis and mechanism motion method
As we analyzed before, mechanism motion may reduce the solution film thickness
and then reduce heat and mass transfer resistance. At the same time, it may increase the
droplet dropping rate by reducing surface tension. On the other hand, mechanism motion
may also promote the additive effect and consequently enhance the absorption performance.
Since most absorption chillers use horizontal tubes, thinning-out the film should let the
motion happen in a vertical direction rather than a horizontal direction. Because a motion
in the horizontal direction only makes the film pendulate on the tubes, but does not
essentially change the film thickness.
To introduce vibration into our system, we also have many options. One is to vibrate
just the tubes in the absorber. However, this kind of design will cause an issue on the
vacuum, which is very critical to the normal operation of absorption chillers. A small
pressure loss in the absorber will result in big reduction on the cooling performance (Xie
et al., 2008). The second design option is using solution to pulse the horizontal tube bundle
for vibration. However, it is very hard to control the vibration amplitude and frequency.
Considering the complexity involved in absorption chillers, such as dimension, long-time
performance, different container arrangement, tubes connection and etc., the best scheme
at present is using commercial equipment for conducting the mechanism experiments and

35
introducing vibration to the entire chiller. Another reason of vibrating the whole chiller is
that most commercial products combine the absorber and evaporator, as well as the
condenser and generator, into two containers, separately. Having a specially designed
absorption system and vibrating only the absorber not only increases the cost, but also
prevents the generalization of the findings to commercial products. Meanwhile, separating
the absorber from the evaporator into two apart containers increases the pressure drop
between them, which is not desired in an absorption system.
4.3 Absorption chiller
Based on the analysis, in this project we choose RXZ (95/85)-1.2ZS type hot water
lithium bromide absorption chiller from a brand manufacturer. This chiller contains four
main elements: generator, condenser, evaporator and absorber. It also includes air extract
instrument, molten silicon tube, solution shield pump and other accessory parts. The
detailed parameters are collected in Table 4-1.
Cooling capacity kW 12
Btu/hr 40946
Coolant water
inlet outlet T 15 to 10oC 59 to 50oF
flow rate 2 m3/h 8.8GPM
pressure drop 2.5mH2O 3.56psi
tube diameter 25mm 0.984inch
Cooling water
inlet outlet T 32 to 38oC 90 to 100oF
flow rate 4.2m3/h 18.5GPM
pressure drop 1mH2O 1.42psi
tube diameter 25 mm 0.984 inch
Hot water/heat
source
inlet outlet T drop 95 to 85oC 203 to 185oF
flow rate 1550 m3/h 6824 GPM
pressure drop 2 mH2O 2.84 psi
tube diameter 25 mm 0.984 inch
Electric
instrument
Power 3phase - 380V - 50Hz
Current 7.7 A
36
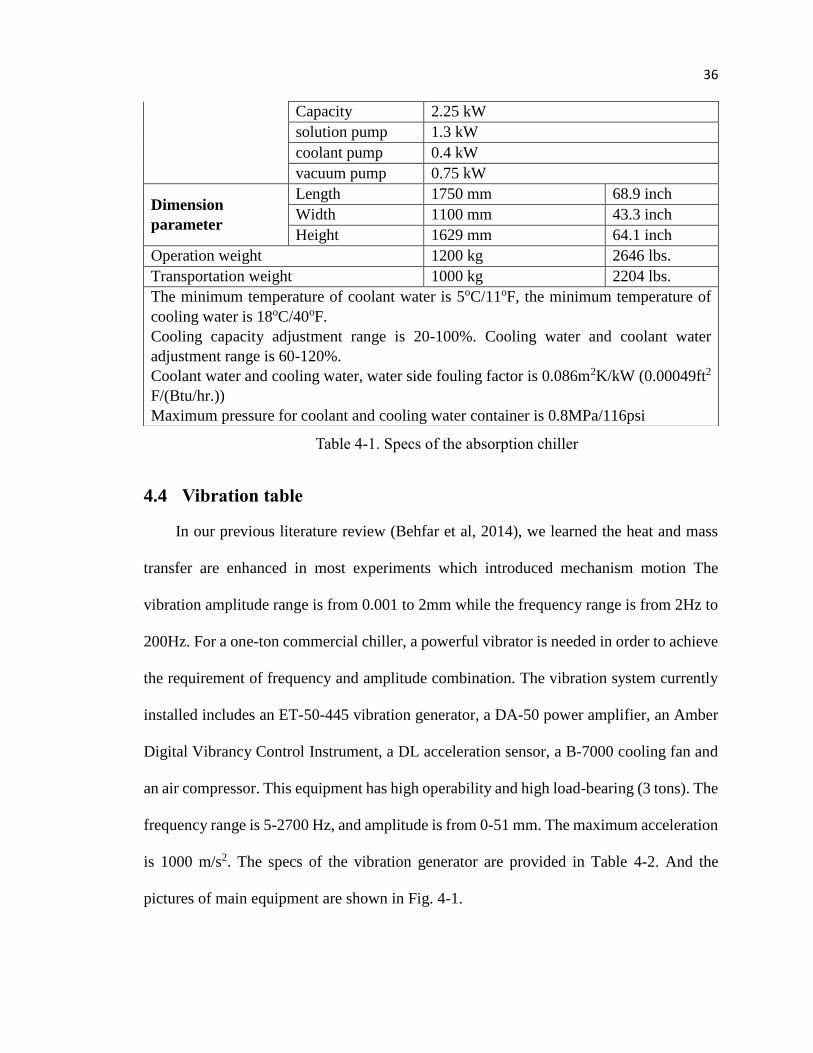
Table 4-1. Specs of the absorption chiller
4.4 Vibration table
In our previous literature review (Behfar et al, 2014), we learned the heat and mass
transfer are enhanced in most experiments which introduced mechanism motion The
vibration amplitude range is from 0.001 to 2mm while the frequency range is from 2Hz to
200Hz. For a one-ton commercial chiller, a powerful vibrator is needed in order to achieve
the requirement of frequency and amplitude combination. The vibration system currently
installed includes an ET-50-445 vibration generator, a DA-50 power amplifier, an Amber
Digital Vibrancy Control Instrument, a DL acceleration sensor, a B-7000 cooling fan and
an air compressor. This equipment has high operability and high load-bearing (3 tons). The
frequency range is 5-2700 Hz, and amplitude is from 0-51 mm. The maximum acceleration
is 1000 m/s2. The specs of the vibration generator are provided in Table 4-2. And the
pictures of main equipment are shown in Fig. 4-1.
Capacity 2.25 kW
solution pump 1.3 kW
coolant pump 0.4 kW
vacuum pump 0.75 kW
Dimension
parameter
Length 1750 mm 68.9 inch
Width 1100 mm 43.3 inch
Height 1629 mm 64.1 inch
Operation weight 1200 kg 2646 lbs.
Transportation weight 1000 kg 2204 lbs.
The minimum temperature of coolant water is 5oC/11oF, the minimum temperature of
cooling water is 18oC/40oF.
Cooling capacity adjustment range is 20-100%. Cooling water and coolant water
adjustment range is 60-120%.
Coolant water and cooling water, water side fouling factor is 0.086m2K/kW (0.00049ft2
F/(Btu/hr.))
Maximum pressure for coolant and cooling water container is 0.8MPa/116psi
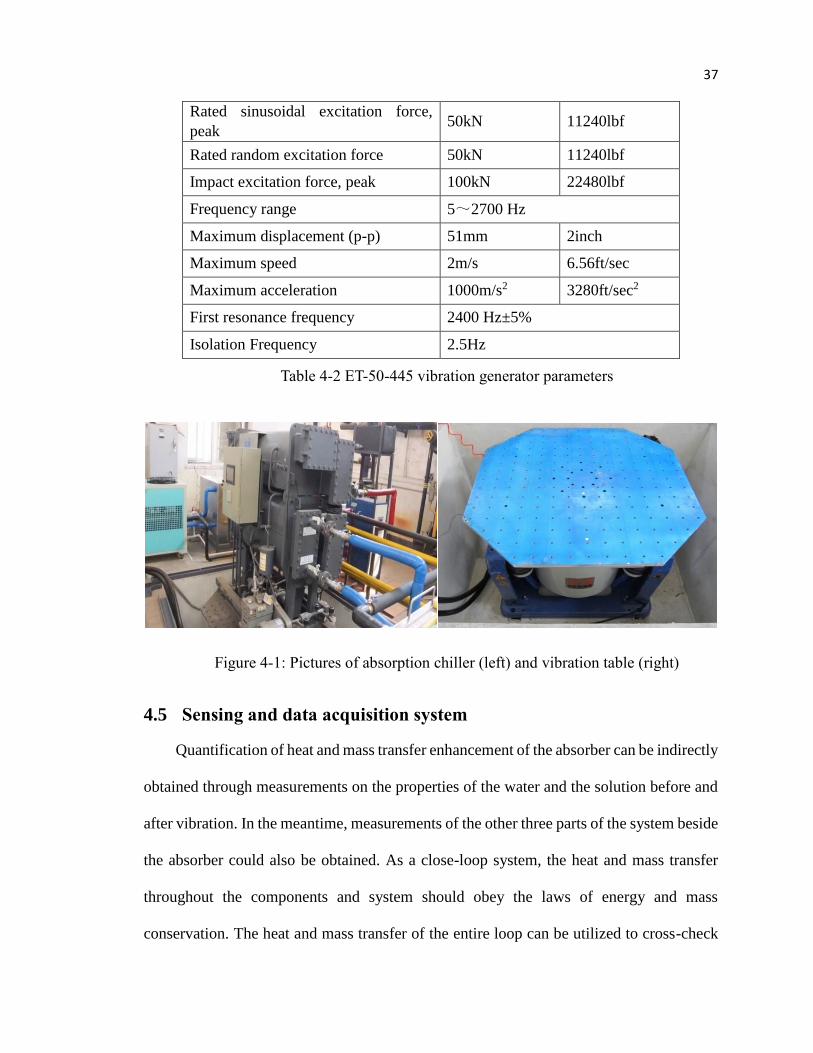
37
Rated sinusoidal excitation force,
peak 50kN 11240lbf
Rated random excitation force 50kN 11240lbf
Impact excitation force, peak 100kN 22480lbf
Frequency range 5~2700 Hz
Maximum displacement (p-p) 51mm 2inch
Maximum speed 2m/s 6.56ft/sec
Maximum acceleration 1000m/s2 3280ft/sec2
First resonance frequency 2400 Hz±5%
Isolation Frequency 2.5Hz
Table 4-2 ET-50-445 vibration generator parameters
Figure 4-1: Pictures of absorption chiller (left) and vibration table (right)
4.5 Sensing and data acquisition system
Quantification of heat and mass transfer enhancement of the absorber can be indirectly
obtained through measurements on the properties of the water and the solution before and
after vibration. In the meantime, measurements of the other three parts of the system beside
the absorber could also be obtained. As a close-loop system, the heat and mass transfer
throughout the components and system should obey the laws of energy and mass
conservation. The heat and mass transfer of the entire loop can be utilized to cross-check
38
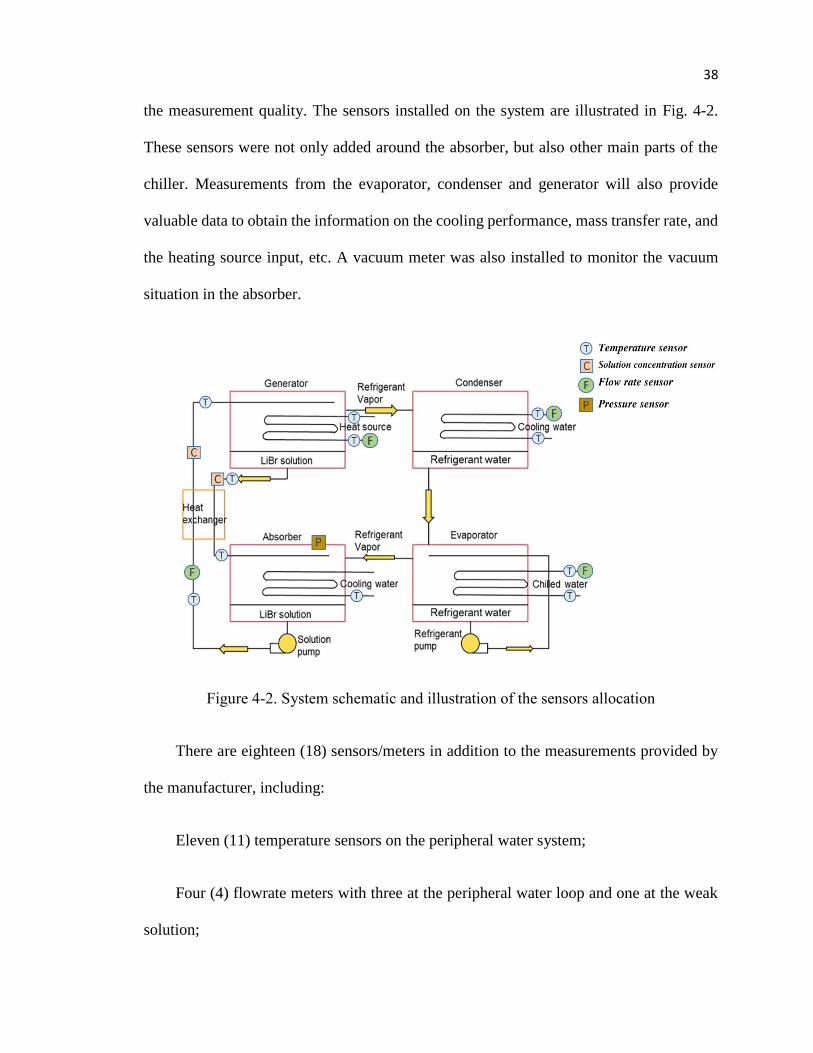
the measurement quality. The sensors installed on the system are illustrated in Fig. 4-2.
These sensors were not only added around the absorber, but also other main parts of the
chiller. Measurements from the evaporator, condenser and generator will also provide
valuable data to obtain the information on the cooling performance, mass transfer rate, and
the heating source input, etc. A vacuum meter was also installed to monitor the vacuum
situation in the absorber.
Figure 4-2. System schematic and illustration of the sensors allocation
There are eighteen (18) sensors/meters in addition to the measurements provided by
the manufacturer, including:
Eleven (11) temperature sensors on the peripheral water system;
Four (4) flowrate meters with three at the peripheral water loop and one at the weak
solution;

39
Two (2) inline concentration sensors at the strong and weak solution, and
One (1) pressure sensor at the absorber.
There is only one flowrate meter in the solution loop on the weak solution side since
the flowrate meter that we used in this project is a turbine flow meter, which incurs
significant pressure drop to the system. Thus, it is not recommended to be installed on the
strong solution side. However, it was not considered as a concern since the solution loop
is a closed loop. In steady-state operation, the mass balance should be observed in the
solution loop. Since we monitored the solution concentrations on both strong and weak
solution sides (as well as the density) and the volumetric flowrate of the weak solution, we
could calculate the flowrate of the strong solution entering the absorber. The temperature
data from the measuring sensors was continuously collected with a data acquisition system
(model: MX-100). Details of these sensors are summarized in Table 4-3.
Labels Note Remarks / specifications
Temperature
T1 Cold water at the outlet
Platinum thermal sensor, DT-
W100 Armored thermal
resistors
Range: -50oC to +280oC (±0.1
accuracy)/-58oF to 536oF
(±0.18 accuracy)
T2 Cold water at the inlet
T3 Condenser cooling water
outlet
T4 Hot water outlet
T5 Absorber cooling water outlet
T6 Cooling water inlet
T7 Absorber strong solution inlet
T8 Absorber weak solution outlet
T9 Generator weak solution inlet
T10 Generator strong solution
outlet
T11 Hot water inlet
Flow rate
Q1 Hot water flowrate Liquid turbine flow meter
Range: 0-5 m3/h/0-22 GPM
(0.5% accuracy) Q2 Chilled water flowrate

40
Q3 Cooling water flowrate
Liquid turbine flow meter
Range: 0-9 m3/h/0-39.62
GPM (0.5% accuracy)
Q4 Weak solution flowrate
Liquid turbine flow meter
Range: 0-20 m3/h/0-88 GPM
(0.5% accuracy)
Concentration
X1 Weak solution Temperature range: 20-120 oC/68-248 oF (±0.2%
accuracy) X2 Strong solution
Pressure P1 Pressure in absorber Range: 0-10kPa/0-1.45psi
(±2% accuracy)
Table 4-3: Sensor types and the specifications
4.6 In-line concentration measurement
In order to calculate the heat and mass transfer value of the chiller under vibration
conditions, in-line concentration measurement sensors were necessary in this project. The
in-line measurement for the solution concentration is a new approach in lithium bromide
system that we adopted in this project, because it can measure the concentration real-time
and allow us to calculate the transient heat and mass transfer analysis.
In-line concentration measurement was rarely used in absorption systems in the
literature. Traditionally, with manual measurement, solution needs to be extracted from the
system with the assistance of a vacuum pump under the absence of vibration. Considering
a negative pressure in the absorption system, it is not a simple matter to leave an opening
for abstracting solution sample continuously. Besides, it is labor intensive for sampling
solutions. Particularly in this project, the experiments were carried out under vibration,
solution sampling was even harder. To overcome these limitations, we used SensoTech®
in-line ultrasonic concentration sensor to record the concentration of weak and strong
solutions. The operation temperature range is -10-40oC/14-104oF and the accuracy is

41
±0.2%. The data record frequency for solution concentration measurement is one (1)
minute. Based on the knowledge of the research team, this was the first time that an in-line
sensor was applied in lithium bromide concentration measurement.
In this experimental system, the ultrasonic concentration detector consists of a
controller and two sensors. The sensor is made of stainless steel, comprising an ultrasonic
transmitting and receiving device, a built-in high-accuracy temperature measurement
sensor, and a communication signal preprocessor. One of the sensors was mounted at the
inlet of the absorber to measure the strong solution, and the other was mounted at the outlet
of the absorber to measure the weak solution as shown in Fig. 4-3.
Figure 4-3. Photos of the in-line ultrasonic concentration sensor.
Top left, sensor installed on weak solution loop. Top right, sensor installed on strong solution
loop. Bottom left, control panel and monitor. Bottom right, electric circuit of data acquisition
unit.

42
We used two different ways to calibrate the sensors and ensure the accuracy of these
in-line concentration sensors. One method is using Shanghai Baiyang® lithium bromide
solution concentration measuring instruments - glass hydrometers, which can be placed
directly into the glass hydrometers to measure its concentration in solution as shown in Fig.
4-4 (left). It is simple and convenient. Another method is using a densitometer and a
thermometer to measure the density and temperature of the solution, then using software
to calculate concentration values by the density and temperature data. The density is
measured by Mettler-Toledo® DA-110M density meter, as shown in Fig. 4-4 (right). This
densitometer range is 0-2 g/cm3 (0-125lb/ft3) and the accuracy is 0.01g/cm3(0.624lb/ft3).
Figure 4-4. Photos of solution concentration (left) hydrometers and (right) liquid density
meter
4.7 Thermostatic water loop systems
In order to have a repeatable and fair comparison, except the vibration conditions, all
other parameters of the cycle should be maintained as constant as possible. Meanwhile, a
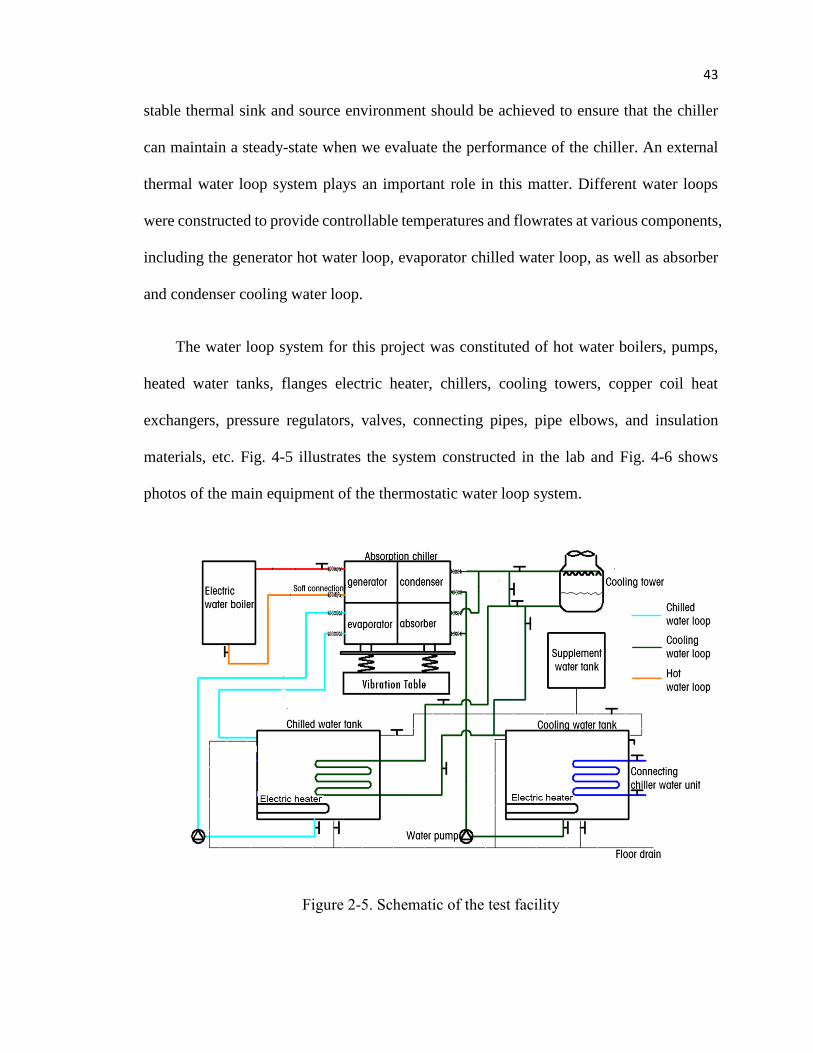
43
stable thermal sink and source environment should be achieved to ensure that the chiller
can maintain a steady-state when we evaluate the performance of the chiller. An external
thermal water loop system plays an important role in this matter. Different water loops
were constructed to provide controllable temperatures and flowrates at various components,
including the generator hot water loop, evaporator chilled water loop, as well as absorber
and condenser cooling water loop.
The water loop system for this project was constituted of hot water boilers, pumps,
heated water tanks, flanges electric heater, chillers, cooling towers, copper coil heat
exchangers, pressure regulators, valves, connecting pipes, pipe elbows, and insulation
materials, etc. Fig. 4-5 illustrates the system constructed in the lab and Fig. 4-6 shows
photos of the main equipment of the thermostatic water loop system.
Figure 2-5. Schematic of the test facility

44
4.7.1 Chiller water unit
The function of the chilled water unit is to chill the water in the cooling tank and to
maintain a constant 28-30oC/82-86oF cooling water inlet temperature, continually. For this
system, we selected chilled water system with a model of AOY-12500AS. The cooling
capacity is 12.5 kW /42,651 Btu/hr. and output water temperature is 7~15oC/44.6-59oF.
The chiller has high & low pressure protection, an anti-freeze protection, a voltage/current
protection and other safety features.
4.7.2 Water tanks
To create an artificial load and provide constant cooling water to the system, two
chilled water tanks of 1m3/35ft3 were utilized. The stainless steel chilled water tank and
cooling water tank are produced by Tianjin Dingtuo Technology LTD, which are equipped
with a drain valve, electric heaters and water level control devices.
4.7.3 Electric boiler
A hot water boiler (with model of CLDR0.024-90/70) was installed to supply hot
water to the generator. The power output is 24kW /81,891 Btu/hr., output water
temperature is 95oC/203oF, backwater temperature is 85oC/185oF, and the maximum water
flow rate is 2 m3/hr. (8.8GPM).
4.7.4 Water pumps
The thermostatic water systems are driven by water pumps, selected as light horizontal
multistage centrifugal pumps, which are manufactured by Southern Pump Company.

45
Figure 4-6. Photos of main instrument in water loop system
Top left, chilled water unit; Top right, water tank; Bottom left, electric boiler; Bottom right,
cooling tower.
4.8 Equipment installation
We set our lab on the first floor of our laboratory building. Tap water and 220V/ 380V
with 50 amperes maximum wire capacity are provided. An 8m3 (275ft3) cubic foundation
was built in the room for the installation of the vibration table in order to reduce the impacts
on surrounding objects. After the vibration table was settled, the chiller was fixed on the
vibration table. We used 30 pieces of 10 mm/0.4 inch screws to ensure the security of the
vibration experiment. After that, we put all the platinum thermal sensors on the machine
by drilling holes on the tubes with thermal conduction oil to ensure enough thermal transfer.

46
All the flow meters were connected with flange connection. Soft connection was used
between the chiller and the thermostatic water loop system to greatly isolate the vibration.
Similarly, the vacuum pump and chiller control panel were located outside of the
absorption chiller to avoid resonance from vibration.

47
Chapter 5 Methodology and Data Analysis
The goal of this project is to study the heat and mass transfer difference of the
absorption chiller with and without vibration. Thus, the heat and mass transfer calculation
is very important to us. As we showed in the previous tables, we record all the temperatures,
solution flow rates and solution concentrations in the system. The procedure of how to get
heat and mass transfer in absorber is shown in the following sections.
5.1 Mass transfer analysis
In the experiment, the weak and strong concentration values were collected with the
in-line concentration sensors, and the weak solution flowrate collected by the solution flow
meter. We did not know the strong solution flow rate directly. However, based on the mass
conservation of pure lithium-bromide (Li-Br) in the absorber in a steady-state, we could
calculate the strong solution flowrate by using equation:
strongstrongstrongweakweakweak XVXV **** (1)
Where,
weakX, weak solution concentration;
strongX, strong solution concentration;
weakV, weak solution flow rate;
strongV, strong solution flow rate;

48
weak, weak solution density, and
strong, strong solution density.
The density of lithium-bromide is defined by:
3
0
3
0
n
n
n
n XBTXA (2)
n 0 1 2 3
An 1016.028 884.165 -419.036 1696.176
Bn -4.903 27.309 -55.465 36.273
X and T are the solution concentration and temperature of solution, respectively. This
equation is used when the concentration of lithium-bromide is between 40%-66%, which
is the case in our experiment.
Combing Eq. 1 and 2, we get,
strongstrong
weakweakweak
strongX
XVV
*
** (3)
Since, in the steady-state, the mass of lithium-bromide remains constant in the
absorber, the mass flow rate difference between the weak solution and the strong solution
gives us the mass transfer rate from the water vapor into the solution, as:
strongstrongweakweakabwater VVm **, (4)
The mass transfer calculation process is illustrated in Fig.5-1. The variables in gray
are directly measured from the sensors or calculated with empirical equations. The link

49
between the primary variables, derivative variables and the final results are illustrated with
curves in different colors.
Figure 5-1. Calculation process for mass transfer
5.2 Heat transfer analysis
Heat transfer in the absorber observes the energy conservation law and can be
calculated by using the following equation,
soloutabsweakweakevpwaterabwatersolinabsstrongstrongabs hVhmhVQ ,,,,,, ****
(5)
Where,
solinabsh ,,, enthalpy of inlet strong solution;

50
soloutabsh ,,, enthalpy of outlet weak solution;
(the enthalpy equation of the solution can be found in Lansing F. L, 1976)
evpwaterh ,, water vapor condensing heat during sorption process, which is a function of
the mixture pressure or temperature when the vapor is considered saturated. The values can
be directly obtained from the common thermal dynamic tables. Fig. 5-2 illustrates the
calculation process for the heat transfer in the absorber.
Figure 5-2. Calculation process for heat transfer

51
Chapter 6 Experiment plan introduction
There are several influence factors in the chiller when vibration is introduced to a
lithium bromide absorber. The factors include vibration frequency, vibration amplitude,
solution flow rate and additive.
Frequency is one of the most important elements of vibration. The frequency
influences molecular activity, and high frequency may destroy the film layer boundary to
let mass transfer happen easier. However high frequency also induces resonance and more
energy cost. On the other hand, most of the parts in absorption chiller are metals, and some
of them are very thin. The resonance frequency range of thin metal is close to our
experiment. Thus, the selection of frequency range is very critical.
Amplitude is another important element during vibration. In falling film absorption
chiller, vibration amplitude may provide inertia force to accelerate the liquid film falling
and increase the contact area between film and vapor. It will also accelerate molecular
activity. In the following parts, we will introduce the influence from different amplitude.
Solution flow rate is also an important element in our experiment, because different
solution flow rate will induce different film thickness. Thickness is the most important
physical property of falling film absorption cycle. So we conduct vibration experiment
under different solution flow rates.
Additive is widely used in absorption chiller system. It provides about 15%-20% extra
performance to the system. There are two kinds of additives frequently used, 2EH and n-

52
octanol. So we conduct vibration experiment under three conditions, with 2EH, with n-
octanol and without additive.
We separated the experiment into different sub-categories to test the impacts by each
factor while the related parameters were maintained in a range and conditions as shown in
Table 6-1.
Cooling water inlet temperature 28-30oC (82.4-86oF)
Hot water inlet temperature 90-95oC (194-203oF)
Chilled water inlet temperature 10-15oC (50-59oF)
Chilled water outlet temperature 7.5-13oC (45.5-55.4oF)
Evaporating temperature 6-11.5oC (42.8-52.7oF)
Strong solution concentration range 60%-63%
Weak solution concentration range 58%-60.5%
2EH additive concentration 500 ppm
Table 6-1: Operating conditions of the absorption chiller in this research project

53
Chapter 7 Experiment result and analysis
7.1 Short-term tests
At the first phase of this project, we conducted a lot of preliminary tests with short-
term vibration experiments from Fall 2013 to Spring 2014. The short-term vibration tests
explored the most suitable range of vibration frequency and amplitude that do not result in
resonance. During this period, we also fine-tuned the water-loop control strategies and did
troubleshooting of errors that we found in the sensor acquisition system during those tests.
Sensor uncertainty analyses were also conducted during the process.
Although most absorption chillers in the market use the 2EH additive, the chiller used
in this project was shipped with the n-octanol additive. Thus, we conducted these
preliminary tests with the n-octanol additive. Most of the results were obtained with
vibration in 20-30 minutes, thus the chiller may not have reached steady state yet. At that
time, the in-line concentration sensors were not installed to the chiller, thus we could only
calculate the cooling performance from the chilled water temperature difference and the
chilled water flowrate.
These experimental frequencies were from 5Hz to 100Hz, the amplitudes were from
0.05 to 1mm (0.002 to 0.039inch), and the solution flow rates were from 0.1 to 0.5m3/h
(0.44-2.2GPM). With n-octanol additive, under frequency under 10 Hz, the enhancement
was not quite noticeable. For frequencies from 15 Hz to 30 Hz, we found more consistent
and noticeable enhancement at the cooling capacity (up to 20%). For a higher frequency at
55 Hz to 80 Hz, the data were less consistent and the enhancements were at a smaller range.

54
Besides, vibration at higher frequency will require much more energy and will have higher
risk of equipment damage. Therefore, we did not include these frequency ranges in the
long-term tests. Regarding the amplitude, we found 0.15-0.25mm (0.0059-0.0098inch) has
the most positive enhancement. For different solution flowrates, 0.2-0.3m3/h (0.88-
1.32GPM) always presented more significant enhancement when comparing to other
solution flowrates.
Experiment Condition Experiment Result
Frequency Amplitude
mm
Solution Flow
Rate
m3/h
Positive
Effect
%
No noticeable
effect
Negative
Effect
5Hz 0.5
0.2
√
0.8 √
8Hz 0.8 6%
10Hz
0.15 0.3 6%
0.25 0.3 √
0.4 0.2 √
0.5 0.2 √
0.8 0.2 √
12Hz 0.8 0.2 12.5%
14Hz 0.8 0.2 10%
15Hz 0.25 0.3 5%
0.4 0.2 23%
25Hz
0.1 0.3 5.5%
0.15 0.2 8%
0.2 0.3 11%
0.25 0.3 9%
0.3 0.3 5.5%
0.35 0.3 6%
0.4 0.3 5.4%
50Hz 0.15 0.2 √
0.2 0.2 √
55Hz 0.15 0.3 √
60Hz
0.1 0.2 11%
0.13 0.2 5%
0.15 0.3 √
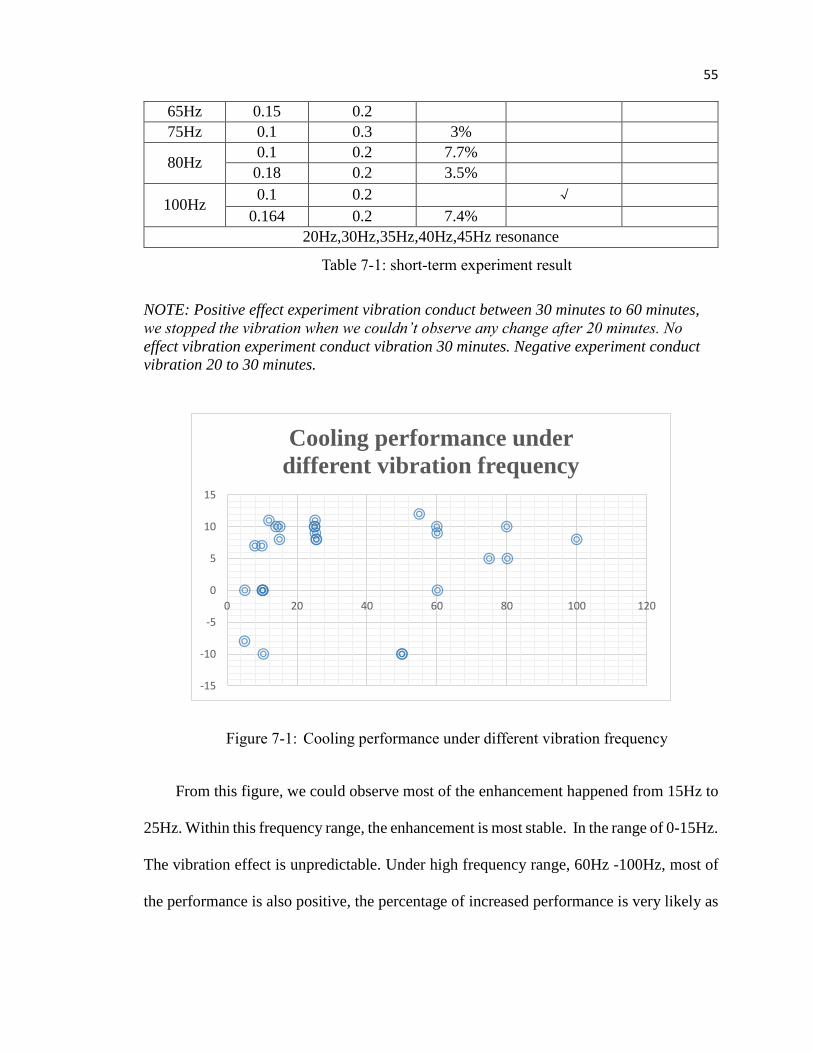
55
65Hz 0.15 0.2
75Hz 0.1 0.3 3%
80Hz 0.1 0.2 7.7%
0.18 0.2 3.5%
100Hz 0.1 0.2 √
0.164 0.2 7.4%
20Hz,30Hz,35Hz,40Hz,45Hz resonance
Table 7-1: short-term experiment result
NOTE: Positive effect experiment vibration conduct between 30 minutes to 60 minutes,
we stopped the vibration when we couldn’t observe any change after 20 minutes. No
effect vibration experiment conduct vibration 30 minutes. Negative experiment conduct
vibration 20 to 30 minutes.
Figure 7-1: Cooling performance under different vibration frequency
From this figure, we could observe most of the enhancement happened from 15Hz to
25Hz. Within this frequency range, the enhancement is most stable. In the range of 0-15Hz.
The vibration effect is unpredictable. Under high frequency range, 60Hz -100Hz, most of
the performance is also positive, the percentage of increased performance is very likely as
-15
-10
-5
0
5
10
15
0 20 40 60 80 100 120
Cooling performance under
different vibration frequency

56
under 15-25Hz. However, high frequency introduces more resonance and more energy cost.
Thus, we do not recommend high frequency vibration.
For different amplitude, we could not define any conclusion. The test amplitude
mostly from 0.1mm to 0.35mm. There is not obvious amplitude effect from this experiment.
From energy consumption concern, we recommend use the amplitude from 0.1mm to
0.25mm to save energy. And more amplitude experiments were conducted in the further
experiment under the conditions with 2EH additive and without additive.
Therefore, when we planned for the experiment with 2EH additive, we also targeted
at 15Hz to 30Hz (resonance frequency at 35Hz to 55 Hz). The results with n-octanol
additive do not provide us the solution concentration information for the absorber heat and
mass transfer analysis and it is not intended to be compared directly to the results from the
long-term tests.
7.2 Long-term tests
After half a year preliminary experiment, the long term test started based on the results
of short term tests. For the frequency, we focus on 15Hz to 30Hz and for the amplitude we
focus on 0.1mm to 0.4mm. Considering that additives may impact the effect of mechanism
motions on the absorber, this part of test is separated into the test without additive (7.2.1-
7.2.4) and the test with 2EH additive (7.2.5-7.2.7). The long-term vibration experiment
plan was set up as the following groups based on the short-term test experience.
From the preliminary experiments, we found different solution flowrates have
different enhancement when a vibration was introduced. Considering different solution
flowrates result in different film thickness on the tube surface in the absorber, it is

57
reasonable to assume that, when a vibration is introduced, we will have different heat and
mass transfer enhancement in the system with different solution flowrates. We conducted
the experiments to test the influences of different solution flow rate from 0.1-0.5 m3/h
(0.44-2.2 GPM) under fixed vibration combination 25Hz, 0.2mm/0.79inch, which is shown
in 7.2.1 and 7.2.5 for the case without and with an additive.
Amplitude is one of the most important controlled variables in this test. From the
preliminary experiments, we knew the optimal amplitude is from 0.15-0.25 mm/0.59-0.98
inch. Thus we extended the test range a little bit, and conducted the long term experiment
from 0.1mm-0.4 mm/0.39-1.57 inch under fixed amplitude 25Hz and 15Hz. The result is
shown in 7.2.2, 7.2.3 and 7.2.6. The reason we test both 15Hz and 25Hz is to separate the
frequency effect from other aspects.
Frequency is another important variable for vibration tests. From the preliminary
experiments, we found the most optimal frequency is from 20-30Hz. Thus we conducted
the long term experiments from 15-30Hz frequency under the fixed amplitude 0.2mm,
which is shown in 7.2.4 and 7.2.7.
In this section, we mainly compare seven sets of results in the long-term tests as
grouped in Table 7-2.
Experiments without additive (7.2.1-
7.2.4)
Controlled
variables Purpose
Set 1. (7.2.1)
Different solution flow rate
tests with a fixed vibration
condition at 25Hz, 0.2mm
Solution flow rate:
0.1m3/h - 0.5m3/h;
0.44GPM-2.2GPM
Find out effect from
different solution
flow rates
Set 2. (7.2.2) Different amplitude tests
with fixed frequency 25Hz
Amplitude: 0.1mm-
0.4mm (0.39inch-
1.57inch)
Find out effect from
different vibration
amplitudes

58
Set 3. (7.2.3)
Different amplitude tests
with a fixed frequency at
15Hz
Amplitude: 0.1mm-
0.4mm (0.39inch-
1.57inch)
Find out effect from
different vibration
amplitudes,
compare the results
with 15Hz to that
with 25Hz
Set 4. (7.2.4)
Different Frequency tests
with a fixed amplitude at
0.2mm
Frequency: 15Hz-
30Hz
Find out effect from
different vibration
frequencies
Experiments with 2EH additive (7.2.5-
7.2.7)
Controlled
variables Purpose
Set 5. (7.2.5)
Different solution flow rate
tests with a fixed vibration
condition at 25Hz, 0.2mm
Solution flow rate:
0.1m3/h - 0.4m3/h
(0.44GPM-
1.76GPM)
Find out effect from
different solution
flow rate
Set 6. (7.2.6)
Different amplitude tests
with a fixed frequency at
25Hz
Amplitude: 0.1mm-
0.4mm (0.39inch-
1.57inch)
Find out effect from
different vibration
amplitudes
Set 7. (7.2.7)
Different Frequency tests
with a fixed amplitude at
0.2mm
Frequency: 15Hz-
30Hz
Find out effect from
different vibration
frequencies
Table 7-2: Summary of experiment sets
Summarized results for the controlled tests in Table 7-2 are shown in the following
tables and figures.
Detailed results are collected in the appendix of this report. In each table, we provide
the vibration frequency and amplitude. The varied parameters are highlighted in light blue.
Film thickness, amplitude to thickness ratio, enhancement percentage and vibration
duration are listed. Under each table, we use column charts to illustrate the percentage of
enhancement without and with vibration.
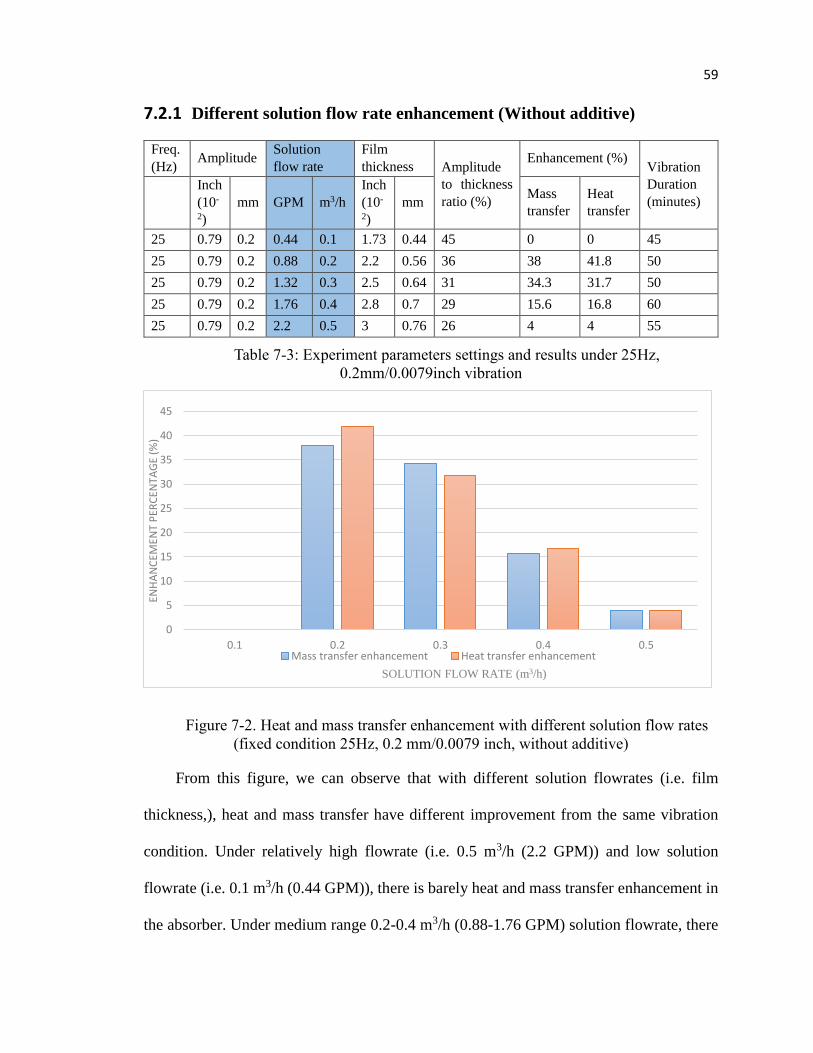
59
7.2.1 Different solution flow rate enhancement (Without additive)
Freq.
(Hz) Amplitude
Solution
flow rate
Film
thickness Amplitude
to thickness
ratio (%)
Enhancement (%) Vibration
Duration
(minutes)
Inch
(10-
2)
mm GPM m3/h
Inch
(10-
2)
mm Mass
transfer
Heat
transfer
25 0.79 0.2 0.44 0.1 1.73 0.44 45 0 0 45
25 0.79 0.2 0.88 0.2 2.2 0.56 36 38 41.8 50
25 0.79 0.2 1.32 0.3 2.5 0.64 31 34.3 31.7 50
25 0.79 0.2 1.76 0.4 2.8 0.7 29 15.6 16.8 60
25 0.79 0.2 2.2 0.5 3 0.76 26 4 4 55
Table 7-3: Experiment parameters settings and results under 25Hz,
0.2mm/0.0079inch vibration
Figure 7-2. Heat and mass transfer enhancement with different solution flow rates
(fixed condition 25Hz, 0.2 mm/0.0079 inch, without additive)
From this figure, we can observe that with different solution flowrates (i.e. film
thickness,), heat and mass transfer have different improvement from the same vibration
condition. Under relatively high flowrate (i.e. 0.5 m3/h (2.2 GPM)) and low solution
flowrate (i.e. 0.1 m3/h (0.44 GPM)), there is barely heat and mass transfer enhancement in
the absorber. Under medium range 0.2-0.4 m3/h (0.88-1.76 GPM) solution flowrate, there
0
5
10
15
20
25
30
35
40
45
0.1 0.2 0.3 0.4 0.5
ENH
AN
CEM
ENT
PER
CEN
TAG
E (%
)
SOLUTION FLOW RATE (m3/h)
Mass transfer enhancement Heat transfer enhancement

60
are significant heat and mass transfer enhancement, especially under 0.2-0.3 m3/h (0.88-
1.32 GPM) condition. The higher solution flowrate means higher solution spray density,
which also causes the film thickness in the tubes to be thicker. The detail experiment
parameters are shown in Appendix C.1.
The solution film thicknesses were calculated from the equation by Jayasekara and
Halgamuge (2013).
δ = [3𝜇Г
(𝜌𝑙−𝜌𝑣)2𝑔𝑠𝑖𝑛𝜃]
1
3 (1)
Where,
Г, Liquid mass flow rate pass unit width.
𝜇, Lithium Bromide solution dynamic viscosity (Source: Wang K., Abdelaziz and
Vineyard E. A, 2012)
𝜌𝑙, Lithium Bromide density
𝜌𝑣, Vapor density under absorption pressure
𝑔, gravitational acceleration
𝜃, film thickness allocation angle from vertical direction
The film thickness is different under different solution flow rate, and the detail film
thickness is shown in the following sheet.
Solution flow rate (m3/h) 0.1 0.2 0.3 0.4 0.5
Film thickness (mm) 0.17 0.20 0.25 0.29 0.33

61
7.2.2 Different amplitude enhancement (25Hz) (Without additive)
Freq.
(Hz)
Amplitude Solution
flow rate
Film
thickness Amplitude
to thickness
ratio (%)
Enhancement (%) Duration of
the
vibration
(minutes)
Inch
(10-
2)
mm GPM m3/h
Inch
(10-
2)
mm Mass
transfer
Heat
transfer
25 0.39 0.1 0.88 0.2 2.2 0.56 18 0 0 70
25 0.79 0.2 0.88 0.2 2.2 0.56 36 38 41.8 50
25 1.18 0.3 0.88 0.2 2.2 0.56 54 18 17.5 70
25 1.57 0.4 0.88 0.2 2.2 0.56 72 15.8 11.4 60
Table 7-4: Experiment parameters settings and results under 25Hz, 0.2 m3/h (0.88
GPM)
Figure 7-3. Heat and mass transfer with different amplitudes (fixed condition 25Hz
0.2 m3/h (0.88 GPM))
In this group of data, we could observe during very low amplitude, there is basically
no enhancement (or very little). It seems such tiny vibration could not induce film surface
0
5
10
15
20
25
30
35
40
45
0.1 0.2 0.3 0.4
ENH
AN
CEM
ENT
PER
CEN
TAG
E (%
)
AMPLITUDE (mm)
Mass transfer enhancement Heat transfer enhancement

62
change and vortex in the film. When the amplitude reaches 0.2 mm/0.0079 inch, the result
shows very positive data from the vibration. The effect continues from 0.2 mm/0.0079 inch
to 0.4 mm/0.1157 inch. Consider higher amplitude consuming more energy but no better
enhancement, 0.2 mm/0.0079 inch is the most optimal amplitude in our test. The detail
experiment parameters are shown in Appendix C.2.
In short term experiment, 0.2 mm has only about 15% enhancement. There are several
reasons that may introduce the enhancement difference. The first one is the experiment
time. Short term experiment only has 20-30 mins’ vibration, and the enhancement may not
reach the maximum yet. The other reason may be from the additive. The additive and
vibration effect may have some overlap. The function of additive is to enhance molecular
activity and break the surface tension of film. This is similar as the vibration function. We
will also compare with the experiment with 2EH additive later to get more confident
conclusion.
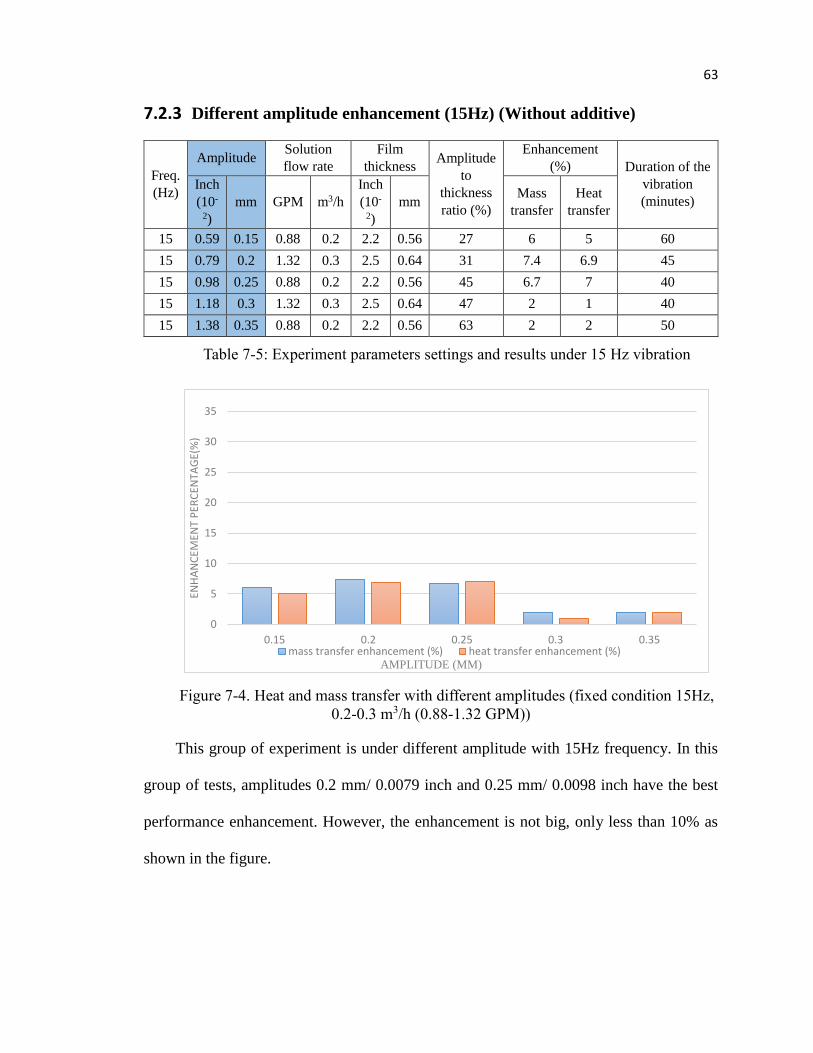
63
7.2.3 Different amplitude enhancement (15Hz) (Without additive)
Table 7-5: Experiment parameters settings and results under 15 Hz vibration
Figure 7-4. Heat and mass transfer with different amplitudes (fixed condition 15Hz,
0.2-0.3 m3/h (0.88-1.32 GPM))
This group of experiment is under different amplitude with 15Hz frequency. In this
group of tests, amplitudes 0.2 mm/ 0.0079 inch and 0.25 mm/ 0.0098 inch have the best
performance enhancement. However, the enhancement is not big, only less than 10% as
shown in the figure.
0
5
10
15
20
25
30
35
0.15 0.2 0.25 0.3 0.35
ENH
AN
CEM
ENT
PER
CEN
TAG
E(%
)
AMPLITUDE (MM)mass transfer enhancement (%) heat transfer enhancement (%)
Freq.
(Hz)
Amplitude Solution
flow rate
Film
thickness Amplitude
to
thickness
ratio (%)
Enhancement
(%) Duration of the
vibration
(minutes)
Inch
(10-
2)
mm GPM m3/h
Inch
(10-
2)
mm Mass
transfer
Heat
transfer
15 0.59 0.15 0.88 0.2 2.2 0.56 27 6 5 60
15 0.79 0.2 1.32 0.3 2.5 0.64 31 7.4 6.9 45
15 0.98 0.25 0.88 0.2 2.2 0.56 45 6.7 7 40
15 1.18 0.3 1.32 0.3 2.5 0.64 47 2 1 40
15 1.38 0.35 0.88 0.2 2.2 0.56 63 2 2 50

64
From this group of experiments, we could observe the critical amplitude point is likely
at 0.25 mm. After the amplitude reaches 0.3 mm, the performance enhancement reduces to
only 20%

65
7.2.4 Different frequency enhancement (Without additive)
Freq(
Hz)
Amplitude
Solution flow
rate
Film
thickness Amplitude
to
thickness
ratio (%)
Enhancement (%) Durati
on of
the
vibrati
on
(minut
es)
Inch
(10-2) mm GPM m3/h
Inch
(10-2) mm
Mass
transfer
Heat
transfe
r
15 0.79 0.2 1.32 0.3 2.5 0.64 31 4.5 4 50
20 0.79 0.2 1.32 0.3 2.5 0.64 31 10.6 8.5 70
25 0.79 0.2 1.32 0.3 2.5 0.64 31 34.3 31.7 50
30 0.79 0.2 1.32 0.3 2.5 0.64 31 10.7 8.7 35
Table 7-6: Experiment parameter settings and results under 0.2mm, 0.3m3/h
(1.32GPM)
Figure 7-5. Heat and mass transfer with different frequency (fixed condition 0.2 mm
(0.0079 inch) 0.3 m3/h (1.32 GPM))
From this group of data, we can observe that there are different influences under
different frequencies to the heat and mass transfer in the absorber. 25Hz has much better
enhancement among the test, which doubles the enhancement from 20Hz and 30Hz and
triples from 15Hz. Thus for this particular type of absorption chiller, 25 Hz frequency
0
5
10
15
20
25
30
35
40
15 20 25 30
ENH
AN
CEM
ENT
PER
CEN
TAG
E (%
)
FREQUENCY (Hz)
Mass transfer enhancement Heat transfer enhancement

66
might be used to improve the performance. Compared to 15Hz test group in the last section,
25Hz has better enhancement under all conditions. The detailed experiment parameters are
shown in Appendix C.3.
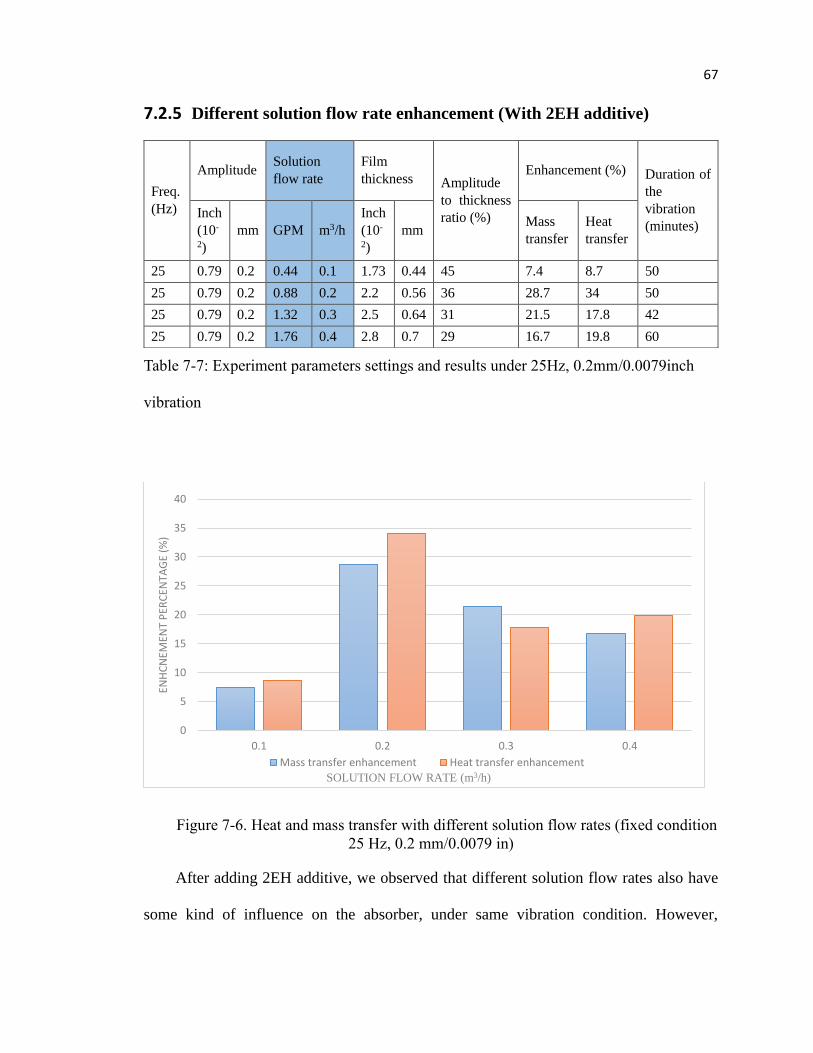
67
7.2.5 Different solution flow rate enhancement (With 2EH additive)
Table 7-7: Experiment parameters settings and results under 25Hz, 0.2mm/0.0079inch
vibration
Figure 7-6. Heat and mass transfer with different solution flow rates (fixed condition
25 Hz, 0.2 mm/0.0079 in)
After adding 2EH additive, we observed that different solution flow rates also have
some kind of influence on the absorber, under same vibration condition. However,
0
5
10
15
20
25
30
35
40
0.1 0.2 0.3 0.4
ENH
CN
EMEN
T P
ERC
ENTA
GE
(%)
SOLUTION FLOW RATE (m3/h)
Mass transfer enhancement Heat transfer enhancement
Freq.
(Hz)
Amplitude Solution
flow rate
Film
thickness Amplitude
to thickness
ratio (%)
Enhancement (%) Duration of
the
vibration
(minutes) Inch
(10-
2)
mm GPM m3/h
Inch
(10-
2)
mm Mass
transfer
Heat
transfer
25 0.79 0.2 0.44 0.1 1.73 0.44 45 7.4 8.7 50
25 0.79 0.2 0.88 0.2 2.2 0.56 36 28.7 34 50
25 0.79 0.2 1.32 0.3 2.5 0.64 31 21.5 17.8 42
25 0.79 0.2 1.76 0.4 2.8 0.7 29 16.7 19.8 60
68
compared to the experiment without additive, the enhancement difference is much smaller.
For 0.2-0.4 m3/h (0.88-1.6 GPM) solution flow rate, the enhancement from different
solution flowrates is very similar. For 0.1 m3/h (0.22 GPM) solution flow rate, the result
with additive has an improved enhancement (20% compare to 1%). The detailed
experiment parameters are shown in Appendix C.4.
Compared to group 1 (different solution flow rate without additive), the trend is
generally the same. The performance peak happens under 0.2 m3/h solution flow rate (0.2
mm film thickness). The thickness is the same as vibration amplitude. We have a
hypothesis that the vibration enhanced performance is bigger when the film thickness is
similar as the vibration amplitude. However, this hypostasis still need further experiments
to testify and the theory of this phenomenon still remains unavailable.

69
7.2.6 Different amplitude enhancement (With 2EH additive)
Freq.
(Hz)
Amplitude Solution flow
rate
Film
thickness Amplitude
to
thickness
ratio (%)
Enhancement (%) Duration of
the vibration
(minutes)
Inch
(10-
2)
mm GPM m3/h
Inch
(10-
2)
mm Mass
transfer
Heat
transfer
25 0.39 0.1 0.88 0.2 2.2 0.56 18 16.6 18.7 45
25 0.79 0.2 0.88 0.2 2.2 0.56 36 28.7 34 50
25 1.18 0.3 0.88 0.2 2.2 0.56 54 27.8 29.4 45
25 1.57 0.4 0.88 0.2 2.2 0.56 72 12.6 14 60
Table 7-8: Experiment parameters settings and results under 25 Hz, 0.2 m3/h (0.88
GPM)
Figure 3-7. Heat and mass transfer enhancement with different amplitudes. (fixed
condition 25 Hz, 0.2 m3/h (0.88 GPM))
Compared to the data without additive, we observe 0.2 mm/0.0079 inch and 0.3
mm/0.0118 inch amplitude conditions also have the highest enhancement from vibration.
The difference also exists under 0.1 mm/0.0039 inch vibration condition; the enhancement
0
5
10
15
20
25
30
35
40
0.1 0.2 0.3 0.4
ENH
AN
CEM
ENT
PER
CEN
TAG
E (%
)
AMPLITUDE (mm)
Mass transfer enhancement Heat transfer enhancement

70
with additive reaches 18%. Meanwhile there is barely any enhancement without additive.
The detailed experiment parameters are shown in Appendix C.5.
Compared to group 2 (different amplitude without additive) we could observe the
trend is also very similar. 0.2 mm amplitude has the best performance from vibration effect.

71
7.2.7 Different frequency enhancement (With 2EH additive)
Freq.
(Hz)
Amplitude Solution
flow rate
Film
thickness Amplitude
to
thickness
ratio (%)
Enhancement (%) Duration of
the vibration
(minutes)
Inch
(10-
2)
mm GPM m3/h
Inch
(10-
2)
mm Mass
transfer
Heat
transfer
15 0.79 0.2 1.32 0.3 2.5 0.64 31 9 9.9 50
20 0.79 0.2 1.32 0.3 2.5 0.64 31 22.2 22 40
25 0.79 0.2 1.32 0.3 2.5 0.64 31 24.8 27.4 45
30 0.79 0.2 1.32 0.3 2.5 0.64 31 19.4 21.1 100
Table 7-9: experiment parameters settings and results under 0.2mm, 0.3m3/h
(1.32GPM)
Figure 7-8. Heat and mass transfer enhancement with different frequencies. (fixed
condition 0.2mm, 0.3m3/h (1.32GPM))
From this group of data, we also observe 25Hz has the highest enhancement, which
is the same result as without additive, and the enhancement amount is also similar. The
differences from the enhancement margin under 15Hz, 20Hz and 30Hz are shown in the
figure. The enhancement with additive is a little bit bigger in these three conditions. The
detail experiment parameters are shown in Appendix C.6.
0
5
10
15
20
25
30
15 20 25 30
ENH
AN
CEM
ENT
PER
CEN
TAG
E (%
)
FREQUENCY (Hz)Mass transfer enhancement Heat Transfer enhancement

72
Compared to group 4 (different frequency performance without additive), the peak
performance frequency is also happening under 25Hz. However, the 20Hz and 30Hz
conditions have some difference. During the experiment with additive, both 20Hz and
30Hz have performance enhancement better than 20%. In the experiment without the
additive, 20Hz and 30Hz only have 10% enhancement. This phenomenon possibly plays
some of the role of vibration effect. Thus makes the critical peak frequency range bigger
compare without additive. This phenomenon could be only testified with more experiment
and more scientific theory analysis.
73
Chapter 8 Summary and discussions
In this project, we reviewed the literature on the effects of mechanisms on the heat
and mass transfer in the absorption process, designed and constructed an active mechanism
for enhancing the heat and mass transfer, and evaluated the heat and mass transfer
performance when the mechanism was introduced to the chiller. Experiments were
conducted to identify the effects of vibration frequency and amplitude on the absorber
performance. Other factors, including the flowrates and additive, that could impact the
effects were also investigated. The test results were presented in this thesis.
Based on the results for the commercial chiller used in this study, we can draw the
following conclusion:
The vibration mechanism on the chiller can impact the heat and mass transfer process
in the absorber; therefore, it might be applicable by commercial manufacturers as a
technology to improve the performance of absorption chillers;
There is an optimal combination of vibration frequency and amplitude that can best
enhance the heat and mass transfer for a specific chiller and configuration. For this chiller,
the optimal conditions are 25 Hz and 0.2-0.3 mm. Without additive, there is nearly 40%
enhancement at the optimal conditions. With 2EH additive, the enhancement is still nearly
30-35%. While there are also impacts from other vibration combinations, they seem to be
less effective compared to the optimal set;

74
The presence of the additive changes the final performance of the heat and mass
transfer in the absorber, when the vibration is introduced, in terms of the enhancement
percentage among the combinations;
There are also some extra findings from our experiments. Such as the amplitude’s
impact on the performance is better when it is close to the film thickness. And the additive
enlarges the peak critical range compared with the condition without additive. However,
these findings are not very confidential at this stage; more experiment and theory analysis
should be done to testify them.
The heat and mass transfer inside of the absorber is a complicated and coupled process.
There are many factors that might impact the performance, including the solution flowrates,
working condition of the components, etc. Based on our experimental results, we observe
positive impacts, more or less, on the heat and mass transfer process when a vibration is
introduced. Although we don’t have theoretical proof and/or microscopic measurements
on the falling film, we speculate that the enhancement from the vibration is caused by the
changed thickness and distribution between the unsaturated layer and saturated layer of the
falling film. Future study is needed to fill the technical gap.
75
Chapter 9 Future study
From the theory aspect, the vibration effect in micro scope hasn’t been studied. Using
high speed camera could assist us to study the mechanism motion in micro scope. The
images from a high speed camera could allow us directly observe the circumstance on the
film surface. The findings could help us build a physical model of mechanism motion effect
falling film surface.
The additive function is still not so clear under mechanism motion. Even without
mechanism motion, the additive function is not very well-recognized in the world. Working
on additive effect on theoretical level is one direction for absorption system. On the other
hand, the functions of mechanism motion and additive have some overlap. If mechanism
motion could enhance additive performance, it will also have the potential using in
chemical engineering area.
For the absorption chiller industry, introducing vibration table to each chiller is not
practical. It should seek some mechanism devices to introduce simpler mechanism motion.
Such as vibrating only tubes buddle in absorber or using solution pulse pushing platform
which linked with tubes buddle to provide specific vibration combination (such as 25Hz,
0.2mm).
76
References
Aoune, A. and C. Ramshaw. 1999. Process intensification: heat and mass transfer characteristics of liquid
films on rotating discs. International journal of heat and mass transfer, 42(14):2543-2556.
Arun, M. B., M. P. Maiya and S. S. Murthy. 2000. Equilibrium low pressure generator temperatures for
double-effect series fow absorption refrigeration systems. Applied Thermal Engineering, 20(3):227-242.
ASHRAE. 2010. 2010 ASHRAE Handbook. Atlanta, USA: American Society of Heating, Refrigerating
and Air-Conditioning Engineers, Inc.
Babadi, F. and B. Farhanieh. 2005. Characteristics of heat and mass transfer in vapor absorption of falling
film flow on a horizontal tube. International Communications in Heat and Mass Transfer, 32(9):1253-
1265.
Barrera, M. A., R. Best, V. H. Gomez, O. G. Valladares, N. Velazquez and J. Chan. 2012. Analysis of the
performance of a GAX hybrid (Solar-LPG) absorption refrigeration system operating with temperatures
from solar heating sources. Energy Procedia, 30(-):884-892.
Bergles, A. E. and R. M. Manglik. 2013. Current progress and new developments in enhanced heat and mass
transfer. Journal of Enhanced Heat Transfer, 20(1):1-15.
Bredow, D., P. Jain, A. Wohlfeil and F. Ziegler. 2008. Heat and mass transfer characteristics of a horizontal
tube absorber in a semi-commercial absorption chiller. Internationl Journal of Refrigeration, 31(7):1273-
1281.
Chen, R. H., Y. J. Lin and C. M. Lai. 2013. The Influence of Horizontal Longitudinal Vibrations and the
Condensation Section Temperature on the Heat Transfer Performance of a Heat Pipe. Heat Transfer
Engineering, 34(1):45-53.
Cheng, L., T. Luan, W. Du and M. Xu. 2009. Heat transfer enhancement by flow-induced vibration in heat
exchangers. International Journal of Heat and Mass Transfer, 52(3):1053-1057.
Garimella, S., R. N. Christensen and D. Lacy. 1996. Performance evaluation of a generator-absorber heat-
exchange heat pump. Applied Thermal Engineering, 16(7):591-604.
Garousi Farshi, L., S. M. S. Mahmoudi, M. A. Rosen, M. Yari and M. Amidpour. 2013. Exergoeconomic
analysis of double effect absorption refrigeration systems. Energy Conversion and Management, 65(-):13-
25.
Gomri, R. 2010. Investigation of the potential of application of single effect and multiple effect absorption
cooling systems. Energy Conversion and Management, 51(8):1629-1636.
Harkins, W. D. 1952. The physical chemistry of surface films. New York: Reinhold.
Hoffmann, L., I. Greiter, A. Wagner, V. Weiss and G. Alefeld. 1996. Experimental investigation of heat
transfer in a horizontal tube falling film absorber with aqueous solutions of LiBr with and without
surfactants. International Journal of Refrigeration, 19(5):331-341.
Islam, M. R. 2008. Absorption process of a falling film on a tubular absorber:An experimental and numerical
study. Applied Thermal Engineering, 28(11):1386-1394.

77
Jeong, S. and S. Garimella. 2002. Falling-film and droplet mode heat and mass transfer in a horizontal tube
LiBr/water absorber. International Journal of Heat and Mass Transfer, 45(7):1445-1458.
Jun, Y. D., K. J. Kim and J. M. Kennedy. 2010. Dynamic surface tension of heat transfer additives suitable
for use in steam condensers and absorbers. Internationl Journal of Refrigeration, 33(2):428-434.
Kiani, H., D. W. Sun and Z. Zhang. 2012. The effect of ultrasound irradiation on the convective heat transfer
rate during immersion cooling of a stationary sphere. Ultrasonics Sonochemistry, 19(6):1238-1245.
Kim, J. S., H. Lee and S. I. Yu. 1999. Absorption of water vapour into lithium bromide-based solutions with
additives using a simple stagnant pool absorber. International Journal of Refrigeration, 22(3) 188-193.
Kim, K. J., N. S. Berman, D. S. C. Chau and B. D. Wood. 1995. Absorption of water vapour into falling films
of aqueous lithium bromide. International Journal of Refrigeration, 18(7):486-494.
Kostin, Z. A. and V. G. Gorshkov. 1990. Experimental investigation of the processes occurring in a model
of the absorbing apparatus of a Lithium-Bromide refrigerating machine with fixed and vibrating tubes.
Kulankara, S. and K. E. Herold. 2002. Surface tension of aqueous lithium bromide with heat/mass transfer
enhancement additives: the effect of additive vapor transport. International Journal of Refrigeration,
25(3):383-389.
Kyung, I., K. E. Herold and Y. T. Kang. 2007. Model for absorption of water vapor into aqueous LiBr flowing
over a horizontal smooth tube. International Journal of Refrigeration, 30(4):591-600.
Lee, S., L. K. Bohra, S. Garimella and A. K. Nagavarapu. 2012. Measurement of absorption rates in
horizontal-tube falling-film ammonia-water absorbers. International Journal of Refrigeration, 35(3):613-
632.
Lemlich, R. 1955. Effect of Vibration on Natural Convective Heat Transfer. Industrial & Engineering
Chemistry, 6(1175-1180.
Lemlich, R. and M. R. Levy. 1961. The effect of vibration on natural convective mass transfer. AIChE
Journal, 7(2):240-242.
Liu, Y. L., S. M. Xu, W. Han and B. Wang. 2004. Experimental study of falling film absorption in a swaying
tube using TFE/NMP as working fluid. Journal of Dalian University of Technology, 44(1):65-69.
Melendez, D. M. 2010. Effect of ultrasonic vibration on the mass transfer coefficient in a sieve plate scrubber.
Master, Clemson University.
Nosoko, T., A. Miyara and T. Nagata. 2002. Characteristics of falling film flow on completely wetted
horizontal tubes and the associated gas absorption. International Journal of Heat and Mass Transfer,
45(13):2729-2738.
Papaefthimiou, V. D., I. P. Koronaki, D. C. Karampinos and E. D. Rogdakis. 2012. A novel approach for
modelling LiBr-H2O falling film absorption on cooled horizontal bundle of tubes. International Journal
of Refrigeration, 35(4):1115-1122.
Park, C. W., H. C. Cho and Y. T. Kang. 2004. The effect of heat transfer additive and surface roughness of
micro-scale hatched tubes on absorption performance. International Journal of Refrigeration, 27(3):264-
270.

78
Rameshkumar, A., M. Udayakumar and R. Saravanan. 2009. Heat transfer studies on a GAXAC (generator-
absorber-exchange absorption compression) cooler. Applied Energy, 86(10):2056–2064.
Seol, S. S. and S. Y. Lee. 2005. Experimental study of film flow and heat/mass transfer in LiBr–H2O solution
flowing over a cooled horizontal tube. International Communications in Heat and Mass Transfer,
32(3):445-453.
Sirwan, R., M. A. Alghoul, K. Sopian, Y. Ali and J. Abdulateef. 2013. Evaluation of adding flash tank to
solar combined ejector–absorption refrigeration system. Solar Energy, 91(-):283-296.
Soto Frances, V. M. and J. M. Pinanzo Ojer. 2004. Multi-factorial study of the absorption process of H2O
(vap) by a LiBr (aq) in a horizontal tube bundle using 2-ethyl-1-hexanol as surfactant. International Journal
of Heat and Mass Transfer, 47(14):3355–3373.
Sultana, P., N. E. Wijeysundera, J. C. Ho and C. Yap. 2007. Modeling of horizontal tube-bundle absorbers
of absorption cooling systems. International Journal of Refrigeration, 30(4):709-723.
Tierney, M. J. 2007. Options for solar-assisted refrigeration—Trough collectors and double-effect chillers.
Renewable Energy, 32(2):183-199.
Tsuda, H. and H. Perez-Blanco. 2001. An experimental study of a vibrating screen as means of absorption
enhancement. International Journal of Heat and Mass Transfer, 44(21):4087-4094.
Yigit, A. 1999. A numerical study of heat and mass transfer in falling film absorber. International
communications in heat and mass transfer, 26(2):269-278.
Yuan, Z. and K. E. Herold. 2001. Surface tension of pure water and aqueous lithium bromide with 2-ethyl-
hexanol. Applied Thermal Engineering, 21(8):881-897.
Behfar, A., Z. Shen, J Lau, and Y. Yu, (2014) Heat and mass transfer enhancement potential on falling film
absorbers for water-LiBr mixtures via a literature review (RP-1462), HVAC&R Research, Volume 20, Issue
5, 570-580
Jayasekara, S., and S. K. Halgamuge, (2013) Mathematical modeling and experimental verification of an
absorption chiller including three dimensional temperature and concentration distributions, Applied Energy,
Volume 106, 232–242
Lansing F. L., Computer modeling of a single-stage lithium bromide/water absorption refrigeration unit,
Deep Space Network Progress Report, January 1976.
Wang K., Abdelaziz O. Vineyard E. A., Thermophysical Properties of Lithium Bromide + 1, 2-Propanediol
Aqueous Solutions— Solubility, Density and Viscosity, International refrigeration and air conditioning
conference, 2157, July 2012

79

80
Appendix
A. Continuous heat & mass transfer and cooling performance results
(with 2EH additive)
A.1. 15Hz 0.2mm
Frequency 15(Hz) 50 minutes’ vibration
Amplitude 0.2mm/0.0079inch Amplitude to thickness ratio (%) 31
Solution flow rate (GPM/m3/h) 1.32 0.3 Mass transfer enhancement (%) 9
Chilled water inlet temperature (oF/oC) 57.38 14.1 Heat transfer enhancement (%) 9.9
Cooling water inlet (oF/oC) 84.92 29.4 Cooling enhancement (%) 14.5
Evaporating temperature (oF/oC) 51.44 10.8 Mass transfer standard deviation (%) 1.8
Hot water temperature (oF/oC) 197.6 92 Heat transfer standard deviation (%) 3
Absorber pressure (psi/kPa) 0.2842 1.96 T difference standard deviation (%) 2.5

81

82
A.2. 20Hz 0.2mm
Frequency 20(Hz) 45 minutes’ vibration
Amplitude 0.2mm/0.0079inch Amplitude to thickness ratio (%) 31
Solution flow rate (GPM/m3/h) 1.32 0.3 Mass transfer enhancement (%) 22.2
Chilled water inlet temperature (oF/oC) 57.38 14.1 Heat transfer enhancement (%) 22
Cooling water inlet (oF/oC) 84.74 29.3 Cooling enhancement (%) 11.7
Evaporating temperature (oF/oC) 51.08 10.6 Mass transfer standard deviation (%) 1.6
Hot water temperature (oF/oC) 199.4 93 Heat transfer standard deviation (%) 2.5
Absorber pressure (psi/kPa) 0.3132 2.16 T difference standard deviation (%) 3.5
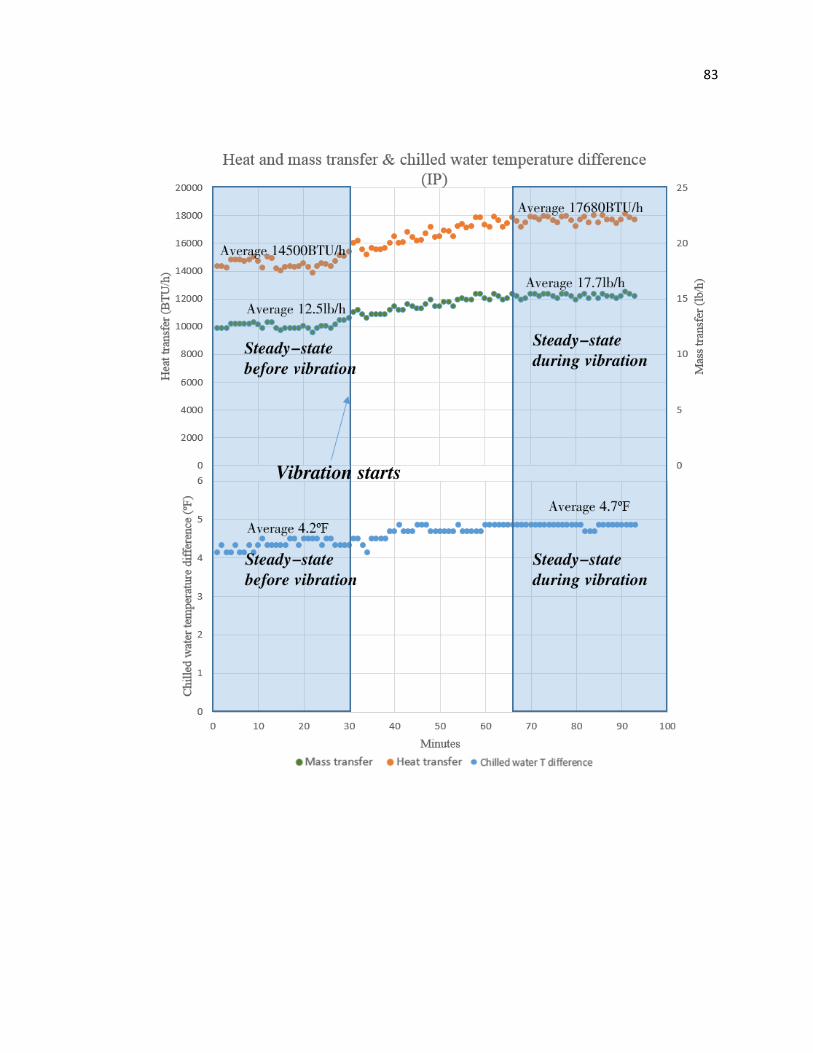
83

84
A.3. 25Hz 0.2mm
Frequency 25Hz 45 minutes’ vibration
Amplitude 0.2mm/0.0079inch Amplitude to thickness ratio (%`) 31
Solution flow rate (GPM/m3/h) 1.32 0.3 Mass transfer enhancement (%) 24.8
Chilled water inlet temperature (oF/oC) 57.38 14.1 Heat transfer enhancement (%) 27.4
Cooling water inlet (oF/oC) 85.1 29.5 Cooling enhancement (%) 13.5
Evaporating temperature (oF/oC) 51.44 10.8 Mass transfer standard deviation (%) 1.8
Hot water temperature (oF/oC) 198.5 92.5 Heat transfer standard deviation (%) 2.4
Absorber pressure (psi/kPa) 0.2929 2.02 T difference standard deviation (%) 2
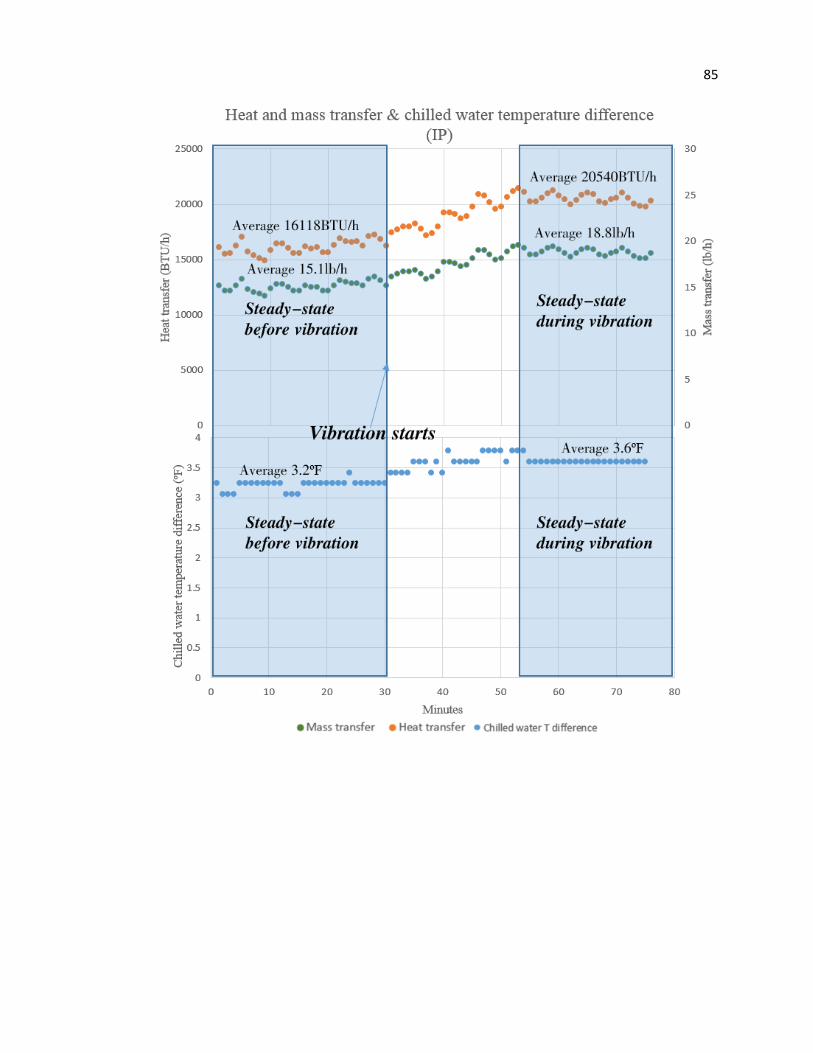
85

86
A.4. 30Hz 0.2mm
Frequency 30Hz 100 minutes’ vibration
Amplitude 0.2mm/0.0079inch Amplitude to thickness ratio (%) 31
Solution flow rate (GPM/m3/h) 1.32 0.3 Mass transfer enhancement (%) 19.4
Chilled water inlet temperature (oF/oC) 49.64 9.8 Heat transfer enhancement (%) 21.1
Cooling water inlet (oF/oC) 82.76 28.2 Cooling enhancement (%) 6.7
Evaporating temperature (oF/oC) 46.94 8.3 Mass transfer standard deviation (%) 2.5
Hot water temperature (oF/oC) 202.46 94.7 Heat transfer standard deviation (%) 3.3
Absorber pressure (psi/kPa) 0.2842 1.96 T difference standard deviation (%) 4.1

87

88
B. Parameters of the key sensors
序号 Sensor/meter Description
1 Platinum Thermal resistance
DT-W100--Z/P1/K/S/B/U/02/3/M3-
15
Insertion depth L = 15mm/0.6inch, the cold end 100,
the output resistance of the signal, the probe diameter
8mm/0.24inch, threaded M20*1.5, the first waterproof
watch
2 Liquid Turbine Flowmeter LWGY-
6/C/05/S/S/N/N
Media: Lithium bromide, medium temperature 40-
80℃/104-176oF, 30-60℃/86-140oF, DN6, internal
thread G1/2,6.3MPA/914psi pressure, live shows + 4-
20mA output, precision 0.5, commonly used flow
200kg/h/441lb/h, power supply 24VDC
3 Liquid Turbine Flowmeter
LWGY-25/C/05/S/S/N/N
Aqueous medium, medium temperature 20-60℃/68-
140oF, product temperature of -20-120℃/-4-248oF,
range 1-10m3/h, DN25, internal thread G5/4 or DN25
flange, threaded 6.3MPA/914psi pressure, pressure
flange 2.5MPA site display + 4-20mA output,
precision 0.5, commonly flow 4200kg/h / 9260lb/h,
power supply 24VDC
4 Liquid Turbine Flowmeter
LWGY-25/C/05/W/S/N/N
Aqueous medium, medium temperature 70-
100℃/158-212oF,0-30℃/32-86oF, product
temperature of -20- 120℃/248oF, range 0.5-10m3/h
(2.2-4.4GPM), DN25, internal thread G5/4 or DN25
flange, threaded 6.3MPA/914psi pressure, France
Portland 2.5MPA pressure, live shows + 4-20mA
output, precision 0.5, commonly flow 1550,2000kg/h
/ 4410lb/h, power supply 24VDC (standard without
mating flanges)
5 Concentration sensor Sensotech
Immersion sensor
40-14
Standard temperature: 20C to 120C / 68-248oF
optional temperature: to 200oC/392oF
Standard pressure: 16 bar
optional pressure: to 500 bar
standard: flange DN50
optional: flange 2" and other
Diameter of sensor head: 40mm/1.6inch
Diameter of sensor bar: 14mm/0.55inch
Immersion length: standard: 92mm/3.6inch
Supply 24VDC, 6W
Sensor head weight: 6.5kg/14.3lb

89
C. Summary of long-term experiment results
C.1. Detail information of different solution flow rates enhancement (Without
additive) 12/9/2014, Duration: 50 minutes
Frequency 25Hz
Amplitude 0.2mm/0.0079inch
Solution flow rate (GPM/m3/h) 0.88 0.2 Amplitude to thickness ratio (%) 36
Chilled water inlet temperature (oF/oC) 60.62 15.9 Mass transfer enhancement (%) 38
Cooling water inlet temperature (oF/oC) 83.3 28.5 Heat transfer enhancement (%) 41.8
Evaporating temperature (oF/oC) 54.68 12.6 Cooling enhancement (%) 31.4
Hot water temperature (oF/oC) 204.8 96 Mass transfer standard deviation (%) 2
Absorber pressure (psi/kPa) 0.3088 2.13 Heat transfer standard deviation (%) 4.2
12/10/2014, Duration: 50 minutes
Frequency 25Hz
Amplitude 0.2mm/0.0079inch
Solution flow rate (GPM/m3/h) 1.32 0.3 Amplitude to thickness ratio (%) 31
Chilled water inlet temperature (oF/oC) 56.66 13.7 Mass transfer enhancement (%) 34.3
Cooling water inlet temperature (oF/oC) 84.2 29 Heat transfer enhancement (%) 31.7
Evaporating temperature (oF/oC) 53.96 12.2 Cooling enhancement (%) 53.8
Hot water temperature (oF/oC) 196.7 91.5 Mass transfer standard deviation (%) 2
Absorber pressure (psi/kPa) 0.2987 2.06 Heat transfer standard deviation (%) 3
1/20/2015, Duration: 60 minutes
Frequency 25Hz
Amplitude 0.2mm/0.0079inch
Solution flow rate (GPM/m3/h) 1.76 0.4 Amplitude to thickness ratio (%) 29
Chilled water inlet temperature (oF/oC) 59.36 15.2 Mass transfer enhancement (%) 15.6
Cooling water inlet temperature (oF/oC) 83.66 28.7 Heat transfer enhancement (%) 16.8
Evaporating temperature (oF/oC) 50.54 10.3 Cooling enhancement (%) 17.4
Hot water temperature (oF/oC) 202.46 94.7 Mass transfer standard deviation (%) 1.8
Absorber pressure (psi/kPa) 0.2842 1.96 Heat transfer standard deviation (%) 2.5
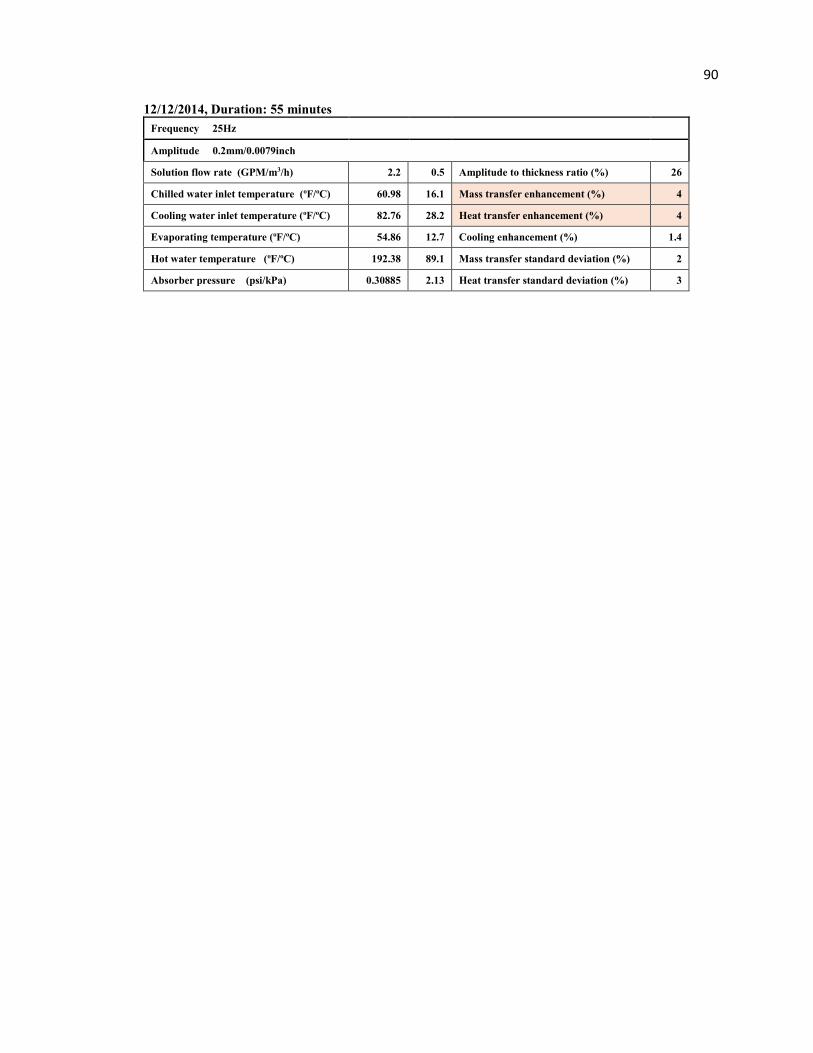
90
12/12/2014, Duration: 55 minutes
Frequency 25Hz
Amplitude 0.2mm/0.0079inch
Solution flow rate (GPM/m3/h) 2.2 0.5 Amplitude to thickness ratio (%) 26
Chilled water inlet temperature (oF/oC) 60.98 16.1 Mass transfer enhancement (%) 4
Cooling water inlet temperature (oF/oC) 82.76 28.2 Heat transfer enhancement (%) 4
Evaporating temperature (oF/oC) 54.86 12.7 Cooling enhancement (%) 1.4
Hot water temperature (oF/oC) 192.38 89.1 Mass transfer standard deviation (%) 2
Absorber pressure (psi/kPa) 0.30885 2.13 Heat transfer standard deviation (%) 3

91
C.2. Detail information of different amplitudes enhancement (25Hz) (Without
additive) 12/28/2014, Duration: 70 minutes
Frequency 25Hz
Amplitude 0.1mm/0.0039inch
Solution flow rate (GPM/m3/h) 0.88 0.2 Amplitude to thickness ratio (%) 18
Chilled water inlet temperature (oF/oC) 64.22 17.9 Mass transfer enhancement (%) 0
Cooling water inlet temperature (oF/oC) 93.02 33.9 Heat transfer enhancement (%) 0
Evaporating temperature (oF/oC) 58.1 14.5 Cooling enhancement (%) 12
Hot water temperature (oF/oC) 203 95 Mass transfer standard deviation (%) 1.5
Absorber pressure (psi/kPa) 0.31755 2.19 Heat transfer standard deviation (%) 3
12/9/2014, Duration: 50 minutes
Frequency 25Hz
Amplitude 0.2mm/0.0079inch
Solution flow rate (GPM/m3/h) 0.88 0.2 Amplitude to thickness ratio (%) 36
Chilled water inlet temperature (oF/oC) 60.62 15.9 Mass transfer enhancement (%) 38
Cooling water inlet temperature (oF/oC) 83.3 28.5 Heat transfer enhancement (%) 41.8
Evaporating temperature (oF/oC) 54.68 12.6 Cooling enhancement (%) 31.4
Hot water temperature (oF/oC) 204.8 96 Mass transfer standard deviation (%) 2
Absorber pressure (psi/kPa) 0.30885 2.13 Heat transfer standard deviation (%) 4.2
12/28/2014, Duration: 70 minutes
Frequency 25Hz
Amplitude 0.3mm/0.0118inch
Solution flow rate (GPM/m3/h) 0.88 0.2 Amplitude to thickness ratio (%) 54
Chilled water inlet temperature (oF/oC) 62.96 17.2 Mass transfer enhancement (%) 18
Cooling water inlet temperature (oF/oC) 93.38 34.1 Heat transfer enhancement (%) 17.5
Evaporating temperature (oF/oC) 56.48 13.6 Cooling enhancement (%) 12.1
Hot water temperature (oF/oC) 199.4 93 Mass transfer standard deviation (%) 2.3
Absorber pressure (psi/kPa) 0.3219 2.22 Heat transfer standard deviation (%) 3
12/15/2014, Duration: 60 minutes
Frequency 25Hz
Amplitude 0.4mm/0.0157inch
Solution flow rate (GPM/m3/h) 0.88 0.2 Amplitude to thickness ratio (%) 72
Chilled water inlet temperature (oF/oC) 59.18 15.1 Mass transfer enhancement (%) 15.8
Cooling water inlet temperature (oF/oC) 84.2 29 Heat transfer enhancement (%) 11.4
Evaporating temperature (oF/oC) 52.88 11.6 Cooling enhancement (%) 13.2
Hot water temperature (oF/oC) 204.8 96 Mass transfer standard deviation (%) 2
Absorber pressure (psi/kPa) 0.2987 2.06 Heat transfer standard deviation (%) 4
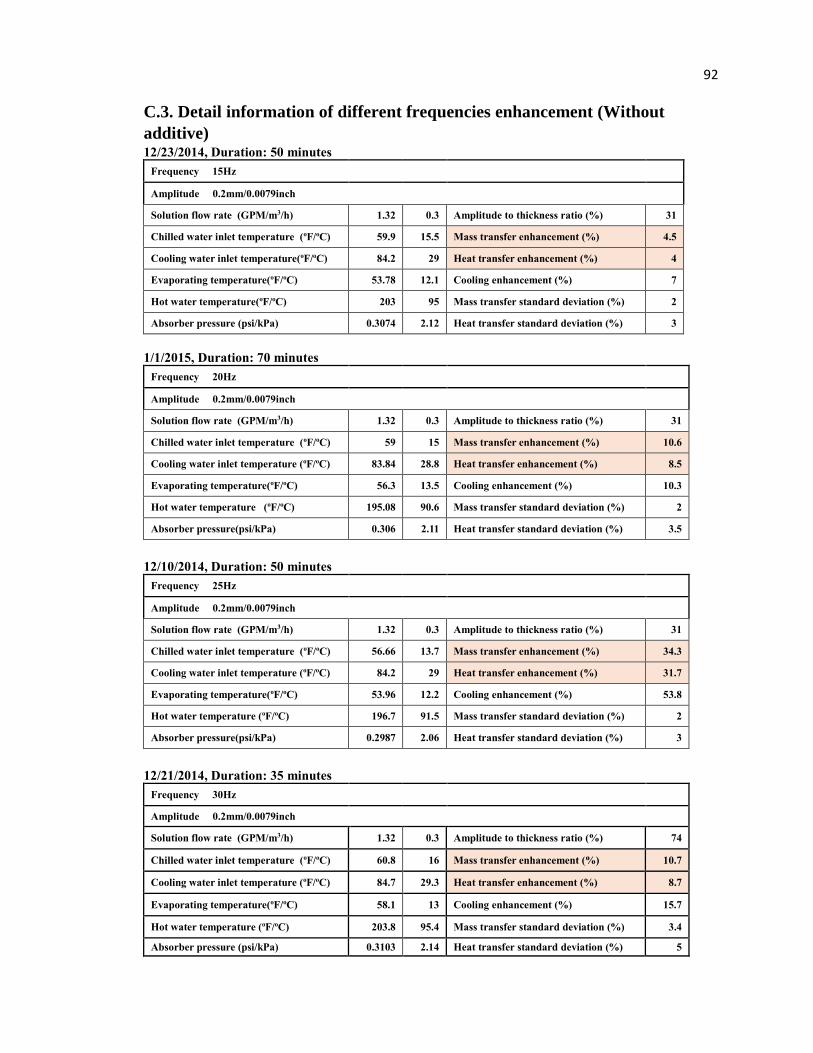
92
C.3. Detail information of different frequencies enhancement (Without
additive) 12/23/2014, Duration: 50 minutes
Frequency 15Hz
Amplitude 0.2mm/0.0079inch
Solution flow rate (GPM/m3/h) 1.32 0.3 Amplitude to thickness ratio (%) 31
Chilled water inlet temperature (oF/oC) 59.9 15.5 Mass transfer enhancement (%) 4.5
Cooling water inlet temperature(oF/oC) 84.2 29 Heat transfer enhancement (%) 4
Evaporating temperature(oF/oC) 53.78 12.1 Cooling enhancement (%) 7
Hot water temperature(oF/oC) 203 95 Mass transfer standard deviation (%) 2
Absorber pressure (psi/kPa) 0.3074 2.12 Heat transfer standard deviation (%) 3
1/1/2015, Duration: 70 minutes
Frequency 20Hz
Amplitude 0.2mm/0.0079inch
Solution flow rate (GPM/m3/h) 1.32 0.3 Amplitude to thickness ratio (%) 31
Chilled water inlet temperature (oF/oC) 59 15 Mass transfer enhancement (%) 10.6
Cooling water inlet temperature (oF/oC) 83.84 28.8 Heat transfer enhancement (%) 8.5
Evaporating temperature(oF/oC) 56.3 13.5 Cooling enhancement (%) 10.3
Hot water temperature (oF/oC) 195.08 90.6 Mass transfer standard deviation (%) 2
Absorber pressure(psi/kPa) 0.306 2.11 Heat transfer standard deviation (%) 3.5
12/10/2014, Duration: 50 minutes
Frequency 25Hz
Amplitude 0.2mm/0.0079inch
Solution flow rate (GPM/m3/h) 1.32 0.3 Amplitude to thickness ratio (%) 31
Chilled water inlet temperature (oF/oC) 56.66 13.7 Mass transfer enhancement (%) 34.3
Cooling water inlet temperature (oF/oC) 84.2 29 Heat transfer enhancement (%) 31.7
Evaporating temperature(oF/oC) 53.96 12.2 Cooling enhancement (%) 53.8
Hot water temperature (oF/oC) 196.7 91.5 Mass transfer standard deviation (%) 2
Absorber pressure(psi/kPa) 0.2987 2.06 Heat transfer standard deviation (%) 3
12/21/2014, Duration: 35 minutes
Frequency 30Hz
Amplitude 0.2mm/0.0079inch
Solution flow rate (GPM/m3/h) 1.32 0.3 Amplitude to thickness ratio (%) 74
Chilled water inlet temperature (oF/oC) 60.8 16 Mass transfer enhancement (%) 10.7
Cooling water inlet temperature (oF/oC) 84.7 29.3 Heat transfer enhancement (%) 8.7
Evaporating temperature(oF/oC) 58.1 13 Cooling enhancement (%) 15.7
Hot water temperature (oF/oC) 203.8 95.4 Mass transfer standard deviation (%) 3.4
Absorber pressure (psi/kPa) 0.3103 2.14 Heat transfer standard deviation (%) 5

93
C.4. Detail information of different solution flow rates enhancement (With
2EH additive)
5/7/2015 Duration: 50 minutes
Frequency 25(Hz)
Amplitude 0.2mm/0.0079inch
Solution flow rate (GPM/m3/h) 0.44 0.1 Amplitude to thickness ratio (%) 45
Chilled water inlet temperature (oF/oC) 55.04 12.8 Mass transfer enhancement (%) 7.4
Cooling water inlet temperature (oF/oC) 84.2 29 Heat transfer enhancement (%) 8.7
Evaporating temperature (oF/oC) 50 10 Cooling enhancement (%) 59
Hot water temperature (oF/oC) 209.3 98.5 Mass transfer standard deviation (%) 2
Absorber pressure (psi/kPa) 0.2871 1.98 Heat transfer standard deviation (%) 3
4/2/2015 Duration: 50 minutes
Frequency 25(Hz)
Amplitude 0.2mm/0.0079inch
Solution flow rate (GPM/m3/h) 0.88 0.2 Amplitude to thickness ratio (%) 36
Chilled water inlet temperature (oF/oC) 56.48 13.6 Mass transfer enhancement (%) 28.7
Cooling water inlet temperature (oF/oC) 84.02 28.9 Heat transfer enhancement (%) 34
Evaporating temperature (oF/oC) 51.62 10.9 Cooling enhancement (%) 9.4
Hot water temperature (oF/oC) 205.7 96.5 Mass transfer standard deviation (%) 3
Absorber pressure (psi/kPa) 0.2827 1.95 Heat transfer standard deviation (%) 5
3/17/2015, Duration: 42 minutes
Frequency 25(Hz)
Amplitude 0.2mm/0.0079inch
Solution flow rate (GPM/m3/h) 1.32 0.3 Amplitude to thickness ratio (%) 31
Chilled water inlet temperature (oF/oC) 59.18 15.1 Mass transfer enhancement (%) 21.5
Cooling water inlet temperature (oF/oC) 84.02 28.9 Heat transfer enhancement (%) 17.8
Evaporating temperature (oF/oC) 50.9 10.5 Cooling enhancement (%) 5.3
Hot water temperature (oF/oC) 198.5 92.5 Mass transfer standard deviation (%) 2
Absorber pressure (psi/kPa) 0.2871 1.98 Heat transfer standard deviation (%) 4
5/7/2015, Duration: 60 minutes
Frequency 25(Hz)
Amplitude 0.2mm/0.0079inch
Solution flow rate (GPM/m3/h) 1.76 0.4 Amplitude to thickness ratio (%) 29
Chilled water inlet temperature (oF/oC) 51.8 11 Mass transfer enhancement (%) 16.7
Cooling water inlet temperature (oF/oC) 83.84 28.8 Heat transfer enhancement (%) 19.8
Evaporating temperature (oF/oC) 45.32 7.4 Cooling enhancement (%) 15.2
Hot water temperature (oF/oC) 202.64 94.8 Mass transfer standard deviation (%) 1.8
Absorber pressure (psi/kPa) 0.2755 1.9 Heat transfer standard deviation (%) 4
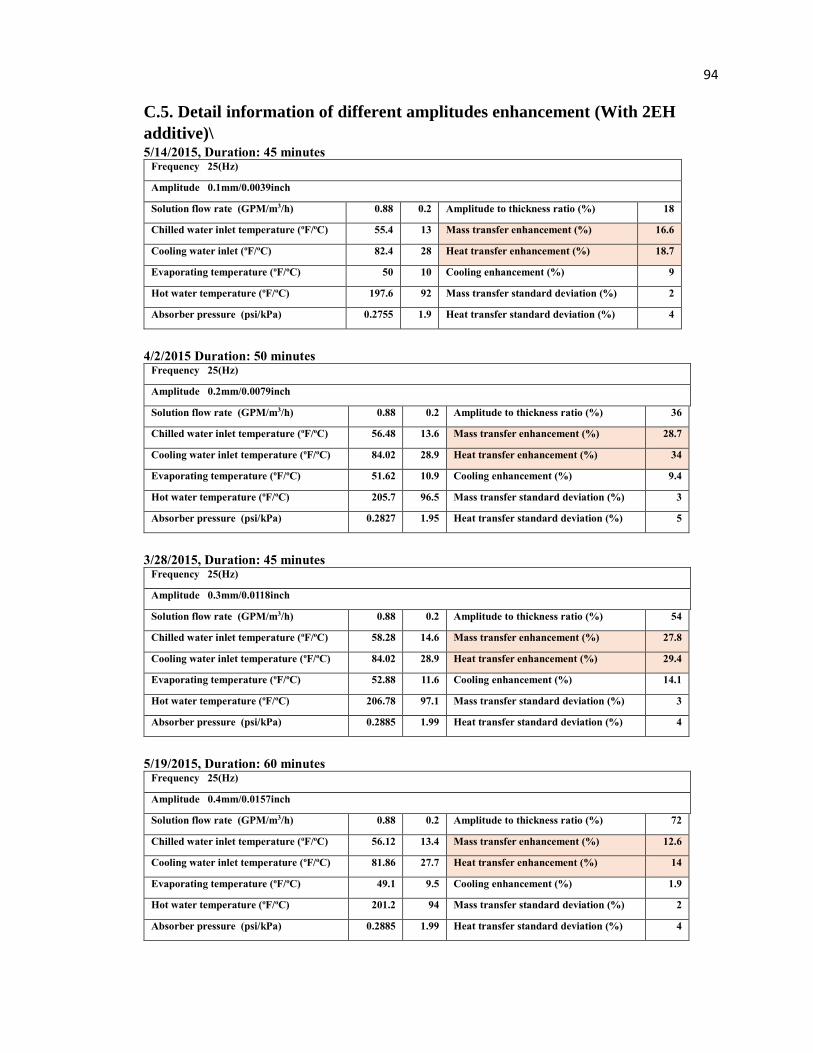
94
C.5. Detail information of different amplitudes enhancement (With 2EH
additive)\ 5/14/2015, Duration: 45 minutes
Frequency 25(Hz)
Amplitude 0.1mm/0.0039inch
Solution flow rate (GPM/m3/h) 0.88 0.2 Amplitude to thickness ratio (%) 18
Chilled water inlet temperature (oF/oC) 55.4 13 Mass transfer enhancement (%) 16.6
Cooling water inlet (oF/oC) 82.4 28 Heat transfer enhancement (%) 18.7
Evaporating temperature (oF/oC) 50 10 Cooling enhancement (%) 9
Hot water temperature (oF/oC) 197.6 92 Mass transfer standard deviation (%) 2
Absorber pressure (psi/kPa) 0.2755 1.9 Heat transfer standard deviation (%) 4
4/2/2015 Duration: 50 minutes
Frequency 25(Hz)
Amplitude 0.2mm/0.0079inch
Solution flow rate (GPM/m3/h) 0.88 0.2 Amplitude to thickness ratio (%) 36
Chilled water inlet temperature (oF/oC) 56.48 13.6 Mass transfer enhancement (%) 28.7
Cooling water inlet temperature (oF/oC) 84.02 28.9 Heat transfer enhancement (%) 34
Evaporating temperature (oF/oC) 51.62 10.9 Cooling enhancement (%) 9.4
Hot water temperature (oF/oC) 205.7 96.5 Mass transfer standard deviation (%) 3
Absorber pressure (psi/kPa) 0.2827 1.95 Heat transfer standard deviation (%) 5
3/28/2015, Duration: 45 minutes
Frequency 25(Hz)
Amplitude 0.3mm/0.0118inch
Solution flow rate (GPM/m3/h) 0.88 0.2 Amplitude to thickness ratio (%) 54
Chilled water inlet temperature (oF/oC) 58.28 14.6 Mass transfer enhancement (%) 27.8
Cooling water inlet temperature (oF/oC) 84.02 28.9 Heat transfer enhancement (%) 29.4
Evaporating temperature (oF/oC) 52.88 11.6 Cooling enhancement (%) 14.1
Hot water temperature (oF/oC) 206.78 97.1 Mass transfer standard deviation (%) 3
Absorber pressure (psi/kPa) 0.2885 1.99 Heat transfer standard deviation (%) 4
5/19/2015, Duration: 60 minutes
Frequency 25(Hz)
Amplitude 0.4mm/0.0157inch
Solution flow rate (GPM/m3/h) 0.88 0.2 Amplitude to thickness ratio (%) 72
Chilled water inlet temperature (oF/oC) 56.12 13.4 Mass transfer enhancement (%) 12.6
Cooling water inlet temperature (oF/oC) 81.86 27.7 Heat transfer enhancement (%) 14
Evaporating temperature (oF/oC) 49.1 9.5 Cooling enhancement (%) 1.9
Hot water temperature (oF/oC) 201.2 94 Mass transfer standard deviation (%) 2
Absorber pressure (psi/kPa) 0.2885 1.99 Heat transfer standard deviation (%) 4
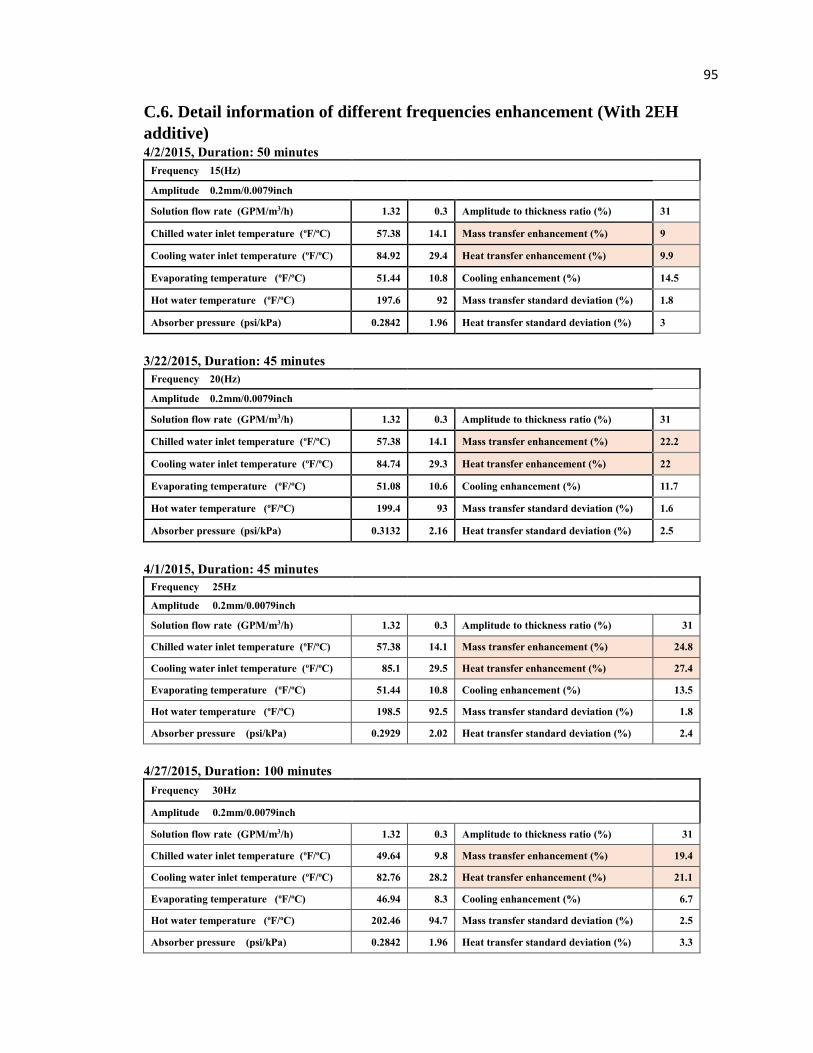
95
C.6. Detail information of different frequencies enhancement (With 2EH
additive) 4/2/2015, Duration: 50 minutes
Frequency 15(Hz)
Amplitude 0.2mm/0.0079inch
Solution flow rate (GPM/m3/h) 1.32 0.3 Amplitude to thickness ratio (%) 31
Chilled water inlet temperature (oF/oC) 57.38 14.1 Mass transfer enhancement (%) 9
Cooling water inlet temperature (oF/oC) 84.92 29.4 Heat transfer enhancement (%) 9.9
Evaporating temperature (oF/oC) 51.44 10.8 Cooling enhancement (%) 14.5
Hot water temperature (oF/oC) 197.6 92 Mass transfer standard deviation (%) 1.8
Absorber pressure (psi/kPa) 0.2842 1.96 Heat transfer standard deviation (%) 3
3/22/2015, Duration: 45 minutes
Frequency 20(Hz)
Amplitude 0.2mm/0.0079inch
Solution flow rate (GPM/m3/h) 1.32 0.3 Amplitude to thickness ratio (%) 31
Chilled water inlet temperature (oF/oC) 57.38 14.1 Mass transfer enhancement (%) 22.2
Cooling water inlet temperature (oF/oC) 84.74 29.3 Heat transfer enhancement (%) 22
Evaporating temperature (oF/oC) 51.08 10.6 Cooling enhancement (%) 11.7
Hot water temperature (oF/oC) 199.4 93 Mass transfer standard deviation (%) 1.6
Absorber pressure (psi/kPa) 0.3132 2.16 Heat transfer standard deviation (%) 2.5
4/1/2015, Duration: 45 minutes
Frequency 25Hz
Amplitude 0.2mm/0.0079inch
Solution flow rate (GPM/m3/h) 1.32 0.3 Amplitude to thickness ratio (%) 31
Chilled water inlet temperature (oF/oC) 57.38 14.1 Mass transfer enhancement (%) 24.8
Cooling water inlet temperature (oF/oC) 85.1 29.5 Heat transfer enhancement (%) 27.4
Evaporating temperature (oF/oC) 51.44 10.8 Cooling enhancement (%) 13.5
Hot water temperature (oF/oC) 198.5 92.5 Mass transfer standard deviation (%) 1.8
Absorber pressure (psi/kPa) 0.2929 2.02 Heat transfer standard deviation (%) 2.4
4/27/2015, Duration: 100 minutes
Frequency 30Hz
Amplitude 0.2mm/0.0079inch
Solution flow rate (GPM/m3/h) 1.32 0.3 Amplitude to thickness ratio (%) 31
Chilled water inlet temperature (oF/oC) 49.64 9.8 Mass transfer enhancement (%) 19.4
Cooling water inlet temperature (oF/oC) 82.76 28.2 Heat transfer enhancement (%) 21.1
Evaporating temperature (oF/oC) 46.94 8.3 Cooling enhancement (%) 6.7
Hot water temperature (oF/oC) 202.46 94.7 Mass transfer standard deviation (%) 2.5
Absorber pressure (psi/kPa) 0.2842 1.96 Heat transfer standard deviation (%) 3.3

96