the experimental study of the bi–sn, bi–zn and bi–sn… experimental study of the bi–sn,...
TRANSCRIPT

Computer Coupling of Phase Diagrams and Thermochemistry 31 (2007) 468–478www.elsevier.com/locate/calphad
The experimental study of the Bi–Sn, Bi–Zn and Bi–Sn–Zn systems
M.H. Bragaa,∗, J. Vizdalb,c, A. Kroupac, J. Ferreirad, D. Soarese, L.F. Malheiros f
a GMM-IMAT, Department of Physics, FEUP, R. Dr. Roberto Frias s/n, 4200-465 Porto, Portugalb Institute of Mat. Sci. and Eng., Faculty of Mechanical Engineering, Brno University of Technology, Technicka 2896/2, 616 69 Brno, Czech Republic
c Institute of Physics of Materials AS CR. Zizkova 22, 616 62 Brno, Czech Republicd INETI Laboratory, R. da Amieira – P.O. Box 1089, 4466-956 S. Mamede de Infesta, Portugal
e Department of Mechanical Engineering, School of Engineering of UM, Campus de Azurem, 4800-058 Guimaraes, Portugalf GMM-IMAT, Department of Metallurgical and Materials Engineering, FEUP, R. Dr. Roberto Frias s/n, 4200-465 Porto, Portugal
Received 19 April 2006; received in revised form 10 April 2007; accepted 12 April 2007Available online 22 May 2007
Abstract
The binary Bi–Sn was studied by means of SEM (Scanning Electron Microscopy)/EDS (Energy-Dispersive solid state Spectrometry), DTA(Differential Thermal Analysis)/DSC (Differential Scanning Calorimetry) and RT-XRD (Room Temperature X-Ray Diffraction) in order to clarifydiscrepancies concerning the Bi reported solubility in (Sn). It was found that (Sn) dissolves approximately 10 wt% of Bi at the eutectic temperature.
The experimental effort for the Bi–Zn system was limited to the investigation of the discrepancies concerning the solubility limit of Zn in (Bi)and the solubility of Bi in (Zn). Results indicate that the solubility of both elements in the respective solid solution is approximately 0.3 wt% at200 ◦C.
Three different features were studied within the Bi–Sn–Zn system. Although there are enough data to establish the liquid miscibility gapoccurring in the phase diagram of binary Bi–Zn, no data could be found for the ternary. Samples belonging to the isopleths with w(Bi) ∼ 10%and w(Sn) ∼ 5%, 13% and 19% were measured by DTA/DSC. The aim was to characterize the miscibility gap in the liquid phase. Samplesbelonging to the isopleths with w(Sn) ∼ 40%, 58%, 77/81% and w(Zn) ∼ 12% were also measured by DTA/DSC to complement the study ofBi–Sn–Zn. Solubilities in the solid terminal solutions were determined by SEM/EDS. Samples were also analyzed by RT-XRD and HT-XRD(High Temperature X-Ray Diffraction) confirming the DTA/DSC results for solid state phase equilibria.c© 2007 Elsevier Ltd. All rights reserved.
Keywords: Bi–Sn–Zn; Bi–Sn; DTA/DSC; SEM/EDS; (RT/HT)-XRD
1. Introduction
Health problems (especially neurological and birth malfor-mations) may arise from an excess of lead in human bodies.The excess of lead is due to water contamination. Hence, leadwas added to the list of apprehensions with the environment [1].
The objective of COST 531 action “Lead-free SolderMaterials” [2] (European Cooperation in the field of Scientificand Technical Research) is the study of systems that maybe used as lead-free solders. The selection of these systemsis based on technical and health considerations. The crucialtechnical properties to be analyzed should be: melting point,wettability, surface tension, viscosity of the liquid alloys at
∗ Corresponding author.E-mail address: [email protected] (M.H. Braga).
0364-5916/$ - see front matter c© 2007 Elsevier Ltd. All rights reserved.doi:10.1016/j.calphad.2007.04.004
different temperatures, oxidation behavior, thermomechanicalfatigue, etc.
The evaluation of experimental phase diagrams, measure-ment of the thermodynamic properties and consequent opti-mization of the corresponding phase diagrams (using the CAL-PHAD method) are some of the aims of the COST 531 action.The work presented here is a part of this effort.
Bi–Sn–Zn is one of the important systems studied in scopeof the above mentioned program. For this system there wereno data concerning the liquidus surface in the miscibility gapregion (corresponding to the phase boundary Liquid/L1 + L2).A work from Muzaffar [3], concluded in 1923, includes onlytemperature data for the surface corresponding to the phaseboundary Liquid + L1/Liquid + (Zn).
The solvus surfaces for (Bi) and (Sn) were also uncertain.These doubts concern mainly the Sn-rich region within the

M.H. Braga et al. / Computer Coupling of Phase Diagrams and Thermochemistry 31 (2007) 468–478 469
Bi–Sn binary system. Nagasaki and Fujita [4] experimentallydefined a (Sn) solvus curve that was not in good agreementwith that from Oelsen and Golucke [5]. Experimental resultsfrom Ohtani and Ishida [6] were also in contradiction with thosefrom [4]. Nevertheless, Ohtani and Ishida [6] (contradictingtheir own experimental results) and Lee et al. [7] used onlythe experimental data from Nagasaki and Fujita [4] in theirthermodynamic assessment.
Concerning Bi–Zn, there was a significant discrepancybetween the (Bi) solvus estimated by Massalski [8] and thatcalculated by Malakhov [9] (few wt% of Zn). Thus, targetedexperimental alloys were prepared to determine the solubilityof Zn in (Bi).
With the aim of clarifying the above indicated aspectsof the binaries and ternary, almost all of the samples werestudied by SEM/EDS/WDS (Wavelength-Dispersive crystalSpectrometer), RT-XRD/HT-XRD and by DTA/DSC.
2. Experimental
The Bi–Sn and Bi–Sn–Zn systems were objects of twodifferent studies. One more devoted to phase transitionsas well as to temperature measurements and the other tothe equilibrium study. Hence, the experimental details weredifferent according to the objective of the study and thereforewill be presented in two different sections.
2.1. Phase transitions study of the Bi–Sn system
Eight samples of ∼20 mm diameter, ∼3 mm height andweighing ∼2 g were prepared by mixing pure Bi (>99.8%) andSn (>99.5%). The samples were then put in alumina cruciblesand melted in a resistance furnace under an argon atmosphere.The nominal compositions of the samples were Bi(1 − x)Snx(x = 12.5, 23.5, 36.5, 74.5, 80.1, 84.9, 89.9 and 95.6,wt%). These were confirmed by X-ray Fluorescence (XRF)and Atomic Absorption Spectroscopy (AAS). All samples werehomogenized at 120 ◦C for 60 min and slowly cooled down tothe room temperature at a rate less than 2 ◦C/min.
Samples were studied by Light Optical Microscopy (LOM)and by SEM in a JEOL JSM 6301 F. The SEM is equipped withan INCA Energy 350 EDS analyzer from Oxford Instruments.A backscattered beam with 15 keV is employed. Internalstandards are used for the EDS analysis. The experimentaluncertainties of the chemical analysis done by EDS are: Bi±1.2 wt% and Sn ±0.9 wt%.
The Panalytical X’Pert Pro MPD was used for RT-XRD experiments with bulk samples. CuKα or primarymonochromated CuKα1 radiations were used to collect patternsfrom 5◦ to 120◦ (2θ ) with steps of 0.01◦ and counting time of10 s. The powder HT-XRD was not performed due to problemsrelated with the samples’ grinding (the apparatus used onlyallows powder HT-XRD).
The DTA/DSC measurements were performed on aSETARAM Labsys TG/DTA/DSC in order to establish thetransition temperatures. Alumina crucibles were used andmeasurements were performed under flowing argon atmosphere
(approximately 40 cm3 min−1). Alumina also served as thereference material. Samples weighing between 0.1 and 0.2 gwere measured at the heating rates of (in ◦C/min) 10.0, 5.0 and2.0–2.5. Transition temperatures were found for “0 ◦C/min”.The temperatures of the invariant phase reactions were takenfrom the extrapolated temperatures on the onset of heating.The liquidus curve temperatures were taken from the peaks onheating.
The global composition and homogeneity of the sampleswas checked by SEM/EDS, before and after the DTA/DSCexperiments.
2.2. Equilibrium study of the Bi–Sn system
Five alloys have been prepared for the equilibrium study.The samples were prepared by mixing pure Bi (>99.9%) andSn (>99.9%). The nominal compositions of the samples areBi(1 − x)Snx (x = 50, 80, 85, 90 and 95, wt%). Samples wereanalyzed in a SEM from JEOL JSM 6460. The EDS is fromOxford Instruments and it is equipped with an INCA Energyand Wave. The studies were performed in the back-scatteredelectron mode with 20 keV. Four of the five samples werealso studied by DTA/DSC in a Netzsch DTA/DSC 404. For thelatter, samples weighing between 0.1 and 0.2 g were introducedinto graphite crucibles. Silver was used as a reference material.The measurements were carried out under flowing argonatmosphere (approximately 40 cm3 min−1).
2.3. Equilibrium study of the Bi–Zn system
The experimental effort was limited to the investigation ofthe discrepancies concerning the solubility limit of Zn in (Bi)between the theoretical and experimental assessments.
Two alloys were prepared, one with approximately 0.3wt% Zn and another one with 76.2 wt% Zn. The low Zncontent alloy was expected to lie in the single-phase region ofthe phase diagram, according to the experimental assessment.Nevertheless, according to calculations, it was expected to liein the two-phase area.
The experimental alloys were melted under an Argonatmosphere in an ERSCEM PV 8920 spill furnace. Samplesof approximately 40 g were injected into a copper mould after20–30 s of stirring.
The low Zn content (approximately 0.3 wt%) alloy wasannealed for 336 h at a temperature of 245 ◦C, just belowthe eutectic temperature of 254.5 ◦C. After annealing, thesample was quenched in water and observed by SEM/EDS. Themorphology of the sample did not allow the measurement of thecomposition of the Zn-rich phase. A second alloy was preparedwith composition of 23.8 wt% Bi and 76.2 wt% Zn and wastherefore cast and annealed at 200 ◦C for 864 h. This samplewas analyzed by SEM/WDS using pure Bi and Zn as standards.
2.4. Phase transitions study of the Bi–Sn–Zn system
Vertical sections for w(Bi) ∼ 10%, w(Zn) ∼ 12%, andw(Sn) ∼ 5%, 13%, 19%, 40%, 59% and 79% were chosen for

470 M.H. Braga et al. / Computer Coupling of Phase Diagrams and Thermochemistry 31 (2007) 468–478
this study. The corresponding 29 samples were prepared andannealed like those in Section 2.1. The samples with w(Sn) ∼
77/81% were re-annealed for more than 180 min at 120 ◦C, andcooled down at a rate of 0.5 ◦C/min or quenched into waterfrom 120 ◦C.
Samples were studied by LOM and by SEM/EDS in thesame conditions as those mentioned in Section 2.1. Theexperimental uncertainties for the chemical analysis obtainedby EDS are: Bi ±1.2 wt%, Sn ±0.9 wt% and Zn ±1.1 wt%.
Bulk RT-XRD measurements were performed to identifythe present phases. For some samples, powder HT-XRDmeasurements were also performed, under a vacuum of 10−5
mbar or an argon atmosphere. The furnace used is an Anton ParrChamber applied to the Panalytical X’Pert Pro MPD (details forthe XRD data collection are given in Section 2.1).
DTA/DSC measurements were performed on two heat fluxinstruments with the possibility of determining the latentheat: a TA Instruments SDT 2960 and a SETARAM LabsysTG/DTA/DSC (mentioned in Section 2.1). Alumina crucibleswere used and the measurements were performed under flowingargon atmosphere. A graphite plate was sometimes used at thebottom of the crucible in order to improve the removal of theanalyzed sample (especially in the case of those samples whosecomposition fell over the miscibility gap). Alumina (with asimilar shape and weight as the measured samples) was used asreference. The samples were polished and cleaned just beforebeing measured in order to improve thermal contact and toavoid spurious or shifted transition peaks due to oxidation. Theheating rates mainly used were 20, 10, 5, 2.5 and/or 2.0 ◦C/min.Unfortunately, the lower heating rates did not allow thedetection of transition temperatures (for example, in the caseof liquidus surface of the miscibility gap). Consequently, it wasimpossible to find the transition temperatures at “0 ◦C/min” bya linear regression. A calibration factor: C = b0 +b∗
1T +b∗
2 R+
b∗
3 R2 (T — temperature in ◦C, R – heating rate in ◦C/min) wasevaluated after performing ten calibrations with five differentelements (including pure Sn and Zn). Different heating rates(from 2 to 20 ◦C/min) were also used for determining thecoefficients b0, b1, b2 and b3. The accuracy of all of the giventemperatures is ±1 ◦C. The temperatures of the invariant phasereactions were taken from the extrapolated onset temperatureson heating. The liquidus surface temperatures were taken fromthe peaks on heating.
After the DTA/DSC measurements, some Bi–Sn–Znsamples were also investigated by SEM/EDS in order to checktheir compositions.
2.5. Equilibrium study of the Bi–Sn–Zn system
A second set of experiments were carried out in thescope of this study with the aim of reaching states close tothe thermodynamic equilibrium and confirming the previousresults. Seven samples with nominal compositions (A –Bi35Sn35Zn30, B – Bi20Sn50Zn30, C – Bi10Sn70Zn20, D –Bi18.5Sn45Zn36.5, E – Bi10Sn70Zn20, F – Bi60Sn30Zn10, G– Bi25Sn37.5Zn37.4 and H – Bi25Sn47.6Zn27.4, wt%) wereprepared from pure Bi, Sn and Zn (Bi, Sn, Zn > 99.9%, all
Table 1Bi–Sn experimental data from DTA/DSC
w(Sn) (%) Transition temperatures (◦C)
12.5 138.9a 230.1c
23.5 138.9a 200.9c
36.5 139.0a 160.5c
74.5 138.7a 195.7c
80.1 138.2a 202.8c
84.8 138.4a 210.5c
89.9 138.0a 219.3c
95.6 188.9b 227.0c
Final composition was found after AAS and/or XRF and SEM/EDS.a Eutectic temperatures.b Solidus temperatures.c Liquidus temperatures.
supplied by Alfa Aesar). The homogeneity of all samples waschecked by SEM/EDS (in a JEOL JSM 6460) in the back-scattered electron mode. The microstructure of the sampleswas, in all cases, found to be reasonably homogeneous in thewhole sample volume. Slices of the samples were annealed attwo selected temperatures during different intervals of time,before being quenched into cold water. The first set of alloys(A, B and C) was annealed at 100 ◦C. For a more detailed studyand verification of the previously obtained results, a secondset of alloys (D, E, F, G and H) was prepared. The annealingtemperature for the second set of samples was 120 ◦C.
SEM/EDS analysis was used to identify the coexistingphases and to measure their compositions (both overall andphase compositions).
Some of the annealed samples were also studied byDTA/DSC (in a Netzsch DTA/DSC 404). The studied samplescorrespond to compositions that lay in phase regions wherethe phase equilibria were uncertain. The latter measurementswere conducted on samples weighing approximately 0.3–0.4 g,which had been sealed under vacuum in quartz crucibles. Goldwas used as the reference material. A heating rate of 2.0 ◦C/minwas employed both for calibration and measurement of theprepared samples. The temperatures of the invariant phasereactions were usually taken from the extrapolated onset onheating. The accuracy of all of the given temperatures is ±2 ◦C.
3. Results and discussion
3.1. Bi–Sn system
The DSC/DTA results obtained for the first eight samplescan be seen in Table 1. Their comparisons can be made bystudying Fig. 1. The invariant temperature measured for thebinary eutectic L ↔ (Bi) + (Sn) is 138.6 ± 0.6 ◦C, which is inagreement with that proposed in [4,6].
For the equilibrium study, the results of five samples studiedare summarized in Table 2, along with the experimentaluncertainties associated with the EDS work. It has beenfound that there are no major differences between equilibratedsamples annealed at 190, 430, 600, 770, 890 and 950 h(Table 2). Therefore, an annealing time of around 400 h is
M.H. Braga et al. / Computer Coupling of Phase Diagrams and Thermochemistry 31 (2007) 468–478 471
Table 2Bi–Sn experimental data from DTA/DSC and SEM/EDS for samples in equilibrium
Sample BS 1 BS 2 BS 3 BS 4 BS 5
w(Sn) 50 80 85 90 95Annealing at 130 ◦CTime (h) kin. st.a 770 600 890 770SEM/EDS results – composition measurements (wt%)w(Sn) 49.4 ± 0.9 78.4 ± 0.5 83.8 ± 1.1 88.0 ± 0.4 93.2 ± 0.2Sn in (Bi) 0.5 ± 0.2 N/A N/A N/A N/ABi in (Sn) 5.8 ± 0.1 N/A N/A N/A 5.4 ± 0.3DSC results (◦C)Invariant reactions b 138 138 – –Solidus b – – 186 201Liquidus b 205 222 220 229
a Kinetic study: three samples were annealed for different times (190, 430 and 950 h). Bi content of BCT A5 (Sn) analyzed by SEM + EDS (5, 6.2 and 5.8 wt%).b Not measured.
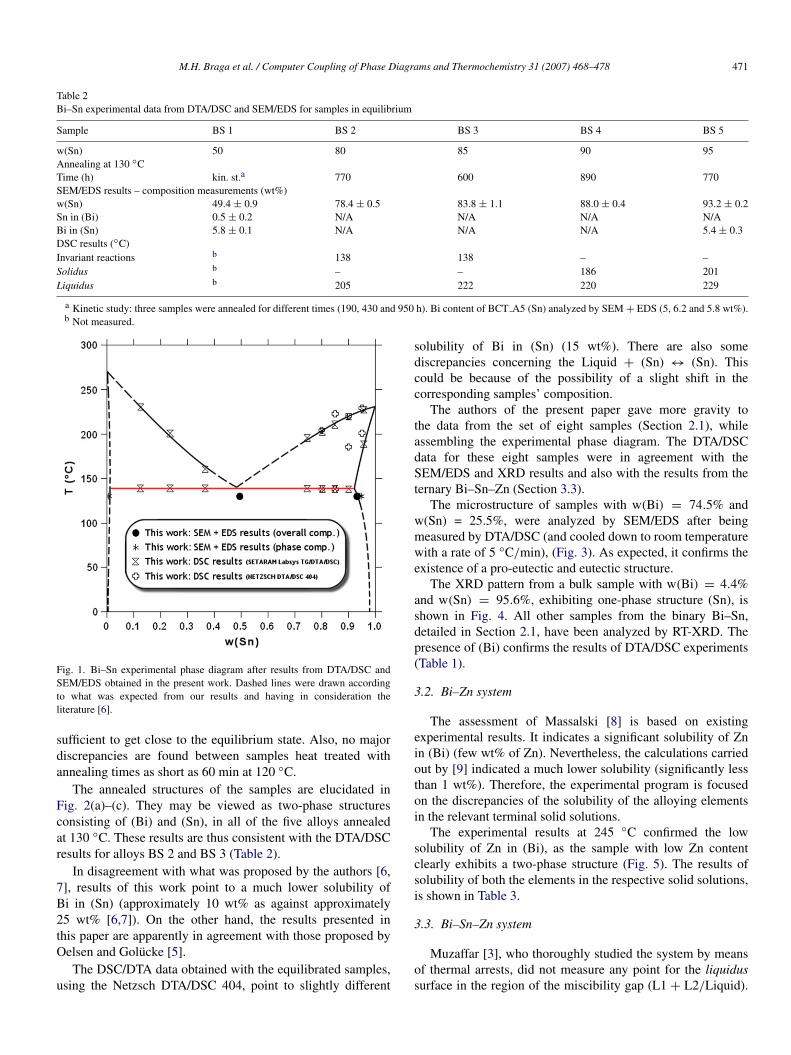
Fig. 1. Bi–Sn experimental phase diagram after results from DTA/DSC andSEM/EDS obtained in the present work. Dashed lines were drawn accordingto what was expected from our results and having in consideration theliterature [6].
sufficient to get close to the equilibrium state. Also, no majordiscrepancies are found between samples heat treated withannealing times as short as 60 min at 120 ◦C.
The annealed structures of the samples are elucidated inFig. 2(a)–(c). They may be viewed as two-phase structuresconsisting of (Bi) and (Sn), in all of the five alloys annealedat 130 ◦C. These results are thus consistent with the DTA/DSCresults for alloys BS 2 and BS 3 (Table 2).
In disagreement with what was proposed by the authors [6,7], results of this work point to a much lower solubility ofBi in (Sn) (approximately 10 wt% as against approximately25 wt% [6,7]). On the other hand, the results presented inthis paper are apparently in agreement with those proposed byOelsen and Golucke [5].
The DSC/DTA data obtained with the equilibrated samples,using the Netzsch DTA/DSC 404, point to slightly different
solubility of Bi in (Sn) (15 wt%). There are also somediscrepancies concerning the Liquid + (Sn) ↔ (Sn). Thiscould be because of the possibility of a slight shift in thecorresponding samples’ composition.
The authors of the present paper gave more gravity tothe data from the set of eight samples (Section 2.1), whileassembling the experimental phase diagram. The DTA/DSCdata for these eight samples were in agreement with theSEM/EDS and XRD results and also with the results from theternary Bi–Sn–Zn (Section 3.3).
The microstructure of samples with w(Bi) = 74.5% andw(Sn) = 25.5%, were analyzed by SEM/EDS after beingmeasured by DTA/DSC (and cooled down to room temperaturewith a rate of 5 ◦C/min), (Fig. 3). As expected, it confirms theexistence of a pro-eutectic and eutectic structure.
The XRD pattern from a bulk sample with w(Bi) = 4.4%and w(Sn) = 95.6%, exhibiting one-phase structure (Sn), isshown in Fig. 4. All other samples from the binary Bi–Sn,detailed in Section 2.1, have been analyzed by RT-XRD. Thepresence of (Bi) confirms the results of DTA/DSC experiments(Table 1).
3.2. Bi–Zn system
The assessment of Massalski [8] is based on existingexperimental results. It indicates a significant solubility of Znin (Bi) (few wt% of Zn). Nevertheless, the calculations carriedout by [9] indicated a much lower solubility (significantly lessthan 1 wt%). Therefore, the experimental program is focusedon the discrepancies of the solubility of the alloying elementsin the relevant terminal solid solutions.
The experimental results at 245 ◦C confirmed the lowsolubility of Zn in (Bi), as the sample with low Zn contentclearly exhibits a two-phase structure (Fig. 5). The results ofsolubility of both the elements in the respective solid solutions,is shown in Table 3.
3.3. Bi–Sn–Zn system
Muzaffar [3], who thoroughly studied the system by meansof thermal arrests, did not measure any point for the liquidussurface in the region of the miscibility gap (L1 + L2/Liquid).

472 M.H. Braga et al. / Computer Coupling of Phase Diagrams and Thermochemistry 31 (2007) 468–478
Fig. 2. Microstructure (2000×) of the annealed samples – mixture of light (Bi) and dark (Sn) phases: (a) “BS 1”; (b) “BS 3” and (c) “BS 5”.
Fig. 3. Microstructure (500×) of the sample with w(Bi) = 74.5% and w(Sn) =
25.5%, after the DTA/DSC experiment with a cooling rate of 5 ◦C/min: (Bi) –light grey, (Sn) – medium grey.
Table 3Composition of the phases present in the Bi–Zn alloy with w(Zn) = 76.2%after the annealing at 200 ◦C
Phase Composition of phases (wt%)
(Bi) Bi 99.7 ± 0.2Zn 0.3 ± 0.1
(Zn) Bi 0.3 ± 0.2Zn 99.7 ± 0.2
In this work, we measured the miscibility gap in the liquidphase by using DTA/DSC at heating rates of 10–20 ◦C/min.
Fig. 4. The XRD pattern at room temperature for a bulk sample withcomposition: w(Bi) = 4.4% and w(Sn) = 95.6%. This sample was the only one,studied in the Bi–Sn system, which was monophasic (Sn), at room temperature.
Fig. 5. Microstructure (1000×) after 336 h of annealing (overall composition:w(Zn) ∼ 0.3 and w(Bi) ∼ 99.7%). The matrix comprises a solid solution of Znin (Bi) phase and dark particles formed by a solid solution of Bi in (Zn).

M.H. Braga et al. / Computer Coupling of Phase Diagrams and Thermochemistry 31 (2007) 468–478 473
Table 4Bi–Sn–Zn experimental data from DTA/DSC and SEM/EDS
Results for Bi–Sn–Zn from DTA/DSCw(Bi) w(Sn) (%) w(Zn) Transition temperatures (◦C)
10.0 4.1 85.9 133.7a 182.9 394.3 402.5 502.620.1 5.0 74.9 133.1a 200.6 394.4 406.1 518.230.4 5.0 64.6 134.4a 217.0 398.7 410.3 524.832.8 5.1 62.1 133.7a 223.3 405.5 407.5 528.143.8 4.7 51.5 133.6a 229.4 407.3 413.2 519.853.3 4.9 41.8 134.4a 230.7 407.1 414.4 509.555.4 5.5 39.1 134.2a 236.4 409.1 414.0 510.968.5 5.7 25.8 133.4a 232.9 – 412.1 460.3
31.7 14.3 54.0 133.5a 186.0 399.9 401.9 463.055.6 13.7 30.7 134.2a 212.6 – 403.056.7 12.6 30.7 133.9a 217.9 – 404.374.0 11.9 14.1 133.9a 223.0 360.3
11.7 18.0 70.3 134.3a 153.7 384.5 393.7 439.426.5 18.2 55.3 135.1a 138.0 390.7 399.2 443.928.0 17.8 54.2 133.5a 148.0 394.6 399.0 447.037.9 19.8 42.3 134.4a 171.4 395.4 404.951.1 21.4 27.5 134.6a 177.6 386.755.0 28.9 16.1 134.8a 170.4 343.7
10.1 40.1 49.8 134.0a 182.6 367.723.7 38.5 37.8 135.1a 161.4 367.047.2 40.4 12.4 134.1a 137.7 295.4
30.6 45.8 23.6 133.4a 143.2 341.737.2 44.1 18.7 133.5a 147.1 344.9
10.1 57.8 32.1 134.0a 187.2 330.018.2 59.5 22.3 134.2a 181.5 299.529.3 58.5 12.2 134.8a 165.6 254.7
4.7 76.5 18.8 – 168.8 193.3 282.29.2 81.0 9.8 131.0 188.2 231.59.6 81.0 9.4 131.7 182.6 230.1
Average compositions for the solid phases of Bi–Sn–Zn from SEM/EDS (calculated from 29 samples) (for T < 120 ◦C)
Phase Composition of phases (wt%)w(Bi)av. ± 1.2% w(Sn)av. ± 0.9% w(Zn)av. ± 1.1%
(Bi) 95.5 1.9 2.6(Sn) 4.4 93.3 2.3(Zn) 0.2 0.3 99.5
Final composition was found after AAS and/or XRF and SEM/EDS.a Eutectic temperatures.
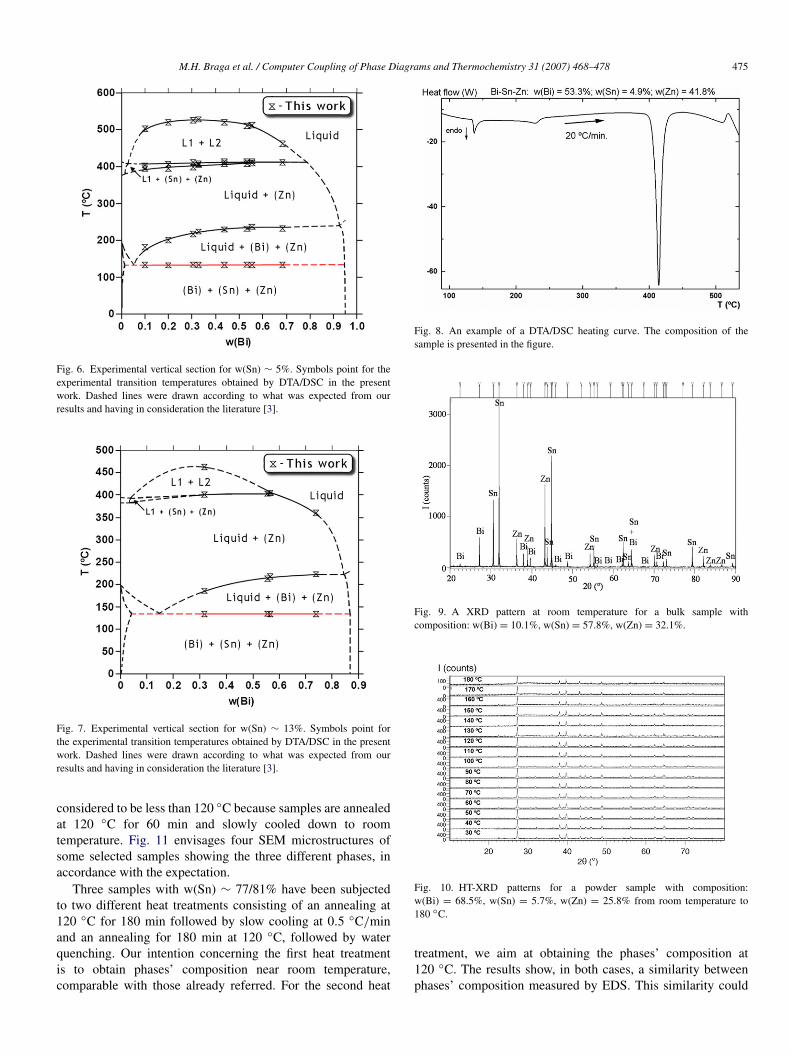
The results, listed in Table 4, are plotted in Figs. 6 and 7. Insome cases, the cooling curve is helpful in identifying the peakcorresponding to the liquidus temperature. It is difficult to findliquidus surface’ peaks for samples belonging to the verticalsection w(Sn) ∼ 5%, with w(Bi) ∼ 20% and 70%; whichmay be due to the spinodal effect. The liquidus temperaturesfor these two samples are shown in Table 4 but it has to betaken into account that the experimental uncertainty can behigher for these two samples than for the rest. An example ofa DTA/DSC curve obtained for a sample with w(Bi) = 53.3%,w(Sn) = 4.9% and w(Zn) = 41.8% is depicted in Fig. 8.
DTA/DSC results from equilibrated samples are inagreement with the previous ones (Table 5).
The invariant temperature measured for the ternary eutecticL ↔ (Bi) + (Sn) + (Zn) is 134.1 ◦C ± 1.0 ◦C which is 4.2 ◦Chigher than that proposed in [3].
All samples in Table 4 have been analyzed by bulk XRD atroom temperature after being annealed for 60 min at 120 ◦Cand slowly cooled down to room temperature. All peaks weresearched/matched using the ICDD PDF-2 2003 database [10–12]. The results show that all samples are homogeneous andthat belong to the three-phase region (Bi) + (Sn) + (Zn) (seeFig. 9). Despite the fact that XRD results are in agreement withwhat was expected from the phase diagrams, the search/matchfor (Sn) indicated that its reflections are slightly shifted withrespect to their position for pure Sn. This maybe due to a

474 M.H. Braga et al. / Computer Coupling of Phase Diagrams and Thermochemistry 31 (2007) 468–478
Table 5Experimental results obtained from Bi–Sn–Zn alloys, annealed at 100 ◦C
Sample A B C
Composition (wt%) Bi35–Sn35–Zn Bi20–Sn50–Zn Bi10–Sn70–ZnAnnealing at 100 ◦CTime (h) 744 980 980SEM/EDS results – composition measurements (wt%)Overall Bi 35.5 ± 0.7 22.4 ± 0.4 11.1 ± 0.3
Sn 33.6 ± 0.9 54.8 ± 0.5 71.9 ± 0.5Zn 30.9 ± 0.9 22.8 ± 0.6 17.0 ± 0.6
(Bi) Bi 95.9 ± 0.8 96.6 ± 0.7 94.4 ± 1.3Sn 0.4a 0.7 ± 0.4 3.0 ± 1.0Zn 3.7 ± 0.6 2.7 ± 0.7 2.6 ± 1.0
(Sn) Bi 3.6 ± 0.9 4.3 ± 0.3 3.9 ± 0.4Sn 93.3 ± 1.0 94.0 ± 0.6 94.6 ± 0.4Zn 3.1 ± 1.0 1.7 ± 0.5 1.5 ± 0.3
(Zn) Bi 0.7 ± 0.2 0.4a 0.4a
Sn 0.7 ± 0.3 0.5 ± 0.2 1.5 ± 0.5Zn 98.6 ± 0.3 99.5 ± 0.2 98.2 ± 0.7
Sample D Eb Fb G H
Comp. (wt%) Bi18.5–Sn45–Zn Bi10–Sn70–Zn Bi60–Sn30–Zn Bi25–Sn37.6–Zn Bi25–Sn47.6–ZnAnnealing at 120 ◦CTime (h) 1175 1175 1100 1175 1100SEM/EDS/WDS results – composition measurements (wt%)Overall Bi 19.6 ± 0.5 14.0 ±0.5 61.2 ± 1.1 30.6 ± 1.2 27.3± 1.6
Sn 48.2 ± 0.7 68.1 ± 1.0 33.9 ± 1.4 40.8 ± 1.1 52.7 ± 1.3Zn 32.2 ± 0.9 17.9 ± 1.0 4.9 ± 0.5 28.6 ± 1.4 20.0 ± 1.7
(Bi) Bi 97.7 ± 0.7 99.2 ± 0.2 97.6 ± 0.5 99.2± 0.2Sn 0.6 ± 0.2 N/A 0.4 ± 0.2 0.6 ± 0.2 0.3 ± 0.2Zn 1.7 ±0.5 0.4 ± 0.2 1.8 ± 0.5 0.5 ± 0.3
(Sn) Bi 4.8 ± 0.6 4.4 ± 0.3Sn N/A 93.5 ± 0.8 94.8 ± 0.6 N/A N/AZn 1.7 ± 0.7 0.8 ± 0.6
(Zn) Bi 0.1c 0.0 0.0 0.4 ± 0.5 0.4 ± 0.4Sn 0.6 ± 0.3 0.3 ± 0.2 0.3 ± 0.1 0.4 ± 0.3 0.5 ± 0.1Zn 99.3 ± 0.3 99.7 ± 0.2 99.7 ± 0.1 99.2 ± 0.7 99.1 ± 0.4
DTA/DSC results (◦C)
Invariant 135 134 136 136 135Liquidus 364 297 300 376 340Others 174 193 168 160 168
a These values are not reliable because of the accuracy limitations of EDS and/or very small size of (Bi) or (Sn) particles in the structure.b SEM/WDS was used for the analysis of selected phases: for the “E” sample (Sn) and (Zn), and for the “F” sample (Bi) and (Sn) phases were measured (pure Bi,
Sn and Zn standards were used).c The values are not reliable because of the accuracy limitations of EDS and/or very small size of (Bi) or (Sn) particles in the structure. N/A – The values of phase
compositions could not be reliably measured because of formation of a mixture of tiny (Bi) particles in (Sn) matrix (see Fig. 11).
distortion of the cell by the partial substitution of Sn by Zn andBi. We could not detect a similar effect for (Bi); this is probablybecause the solubility of Sn in (Bi) is significantly smaller thanthe solubility of Bi in (Sn). In addition, the covalent radius ofBi (0.154 nm) [13] is slightly bigger than that of Sn (0.146nm) [13] possibly increasing this effect.
HT-XRD measurements were performed from 30 to 180 ◦Cwith temperature increments of 10 ◦C. The HT-XRD diffractionpatterns can be observed in Fig. 10. The (Sn) peaks (Fig. 9)could not be detected for temperatures higher than 120 ◦Cbecause the peaks were too small due to the eutectic reactionoccurring at 134 ◦C. An amorphous phase could be detected for
higher temperatures (a halo – a curved baseline – is observedfor 2θ between 20◦ and 40◦). It corresponds to the liquid phase.As expected, with the increase in the amount of liquid theconcavity also increases. Special attention should be given tothe behavior of the [002] plane in (Zn) (T = 30 ◦C, 2θ =
36.37◦; d = 0.247 nm) slightly above the ternary eutecticreaction where the inter-atomic distance, d, slightly decreases.This is in contradiction to the expected tendency to increasewith temperature probably due to the rearrangement initiatedby the appearance of liquid.
Table 4 lists the solubility of each element in allsolid solutions measured by SEM/EDS. The temperature is
M.H. Braga et al. / Computer Coupling of Phase Diagrams and Thermochemistry 31 (2007) 468–478 475
Fig. 6. Experimental vertical section for w(Sn) ∼ 5%. Symbols point for theexperimental transition temperatures obtained by DTA/DSC in the presentwork. Dashed lines were drawn according to what was expected from ourresults and having in consideration the literature [3].
Fig. 7. Experimental vertical section for w(Sn) ∼ 13%. Symbols point forthe experimental transition temperatures obtained by DTA/DSC in the presentwork. Dashed lines were drawn according to what was expected from ourresults and having in consideration the literature [3].
considered to be less than 120 ◦C because samples are annealedat 120 ◦C for 60 min and slowly cooled down to roomtemperature. Fig. 11 envisages four SEM microstructures ofsome selected samples showing the three different phases, inaccordance with the expectation.
Three samples with w(Sn) ∼ 77/81% have been subjectedto two different heat treatments consisting of an annealing at120 ◦C for 180 min followed by slow cooling at 0.5 ◦C/minand an annealing for 180 min at 120 ◦C, followed by waterquenching. Our intention concerning the first heat treatmentis to obtain phases’ composition near room temperature,comparable with those already referred. For the second heat
Fig. 8. An example of a DTA/DSC heating curve. The composition of thesample is presented in the figure.
Fig. 9. A XRD pattern at room temperature for a bulk sample withcomposition: w(Bi) = 10.1%, w(Sn) = 57.8%, w(Zn) = 32.1%.
Fig. 10. HT-XRD patterns for a powder sample with composition:w(Bi) = 68.5%, w(Sn) = 5.7%, w(Zn) = 25.8% from room temperature to180 ◦C.
treatment, we aim at obtaining the phases’ composition at120 ◦C. The results show, in both cases, a similarity betweenphases’ composition measured by EDS. This similarity could

476 M.H. Braga et al. / Computer Coupling of Phase Diagrams and Thermochemistry 31 (2007) 468–478
Fig. 11. Microstructures of selected samples (500×): (Bi) – light grey, (Sn) – medium grey, (Zn) – dark grey. The composition of samples is indicated by arrows.All studied Bi–Sn–Zn samples are indicated in the figure.
Fig. 12. Microstructures (150×) of a sample with w(Bi) = 9.2%; w(Sn) = 81.0%; w(Zn) = 9.8% after: (a) slow cooling (0.5 ◦C/min) after 180 min at 120 ◦C andin (b) water quenched after 180 min at 120 ◦C: (Bi) – light grey, (Sn) – medium grey, (Zn) – dark grey.
be a result of the short annealing stage, not sufficient to reachthe thermodynamic equilibrium. It could also be an effect ofthe used cooling rate, which is not high enough to “freeze”the “high-temperature” structure. The main difference betweensamples annealed in different ways reflects in the grain size(Fig. 12).
Concerning the solvus of (Bi) and (Sn), SEM/EDSresults from samples which previously underwent DTA/DSCexperiments, followed by cooling at a rate of 5 ◦C/min, arealso in agreement with the above mentioned results.
As mentioned in Section 2.5, the Bi–Sn–Zn systemis also an object of equilibrium study. Examples of theequilibrated samples resulting in microstructures are shown inFigs. 13(a)–(b) and 14(a)–(c).
The results hence obtained agree with the Bi–Sn experi-mental results (see Section 3.1) and confirm the errors in thepredicted phase boundaries. The experimental results also con-firmed the observation of Malakhov [9], that the presence of Sn
increases the solubility of Zn in (Bi). This increase is signifi-cant as the value measured in the ternary alloy is several timeshigher than the value measured in the binary Bi–Zn system.
Tables 4 and 5 list the results of DTA/DSC measurements(namely the transition temperature found for lower Bi content,corresponding to probable ternary eutectic reaction), whichconfirmed a much lower Bi solubility in (Sn) than previouslyanticipated in [6].
4. Conclusions
1. Results from DTA/DSC, SEM/EDS/WDS, RT-XRD andHT-XRD (for some samples) are obtained for the Bi–Sn,Bi–Zn and Bi–Sn–Zn systems and critically compared. Newvalues for the liquidus surface of the ternary miscibility gaphave also been obtained.
2. Results are generally in agreement with each other. Thebinaries’ results confirm those obtained for the ternary andvice-versa.

M.H. Braga et al. / Computer Coupling of Phase Diagrams and Thermochemistry 31 (2007) 468–478 477
Fig. 13. Microstructure (2000×) of the Bi–Sn–Zn samples (a) “A” (annealed 744 h) and (b) “C” (annealed 980 h), showing a grey matrix of a solid solution of Biand Zn in (Sn), dark Zn-rich and light Bi-rich phases (both are also solid solutions).
Fig. 14. Microstructure (2000×) of the Bi–Sn–Zn samples (a) “D” (annealed 1175 h), (b) “E” (annealed 1175 h) and (c) “F” (annealed 1100 h), showing the greymatrix of a solid solution of Bi and Zn in BCT A5 (Sn), dark Zn-rich and light Bi-rich phases (both are also solid solutions).
3. From the ternary and binary results obtained from differenttechniques, it appears that the solubility of Bi in (Sn) doesnot surpass w(Bi) ∼ 10%, at the eutectic temperature, whichis not in agreement with the assessed phase diagram in [6].
4. Results for Bi–Zn indicate that the solubility of bothelements in the respective solid solution is approximately0.3 wt% at 200 ◦C as in [9].
5. A reassessment of the Bi–Sn binary and also Bi–Sn–Znternary system is desirable. In a recent work of Vizdalet al. [14], the authors of this work reassessed the Bi–Snand the Bi–Sn–Zn systems based, among others, on theexperimental results presented in this study.
Acknowledgments
This work is a contribution to the European COST 531Action on “Lead-free Solder Materials”. J. Vizdal and A.Kroupa would also like to thanks to the Ministry of Educationof the Czech Republic and project COST 531.002 for thesupport.
References
[1] G. Poupon. http://www.sansplomb.org/doc presentation/pbissue.pdf,2004.

478 M.H. Braga et al. / Computer Coupling of Phase Diagrams and Thermochemistry 31 (2007) 468–478
[2] COST 531 – site. http://www.univie.ac.at/cost531/, 2005.[3] S.D. Muzaffar, J. Chem. Soc. 123 (1923) 2341–2352.[4] S. Nagasaki, E. Fujita, J. Japan Inst. Met. 16 (1952) 317–321.[5] W. Oelsen, K.F. Golucke, Arch. Eisenhuttenwes. 29 (1958) 689–698.[6] H. Ohtani, K. Ishida, J. Electron. Mater. 23 (1994) 747–755.[7] B.-J. Lee, C.-S. Oh, J.-H. Shim, J. Electron. Mater. 25 (1996) 983.[8] T.B. Massalski, Binary Alloy Phase Diagrams, ASM International, Ohio,
1990.[9] D.V. Malakhov, CALPHAD 24 (2000) 1.
[10] 01-085-1329 ICDD PDF-2 2003; from ICSD using POWD-12++ after P.
Cucka, C. S. Barrett, Acta Crystallogr. 15 (1962) 865–872.[11] 03-065-7657 ICDD PDF-2 2003; from NIST using POWD-12++ after V.
T. Deshpande, D. B. Sirdeshmukh, Acta Crystallogr. 14 (1961) 355–356.[12] 01-087-0713 ICDD PDF-2 2003; from ICSD using POWD-12++ after H.
E. Swanson, E. Tatge, Natl. Bur, Stand. (U.S.), circ. 539, 359 (1953) I1.[13] The Cambridge Crystallographic Data Centre.
http://www.ccdc.cam.ac.uk/products/csd/radii/, 2004.[14] J. Vizdal, M.H. Braga, A. Kroupa, K.W. Richter, D. Soares,
L.F. Malheiros, J. Ferreira, The thermodynamic assessment of theBi–Sn–Zn system, CALPHAD (2007) (in press).