the extent of trafficking in the supplemental nutrition ... · pdf filethe extent of...
TRANSCRIPT

The Extent of Trafficking in the Supplemental Nutrition Assistance Program: 2009–2011
Nutrition Assistance Program Report August 2013 Food and Nutrition Service Office of Policy Support

Non-Discrimination Policy The U.S. Department of Agriculture (USDA) prohibits discrimination in all of its programs and activities on the basis of race, color, national origin, age, disability, and where applicable, sex (including gender identity and expression), marital status, familial status, parental status, religion, sexual orientation, political beliefs, genetic information, reprisal, or because all or part of an individual's income is derived from any public assistance program. (Not all prohibited bases apply to all programs.) Persons with disabilities who require alternative means for communication of program information (Braille, large print, audiotape, etc.) should contact USDA's TARGET Center at (202) 720-2600 (voice and TDD). To file a complaint of discrimination, write to USDA, Assistant Secretary for Civil Rights, Office of the Assistant Secretary for Civil Rights, 1400 Independence Avenue, S.W., Stop 9410, Washington, DC 20250-9410; or call toll-free at (866) 632-9992 (English) or (800) 877-8339 (TDD) or (866) 377-8642 (English Federal-relay) or (800) 845-6136 (Spanish Federal-relay). USDA is an equal opportunity provider and employer.

The Extent of Trafficking in the
Supplemental Nutrition Assistance Program: 2009–2011
Authors: Richard Mantovani, Ph.D., ICF International Eric Sean Williams, Ph.D., Food and Nutrition Service, USDA Jacqueline Pflieger, Ph.D., ICF International Submitted by: ICF International, Inc. 9300 Lee Highway Fairfax, VA 22031
Submitted to:
Office of Policy Support Food and Nutrition Service 3101 Park Center Drive Alexandria, VA 22302-1500
Project Director: Richard Mantovani, Ph.D.
Project Officer: Eric Sean Williams, Ph.D.
This study was conducted under Contract number AG-3198-D-12-0046 with the Food and Nutrition Service, United States Department of Agriculture. Suggested Citation: Mantovani, Richard, Eric Sean Williams, and Jacqueline Pflieger. The Extent of Trafficking in the Supplemental Nutrition Assistance Program: 2009–2011. Prepared by ICF International for the U.S. Department of Agriculture, Food and Nutrition Service, August 2013. Available online at www.fns.usda.gov/research-and-analysis
Food and Nutrition Service, Office of Policy Support August 2013
Extent of SNAP Trafficking: 2009–2011 i August 2013
TableofContents
EXECUTIVE SUMMARY .......................................................................................................... ii Approach ................................................................................................................................... ii Trafficking in 2009–2011 ......................................................................................................... ii Trends Over Time .................................................................................................................... iii
1. INTRODUCTION................................................................................................................... 1 1.1. Background and Purpose ................................................................................................. 1 1.2. Approach .......................................................................................................................... 2 1.3. Report Overview .............................................................................................................. 2
2. METHODS .............................................................................................................................. 3 2.1. General Approach ............................................................................................................ 3 2.2. Limitations ....................................................................................................................... 4 2.3. Consistent Methods With Improved Data ........................................................................ 5 2.4. Estimates .......................................................................................................................... 5
3. SNAP TRAFFICKING IN 2009–2011 .................................................................................. 6 3.1. National Estimates ........................................................................................................... 6 3.2. Trafficking by Store Type ................................................................................................ 6 3.3. Trafficking by Store Ownership ...................................................................................... 7 3.4. Trafficking and Poverty Level of Store Location ............................................................ 8 3.5. Trafficking and Population Density of Store Location .................................................... 9
4. TRAFFICKING TRENDS ................................................................................................... 10 4.1. Trends in Benefits Trafficked ........................................................................................ 10 4.2. Store Violations ............................................................................................................. 11 4.3. Explaining the Change in Trafficking ............................................................................ 12
4.3.1. Size of the Supplemental Nutrition Assistance Program ................................... 12 4.3.2. Effects of Store Composition ............................................................................. 13 4.3.3. Other Factors ...................................................................................................... 15
APPENDICES A. Estimation Error B. Approaches for Detecting Trafficking, Data Sources, and Creation of Analysis Files C. Post-Stratification Estimation Methodology D. Variables Employed in the Raking Model E. Estimate Definition F. Statistics on Investigations and Administrative Actions G. Statistics on Comparisons between Retailers in the Investigative Sample and in the
Population of Retailers H. Estimate Intervals I. Sensitivity of Estimates to Violation Definitions

Extent of SNAP Trafficking: 2009–2011 ii August 2013
EXECUTIVE SUMMARY
This is the sixth in a series of periodic analyses to estimate the extent of trafficking in the Supplemental Nutrition Assistance Program (SNAP). Trafficking occurs when SNAP recipients sell their benefits for cash at a discount to food retailers. An expanded definition of trafficking was established in Food and Nutrition Service (FNS) regulations published in February, 2013.1 Although trafficking does not represent a cost to the Federal Government, it is a diversion of program benefits. Benefits are intended to help low-income households access a nutritious diet, and trafficking impedes the program’s mission and undermines its integrity. This trafficking update provides an important overview of SNAP integrity from 2009 through 2011.
APPROACH
As with previous analyses, current trafficking estimates are based on two types of FNS investigations: those occurring covertly in stores and those based on SNAP Electronic Benefit Transfer (EBT) administrative (i.e., SNAP purchase) records. Both types of investigations focus on retailers that exhibit suspicious behavior; and thus are not representative of the retailer population. National estimates of trafficking calculated simply by using these sources, therefore, would be higher than in the retailer population as a whole. In order to correct for at least some of this bias, this and prior reports utilize methods that adjust the trafficking outcomes from investigation activity to more accurately reflect the population of SNAP retailers and their redemptions and stores authorized to redeem them. The report contains trafficking estimates generated from data on investigations conducted by FNS and by the U.S. Department of Agriculture’s Office of the Inspector General, and State law enforcement agencies. These estimates also incorporate a broader population of stores with suspect redemption patterns that have been identified through the Agency’s fraud detection system, the Anti-fraud Locator using EBT Retailer Transactions (ALERT) system. The following indicators of trafficking were estimated: Total value of SNAP redemptions that were trafficked; Trafficking rate, or the proportion of SNAP redemptions that were trafficked; and Store violation rate, or the proportion of authorized stores that engaged in trafficking.2
TRAFFICKING IN 2009–2011
Based on the best data available for 2009–2011, estimates indicate the following: Trafficking diverted an estimated $858 million annually from SNAP benefits; Overall, approximately 1.3 percent of total SNAP benefits were trafficked; and Approximately 10.5 percent of all authorized SNAP stores engaged in trafficking.
1 For detailed information on the regulations, see http://www.fns.usda.gov/snap/rules/regulations/pdfs/022113.pdf. 2 The study focuses only on active stores, i.e., stores that redeemed SNAP benefits at some point between 2009 and 2011.

Extent of SNAP Trafficking: 2009–2011 iii August 2013
A variety of store characteristics and settings were associated to the level of trafficking. Small stores—largely composed of smaller and medium sized groceries, and convenience stores— accounted for about 15 percent of all redemptions, but were estimated to account for 85 percent of all trafficking redemptions.3 Trafficking was also much more likely to occur among privately owned stores than publicly owned stores and was much more likely among retailers located in higher poverty neighborhoods than those areas with less poverty.
TRENDS OVER TIME
Exhibits E-1 through E-3, provide the most up-to-date estimates for each study period. Since the first trafficking estimate was generated in 1993, the trafficking rate has declined from $811 million annually to a low of $241 million annually in the 2002-2005 period (Exhibit E-1). Since then, however, the amount has risen—mostly due to the rate of growth in SNAP redemptions.4 Although the value of benefits trafficked has increased substantially over time, the rate of trafficking has remained low (see Exhibit E-2). The rate of store violations has somewhat increased over time, from 8.2 percent in the last study period to 10.5 percent in the current study period (see Exhibit E-3).
Exhibit E-1: Annualized Dollar Amount of Trafficking, by Study Period
3 It should be noted that the trafficking estimate for supermarkets is highly volatile, reflecting their low presence among retailers who are investigated or sent charge letters, issues with detecting trafficking in these large, complexly organized stores, and the large share of redemptions accounted for by these stores. It is feasible that the amount of trafficking accounted for, given the methodology, can change dramatically from one study period to the next. 4 Estimates reported for the periods since and including 2002-2005 are based on what is known as the “current” estimate.” Estimates earlier than those reported for 2002–2005 are based on similar but less comprehensive definitions of the investigative sample and trafficking. In previous studies in 1993 and 1996–1998, the estimates were referred to as the “original” estimates, and the estimates in the 1999–2002 study were referred to as the “revised” estimates. Details on estimate definitions are provided in Appendix E.
$811$660
$393$241
$330
$858
$0
$100
$200
$300
$400
$500
$600
$700
$800
$900
$1,000
1993 1996‐1998 1999‐2002 2002‐2005 2006‐2008 2009‐2011
Amount Trafficked(in Millions)
Study Period
Original Estimate Revised Estimate Current Estimate

Extent of SNAP Trafficking: 2009–2011 iv August 2013
Exhibit E-2: Rate of Trafficking, by Study Period
Exhibit E-3: Rate of Store Violations, by Study Period
3.8%3.5%
2.5%
1.0% 1.0%1.3%
0.0%
0.5%
1.0%
1.5%
2.0%
2.5%
3.0%
3.5%
4.0%
1993 1996‐1998 1999‐2002 2002‐2005 2006‐2008 2009‐2011
Percentage of Benefits Trafficked
Study Period
Original Estimate Revised Estimate Current Estimate
9.4%
11.7%
9.3%7.4% 8.2%
10.5%
0.0%
2.0%
4.0%
6.0%
8.0%
10.0%
12.0%
14.0%
1993 1996‐1998 1999‐2002 2002‐2005 2006‐2008 2009‐2011
Percentage of
Stores Trafficking
Original Estimate Revised Estimate Current Estimate

Extent of SNAP Trafficking: 2009–2011 1 August 2013
1. INTRODUCTION
1.1. BACKGROUND AND PURPOSE
The Food and Nutrition Service (FNS) administers the Supplemental Nutrition Assistance Program (SNAP), which in fiscal year 2011 issued about $71.6 billion in benefits to almost 44.7 million low-income participants to help them obtain a nutritious diet.1 SNAP benefits are permitted for the purchase of eligible food items from authorized food retailers. When individuals sell benefits for cash, both program intent and law are violated. The practice of trafficking compromises the program’s mission and undermines public perception of the program’s integrity. Food retailers authorized by FNS are the primary agents that can redeem SNAP benefits with the Federal Government (meal service programs that serve specific disadvantaged populations can also redeem SNAP benefits), and therefore are the primary loci of trafficking. FNS is responsible for authorizing and managing retailer participation. As part of this responsibility, FNS employs monitoring and investigations staff to identify and curb benefit trafficking. These efforts include covert investigations as well as ongoing review of SNAP benefit redemption or transaction data. Investigations are also initiated by the U.S. Department of Agriculture’s (USDA) Office of the Inspector General (OIG), and a limited number of State law enforcement bureaus authorized to assist FNS with store investigations. Although these activities can provide a general sense of trafficking patterns, they do not provide an accurate estimate of benefits diverted through trafficking since they focus on retailers identified as potential traffickers. To remedy this, FNS has funded studies to statistically adjust the information provided by these administrative actions to provide more accurate estimates. This report is the sixth in a series of periodic reports2 that provide updated estimates of the following: Total value of SNAP redemptions that were trafficked; Trafficking rate, or the proportion of SNAP redemptions that were trafficked; and Store violation rate, or the proportion of authorized stores that engaged in trafficking. The estimates reflect redemption activity beginning on January 1, 2009, and ending on December 31, 2011.
1 Source: http://www.fns.usda.gov/pd/SNAPsummary.htm. 2 Previous estimates are reported in Macaluso, T. 1995. The Extent of Trafficking in the Food Stamp Program; Macaluso, T. 2000. The Extent of Trafficking in the Food Stamp Program: An Update; Macaluso, T. 2003. The Extent of Trafficking in the Food Stamp Program: 1999–2002; Mantovani, R. E., and C. Olander. 2006. The Extent of Trafficking in the Food Stamp Program: 2002–2005; and Mantovani, R. E., and H. Wilson. 2011. The Extent of Trafficking in the Supplemental Nutrition Assistance Program: 2006–2008. These reports are available from FNS http://www.fns.usda.gov/

Extent of SNAP Trafficking: 2009–2011 2 August 2013
1.2. APPROACH
Ideally, an estimate of SNAP trafficking would be based on the redemption practices of a national, randomly selected sample of authorized SNAP retailers. This approach would provide an unbiased estimate with a known degree of precision.3 However, conducting such a study would require FNS to divert a portion of its limited resources from the high priority task of identifying and investigating retailers with suspicious redemption practices. Consequently, since the initial study was completed in 1993, FNS trafficking estimates have been generated from a systematic analysis of the best available data on redemption monitoring (EBT redemption pattern analysis) and investigations of authorized retailers. This systematic analysis recognized that a somewhat biased perspective on SNAP trafficking would result from using investigative and administrative EBT data sources without adjustment. Because this bias is based on stores that have exhibited suspicious behavior, it could potentially overestimate the extent of trafficking. In contrast, even with statistical adjustment, investigations and monitoring activities cannot catch all instances of trafficking, thereby introducing some downward bias in the estimates. On balance, the analysis and approach adopted err on the side of overestimation. (See Appendix A for a discussion of sources of underestimation and overestimation.)
1.3. REPORT OVERVIEW
The remainder of the report is organized with 3 substantive chapters. Chapter 2 provides an overview of the procedures used to estimate trafficking, along with descriptions of their key limitations and strengths. Chapter 3 provides best estimates of trafficking indicators for calendar years 2009–2011. With the nationwide implementation of the Electronic Benefit Transfer (EBT) screening system, the sources of information used to identify and record trafficking expanded, and trafficking estimates, beginning with the 2002–2005 estimates, made use of these additional sources of data. This chapter also presents the results of some subgroup analyses comparing types of stores and store locations. Finally, Chapter 4 examines trafficking trends over time.
3 There is the matter of measurement error, however, particularly with regard to uncovering instances of trafficking where retailers are reluctant to participate with unfamiliar individuals.

Extent of SNAP Trafficking: 2009–2011 3 August 2013
2. METHODS
2.1. GENERAL APPROACH
The estimates presented in this report were generated using the same strategy as in the previous five studies and applied the strategy to generate an estimation measure (current estimate) used in the last two studies. This approach is based on identifying trafficking retailers from among those retailers that were investigated and from among those retailers subject to additional monitoring. This investigative sample and the trafficking outcomes were then translated into the number of violating stores and the dollar amount of trafficked redemptions in the retailer population as a whole. The investigative sample was generated from two sources: Investigations—These cases are based on covert activities pursued by FNS, the USDA OIG,
the States, and other entities. Investigations target stores with suspicious behavior and identify stores in this group that manifest trafficking behavior.
EBT data-based cases—These cases include stores considered to be suspicious as a result of screening EBT transaction records. Such cases are resolved through an administrative process in which specific transactions are identified as being in violation (indicative of trafficking).
This information was used to define a trafficking rate. (See Appendix B for more details on these sources and Appendix F for statistics on the investigations and EBT data-based cases.) The denominator of the rate consists of all stores that were investigated or were identified as potential traffickers through administrative review of EBT redemption patterns, and the numerator includes stores that trafficked with an investigator or had been permanently disqualified based on an administrative (EBT) case.4 As mentioned earlier, this rate overestimates trafficking in that it is based on stores that have exhibited suspicious behavior. To partially correct for this bias, we used a post-stratification raking approach to adjust the sample estimates to better represent the retailer population as a whole. The raking approach provides weights based on store characteristics that project the sample value to a population value. For example, if proportionately fewer supermarkets are in the sample than in the population, the supermarkets in the sample have larger weights than other stores. Because supermarkets have traditionally demonstrated a proportionately lower rate of trafficking in the sample, this lower rate would be translated to the population. The post-stratification raking procedure weights sample stores to the population based on strata formed by variables that distinguish among stores that are under investigation or that have had an administrative (EBT) case opened. (See Appendix C for a description of the raking process.) 4 Trafficking is defined as buying or selling benefits for cash or consideration other than eligible food, and the penalty is permanent disqualification. Permanent disqualification occurs when a retailer’s authorization to redeem SNAP benefits is revoked. Some stores (those that can prove that they had a robust, documented compliance training program in place prior to the violations and that the store owners did not benefit from the violations) may pay compensation in lieu of permanent disqualification. These stores are treated as permanently disqualified for the purposes of this study.

Extent of SNAP Trafficking: 2009–2011 4 August 2013
For this and previous analyses, the following variables were used (see Appendix D for information on how these dimensions were defined): Store size and type (e.g., supermarket, grocery, convenience store), Ownership (private or public), Poverty level of the store’s neighborhood, Urbanization level of the store’s neighborhood, and SNAP redemption level. The calculated weights were applied to information for each retailer in the sample to estimate the overall number of stores that trafficked and the total amount of trafficked redemptions in the population. Redemptions were further adjusted to account for legitimate SNAP sales that occur in trafficking stores.5 The store violation rate and trafficking rate estimates were calculated as the percentage of all SNAP stores that trafficked and the proportion of all benefits that were trafficked, respectively. Estimates were calculated for various subgroups of stores (i.e., type of ownership, poverty level, and degree of urbanization).
2.2. LIMITATIONS
There are three key limitations associated with our approach. First, although post-stratification may reduce potential bias, it cannot eliminate it. Estimates of trafficking are based on the activities of suspicious retailers, and these estimates are extrapolated to the population. Estimates based on a sample of suspected retailers are likely to overstate the population value of trafficking. However, the post-stratification process works only as well as the variables used in the process. The variables used for determining strata were identified as related to trafficking in the 1993 study (based on FNS investigations) and have been carried forth in subsequent studies for consistency. A second, related limitation concerns the definition of the strata within each of the variables that are used in the raking process. In particular, the variables are defined by simple or ordered categories. These categories are critical to creating the strata used to calculate adjusted weights. For example, we use four levels of poverty to define the location of a store. The estimates might be different if we characterized poverty levels differently.6
Third, the adjustment to account for legitimate redemptions in trafficking stores was set purposefully low to minimize the risk of underestimating the prevalence of trafficking. There is
5 Among stores that trafficked, 60 percent of all redemptions in large stores and 10 percent of all redemptions in small stores were assumed to have been legitimate sales. This is a potential source of overestimation if a larger portion of the redemptions represents legitimate transactions. However, it is consistent with the aim of creating conservative estimates. 6 The variables and cut points were determined by an analysis performed as part of the 1993 estimates. As part of the sensitivity analyses for the 2002–2005 report, the effect of varying the cut points was examined. The cut points are the particular categories that are created within the variables. For instance, we denoted the cut-point for very highly urbanized areas as 90 percent. Alternatively, we could have specified 95 percent. In the sensitivity analyses, we showed that varying the cut points, as long as they were not drastically different, did not have a significant impact on estimates (see the 2002–2005 report for details).

Extent of SNAP Trafficking: 2009–2011 5 August 2013
no empirical evidence that retailers that were caught trafficking or were permanently disqualified from the program trafficked at the rate that the adjustment would suggest.7
2.3. CONSISTENT METHODS WITH IMPROVED DATA
In order to remain consistent with previous analyses, this study is based on data sources that allow us to represent a broader range of FNS trafficking-related activities. In addition to FNS investigations and EBT data-based cases, this study includes investigations conducted by OIG, the States, and other entities.
2.4. ESTIMATES
This report presents a measure of trafficking consistent with the last two reports and which represents the most comprehensive measure in terms of utilizing all relevant data sources. In previous reports, this measure of trafficking was referred to as the current estimate.8 In addition to in-field investigations conducted by FNS and charge letters to retailers issued by FNS based on EBT analysis, the estimate includes closed cases on the Watch List (a prioritized list of suspicious stores identified by the Anti-fraud Locator using EBT Retailer Transactions (ALERT) system)9 and retailers investigated by OIG, the States, and other entities. The numerator includes investigated retailers with a trafficking flag,10 retailers permanently disqualified from the program or that paid a civil money penalty in lieu of permanent disqualification, and retailers found to be trafficking through investigations by OIG and the States. Retailers that were permanently disqualified or paid a civil money penalty in lieu of permanent disqualification are designated by FNS after official review as being indicative of those most often found to be trafficking and thus, they are included in the numerator. The following indicators of trafficking were estimated: Total dollar amount of SNAP redemptions that are trafficked; Trafficking rate, or the proportion of SNAP redemptions that are trafficked; and Store violation rate, or the proportion of authorized stores that engaged in trafficking.
7The extent to which specific retailers traffic is unknown. Some retailers may traffic on all their SNAP transactions, whereas others will not traffic at all. The trafficking estimates presented in this report assume that if a small store is identified as trafficking, 90 percent of their SNAP redemptions are trafficked, and for large stores that are identified as trafficking, this percentage is 40 percent. 8 See Appendix E for definition. 9 The addition of closed Watch List case retailers broadens the definition of the denominator to any store that has been reviewed as a result of suspicious SNAP transaction patterns. Closed cases include stores for which the suspicious redemption patterns are explained as legitimate or result in disqualification or withdrawal. 10 When an in-store investigation is conducted and trafficking occurs, these instances are noted in the STARS systems by a flag.

Extent of SNAP Trafficking: 2009–2011 6 August 2013
3. SNAP TRAFFICKING IN 2009–2011
3.1. NATIONAL ESTIMATES
This report presents trafficking estimates for the calendar years between 2009 and 2011 and found the following: An estimated $858 million in SNAP benefits annually were trafficked and thereby diverted
from their intended purpose; Overall, about 1.3 percent of total SNAP benefits were trafficked; and Approximately 10.5 percent of all authorized SNAP stores engaged in trafficking. These figures are in the context of a program in which retailers redeemed an average of $63.7 billion annually in benefits per year between 2009 and 2011. It should be noted that the figures reported in the study period 2006–2008 for the proportion of benefits trafficked and the proportion of SNAP retailers trafficking was one percent and eight percent, respectively.
3.2. TRAFFICKING BY STORE TYPE
Since the 1993 report on SNAP trafficking, store type has always been a critical variable for determining the potential for trafficking.11 As observed in previous studies, small stores, particularly convenience stores and small groceries, were notably more likely to be involved in trafficking than other stores. About 18 percent of those stores classified as convenience stores or small groceries were estimated to have trafficked. For larger stores (supermarkets and large groceries), only 0.32 percent were estimated to have trafficked. In terms of redemptions, about 17 percent of small groceries redemptions and 14 percent of convenience store redemptions were estimated to have been trafficked. This compares with a rate of 0.2 percent for large stores. The contribution of stores included in the combination/other category to the estimates presented in this report were minimal, constituting about 4.1 percent of all trafficked redemptions between 2009 and 2011.12
11 Authorized SNAP retailers are presently classified into 16 different store-type categories. Consistent with previous reports, these store types were collapsed into seven more inclusive categories. Superstores were classified along with supermarkets for the purposes of this study. Large stores identified as combination stores were not. The combination/other store type served as a catchall for stores not otherwise categorized as well as a including stores whose food sales food sales are not substantial when compared to revenues from other products. These are so-called “box stores.” 12 Although the amounts have been annualized to provide a summary of the average dollar amount of trafficking per year during the study period, the rates reflect a similar concept—that of summarizing the entire period.

Extent of SNAP Trafficking: 2009–2011 7 August 2013
Exhibit 1: Trafficking Estimates for Redemptions and Stores, by Store Type, Calendar Years 2009–2011
Type of Store Total Annualized
Redemptions
Annualized Amount of Trafficking
Trafficking Rate
Total Stores
Trafficking Stores
Store Violation
Rate
Large Stores
Supermarkets $53,154,421,292 $128,168,897 0.24%
38,968 108 0.28%
Large groceries $1,054,069,828 $4,575,249 0.43%
4,205 30 0.71%
Subtotal $54,208,491,120 $132,744,146 0.24%
43,173 138 0.32%
Small Stores
Medium-sized groceries $1,366,478,342 $75,447,038 5.52%
14,220 1,291 9.08%
Small groceries $1,086,066,882 $186,853,271 17.20%
23,868 4,262 17.86%
Convenience stores $2,792,105,523 $392,828,970 14.07%
108,087 19,107 17.68%
Specialty foods $1,001,826,906 $34,545,522 3.45%
15,173 1,327 8.75%
Combination/other $3,289,070,115 $35,344,948 1.07%
60,651 1,647 2.72%
Subtotal $9,535,547,767 $725,019,749 7.60%
221,999 27,634 12.45%
All stores $63,744,038,887 $857,763,895 1.34%
265,172 27,770 10.47% Note: Totals may not match individual row amounts due to rounding.
3.3. TRAFFICKING BY STORE OWNERSHIP
Trafficking rarely occurred in publicly owned stores, with a store violation rate of 0.2 percent (see Exhibit 2). In contrast, 14 percent of privately owned stores were estimated to have trafficked, with a redemption-based trafficking rate of 2.4 percent. Further, privately owned stores accounted for 55.7 percent of all SNAP redemptions, but for 99.9 percent of all benefit dollars trafficked.

Extent of SNAP Trafficking: 2009–2011 8 August 2013
Exhibit 2: Trafficking Estimates for Redemptions and Stores, by Store Ownership Type, Calendar Years 2009–2011
Store Ownership Type
Total Annualized
Redemptions
Annualized Amount of Trafficking
Trafficking Rate
Total Stores
Trafficking Stores
Store Violation
Rate
Privately owned stores $35,533,491,351 $857,064,973 2.41% 195,983 27,663 14.11% Publicly owned stores $28,210,547,536 $698,922 0.00%
69,189 108 0.16%
All stores $63,744,038,887 $857,763,895 1.35% 265,172 27,770 10.47% Note: Totals may not match individual row amounts due to rounding.
3.4. TRAFFICKING AND POVERTY LEVEL OF STORE LOCATION
As in previous reports, trafficking was more likely to occur in poorer neighborhoods. Stores in the most impoverished areas (where more than 30 percent of households live in poverty) were estimated to have a trafficking rate of 2.8 percent of all redemptions, compared with stores in the least impoverished areas (where less than 10 percent of households live in poverty), which had a 0.3 percent trafficking rate (see Exhibit 3). Although stores in the highest poverty area (>30 percent) represent 11 percent of the total population of authorized stores, they accounted for over 20 percent of the total annualized amount trafficked. In terms of the percentage of stores trafficking, there is close to a five-fold difference between stores estimated to have trafficked in the lowest poverty areas (4.2 percent) and those in the highest areas (19.3 percent). Exhibit 3: Trafficking Estimates for Redemptions and Stores, by Poverty Rate in Retailer’s
Neighborhood, Calendar Years 2009–2011
Percentage of Households in Poverty in ZIP Code Where
Store Is Located
Total Annualized
Redemptions
Annualized Amount of Trafficking
Trafficking Rate
Total Stores
Trafficking Stores
Store Violation
Rate
0–10% $12,999,388,474 $34,633,488 0.27% 64,436 2,700 4.19%
11–20% $29,253,991,854 $393,693,818 1.35% 115,252 10,921 9.48%
21–30% $14,802,439,953 $244,758,746 1.65% 56,867 8,624 15.17%
More than 30% $6,688,218,605 $184,677,843 2.76% 28,617 5,526 19.31%
All stores $63,744,038,887 $857,763,895 1.35% 265,172 27,770 10.47% Note: Totals may not match individual row amounts due to rounding.

Extent of SNAP Trafficking: 2009–2011 9 August 2013
3.5. TRAFFICKING AND POPULATION DENSITY OF STORE LOCATION
It has become apparent from evidence accumulated over the years that trafficking rates seem to vary by population density (urbanization) in a nonlinear, “U-shaped” fashion. That is, trafficking rates are highest in the most urban and the most rural areas, with rates decreasing in the areas between these two population density extremes. For example, the redemption-based trafficking rate was 0.7 percent in the areas that were the least urbanized, declined to between 0.3 and 0.5 percent for places with an intermediate level of urbanization, and climbed to 1.8 percent in highly urbanized areas (see Exhibit 4). This pattern is less consistent for the store-based violation rate, which is about 9 percent for stores under 50 percent urbanization, then drops to 7 percent for stores between 51 and 90 percent urbanization, and increases to 12 percent in the most urbanized areas.
Exhibit 4: Trafficking Estimates for Redemptions and Stores, by Urbanization Level in Retailer’s Neighborhood, Calendar Years 2009–2011
Percentage Urbanization of
ZIP Codes Where Stores Are
Located
Total Annualized Redemptions
Annualized Amount of Trafficking
Trafficking Rate
Total Stores
Trafficking Stores
Store Violation
Rate
0–10% $2,180,568,132 $14,260,780 0.65% 25,759 2,281 8.86%
11–50% $3,668,824,675 $11,807,440 0.32% 16,212 1,535 9.47%
51–90% $15,087,201,368 $71,886,487 0.48% 56,638 4,096 7.23%
91–100% $42,807,444,712 $759,809,187 1.77% 166,563 19,857 11.92%
All stores $63,744,038,887 $857,763,895 1.35% 265,172 27,770 10.47% Note: Totals may not match individual row amounts due to rounding.

Extent of SNAP Trafficking: 2009–2011 10 August 2013
4. TRAFFICKING TRENDS
Trends in trafficking could be an important indicator of program improvement either in investigative practices, changes in how redemptions are processed, or selection of retailers. In previous studies prior to the calendar year 2006–2008 study, trafficking trends tended to be decidedly downward, perhaps reflecting the introduction of EBT. Meaningful comparisons require that the same approach be used to calculate estimates at each point in time.
The data presented in Exhibits 5, 6, and 7 reflect the most up to date estimates for each time period. Estimates reported for the periods since and including 2002-2005 are based on what is known as the “current” estimate.” Estimates earlier than those reported for 2002–2005 are based on similar but less comprehensive definitions of the investigative sample and trafficking. In studies in 1993 and 1996–1998, the estimates were referred to as the “original” estimates, and the estimates in the 1999–2002 study were referred to as the “revised” estimates. Details on estimate definitions are provided in Appendix E.
4.1. TRENDS IN BENEFITS TRAFFICKED
Up to the 2006–2008 study period and since the first estimate was produced in 1993, the amount of trafficked benefits had declined. However, beginning with the 2006–2008 study, the amount of trafficked benefits has increased over time. This increase is a reflection of the overall growth of total SNAP redemptions in the past few years. For the estimates in 2009–2011, this amount more than doubled, increasing by $528 million from the previous study period in 2006–2008 (from $330 million to $858 million) (see Exhibit 5). This reflects a two-fold increase in annualized redemptions from $32.1 billion in the 2006–2008 study period to $63.7 billion in the 2009–2011 study period.13 The proportion of redemptions trafficked was still relatively small. The rate of trafficking increased from 1 percent in 2002–2005 and 2006–2008 to 1.3 percent in 2009–2011. This measure indicates the extent of trafficking, holding the total value of redemptions constant. Exhibit 6 presents trends in the trafficking rate by study period. The data show that the rate between the 2002–2005 and 2006–2008 study periods remained constant, and increased slightly between the previous study period in 2006–2008 and the current study period in 2009–2011, but remained low.
13 Certain store types, and States and territories were excluded from the analysis. In addition, only retailers with redemptions over the entire year were included.

Extent of SNAP Trafficking: 2009–2011 11 August 2013
Exhibit 5: Annualized Dollar Amount of Trafficking, by Study Period
Exhibit 6: Rate of Trafficking, by Study Period
4.2. STORE VIOLATIONS
Store violation rates have increased in the 2009–2011 period over the previous periods. The proportion of store violations has increased over the past three iterations of the study, from 7.4 percent in 2002–2005 to 8.2 percent in 2006–2008 to 10.5 percent for the current study period (see Exhibit 7).
$811$660
$393$241
$330
$858
$0
$200
$400
$600
$800
$1,000
1993 1996‐1998 1999‐2002 2002‐2005 2006‐2008 2009‐2011
Amount Trafficked(in Millions)
Study Period
Original Estimate Revised Estimate Current Estimate
3.8%3.5%
2.5%
1.0% 1.0%1.3%
0.0%
0.5%
1.0%
1.5%
2.0%
2.5%
3.0%
3.5%
4.0%
1993 1996‐1998 1999‐2002 2002‐2005 2006‐2008 2009‐2011
Percentage of Benefits Trafficked
Study Period
Original Estimate Revised Estimate Current Estimate

Extent of SNAP Trafficking: 2009–2011 12 August 2013
Exhibit 7: Rate of Store Violations, by Study Period
4.3. EXPLAINING THE CHANGE IN TRAFFICKING
This study, in contrast to previous studies of SNAP retailer trafficking, shows a slight increase in the rates and in the total magnitude of trafficking. The economic downturn at the end of the last study period in 2008 resulted in increased SNAP participation, thus possibly changing the composition of the SNAP participant population, and perhaps trafficking patterns. During this time there also has been a dramatic increase in the number of small retailers authorized to redeem benefits.
4.3.1. Size of the Supplemental Nutrition Assistance Program
Between 2008 and 2009, there was a substantial jump in SNAP redemptions, and has increased each year since (see Exhibit 8). In calendar year 2008, the amount redeemed was approximately $36 billion, rising to more than $55 billion in calendar year 2009.14 By 2011, this amount reached $73 billion. Translated over the three year 2009-2011 period, this amount was approximately double that observed in the previous 2006-2009 study period. Applying the overall trafficking rate estimated for the 2006-2008 study period to the redemptions in 2009-2011, the dollars trafficked would rise from $330 million in 2006-2008 to $660 million in the current period.
14 This calendar year amount, which is larger than the fiscal year amount cited on page 1, is calculated from STARS redemption figures and includes redemptions only from the 48 contiguous States and the District of Columbia.
9.4%11.7%
9.3%7.4% 8.2%
10.5%
0.0%
2.0%
4.0%
6.0%
8.0%
10.0%
12.0%
14.0%
1993 1996‐1998 1999‐2002 2002‐2005 2006‐2008 2009‐2011
Percentage of Stores Trafficking
Original Estimate Revised Estimate Current Estimate

Extent of SNAP Trafficking: 2009–2011 13 August 2013
Exhibit 8: Trends in SNAP Redemption Values (in Billions of Dollars), by Calendar Year
It also should be noted that the overall redemption figures reflect the economic downturn during the latter part of the last decade which has resulted in an overall increase in people receiving SNAP benefits.
4.3.2.Effects of Store Composition
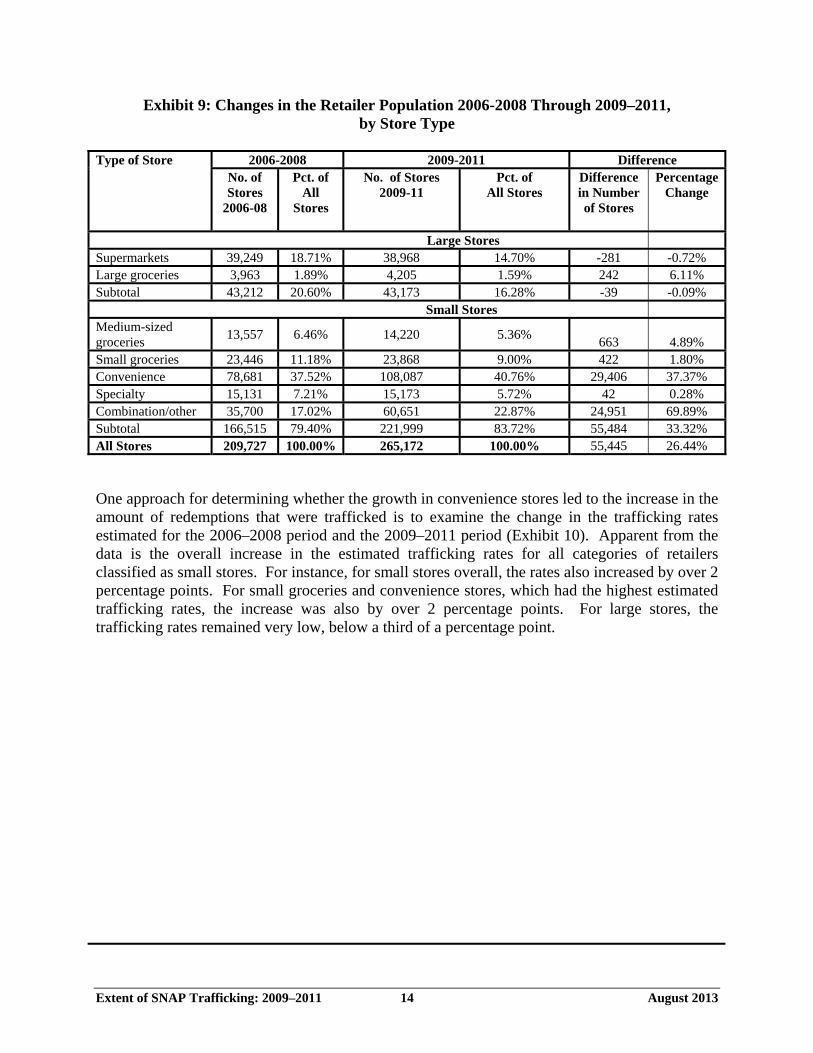
There were 265,172 retailers authorized to participate in SNAP and who redeemed SNAP benefits at any point within the contiguous 48 states between January 1, 2009 and December 31, 2011.15 This compares to 209,727 retailers in the previous 3 year study period. Almost all of this growth was due to the increase in the number of convenience stores (53 percent) and combination/other stores (45 percent). In terms of percentage change, convenience stores showed a growth of 37 percent, and combination/other types of stores not classified as supermarkets, groceries, convenience stores and specialty stores increased by 70 percent (Exhibit 9). It should be noted that combination/other type of stores include large stores but also many smaller stores that sell a variety of items, such as gas/grocery store types. It was previously noted (Chapter 3.2) that convenience stores have a high estimated trafficking rate. The question is then whether the growth in convenience stores led to the increase in the amount of redemptions that were trafficked.
15 This would include all retailers except those omitted from the study population. See Appendix B for description of study population.
$0
$10
$20
$30
$40
$50
$60
$70
$80
1999 2000 2001 2002 2003 2004 2005 2006 2007 2008 2009 2010 2011SNAP Redemptions (in billions)
Calendar Year
Extent of SNAP Trafficking: 2009–2011 14 August 2013
Exhibit 9: Changes in the Retailer Population 2006-2008 Through 2009–2011, by Store Type
Type of Store 2006-2008 2009-2011 Difference No. of Stores
2006-08
Pct. of All
Stores
No. of Stores 2009-11
Pct. of All Stores
Difference in Number of Stores
Percentage Change
Large Stores Supermarkets 39,249 18.71% 38,968 14.70% -281 -0.72% Large groceries 3,963 1.89% 4,205 1.59% 242 6.11% Subtotal 43,212 20.60% 43,173 16.28% -39 -0.09%
Small Stores Medium-sized groceries
13,557 6.46% 14,220 5.36% 663 4.89%
Small groceries 23,446 11.18% 23,868 9.00% 422 1.80% Convenience 78,681 37.52% 108,087 40.76% 29,406 37.37% Specialty 15,131 7.21% 15,173 5.72% 42 0.28% Combination/other 35,700 17.02% 60,651 22.87% 24,951 69.89% Subtotal 166,515 79.40% 221,999 83.72% 55,484 33.32% All Stores 209,727 100.00% 265,172 100.00% 55,445 26.44%
One approach for determining whether the growth in convenience stores led to the increase in the amount of redemptions that were trafficked is to examine the change in the trafficking rates estimated for the 2006–2008 period and the 2009–2011 period (Exhibit 10). Apparent from the data is the overall increase in the estimated trafficking rates for all categories of retailers classified as small stores. For instance, for small stores overall, the rates also increased by over 2 percentage points. For small groceries and convenience stores, which had the highest estimated trafficking rates, the increase was also by over 2 percentage points. For large stores, the trafficking rates remained very low, below a third of a percentage point.

Extent of SNAP Trafficking: 2009–2011 15 August 2013
Exhibit 10: Comparison of Estimated Number of Trafficking Stores and Trafficking Rates For 2006–2008 and 2009–2011, by Store Type
2006-2008 2009-2011 Type of Store Estimated
No. of Stores Trafficking
Pct. of All Trafficking
Stores
Trafficking Rate
Estimated No. of Stores Trafficking
Pct. of All Trafficking
Stores
Trafficking Rate
Large Stores Supermarkets 57 0.33% 0.15% 108 0.39% 0.28% Large groceries 54 0.31% 1.36% 30 0.11% 0.71% Subtotal 111 0.64% 0.26% 138 0.50% 0.32%
Small Stores Medium-sized groceries
798 4.61% 5.89% 1,291 4.65% 9.08%
Small groceries 3,520 20.34% 15.01% 4,262 15.35% 17.86% Convenience 12,209 70.56% 15.52% 19,107 68.80% 17.68% Specialty 534 3.09% 3.53% 1,327 4.78% 8.75% Combination/other 130 0.75% 0.36% 1,647 5.93% 2.72% Subtotal 17,191 99.36% 10.32% 27,634 99.51% 12.45% All Stores 17,302 100.00% 8.25% 27,770 100.00% 10.47%
4.3.3. Other Factors
The estimates discussed previously are subject to several types of variation related to how FNS identifies and tracks trafficking retailers. These can affect estimates within and across study periods. First, the violations sample compiled from investigations and administrative actions can be associated with sampling and measurement variation within and across periods of study. The sampling variation represents decisions to select some retailers for investigations or actions and not others. It should be noted that the sample is not a probability sample, and although it arises from a systematic selection process, it cannot provide exact estimates of statistical variation. Another important aspect affecting the estimates is how trafficking is defined. There are certainly other ways to define trafficking than the way we have used in this report. The effects of modifying what constitutes trafficking are explored in Appendix I.

APPENDIX A
ESTIMATION ERROR
Extent of SNAP Trafficking: 2009–2011 A-1 August 2013
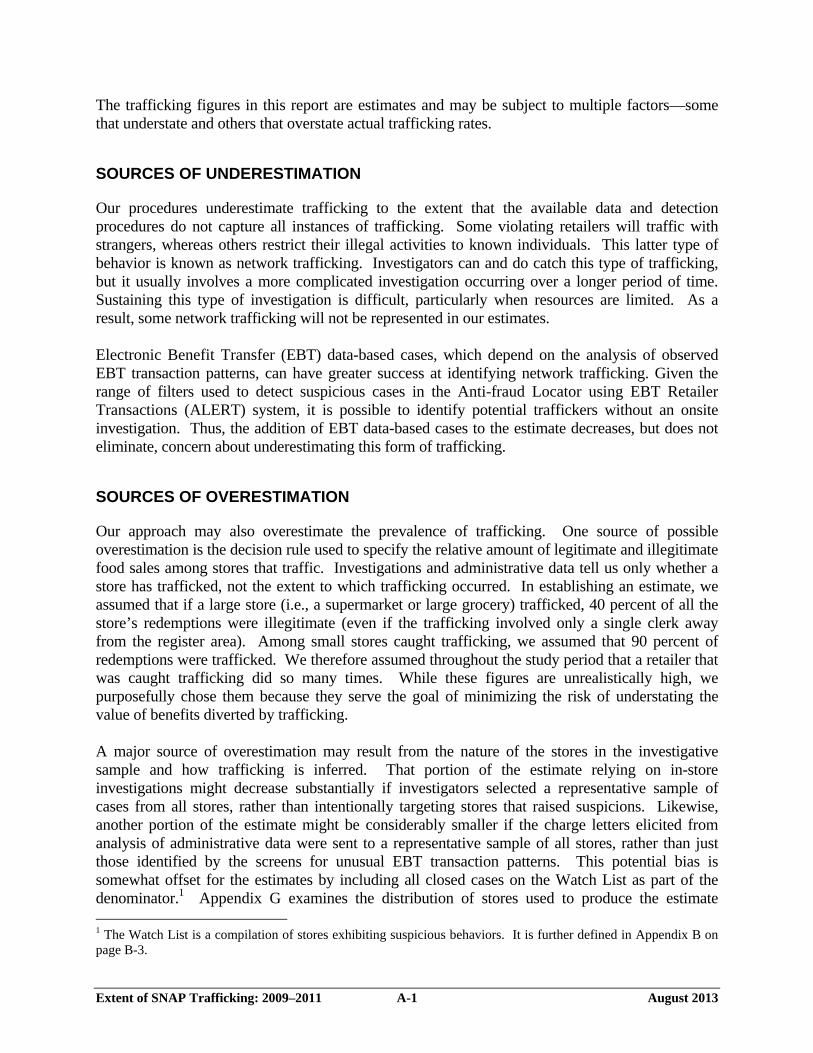
The trafficking figures in this report are estimates and may be subject to multiple factors—some that understate and others that overstate actual trafficking rates.
SOURCES OF UNDERESTIMATION
Our procedures underestimate trafficking to the extent that the available data and detection procedures do not capture all instances of trafficking. Some violating retailers will traffic with strangers, whereas others restrict their illegal activities to known individuals. This latter type of behavior is known as network trafficking. Investigators can and do catch this type of trafficking, but it usually involves a more complicated investigation occurring over a longer period of time. Sustaining this type of investigation is difficult, particularly when resources are limited. As a result, some network trafficking will not be represented in our estimates. Electronic Benefit Transfer (EBT) data-based cases, which depend on the analysis of observed EBT transaction patterns, can have greater success at identifying network trafficking. Given the range of filters used to detect suspicious cases in the Anti-fraud Locator using EBT Retailer Transactions (ALERT) system, it is possible to identify potential traffickers without an onsite investigation. Thus, the addition of EBT data-based cases to the estimate decreases, but does not eliminate, concern about underestimating this form of trafficking.
SOURCES OF OVERESTIMATION
Our approach may also overestimate the prevalence of trafficking. One source of possible overestimation is the decision rule used to specify the relative amount of legitimate and illegitimate food sales among stores that traffic. Investigations and administrative data tell us only whether a store has trafficked, not the extent to which trafficking occurred. In establishing an estimate, we assumed that if a large store (i.e., a supermarket or large grocery) trafficked, 40 percent of all the store’s redemptions were illegitimate (even if the trafficking involved only a single clerk away from the register area). Among small stores caught trafficking, we assumed that 90 percent of redemptions were trafficked. We therefore assumed throughout the study period that a retailer that was caught trafficking did so many times. While these figures are unrealistically high, we purposefully chose them because they serve the goal of minimizing the risk of understating the value of benefits diverted by trafficking. A major source of overestimation may result from the nature of the stores in the investigative sample and how trafficking is inferred. That portion of the estimate relying on in-store investigations might decrease substantially if investigators selected a representative sample of cases from all stores, rather than intentionally targeting stores that raised suspicions. Likewise, another portion of the estimate might be considerably smaller if the charge letters elicited from analysis of administrative data were sent to a representative sample of all stores, rather than just those identified by the screens for unusual EBT transaction patterns. This potential bias is somewhat offset for the estimates by including all closed cases on the Watch List as part of the denominator.1 Appendix G examines the distribution of stores used to produce the estimate 1 The Watch List is a compilation of stores exhibiting suspicious behaviors. It is further defined in Appendix B on page B-3.
Extent of SNAP Trafficking: 2009–2011 A-2 August 2013
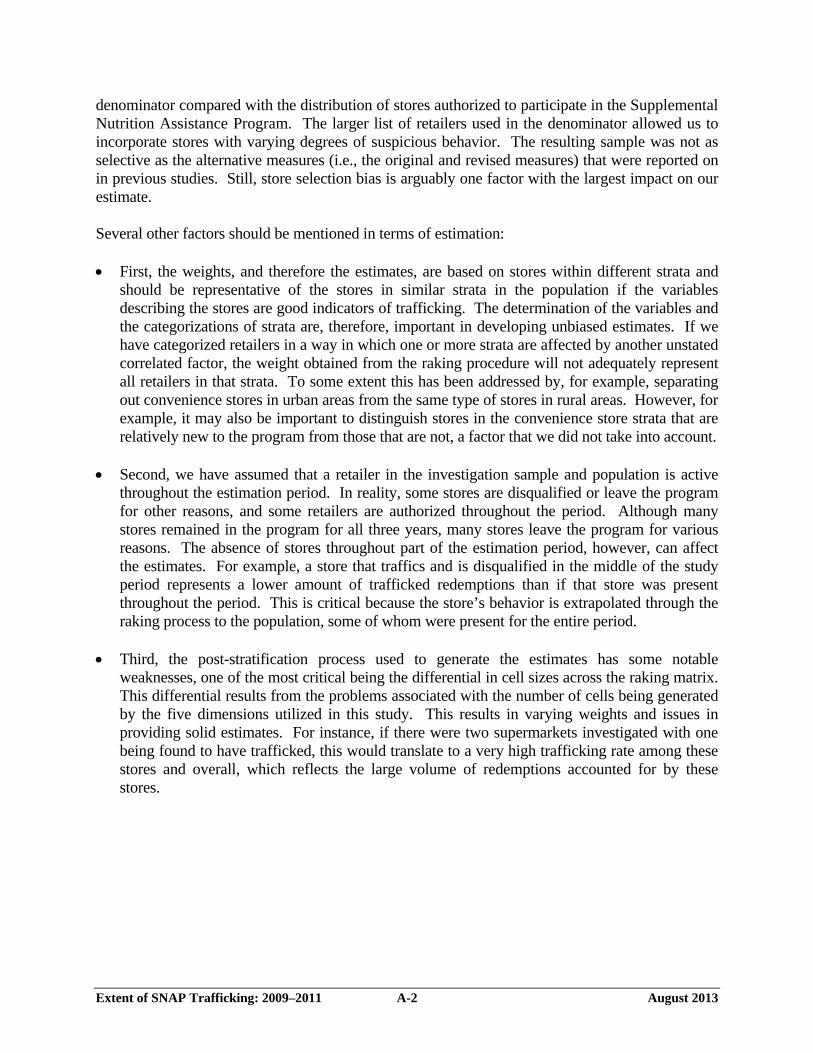
denominator compared with the distribution of stores authorized to participate in the Supplemental Nutrition Assistance Program. The larger list of retailers used in the denominator allowed us to incorporate stores with varying degrees of suspicious behavior. The resulting sample was not as selective as the alternative measures (i.e., the original and revised measures) that were reported on in previous studies. Still, store selection bias is arguably one factor with the largest impact on our estimate. Several other factors should be mentioned in terms of estimation: First, the weights, and therefore the estimates, are based on stores within different strata and
should be representative of the stores in similar strata in the population if the variables describing the stores are good indicators of trafficking. The determination of the variables and the categorizations of strata are, therefore, important in developing unbiased estimates. If we have categorized retailers in a way in which one or more strata are affected by another unstated correlated factor, the weight obtained from the raking procedure will not adequately represent all retailers in that strata. To some extent this has been addressed by, for example, separating out convenience stores in urban areas from the same type of stores in rural areas. However, for example, it may also be important to distinguish stores in the convenience store strata that are relatively new to the program from those that are not, a factor that we did not take into account.
Second, we have assumed that a retailer in the investigation sample and population is active throughout the estimation period. In reality, some stores are disqualified or leave the program for other reasons, and some retailers are authorized throughout the period. Although many stores remained in the program for all three years, many stores leave the program for various reasons. The absence of stores throughout part of the estimation period, however, can affect the estimates. For example, a store that traffics and is disqualified in the middle of the study period represents a lower amount of trafficked redemptions than if that store was present throughout the period. This is critical because the store’s behavior is extrapolated through the raking process to the population, some of whom were present for the entire period.
Third, the post-stratification process used to generate the estimates has some notable weaknesses, one of the most critical being the differential in cell sizes across the raking matrix. This differential results from the problems associated with the number of cells being generated by the five dimensions utilized in this study. This results in varying weights and issues in providing solid estimates. For instance, if there were two supermarkets investigated with one being found to have trafficked, this would translate to a very high trafficking rate among these stores and overall, which reflects the large volume of redemptions accounted for by these stores.
APPENDIX B
APPROACHES FOR DETECTING TRAFFICKING, DATA SOURCES, AND CREATION OF ANALYSIS FILES

Extent of SNAP Trafficking: 2009–2011 B-1 August 2013
APPROACHES FOR DETECTING TRAFFICKING
While FNS regulations expanded the definition of trafficking in February 2013, during the time frame covered by this report it was defined as buying or selling benefits for cash or consideration other than eligible food. In order for this to occur, a transaction must take place between a retailer and an individual possessing an Electronic Benefit Transfer (EBT) card. It may be a one time or infrequent occurrence, or it may represent a continuing relationship between a retailer and a customer. In either case, the transaction is generally private. The Food and Nutrition Service (FNS) has two ways of identifying actual or potential trafficking: Investigations—One approach to identifying trafficking is through covert activities that
simulate a purchase. After receiving a request for an investigation from a field office or a tip or complaint about a store from an external entity, or after identifying a suspicious retailer in another manner, an FNS Retailer Investigations Branch (RIB) investigator or confidential informant attempts to traffic with the retailer. Retailers caught trafficking by investigators are charged. Investigations of large-scale trafficking are handled by the Office of the Inspector General (OIG), which may work with a variety of partners and investigative strategies.
EBT data analysis cases—With the introduction of EBT benefit issuance, FNS introduced the Anti-fraud Locator using EBT Retailer Transactions (ALERT) system. The ALERT system analyzes EBT transaction data and identifies transaction patterns that suggest fraud. FNS reviews the information, along with store characteristics and many other factors. If after examination, the store is judged to be in violation, a charge letter is issued.
All stores charged with trafficking have an opportunity to respond prior to the Agency’s determination. Following a formal trafficking determination, the store is permanently disqualified. Retailers may request an administrative review of the sanction action, followed by an opportunity for judicial review.
DATA SOURCES AND ESTABLISHING MASTER DATA FILES
The data used in deriving these estimates are from the Store Tracking and Redemption System (STARS) database, and Census data sources.
STARS
The primary source of data for this study is STARS. The data generated from STARS includes retailer characteristics, redemption histories, and compliance activities.
Extent of SNAP Trafficking: 2009–2011 B-2 August 2013
Authorized Food Retailer Characteristics and Redemption Histories
STARS contains characteristics for all food retailers ever authorized under the Supplemental Nutrition Assistance Program (SNAP). Although this database file contains extensive information on authorized SNAP retailers, only a few data fields are relevant to this study. They include:
Store identification number—This number is assigned by FNS to uniquely identify the retailer.
Store or business type—Prior to June 2007, these categories were self-declared by the retailer according to categories specified on the SNAP application form and verified by an FNS Field Office worker. As of June 2007, a new business-type classification schema was established, and retailers were classified by FNS staff using multiple variables on the application form and a set of business rules. This change raised an issue regarding which classifications to use for this set of estimates. In the last study, a comparison was made to identify the impact of the new store classification schema on the estimates, with a conclusion that this impact was not a strong one.
Location information (including ZIP Code)—This information is provided by the retailer on the application form and, when possible, verified against the address provided. The information represents the actual location of the store, rather than the mailing address. This information is used to locate the retailer in a correct ZIP Code Tabulation Area (ZCTA) and link the information to the demographic characteristics of that area from Census data.
Ownership type (private or public)—Retailers are required to indicate ownership type on the application form. One category allows the retailer to specify that the store is publicly owned. This is the categorical variable used to differentiate privately owned from publicly traded retailers.
The location, ownership, and sales information are verified and updated when the store is reauthorized. STARS also contains monthly redemption histories for all authorized stores. The unique store identification number allows the linkage of redemption information to the retailer characteristics information.
Investigations and Administrative Action Data
In studies prior to the 2002–2005 update, data files maintained by RIB were used for investigations. In general, these files offered the following data elements for each investigated case: Store identification number, Case number, and Outcome (trafficking/no trafficking). For this 2009-2011 study period and the two prior study periods, the data on investigation-based and EBT data-based cases has been maintained within STARS. STARS contains histories for all

Extent of SNAP Trafficking: 2009–2011 B-3 August 2013
cases scrutinized by FNS. These histories are maintained and described by a series of event and outcome codes. The identification of trafficking can be inferred from the events, activities, and activity outcomes (see Appendix E for details).
Watch List
The Watch List includes authorized food retailers that exceeded an ALERT score threshold and met other criteria that trigger additional scrutiny. It was used in the denominator of the trafficking estimate. Only closed Watch List cases were used for this analysis, and the store identification number was the single data element extracted.
Census Data
Data from the Census Bureau were used for identifying the degree of poverty and urbanization associated with retailer locations. The geographic unit of focus for this study was the Census ZCTA, which closely corresponds to U.S. Postal Service ZIP Code areas. Although many SNAP retailers can be associated with a particular ZCTA through their locational ZIP Code information,1 some cannot; therefore, a labor-intensive effort was undertaken to determine the ZCTA nearest to those stores.2 Information on urbanization, calculated from the number of persons classified as urban in the ZCTA, was derived from information generated from the 2010 Census effort. Information on poverty was generated from the American Community Survey, and represents the number of households in poverty within the last six months prior to the survey. Although the American Community Survey is an annual survey, various locations are surveyed each year, and can only provide a national profile at the ZIP Code level from a five-year aggregate.
CREATION OF ANALYSIS FILES
A single analysis file was created from the data sources described above. The file was limited to all retailers that had positive redemptions between January 2009 and December 2011 and were located in the contiguous United States.3 Also eliminated were military commissaries. Household poverty and urbanization levels associated with each retailer’s Census ZCTA designation were added. Edits were made to modify and collapse store-type and ownership fields. In addition, case data from STARS were added.
1 The STARS system contains both the mailing and location addresses of the retailer. The mailing address could differ from the location since in the case of chains it usually refers to a national, regional, or local office and not to the store itself. 2 The ZCTA had the aim of providing areas approximating postal ZIP Code areas and providing demographics for those areas. There are many business areas with their own ZIP Codes or smaller residential areas that are combined with other areas to form the ZCTA. 3 There were a handful of retailers that had negative redemption amounts for this period. They were not included in the analysis file.
Extent of SNAP Trafficking: 2009–2011 B-4 August 2013
These case data included: All investigations conducted by RIB during the timeframe; All investigations conducted by OIG, the States, or other authorities during the timeframe; All cases in which a charge letter was sent to the retailer during the timeframe; All cases in which there was a permanent disqualification or in which a civil money penalty
was assessed in lieu of permanent disqualification; and All cases on the Watch List that were closed during the timeframe. The resulting case file is structured so that a particular retailer may be represented several times as the retailer enters and leaves particular action steps within the case-development process. The retailer may also be subjected to one or more of the above actions (e.g., a retailer may have trafficked with a RIB investigator and may have also received a charge letter). To avoid multiple representations of a single retailer, we included only one case per retailer, selecting the case that represented a positive trafficking determination. Thus, if a retailer was represented in two cases, one with no finding of trafficking and one with a finding of trafficking, the latter was included. If none of the cases resulted in a positive trafficking determination, the retailer was coded as “investigated but no trafficking found.”
APPENDIX C
POST-STRATIFICATION ESTIMATION METHODOLOGY
Extent of SNAP Trafficking: 2009–2011 C-1 August 2013
KEY STEPS FOR USING POST-STRATIFICATION TO ESTIMATE TRAFFICKING
Estimates for 2009–2011 were based on the approach used in previous updates. The steps are as follows: 1. Retailers that were examined or investigated based on questionable transaction patterns were
assigned to categories associated with five variables: type of store, type of ownership, level of Supplemental Nutrition Assistance Program (SNAP) redemption, population density associated with the store’s ZIP Code, and poverty level associated with the store’s ZIP Code. Each store was counted only once.1 The same procedure was applied to the corresponding amount of SNAP redemptions transacted by each of these retailers. This activity produced two five-dimensional tables—one for retailers and one for redemptions. Each table contained 1,120 cells.
2. All stores and the dollar value of SNAP benefits redeemed during the 2009–2011 timeframe
were aggregated by the five variables described in step 1 to create five separate marginal distributions, each corresponding to a particular dimension as defined in step 1.
3. An analytic procedure known as raking was used to create weights for each category of store
type and location. Raking is an iterative process by which the cell frequencies from the sample (the tables generated in step 1) are adjusted to the population marginal frequencies (the product of step 2). Weights were obtained separately for stores and redemptions.
4. The weights produced in step 3 were applied to the file of SNAP retailers examined or
investigated during the 2009–2011 timeframe in order to estimate the total number of stores engaging in trafficking and the amount of benefits redeemed that were trafficked.
5. Adjustments were made to the estimated dollar value of trafficked benefits because even among violating stores, it is unlikely that all SNAP sales are trafficked. We made the assumption that 90 percent of redemptions in violating small stores were trafficked, and 40 percent in violating large stores were trafficked.
6. The trafficking rate (i.e., the percentage of all redemptions estimated to be trafficked) and
store violation rate (i.e., the percentage of stores trafficking) were calculated. See Appendix I for details of the sensitivity analyses that were conducted with respect to some of the methodological decisions and assumptions associated with these procedures.
1 The variable descriptions and specific categories within each variable are provided in Appendix D.
APPENDIX D
VARIABLES EMPLOYED IN THE RAKING MODEL

Extent of SNAP Trafficking: 2009–2011 D-1 August 2013
The five dimensions we employed consist of three that categorize stores (type of store, ownership type, and amount of Supplemental Nutrition Assistance Program (SNAP) redemptions) and two that categorize the ZIP Codes in which stores were located (degree of urbanization and percentage of households below the poverty level). Specific definitions are provided in the following sections.
TYPE OF STORE
Experience, backed up by years of research, has indicated that type of store is an important differentiator in trafficking. In particular, and according to these analyses, larger stores do not traffic as much as smaller stores.
In June 2007, FNS instituted a new store, or business type, classification scheme that used a set of business rules to classify retailers, instead of relying on retailer self-reports.1 We summarized retailers according to the new store-type codes, according to the following categories:
Supermarkets, Large groceries, Medium-sized groceries, Small groceries, Convenience stores, Specialty food stores, and Combination/other food stores.
OWNERSHIP TYPE
Ownership types as indicated on the FNS application form were collapsed into the following categories to ensure an adequate number of cases of each type: Private—Any store identifying itself as other than publicly owned. This includes private
(i.e., closely held) corporations as well as partnerships, sole proprietorships, and co-ops; and Public—Any store identifying itself as a public corporation (i.e., a retailer whose stock is
publicly traded).
AMOUNT OF SNAP REDEMPTIONS
Stores were categorized into deciles on the basis of SNAP redemptions. Although the original intent was statistical, rather than analytical (i.e., to ensure that large disparities in redemptions by stores did not distort results), the variable was useful as a size measure that could be used in conjunction with the store type measure.
1 Prior to 2007, store type was based on the combination of a self-reported store type variable and gross sales. All reports preceding the 2006–2008 study were based on the older store type category. In the last report (2006–2008), a comparative analysis of the old and new store type classifications was conducted—showing little if any impact on the estimates. For more information on the older store types, see the 2006–2008 report.

Extent of SNAP Trafficking: 2009–2011 D-2 August 2013
DEGREE OF URBANIZATION
The urbanization variable was based on data collected for the 2010 U.S. Census. The Census provides for each ZIP Code Tabulation Area (ZCTA) an estimate of the number of individuals in that ZCTA who could be considered living in an urban area. This was divided by the total number of individuals in that area, which was available from the same data source. Four categories were used that reflected an analysis conducted in 1993 for the first trafficking study. Their selection reflects our attempt to distribute stores across a range of categories to achieve some balance as well as create meaningful distinctions. These categories were:
0–10 percent urban population, 11–50 percent urban population, 51–90 percent urban population, and More than 90 percent urban population.
PERCENTAGE OF HOUSEHOLDS BELOW THE POVERTY LEVEL
The percentage of households below the poverty level was based on U.S. Census data for the ZIP Code in which each store was located. Again, data from the 2010 Census files were used. The total number of households in poverty within a ZCTA was divided by the total number of households in that area. As with the urbanization categories, the poverty-level categories were established for the 1993 study. Again, we attempted to establish a meaningful range for describing neighborhoods by poverty level while creating some balance in store totals across categories. Four categories were used: 0–10 percent of the residential population below the poverty level, 11–20 percent of the residential population below the poverty level, 21–30 percent of the residential population below the poverty level, and More than 30 percent of the residential population below the poverty level.

APPENDIX E
ESTIMATE DEFINITION
Extent of SNAP Trafficking: 2009–2011 E-1 August 2013
Prior to the trafficking study encompassing the 2002–2005 period, the investigative sample contained information based on FNS conducted investigations and administrative actions involving the issuance of charge letters. In 2002–2005, two new sets of data were introduced. First, we included Watch List cases. The introduction of the Watch List had two effects. First, more retailers came under special systematic scrutiny (i.e., their status had to be resolved by field office staff). This increase resulted in a broader base of retailers subject to additional review (see the retailer distribution comparisons within the sensitivity analyses in Appendix I), and we expect that this larger population is more representative of the authorized retailer population as a whole. Second, the Watch List created an interactive system among investigators and those conducting retailer reviews that may have influenced the kinds of cases that were referred for investigation. The estimate reported in this study included all currently available data sources for FNS investigations. It also included OIG investigations, State investigations, and investigations by other agencies. Key terms were defined as follows: Denominator:
All cases in which Event Code = “03” (completed investigation) and Investigation Agency = “CB,” “OI,” “SL,” or “OT” (i.e., RIB, OIG, States, or other agency); or
All cases in which a retailer was sent a charge letter; or All administrative (EBT) cases where the store was permanently disqualified or paid
compensation in lieu of permanent disqualification; or Any retailer on the Watch List with a status of closed, which are all cases that have been
resolved by a determination.1
Numerator: Any case in which the Event Code = “03” (completed investigation) and Investigation
Code = “CB” (i.e., RIB) and the trafficking flag is “1”; or Any case in which the Event Code = “03” (completed investigation) and Investigation
Code = “OI,” “SL,” or “OT” (i.e., OIG, States, or other agency) and the result is a positive violation; or
Any case in which the retailer was permanently disqualified or assessed a civil money penalty in lieu of a permanent disqualification.2
Both the denominator and numerator come from unduplicated lists of retailers meeting one or more of these conditions. In other words, a retailer was counted only once, regardless of the number of times it was identified. In this and previous measures, a conservative approach was used that assumed that the retailer was counted in the numerator if there was any indication of permanent disqualification or trafficking at any point during the administrative or investigative process.
1 Resolution involves any of the following statuses: 1) No Further Action (NFA), 2) Store Disqualified, 3) Store Withdrawn, 4) No Case Action (NCA), 5) Sanction Action, and 6) Other Adverse Action. The two statuses “NFA” and “NCA” are associated with determinations that for one reason or another, the store did not violate SNAP regulations. 2 This includes stores that had an EBT (administrative) case and were permanently disqualified as well as those that received trafficking charge letters, but may not have been permanently disqualified in the end.

APPENDIX F
STATISTICS ON INVESTIGATIONS AND ADMINISTRATIVE ACTIONS

Extent of SNAP Trafficking: 2009–2011 F-1 August 2013
This appendix provides statistics for retailers by the criteria for defining the denominator (a store that has been investigated and has received a charge letter, or has been put on the Watch List). In other words, it defines the sample.
Exhibit F1: Redemptions, Retailer Count, and Trafficking Statistics for Investigated Retailers during 2009–2011, by Retailer Type
Exhibit F2: Redemptions, Retailer Count, and Trafficking Statistics for Investigated Retailers during 2009–2011, by Ownership Type
Exhibit F3: Redemptions, Retailer Count, and Trafficking Statistics for Investigated Retailers during 2009–2011, by Poverty Level of Retailer’s Neighborhood
Exhibit F4: Redemptions, Retailer Count, and Trafficking Statistics for Investigated Retailers during 2009–2011, by Urbanization Level of Retailer’s Neighborhood

Extent of SNAP Trafficking: 2009–2011 F-2 August 2013
Exhibit F1: Redemptions, Retailer Count, and Trafficking Statistics for Investigated Retailers during 2009–2011, by Retailer Type
Type of Store Total
Redemptions Amount of Trafficking
Trafficking Rate
Total Stores
Trafficking Stores
Store Violation
Rate
Large Stores
Supermarkets $5,877,782,928 $48,497,536 0.83% 1,584 10 0.63%
Large groceries $2,279,052,657 $27,891,599 1.22% 1,496 13 0.87%
Subtotal $8,156,835,585 $76,389,135 0.94% 3,080 23 0.75%
Small Stores
Medium-sized groceries $2,370,093,420 $129,179,813 5.45% 3,775 278 7.36%
Small groceries $1,629,722,363 $335,826,058 20.61% 5,626 1,061 18.86%
Convenience $2,318,048,524 $344,544,789 14.86% 11,323 1,898 16.76%
Specialty $1,506,640,694 $39,711,442 2.64% 1,862 96 5.16%
Combination/other $4,238,677,811 $38,714,657 0.91% 2,613 78 2.99%
Subtotal $12,063,182,812 $887,976,759 7.36% 25,199 3,411 13.54%
All stores $20,220,018,397 $964,365,894 4.77% 28,279 3,434 12.14%
Exhibit F2: Redemptions, Retailer Count, and Trafficking Statistics for Investigated Retailers during 2009–2011, by Ownership Type
Store Ownership
Type Total Redemptions
Amount of Trafficking
Trafficking Rate
Total Stores
Trafficking Stores
Store Violation
Rate
Privately owned stores $17,214,490,678 $963,835,396 5.60% 27,489 3,432 12.49%
Publicly owned stores
$3,005,527,719 $530,498 0.02% 790 2 0.25%
All stores $20,220,018,397 $964,365,894 4.77% 28,279 3,434 12.14%
Extent of SNAP Trafficking: 2009–2011 F-3 August 2013
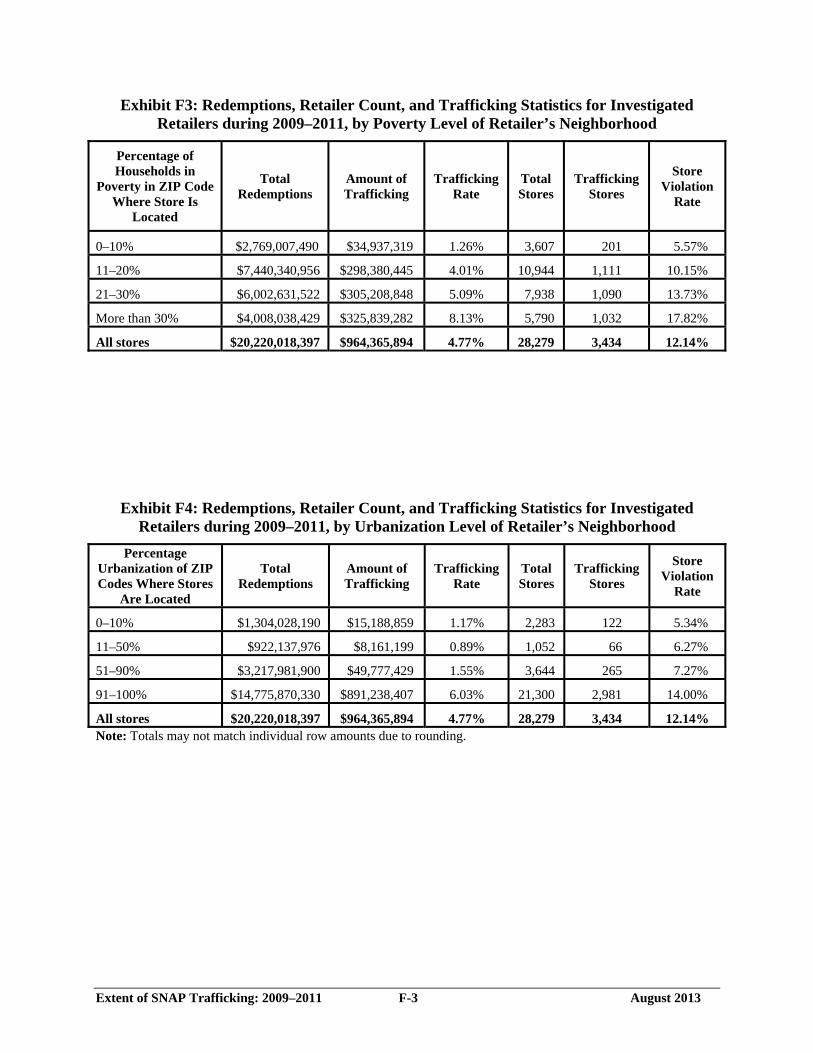
Exhibit F3: Redemptions, Retailer Count, and Trafficking Statistics for Investigated Retailers during 2009–2011, by Poverty Level of Retailer’s Neighborhood
Percentage of Households in
Poverty in ZIP Code Where Store Is
Located
Total Redemptions
Amount of Trafficking
Trafficking Rate
Total Stores
Trafficking Stores
Store Violation
Rate
0–10% $2,769,007,490 $34,937,319 1.26% 3,607 201 5.57%
11–20% $7,440,340,956 $298,380,445 4.01% 10,944 1,111 10.15%
21–30% $6,002,631,522 $305,208,848 5.09% 7,938 1,090 13.73%
More than 30% $4,008,038,429 $325,839,282 8.13% 5,790 1,032 17.82%
All stores $20,220,018,397 $964,365,894 4.77% 28,279 3,434 12.14%
Exhibit F4: Redemptions, Retailer Count, and Trafficking Statistics for Investigated Retailers during 2009–2011, by Urbanization Level of Retailer’s Neighborhood
Percentage Urbanization of ZIP Codes Where Stores
Are Located
Total Redemptions
Amount of Trafficking
Trafficking Rate
Total Stores
Trafficking Stores
Store Violation
Rate
0–10% $1,304,028,190 $15,188,859 1.17% 2,283 122 5.34%
11–50% $922,137,976 $8,161,199 0.89% 1,052 66 6.27%
51–90% $3,217,981,900 $49,777,429 1.55% 3,644 265 7.27%
91–100% $14,775,870,330 $891,238,407 6.03% 21,300 2,981 14.00%
All stores $20,220,018,397 $964,365,894 4.77% 28,279 3,434 12.14% Note: Totals may not match individual row amounts due to rounding.

APPENDIX G
STATISTICS ON COMPARISONS BETWEEN RETAILERS IN THE INVESTIGATIVE SAMPLE AND IN THE POPULATION OF RETAILERS
Extent of SNAP Trafficking: 2009–2011 G-1 August 2013
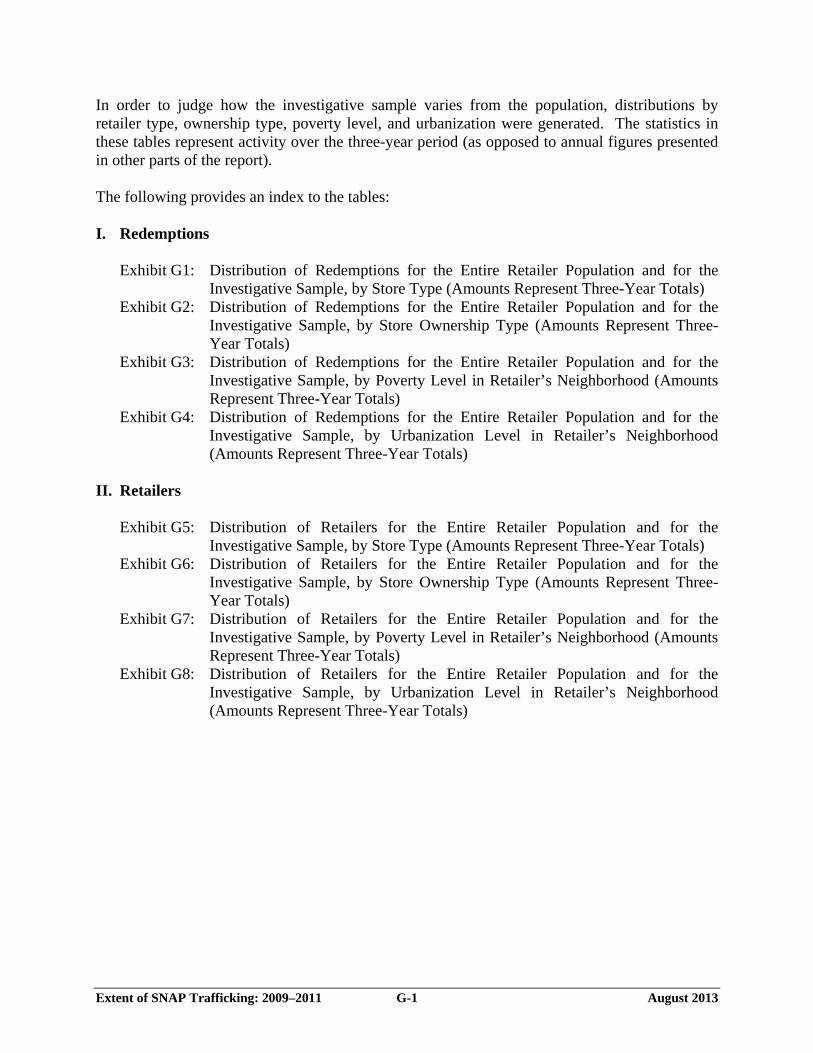
In order to judge how the investigative sample varies from the population, distributions by retailer type, ownership type, poverty level, and urbanization were generated. The statistics in these tables represent activity over the three-year period (as opposed to annual figures presented in other parts of the report). The following provides an index to the tables: I. Redemptions
Exhibit G1: Distribution of Redemptions for the Entire Retailer Population and for the Investigative Sample, by Store Type (Amounts Represent Three-Year Totals)
Exhibit G2: Distribution of Redemptions for the Entire Retailer Population and for the Investigative Sample, by Store Ownership Type (Amounts Represent Three-Year Totals)
Exhibit G3: Distribution of Redemptions for the Entire Retailer Population and for the Investigative Sample, by Poverty Level in Retailer’s Neighborhood (Amounts Represent Three-Year Totals)
Exhibit G4: Distribution of Redemptions for the Entire Retailer Population and for the Investigative Sample, by Urbanization Level in Retailer’s Neighborhood (Amounts Represent Three-Year Totals)
II. Retailers
Exhibit G5: Distribution of Retailers for the Entire Retailer Population and for the Investigative Sample, by Store Type (Amounts Represent Three-Year Totals)
Exhibit G6: Distribution of Retailers for the Entire Retailer Population and for the Investigative Sample, by Store Ownership Type (Amounts Represent Three-Year Totals)
Exhibit G7: Distribution of Retailers for the Entire Retailer Population and for the Investigative Sample, by Poverty Level in Retailer’s Neighborhood (Amounts Represent Three-Year Totals)
Exhibit G8: Distribution of Retailers for the Entire Retailer Population and for the Investigative Sample, by Urbanization Level in Retailer’s Neighborhood (Amounts Represent Three-Year Totals)

Extent of SNAP Trafficking: 2009–2011 G-2 August 2013
Exhibit G1: Distribution of Redemptions for the Entire Retailer Population and for the Investigative Sample, by Store Type (Amounts Represent Three-Year Totals)
Type of Store Total Redemptions for the Population
Redemptions for the Investigative Sample
Amount Pct. Amount Pct.
Large Stores
Supermarkets $159,463,263,875 83.39% $5,877,782,928 29.07%
Large groceries $3,162,209,485 1.65% $2,279,052,657 11.27%
Subtotal $162,625,473,360 85.04% $8,156,835,585 40.34%
Small Stores
Medium-sized groceries $4,099,435,025 2.14% $2,370,093,420 11.72%
Small groceries $3,258,200,645 1.70% $1,629,722,363 8.06%
Convenience $8,376,316,569 4.38% $2,318,048,524 11.46%
Specialty $3,005,480,717 1.57% $1,506,640,694 7.45%
Combination/other $9,867,210,344 5.16% $4,238,677,811 20.96%
Subtotal $28,606,643,300 14.95% $12,063,182,812 59.65%
All stores $191,232,116,661 100.00% $20,220,018,397 100.00% Note: Totals may not match individual row amounts due to rounding.
Exhibit G2: Distribution of Redemptions for the Entire Retailer Population and for the Investigative Sample, by Store Ownership Type (Amounts Represent Three-Year Totals)
Store Ownership Type
Total Redemptions for the Population Redemptions for the Investigative
Sample
Amount Pct. Amount Pct.
Privately owned stores $106,600,474,053 55.74% $17,214,490,678 85.14%
Publicly owned stores $84,631,642,608 44.26% $3,005,527,719 14.86%
All stores $191,232,116,661 100.00% $20,220,018,397 100.00%

Extent of SNAP Trafficking: 2009–2011 G-3 August 2013
Exhibit G3: Distribution of Redemptions for the Entire Retailer Population and for the Investigative Sample, by Poverty Level in Retailer’s Neighborhood (Amounts Represent
Three-Year Totals)
Percentage of Households in
Poverty in ZIP Code Where Store Is
Located
Total Redemptions for the Population Redemptions for the Investigative
Sample
Amount Pct. Amount Pct.
0–10% $38,998,165,423 20.39% $2,769,007,490 13.69%
11–20% $87,761,975,562 45.89% $7,440,340,956 36.80%
21–30% $44,407,319,860 23.22% $6,002,631,522 29.69%
More than 30% $20,064,655,816 10.49% $4,008,038,429 19.82%
All stores $191,232,116,661 100.00% $20,220,018,397 100.00% Note: Totals may not match individual row amounts due to rounding.
Exhibit G4: Distribution of Redemptions for the Entire Retailer Population and for the Investigative Sample, by Urbanization Level in Retailer’s Neighborhood (Amounts
Represent Three-Year Totals)
Percentage Urbanization of ZIP Codes Where Stores
Are Located
Total Redemptions for the Population Redemptions for the Investigative
Sample
Amount Pct. Amount Pct.
0–10% $6,541,704,396 3.42% $1,304,028,190 6.45%
11–50% $11,006,474,026 5.76% $922,137,976 4.56%
51–90% $45,261,604,104 23.67% $3,217,981,900 15.91%
91–100% $128,422,334,135 67.16% $14,775,870,330 73.08%
All stores $191,232,116,661 100.00% $20,220,018,397 100.00% Note: Totals may not match individual row amounts due to rounding.

Extent of SNAP Trafficking: 2009–2011 G-4 August 2013
Exhibit G5: Distribution of Retailers for the Entire Retailer Population and for the Investigative Sample, by Store Type (Amounts Represent Three-Year Totals)
Type of Store Total Retailers for the Population Retailers for the Investigative Sample
Stores Pct. Stores Pct.
Large Stores
Supermarkets 38,968 14.70% 1,584 5.60%
Large groceries 4,205 1.59% 1,496 5.29%
Subtotal 43,173 16.29% 3,080 10.89%
Small Stores
Medium-sized groceries 14,220 5.36% 3,775 13.35%
Small groceries 23,868 9.00% 5,626 19.89%
Convenience 108,087 40.76% 11,323 40.04%
Specialty 15,173 5.72% 1,862 6.58%
Combination/other 60,651 22.87% 2,613 9.24%
Subtotal 221,999 83.71% 25,199 89.10%
All stores 265,172 100.00% 28,279 100.00% Note: Totals may not match individual row amounts due to rounding.
Exhibit G6: Distribution of Retailers for the Entire Retailer Population and for the Investigative Sample, by Store Ownership Type (Amounts Represent Three-Year Totals)
Store Ownership Type
Total Retailers for the Population Retailers for the Investigative Sample
Stores Pct. Stores Pct.
Privately owned stores 195,983 73.91% 27,489 97.21%
Publicly owned stores 69,189 26.09% 790 2.79%
All stores 265,172 100.00% 28,279 100.00%

Extent of SNAP Trafficking: 2009–2011 G-5 August 2013
Exhibit G7: Distribution of Retailers for the Entire Retailer Population and for the Investigative Sample, by Poverty Level in Retailer’s Neighborhood (Amounts Represent
Three-Year Totals)
Percentage of Households in Poverty in ZIP
Code Where Store Is Located
Total Retailers for the Population Retailers for the Investigative Sample
Stores Pct. Stores Pct.
0–10% 64,436 24.30% 3,607 12.76%
11–20% 115,252 43.46% 10,944 38.70%
21–30% 56,867 21.45% 7,938 28.07%
More than 30% 28,617 10.79% 5,790 20.47%
All stores 265,172 100.00% 28,279 100.00%
Exhibit G8: Distribution of Retailers for the Entire Retailer Population and for the Investigative Sample, by Urbanization Level in Retailer’s Neighborhood (Amounts
Represent Three-Year Totals)
Percentage Urbanization of
ZIP Codes Where Stores Are Located
Total Retailers for the Population Retailers for the Investigative Sample
Stores Pct. Stores Pct.
0–10% 25,759 9.71% 2,283 8.07%
11–50% 16,212 6.11% 1,052 3.72%
51–90% 56,638 21.36% 3,644 12.89%
91–100% 166,563 62.81% 21,300 75.32%
All stores 265,172 100.00% 28,279 100.00% Note: Totals may not match individual row amounts due to rounding.

APPENDIX H
ESTIMATE INTERVALS

Extent of SNAP Trafficking: 2009–2011 H-1 August 2013
The estimates provided in the main body of the report were generated using the data raking algorithm on the complete set of cases in the investigation sample (i.e., 28,279 retailers). Because in all instances the cases constitute a sample, there is some basis for examining how the estimate could vary if the cases chosen for investigation or for administrative follow-up were different. To simulate this variation, and to establish boundaries around the estimates, we generated estimates based on iteratively sampling the investigative sample. It should be noted that because the sample is selected in a purposive manner, the interpretation of the intervals is not consistent with the interpretation if the sample were based on probability sampling. It is also not intended to allow significance testing across years. The process involved selecting a random sample of 10,000 retailers from the investigative sample and using the raking algorithm to provide 2,000 different estimates. The 2,000 values were then processed to provide mean values (for store and redemption values and rates) and fifth and ninety-fifth percentile values for each of the variables. Overall, the average of these results, as seen in the following table, was relatively close to the estimates presented in the main body of the report. Percentiles were calculated by ordering the results and then reporting the cut points for the lowest five percent and highest 95 percent of values.
Comparison of Raked-Only Value versus Simulated Iterative Value
Set of Trafficking Estimates Estimated Redemptions Trafficked Estimated Stores Trafficking
Annualized Amount (in millions)
Rate Number Rate
Raked-only value $858 1.35 27,770 10.47 Simulated iterative value $848 1.33 27,777 10.48
In addition to those produced for the national estimates, intervals were also produced on the basis of store type, ownership type, poverty level, and urbanization. The values provide rough indications of how the estimates for each level of these variables would have been affected if different stores were selected for investigation or administrative review. However, care should be taken in the interpretation and use of these estimate intervals. They are derived from smaller samples and thus, are subject to the vagaries of the sampling process. It should also be noted that the amounts representing the fifth and ninety-fifth percentiles are not necessarily reflected in the rates. The procedure estimated the fifth and ninety-fifth percentiles for amounts and rates separately. This resulted in different values for rates than would occur if the amounts were divided by total annualized redemptions. Nevertheless, the values should closely approximate the rates as if the amounts were used.

Extent of SNAP Trafficking: 2009–2011 H-2 August 2013
The following provides an index to the tables:
Exhibit H1: Intervals for Annualized Redemption Dollars Trafficked and Retailers Trafficking for All Retailers
Exhibit H2: Intervals for Annualized Redemption Dollars Trafficked and Retailers Trafficking, by Store Type
Exhibit H3: Intervals for Annualized Redemption Dollars Trafficked and Retailers Trafficking, by Store Ownership Type
Exhibit H4: Intervals for Annualized Redemption Dollars Trafficked and Retailers Trafficking, by Poverty Level of Retailer’s Neighborhood
Exhibit H5: Intervals for Annualized Redemption Dollars Trafficked and Retailers Trafficking, by Urbanization Level of Retailer’s Neighborhood

Extent of SNAP Trafficking: 2009–2011 H-3 August 2013
Exhibit H1: Intervals for Annualized Redemption Dollars Trafficked and Retailers Trafficking for All Retailers
Store Type
Estimate and Intervals for Trafficked Redemptions
Estimate and Intervals for Trafficking Stores
Dollars Trafficked
Intervals Retailers
Trafficking
Intervals
5th Percentile
95th Percentile
5th Percentile
95th Percentile
All stores
Estimate $848,372,684 $789,671,581 $909,465,208 27,777 25,968 29,858
Rate 1.33% 1.24% 1.43% 10.48% 9.79% 11.26%
Exhibit H2: Intervals for Annualized Redemption Dollars Trafficked and Retailers Trafficking, by Store Type
Store Type
Estimate and Intervals for Trafficked Redemptions
Estimate and Intervals for Trafficking Stores
Dollars Trafficked
Intervals Retailers
Trafficking
Intervals
5th Percentile
95th Percentile
5th Percentile
95th Percentile
Supermarkets
Estimate $116,493,735 $51,479,725 $174,038,023 137 8 317
Rate 0.22% 0.10% 0.33% 0.35% 0.02% 0.81%
Large groceries
Estimate $4,533,253 $2,453,869 $6,134,221 37 7 73
Rate 0.43% 0.23% 0.58% 0.87% 0.17% 1.73% Medium-sized groceries
Estimate $75,817,713 $70,063,195 $81,671,328 1,322 936 1,708
Rate 5.55% 5.13% 5.98% 9.29% 6.58% 12.01%
Small groceries
Estimate $187,815,519 $180,318,123 $194,264,222 4,258 3,761 4,750
Rate 17.29% 16.60% 17.89% 17.84% 15.76% 19.90%
Convenience
Estimate $393,346,861 $381,981,896 $403,457,483 19,121 17,614 20,731
Rate 14.09% 13.68% 14.45% 17.69% 16.30% 19.18%
Specialty
Estimate $34,447,179 $30,078,624 $39,057,406 1,295 776 1,942
Rate 3.44% 3.00% 3.90% 8.54% 5.11% 12.80%
Combination/ other
Estimate $35,918,424 $29,820,257 $40,678,939 1,607 975 2,470
Rate 1.09% 0.91% 1.24% 2.65% 1.61% 4.07%
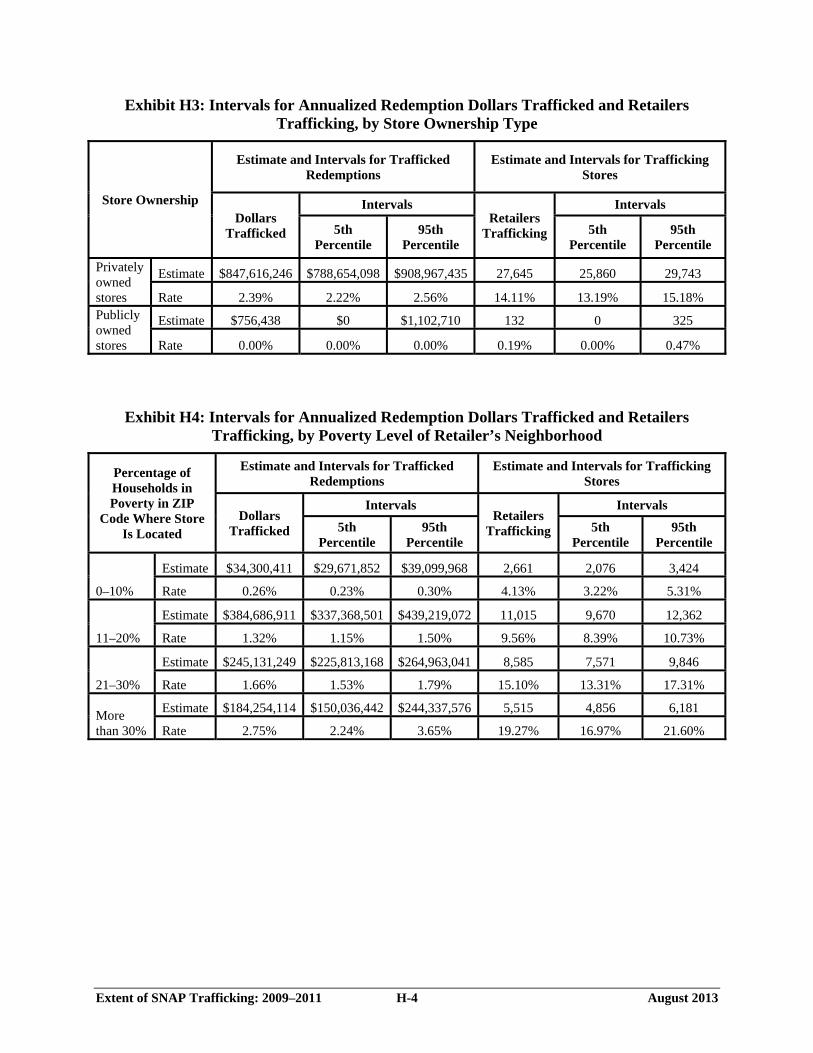
Extent of SNAP Trafficking: 2009–2011 H-4 August 2013
Exhibit H3: Intervals for Annualized Redemption Dollars Trafficked and Retailers Trafficking, by Store Ownership Type
Store Ownership
Estimate and Intervals for Trafficked Redemptions
Estimate and Intervals for Trafficking Stores
Dollars Trafficked
Intervals Retailers
Trafficking
Intervals
5th Percentile
95th Percentile
5th Percentile
95th Percentile
Privately owned stores
Estimate $847,616,246 $788,654,098 $908,967,435 27,645 25,860 29,743
Rate 2.39% 2.22% 2.56% 14.11% 13.19% 15.18% Publicly owned stores
Estimate $756,438 $0 $1,102,710 132 0 325
Rate 0.00% 0.00% 0.00% 0.19% 0.00% 0.47%
Exhibit H4: Intervals for Annualized Redemption Dollars Trafficked and Retailers Trafficking, by Poverty Level of Retailer’s Neighborhood
Percentage of Households in Poverty in ZIP
Code Where Store Is Located
Estimate and Intervals for Trafficked Redemptions
Estimate and Intervals for Trafficking Stores
Dollars Trafficked
Intervals Retailers
Trafficking
Intervals
5th Percentile
95th Percentile
5th Percentile
95th Percentile
0–10%
Estimate $34,300,411 $29,671,852 $39,099,968 2,661 2,076 3,424
Rate 0.26% 0.23% 0.30% 4.13% 3.22% 5.31%
11–20%
Estimate $384,686,911 $337,368,501 $439,219,072 11,015 9,670 12,362
Rate 1.32% 1.15% 1.50% 9.56% 8.39% 10.73%
21–30%
Estimate $245,131,249 $225,813,168 $264,963,041 8,585 7,571 9,846
Rate 1.66% 1.53% 1.79% 15.10% 13.31% 17.31%
More than 30%
Estimate $184,254,114 $150,036,442 $244,337,576 5,515 4,856 6,181
Rate 2.75% 2.24% 3.65% 19.27% 16.97% 21.60%

Extent of SNAP Trafficking: 2009–2011 H-5 August 2013
Exhibit H5: Intervals for Annualized Redemption Dollars Trafficked and Retailers Trafficking, by Urbanization Level of Retailer’s Neighborhood
Percentage Urbanization in
ZIP Code Where Store Is Located
Estimate and Intervals for Trafficked Redemptions
Estimate and Intervals for Trafficking Stores
Dollars Trafficked
Intervals Retailers
Trafficking
Intervals
5th Percentile
95th Percentile
5th Percentile
95th Percentile
0–10%
Estimate $14,453,028 $12,533,246 $16,103,126 2,361 1,673 2,940
Rate 0.66% 0.57% 0.74% 9.17% 6.49% 11.41%
11–50%
Estimate $11,725,666 $9,479,965 $14,366,311 1,603 987 2,148
Rate 0.32% 0.26% 0.39% 9.89% 6.09% 13.25%
51–90%
Estimate $72,414,029 $64,418,975 $79,545,236 4,193 3,217 5,182
Rate 0.48% 0.43% 0.53% 7.40% 5.68% 9.15%
91–100%
Estimate $749,779,960 $687,268,603 $814,916,888 19,620 18,306 21,387
Rate 1.75% 1.61% 1.90% 11.78% 10.99% 12.84%

APPENDIX I
SENSITIVITY OF ESTIMATES TO VIOLATION DEFINITIONS
Extent of SNAP Trafficking: 2009–2011 I-1 August 2013
The estimates derived through the raking procedure for the population of Supplemental Nutrition Assistance Program (SNAP) retailers reflect the sample of suspicious cases. The sample constitutes all cases in which an undercover investigation was conducted by the Food and Nutrition Service (FNS); retailers that received a charge letter and those that received a permanent disqualification or a civil money penalty in lieu of permanent disqualification; FNS Office of the Inspector General (OIG) and State law enforcement bureau (SLEB) cases and positive outcomes associated with these investigations; and all closed Watch List cases. It is critical to note that there is some uncertainty about what types of cases should be defined as investigatory; therefore, the size of the denominator for the estimates could arguably be expanded or contracted. Similarly, the numerator for the estimates is dependent on how trafficking is defined. Clearly, if a retailer traffics with an undercover FNS investigator, it is a violation. It is less clear that permanent disqualification or compensation civil money penalty in lieu of permanent disqualification after the retailer is given a charge letter constitutes trafficking. A case might also be made that any violation, including the selling of ineligible items, is at least a strong indication that the retailer would be willing to traffic and should be included in the numerator of the estimates. In this appendix, we explore the sensitivity of trafficking estimates to such variations in definitions using three additional checks that employ differing criteria for inclusion in the numerator or denominator of the estimate. Exhibit I1 provides the criteria for these checks. The check labeled “All disqualifications” assumes that retailers that have transacted ineligible buys or otherwise violated SNAP regulations would be willing to traffic This assumption, for example, infers that a retailer that sells beer or liquor to someone using SNAP benefits would in all likelihood traffic, if given a viable opportunity. The check labeled “NFA (No Further Action) excepted” assumes that retailers with these designations are not being actively pursued and that there is no reason, after deliberation, to consider them suspicious and no chance to consider them as potential traffickers. The final check assumes that even among the retailers that are given an NFA status, there is a substantial amount of trafficking occurring. The potential of denoting them as traffickers would never be realized. The assumption was that 18 percent of these retailers trafficked. Exhibit I2 provides the outcomes of using these definitions in terms of redemptions trafficked and stores trafficking. As is indicated, the amount trafficked is higher in all cases than the base estimate provided in the report.1 In some cases, the estimates are more than twice as high, both in terms of redemptions trafficked and retailers trafficking. These limits should be considered, in addition to the figures presented in the last section to indicate the possible extent of trafficking.
1 We took three samples for the last random selection measure and averaged the three results. Redemption amounts are annualized.

Extent of SNAP Trafficking: 2009–2011 I-2 August 2013
Exhibit I1: Criteria for Including Retailers as a Violating Case and a Suspicious Case, by Estimate Type
Estimate Type Violating Cases (Numerator) Suspicious Cases (Denominator) Base estimate (present definition)
RIB investigation with a trafficking violation or a permanent disqualification or payment of civil money penalty in lieu of permanent disqualification, or a positive trafficking outcome in an OIG or a SLEB case
RIB investigation or an ALERT system-derived case with the issuance of a charge letter, or an OIG or a SLEB case, or a closed Watch List case, or a permanent disqualification or payment of civil money penalty in lieu of permanent disqualification, or a positive trafficking outcome
All disqualifications Store disqualified, temporarily or permanently, on the Watch List
Same as base estimate
NFA excepted Same as base estimate Same as base estimate except cases designated as NFA on the Watch List are omitted
Random selection of 18% of NFA Watch List retailers assumed trafficking
Same as base estimate with the assumption that 18 percent of the NFA retailers trafficked
Same as base estimate
Exhibit I2: Outcomes Using the Definition Relating to Selection of Retailers into the Sample
Measure Annualized Amount of Trafficking
Trafficking Rate Trafficking
Stores Store Violation
Rate
Current measure $857,763,895 1.35% 27,770 10.47%
All disqualifications $1,389,479,832 2.18% 57,899 21.83%
NFA excepted
$1,208,902,782 1.90% 45,143 17.02% Random selection of 18% of NFA Watch List retailers assumed trafficking
$2,390,601,844
3.75%
49,536
18.68%