the foldback project data report no. 2
TRANSCRIPT
THE FOLDBACK PROJECT DATA REPORT NO. 2
A Data Summary Report for Academic Leaders at “Green Tree Frog School” – July 2020

THE CENTRE FOR CHANGE AND COMPLEXITY IN LEARNING (C3L)
C3L takes a holistic view of the education system and lifelong learning. C3L investigates how present education models can transition to more effectively focus on attributes and processes beyond the cognitive aspect of their curriculum. C3L researches and applies novel approaches that facilitate curriculum models that actively incorporate the skills needed for creative knowledge work, self-regulation, collaboration, and mindsets that enable acceptance of ambiguity and uncertainty. The complex problems that define contemporary education cannot be understood and managed through traditional, often reductionist, research approaches, instead an integrated, holistic, and networked approach is required. The mission and vision for C3L is embodied in a complexity science framework and methodology.
unisa.edu.au/research/c3l/
THE FOLDBACK PROJECT
The Foldback Project forms a framework for collaboration between C3L and the school sector. The name makes reference to music amplification where each musician is provided with the best mix of the music—the information—to support a high quality performance (Leonard, Fitzgerald, & Bacon, 2016). In a similar way, this report seeks to provide a mix of information that can improve school performance.
The Foldback Project Data Report No. 2:
A Data Summary Report for Academic Leaders at “Green Tree Frog School” – July 2020
JohnPaul Kennedy
Simon N. Leonard
University of South Australia | Education Futures
July 2020
Suggested citation:
Kennedy, JP. & Leonard S. N. (2020). A Data Summary Report for Academic Leaders at Green Tree Frog School (The Foldback Project Data Synopsis, Issue 2). Adelaide: University of South Australia
Centre for Change and Complexity in Learning (C3L) UniSA: Education Futures University of South Australia https://unisa.edu.au/research/c3l/ DISCLAIMER
Information in this publication is correct at the time of release but may be subject to change. This material does not purport to constitute legal or professional advice.
UniSA accepts no responsibility for and makes no representations, whether express or implied, as to the accuracy or reliability in any respect of any material in this publication. Except to the extent mandated otherwise by legislation, UniSA does not accept responsibility for the consequences of any reliance which may be placed on this material by any person. UniSA will not be liable to you or to any other person for any loss or damage (including direct, consequential or economic loss or damage) however caused and whether by negligence or otherwise which may result directly or indirectly from the use of this publication.

EXECUTIVE SUMMARY ........................................................................................................... 2
INTRODUCTION ..................................................................................................................... 2
DATA COLLECTION INSTRUMENTS ........................................................................................ 2
SCHOOL OVERVIEW ............................................................................................................... 2
INTERPRETING THE COMPOSITE ATTITUDE CHARTS ............................................................. 2
USING THE KEY LEARNING AREA CHARTS .............................................................................. 2
ENGLISH ................................................................................................................................. 2
MATHEMATICS ...................................................................................................................... 2
SCIENCE ................................................................................................................................. 2
HUMANITIES AND SOCIAL SCIENCES ..................................................................................... 2
CREATIVE AND PERFORMING ARTS ....................................................................................... 2
PERSONAL DEVELOPMENT, HEALTH AND PHYSICAL EDUCATION ......................................... 2
LANGUAGES OTHER THAN ENGLISH ...................................................................................... 2
TECHNOLOGY AND APPLIED STUDIES .................................................................................... 2
REFERENCES .......................................................................................................................... 2
Table of Contents
1
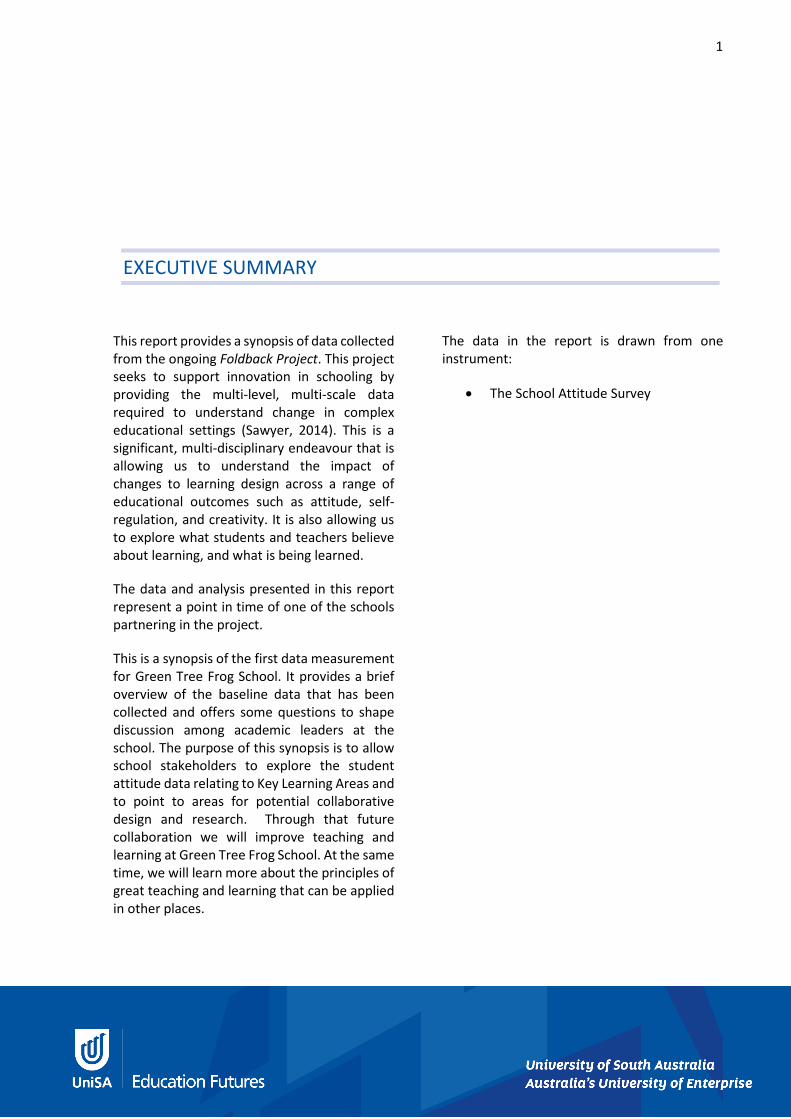
This report provides a synopsis of data collected from the ongoing Foldback Project. This project seeks to support innovation in schooling by providing the multi-level, multi-scale data required to understand change in complex educational settings (Sawyer, 2014). This is a significant, multi-disciplinary endeavour that is allowing us to understand the impact of changes to learning design across a range of educational outcomes such as attitude, self-regulation, and creativity. It is also allowing us to explore what students and teachers believe about learning, and what is being learned.
The data and analysis presented in this report represent a point in time of one of the schools partnering in the project.
This is a synopsis of the first data measurement for Green Tree Frog School. It provides a brief overview of the baseline data that has been collected and offers some questions to shape discussion among academic leaders at the school. The purpose of this synopsis is to allow school stakeholders to explore the student attitude data relating to Key Learning Areas and to point to areas for potential collaborative design and research. Through that future collaboration we will improve teaching and learning at Green Tree Frog School. At the same time, we will learn more about the principles of great teaching and learning that can be applied in other places.
The data in the report is drawn from one instrument:
• The School Attitude Survey
EXECUTIVE SUMMARY
2
Context and background
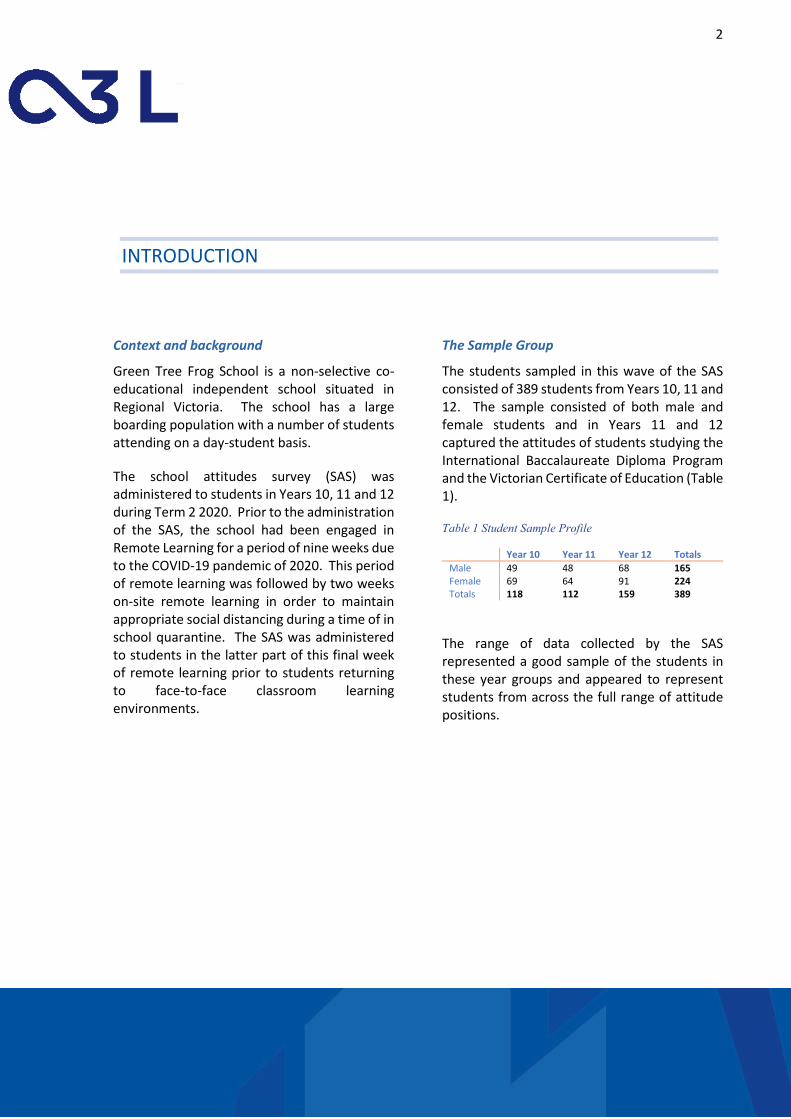
Green Tree Frog School is a non-selective co-educational independent school situated in Regional Victoria. The school has a large boarding population with a number of students attending on a day-student basis.
The school attitudes survey (SAS) was administered to students in Years 10, 11 and 12 during Term 2 2020. Prior to the administration of the SAS, the school had been engaged in Remote Learning for a period of nine weeks due to the COVID-19 pandemic of 2020. This period of remote learning was followed by two weeks on-site remote learning in order to maintain appropriate social distancing during a time of in school quarantine. The SAS was administered to students in the latter part of this final week of remote learning prior to students returning to face-to-face classroom learning environments.
The Sample Group
The students sampled in this wave of the SAS consisted of 389 students from Years 10, 11 and 12. The sample consisted of both male and female students and in Years 11 and 12 captured the attitudes of students studying the International Baccalaureate Diploma Program and the Victorian Certificate of Education (Table 1).
Table 1 Student Sample Profile
Year 10 Year 11 Year 12 Totals Male 49 48 68 165 Female 69 64 91 224 Totals 118 112 159 389
The range of data collected by the SAS represented a good sample of the students in these year groups and appeared to represent students from across the full range of attitude positions.
INTRODUCTION

3
Measuring Student Attitudes
The School Attitude Survey was developed from the School Science Attitude Survey (Kennedy, Quinn, & Taylor, 2016) and measures a student’s attitudes towards their subjects against nine Attitudinal Factors. These factors are:
• Anxiety • Creativity • Difficulty • Enjoyability • Intentions • Relevance • Self-Efficacy • Career Usefulness • Personal Usefulness
Student attitude ratings are reported on a visual analogue scale from -50 to +50. The Attitudinal Factors Anxiety and Difficulty are both reverse keyed.
A student’s mean attitude rating for each attitudinal factor across all of their subjects is calculated and is known as the student’s Composite Attitude Rating (CAR). A student’s CAR can be thought of as a measure of their average attitude to the academic aspects of school as a whole.
Subject Attitude Ratings (SAR) are then calculated by subtracting a student’s CAR for a specific attitudinal factor from their raw attitude rating for the individual subject for that same attitudinal factor. A SAR could therefore theoretically fall in the range -100 to +100. A student’s SAR can be thought of as a measure of their attitudes towards a single subject area in comparison to their attitude towards school as a whole.
In all of the following Attitudinal Profiles a high rating represents the desired outcome. Therefore, a positive rating for anxiety represents a low-level of anxiety (relaxed students are the desired outcome) and a positive rating for difficulty represents a low-level of difficulty (students who are not struggling is the desired outcome).
Figure 1 Screenshot of the School Attitudes Survey
DATA COLLECTION INSTRUMENTS
4
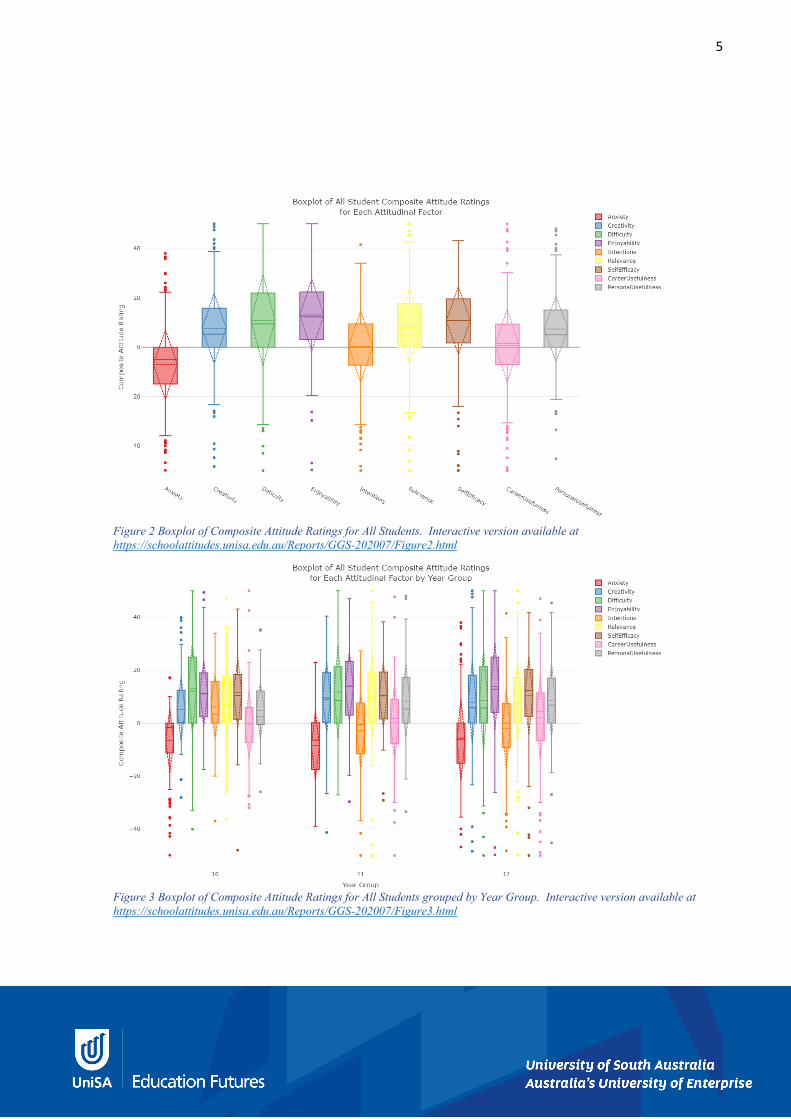
The mean values and standard deviations for each of the nine attitudinal factors as calculated across all of a student’s courses are shown in Figure 2. The box indicates the interquartile range (the middle 50% of students), the solid horizontal line indicates the median, and the whiskers indicate the lesser of the extreme rating or 1.5 times the interquartile range.
The superimposed dotted diamond indicates the extents of the standard deviation and the position of the mean composite attitude rating. An interactive version of Figure 2 can be found at https://schoolattitudes.unisa.edu.au/reports/GGS-202007/Figure2.html.
Figure 3 and Figure 4 show the same information as Figure 2 but broken down by year group and by student sex.
In the interactive charts, individual attitudinal factors can be enabled or disabled by clicking on the name in the legend. These charts allow different groups of students to be compared across different attitudinal factors.
Figure 5 is a heatmap that shows the correlations between students Composite Attitude Ratings. An interactive version of Figure 5 can be found at https://schoolattitudes.unisa.edu.au/reports/GGS-202007/Figure5.html
When examining the heatmap, the darker the square, the stronger the correlation. Purple squares indicate positive correlations and orange squares indicate a negative correlation. In the interactive version of this chart, hovering over a square will reveal the numeric size and direction of the correlation.
In general, when two attitudinal factors are strongly correlated, it is an indication that there is an underlying reason or influence linking these factors. When two factors are negatively correlated, this is an indication that when the rating for one attitudinal factor increases the other decreases correspondingly.
SCHOOL OVERVIEW
5
Figure 2 Boxplot of Composite Attitude Ratings for All Students. Interactive version available at https://schoolattitudes.unisa.edu.au/Reports/GGS-202007/Figure2.html
Figure 3 Boxplot of Composite Attitude Ratings for All Students grouped by Year Group. Interactive version available at https://schoolattitudes.unisa.edu.au/Reports/GGS-202007/Figure3.html

6
Figure 4 Boxplot of Composite Attitude Ratings for All Students grouped by Student Sex. Interactive version available at https://schoolattitudes.unisa.edu.au/Reports/GGS-202007/Figure4.html
Figure 5 Heatmap of Composite Attitude Ratings for All Students. Interactive version available at https://schoolattitudes.unisa.edu.au/Reports/GGS-202007/Figure5.html
7
Figure 2 shows that in general most students report relatively consistent, neutral to slightly-positive composite attitude ratings across most attitudinal factors. These ratings have roughly similar standard deviations and the whiskers cover a wide range of responses. There are a small number of outlying students (the dots) at both extremes of the plot indicating that some students hold very different attitudes than most of the cohort.
Figure 2 also shows that students are slightly anxious about their learning in general with a mean rating of about -10.
Figure 3 shows that for many attitudinal factors the breadth of ratings increases as students move from Year 10 to 12. This could be taken as an indication that students become more engaged with their subjects as they progress through school.
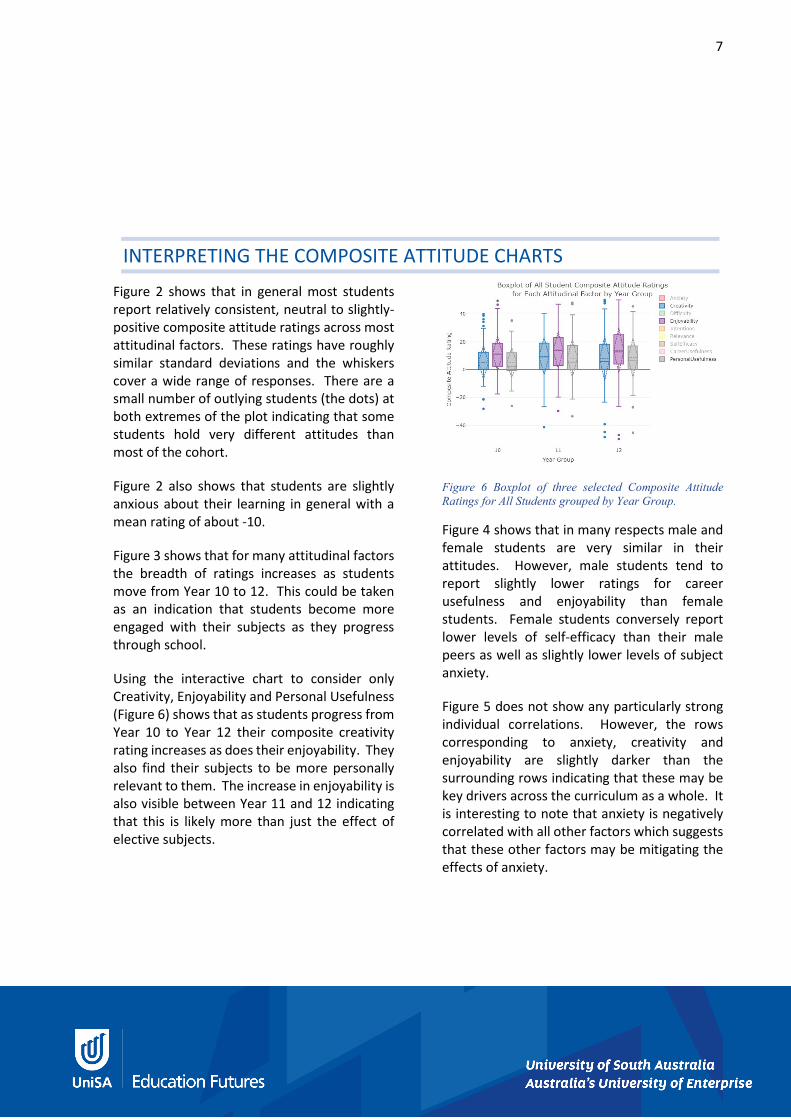
Using the interactive chart to consider only Creativity, Enjoyability and Personal Usefulness (Figure 6) shows that as students progress from Year 10 to Year 12 their composite creativity rating increases as does their enjoyability. They also find their subjects to be more personally relevant to them. The increase in enjoyability is also visible between Year 11 and 12 indicating that this is likely more than just the effect of elective subjects.
Figure 6 Boxplot of three selected Composite Attitude Ratings for All Students grouped by Year Group.
Figure 4 shows that in many respects male and female students are very similar in their attitudes. However, male students tend to report slightly lower ratings for career usefulness and enjoyability than female students. Female students conversely report lower levels of self-efficacy than their male peers as well as slightly lower levels of subject anxiety.
Figure 5 does not show any particularly strong individual correlations. However, the rows corresponding to anxiety, creativity and enjoyability are slightly darker than the surrounding rows indicating that these may be key drivers across the curriculum as a whole. It is interesting to note that anxiety is negatively correlated with all other factors which suggests that these other factors may be mitigating the effects of anxiety.
INTERPRETING THE COMPOSITE ATTITUDE CHARTS
8
On the following pages the same four charts as above will be presented on a Key Learning Area basis. Instead of a Composite Attitude Rating, the Subject Attitude Rating will be utilised.
The SAR is calculated by subtracting the students’ composite attitude ratings from their raw subject ratings. In this way, the following charts offer an opportunity to ask, “how are my students’ attitudes towards my subject area, similar and different to their average ratings towards all their school subjects?”
In interpreting these charts is important to acknowledge that the local classroom context and dynamic is often key to understanding attitudes and that knowing students as individuals is often a gateway to insight. Therefore, rather than offer individual commentary on these charts the reader is encouraged to ask the following questions about each set of graphs.
• Which attitudinal factors appear to be strongly rated by students in this Key Learning Area?
• Which attitudinal factors appear to be poorly rated by students in this Key Learning Area?
• Are there any observations from the classroom that might help to explain these attitude ratings?
• How does the pattern of attitude ratings in this KLA differ to the pattern of attitudes across the school as a whole (Figure 2)?
• Is there a pattern of attitude change over time in this KLA? (try turning on each attitudinal factor one by one in the interactive plot and seeing the trends that appear)
• Is this same pattern visible in the composite attitudes of the students (Figure 3) or is this constrained to this KLA?
• Is there a difference in the attitudinal profiles of boys and girls in this KLA?
• Which attitudes are most strongly correlated in this KLA? Are any attitudes negatively correlated in this KLA?
• Are there any observed patterns in the classroom or systemic constraints that might be impacting on these visible attitude patterns?
USING THE KEY LEARNING AREA CHARTS
9
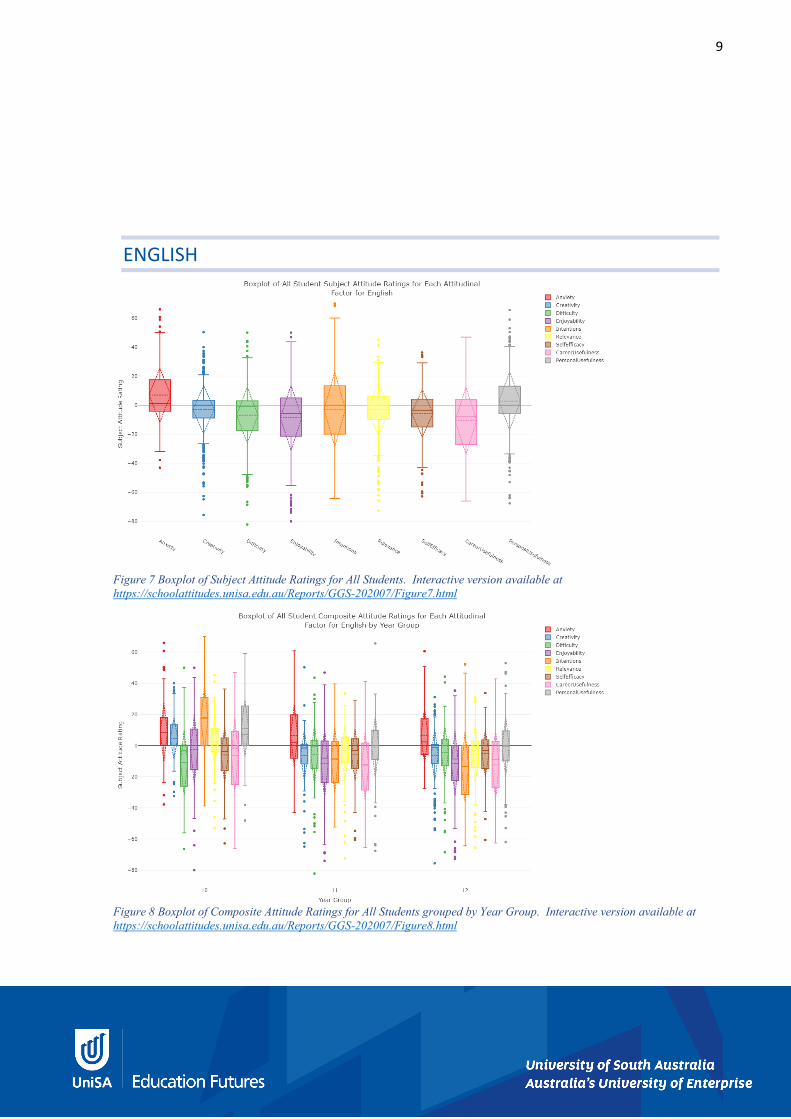
Figure 7 Boxplot of Subject Attitude Ratings for All Students. Interactive version available at https://schoolattitudes.unisa.edu.au/Reports/GGS-202007/Figure7.html
Figure 8 Boxplot of Composite Attitude Ratings for All Students grouped by Year Group. Interactive version available at https://schoolattitudes.unisa.edu.au/Reports/GGS-202007/Figure8.html
ENGLISH
10
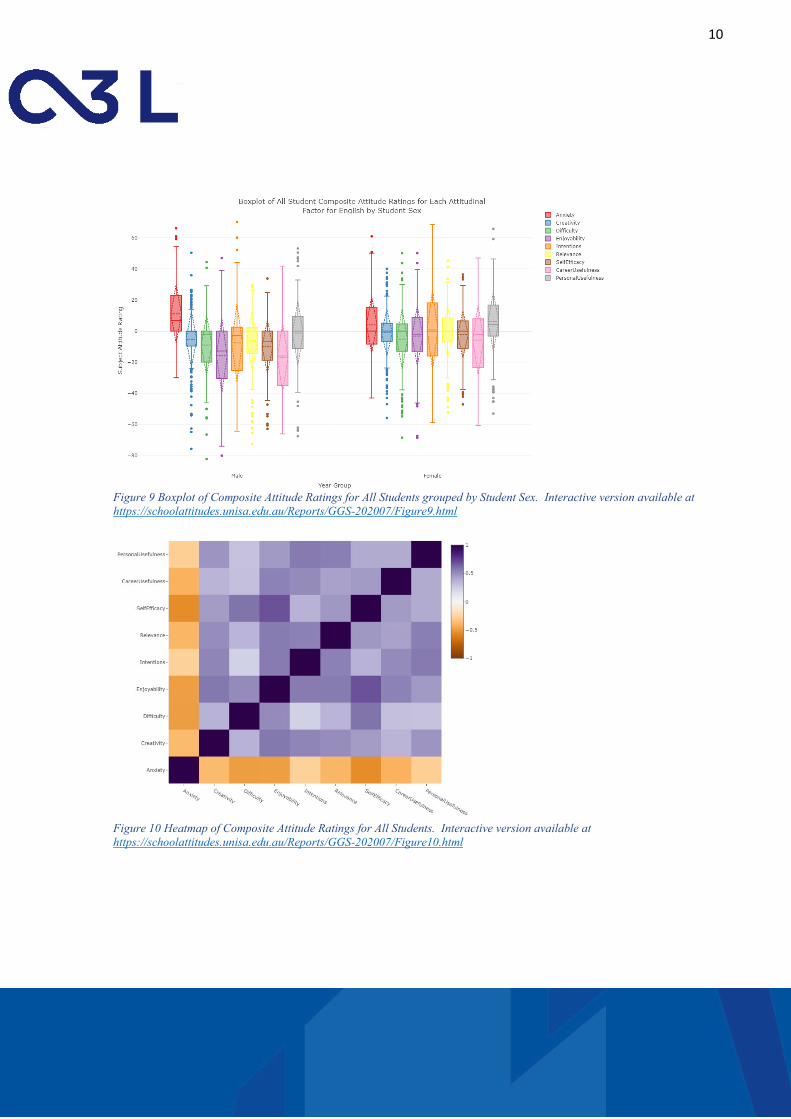
Figure 9 Boxplot of Composite Attitude Ratings for All Students grouped by Student Sex. Interactive version available at https://schoolattitudes.unisa.edu.au/Reports/GGS-202007/Figure9.html
Figure 10 Heatmap of Composite Attitude Ratings for All Students. Interactive version available at https://schoolattitudes.unisa.edu.au/Reports/GGS-202007/Figure10.html
11
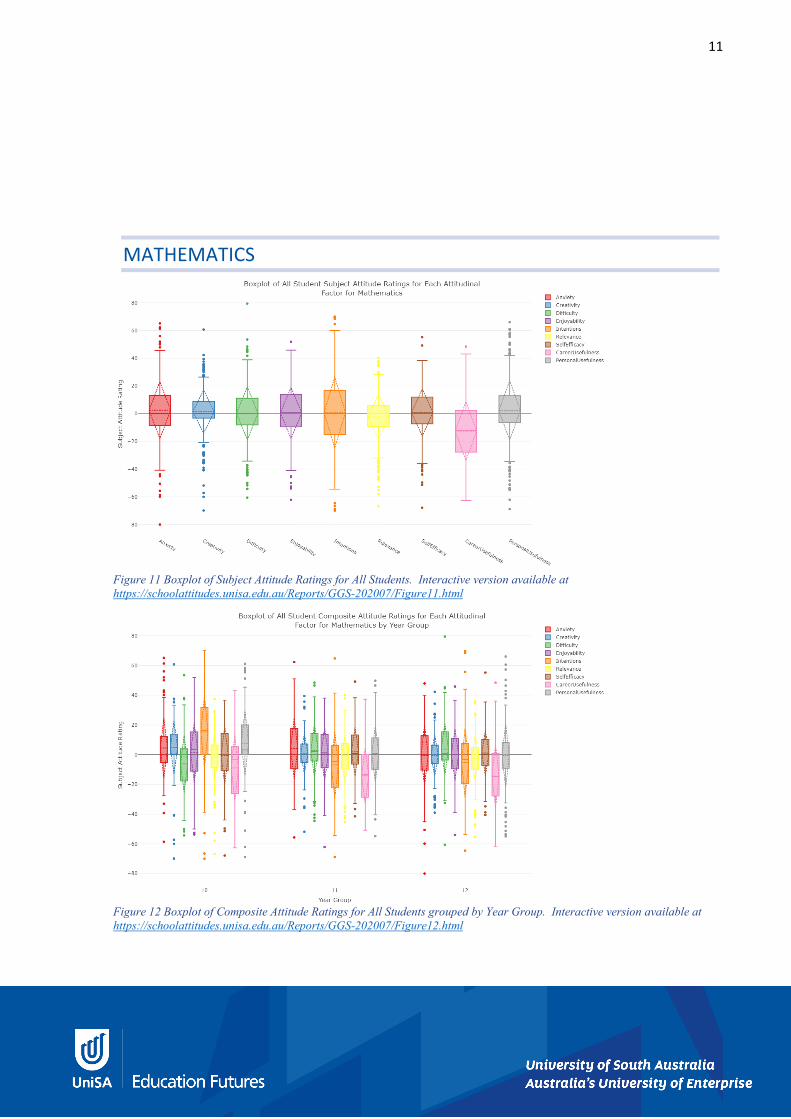
Figure 11 Boxplot of Subject Attitude Ratings for All Students. Interactive version available at https://schoolattitudes.unisa.edu.au/Reports/GGS-202007/Figure11.html
Figure 12 Boxplot of Composite Attitude Ratings for All Students grouped by Year Group. Interactive version available at https://schoolattitudes.unisa.edu.au/Reports/GGS-202007/Figure12.html
MATHEMATICS

12
Figure 13 Boxplot of Composite Attitude Ratings for All Students grouped by Student Sex. Interactive version available at https://schoolattitudes.unisa.edu.au/Reports/GGS-202007/Figure13.html
Figure 14 Heatmap of Composite Attitude Ratings for All Students. Interactive version available at https://schoolattitudes.unisa.edu.au/Reports/GGS-202007/Figure14.html

13
Figure 15 Boxplot of Subject Attitude Ratings for All Students. Interactive version available at https://schoolattitudes.unisa.edu.au/Reports/GGS-202007/Figure15.html
Figure 16 Boxplot of Composite Attitude Ratings for All Students grouped by Year Group. Interactive version available at https://schoolattitudes.unisa.edu.au/Reports/GGS-202007/Figure16.html
SCIENCE
14
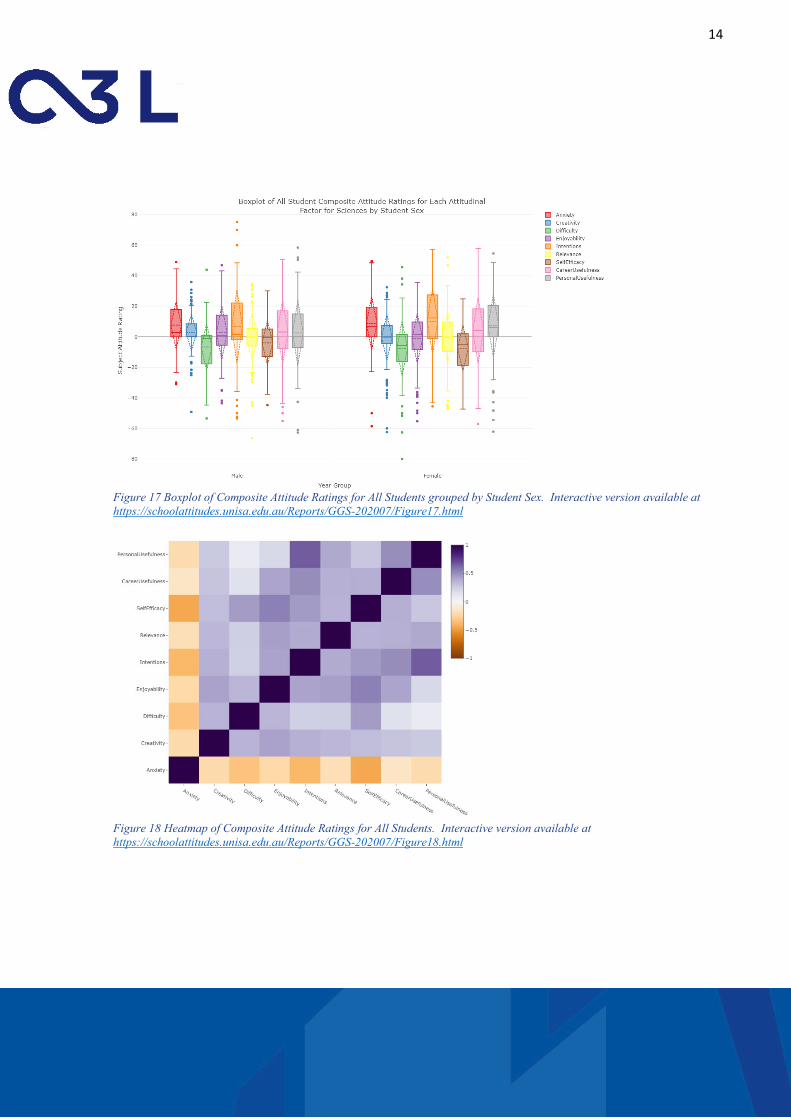
Figure 17 Boxplot of Composite Attitude Ratings for All Students grouped by Student Sex. Interactive version available at https://schoolattitudes.unisa.edu.au/Reports/GGS-202007/Figure17.html
Figure 18 Heatmap of Composite Attitude Ratings for All Students. Interactive version available at https://schoolattitudes.unisa.edu.au/Reports/GGS-202007/Figure18.html

15
Figure 19 Boxplot of Subject Attitude Ratings for All Students. Interactive version available at https://schoolattitudes.unisa.edu.au/Reports/GGS-202007/Figure19.html
Figure 20 Boxplot of Composite Attitude Ratings for All Students grouped by Year Group. Interactive version available at https://schoolattitudes.unisa.edu.au/Reports/GGS-202007/Figure20.html
HUMANITIES AND SOCIAL SCIENCES
16
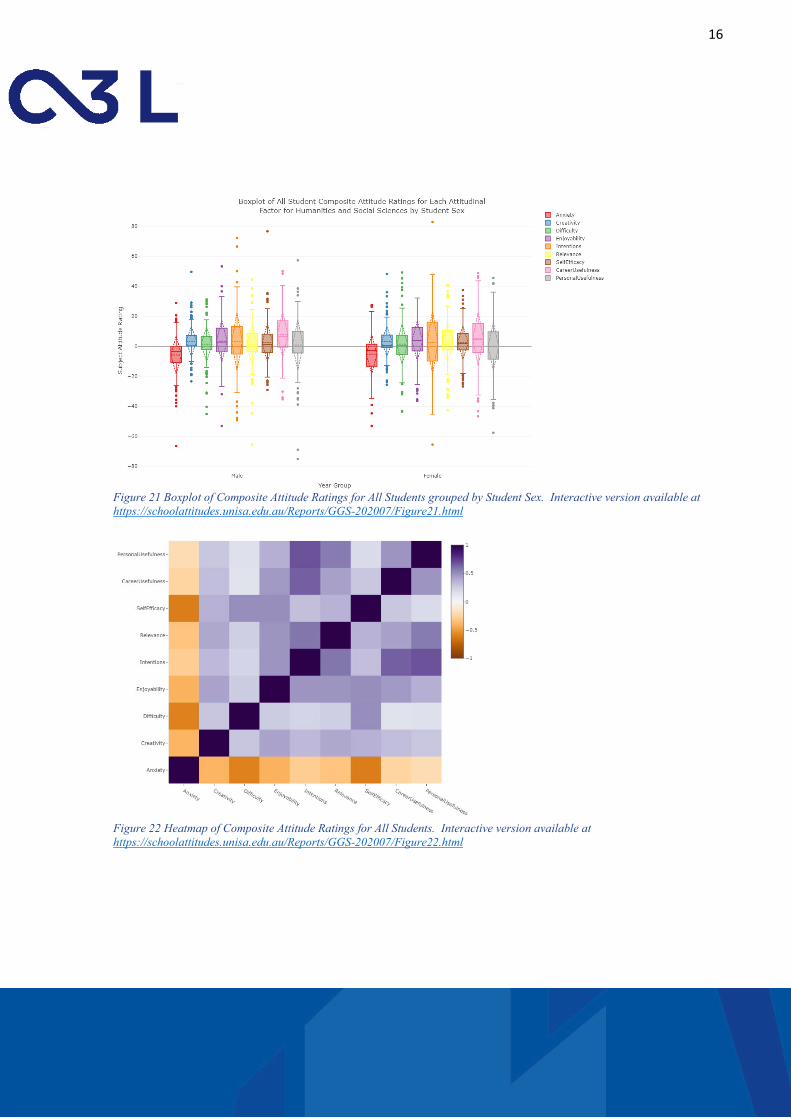
Figure 21 Boxplot of Composite Attitude Ratings for All Students grouped by Student Sex. Interactive version available at https://schoolattitudes.unisa.edu.au/Reports/GGS-202007/Figure21.html
Figure 22 Heatmap of Composite Attitude Ratings for All Students. Interactive version available at https://schoolattitudes.unisa.edu.au/Reports/GGS-202007/Figure22.html
17
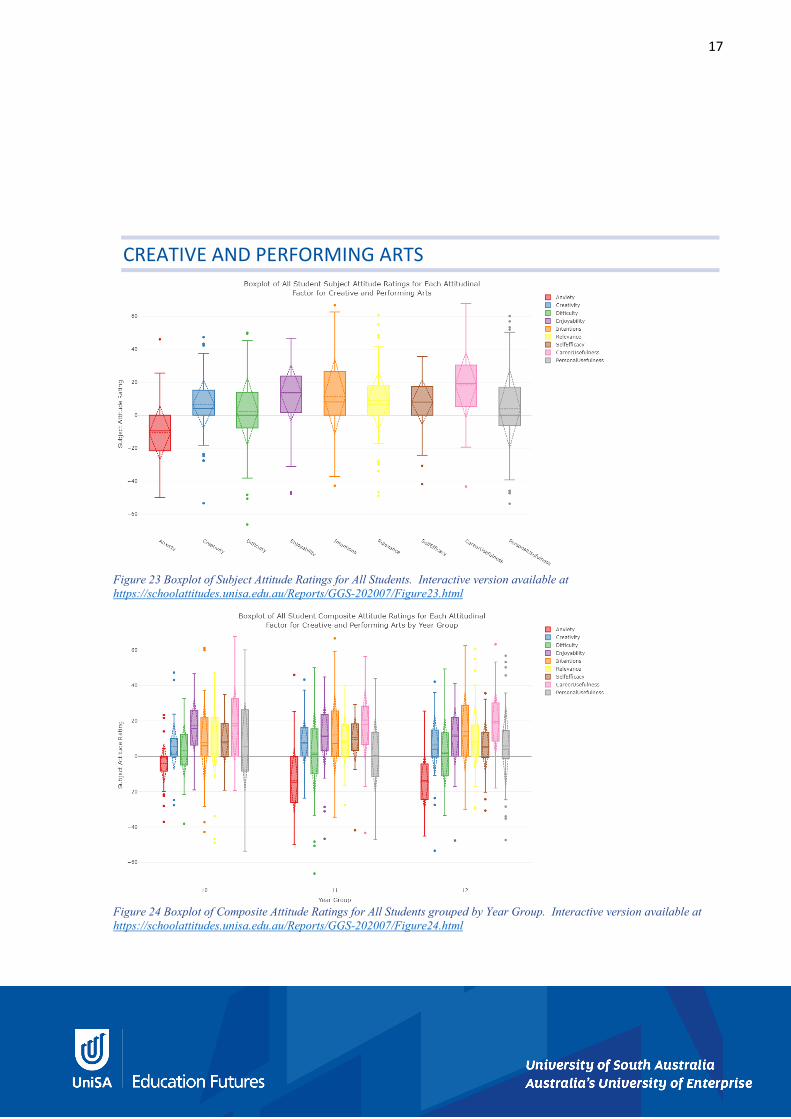
Figure 23 Boxplot of Subject Attitude Ratings for All Students. Interactive version available at https://schoolattitudes.unisa.edu.au/Reports/GGS-202007/Figure23.html
Figure 24 Boxplot of Composite Attitude Ratings for All Students grouped by Year Group. Interactive version available at https://schoolattitudes.unisa.edu.au/Reports/GGS-202007/Figure24.html
CREATIVE AND PERFORMING ARTS

18
Figure 25 Boxplot of Composite Attitude Ratings for All Students grouped by Student Sex. Interactive version available at https://schoolattitudes.unisa.edu.au/Reports/GGS-202007/Figure25.html
Figure 26 Heatmap of Composite Attitude Ratings for All Students. Interactive version available at https://schoolattitudes.unisa.edu.au/Reports/GGS-202007/Figure26.html

19
Figure 27 Boxplot of Subject Attitude Ratings for All Students. Interactive version available at https://schoolattitudes.unisa.edu.au/Reports/GGS-202007/Figure27.html
Figure 28 Boxplot of Composite Attitude Ratings for All Students grouped by Year Group. Interactive version available at https://schoolattitudes.unisa.edu.au/Reports/GGS-202007/Figure28.html
PERSONAL DEVELOPMENT, HEALTH AND PHYSICAL EDUCATION

20
Figure 29 Boxplot of Composite Attitude Ratings for All Students grouped by Student Sex. Interactive version available at https://schoolattitudes.unisa.edu.au/Reports/GGS-202007/Figure29.html
Figure 30 Heatmap of Composite Attitude Ratings for All Students. Interactive version available at https://schoolattitudes.unisa.edu.au/Reports/GGS-202007/Figure30.html

21
Figure 31 Boxplot of Subject Attitude Ratings for All Students. Interactive version available at https://schoolattitudes.unisa.edu.au/Reports/GGS-202007/Figure31.html
Figure 32 Boxplot of Composite Attitude Ratings for All Students grouped by Year Group. Interactive version available at https://schoolattitudes.unisa.edu.au/Reports/GGS-202007/Figure32.html
LANGUAGES OTHER THAN ENGLISH
22
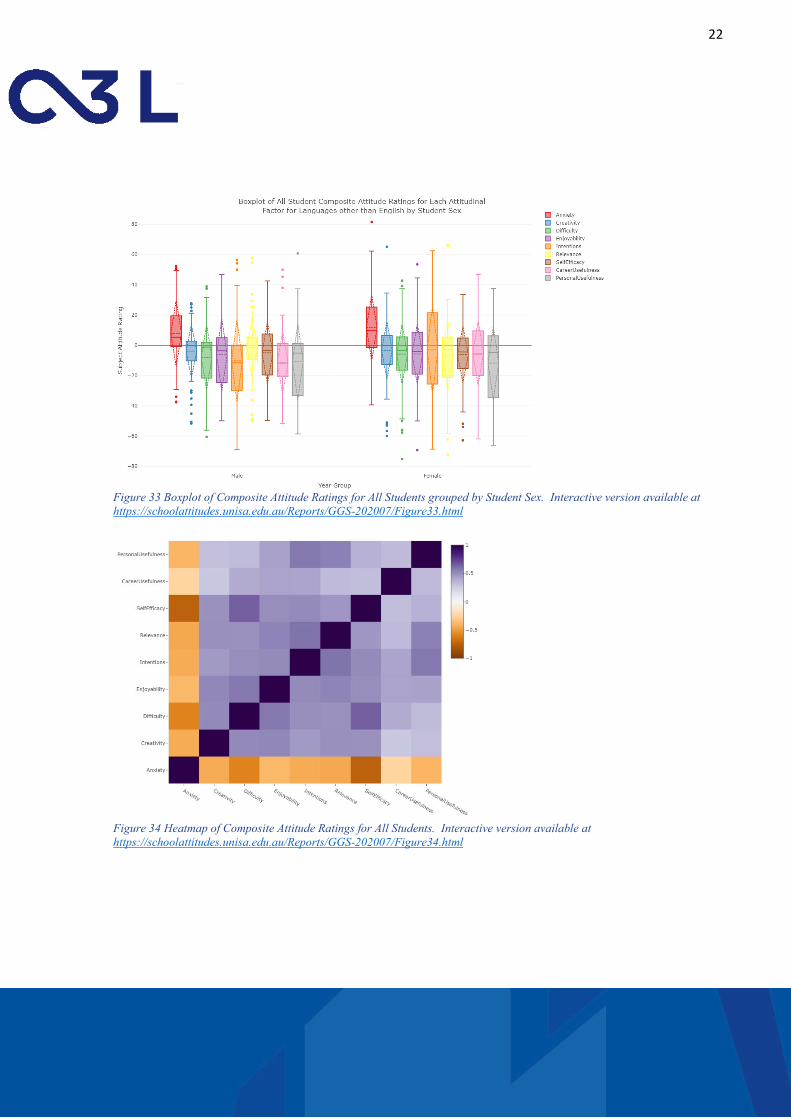
Figure 33 Boxplot of Composite Attitude Ratings for All Students grouped by Student Sex. Interactive version available at https://schoolattitudes.unisa.edu.au/Reports/GGS-202007/Figure33.html
Figure 34 Heatmap of Composite Attitude Ratings for All Students. Interactive version available at https://schoolattitudes.unisa.edu.au/Reports/GGS-202007/Figure34.html

23
Figure 35 Boxplot of Subject Attitude Ratings for All Students. Interactive version available at https://schoolattitudes.unisa.edu.au/Reports/GGS-202007/Figure35.html
Figure 36 Boxplot of Composite Attitude Ratings for All Students grouped by Year Group. Interactive version available at https://schoolattitudes.unisa.edu.au/Reports/GGS-202007/Figure36.html
TECHNOLOGY AND APPLIED STUDIES

24
Figure 37 Boxplot of Composite Attitude Ratings for All Students grouped by Student Sex. Interactive version available at https://schoolattitudes.unisa.edu.au/Reports/GGS-202007/Figure37.html
Figure 38 Heatmap of Composite Attitude Ratings for All Students. Interactive version available at https://schoolattitudes.unisa.edu.au/Reports/GGS-202007/Figure38.html

25
Kennedy, J., Quinn, F., & Taylor, N. (2016). The
school science attitude survey: a new instrument for measuring attitudes towards school science. International Journal of Research & Method in Education, 39(4), 422-445. doi:10.1080/1743727x.2016.1160046
Leonard, S. N., Fitzgerald, R. N., & Bacon, M. (2016). Fold-back: Using emerging technologies to move from quality assurance to quality enhancement. Australasian Journal of Educational Technology, 32(2), 15. doi:10.14742/ajet.2196
Sawyer, R. K. (2014). Conclusion: The future of learning: Grounding educational innovation in the learning sciences. In The Cambridge Handbook of the Learning Sciences: Cambridge University Press.
REFERENCES