the general equilibrium impacts of monetising all waste ... · 2 energy research centre, university...
TRANSCRIPT

The general equilibrium impacts of monetising all waste streams in South Africa1
FAAIQA HARTLEY2, TARA CAETANO3 AND REZA C. DANIELS4
November 2016
1 Funding for this paper is gratefully acknowledged from the Recycling and Economic Development Initiative of South
Africa (REDISA). All views expressed, errors and omissions are the responsibility of the authors alone.
2 Energy Research Centre, University of Cape Town: [email protected]
3 Energy Research Centre, University of Cape Town: [email protected]
4 School of Economics, University of Cape Town. Corresponding author: [email protected]
Key points
This report estimates the potential economic impacts
of the introduction of resources back into the economy
through recycled waste streams in South Africa. As a
first attempt, we estimate the impact of an exogenous
increase in supply of recycled commodities through
thirteen key waste streams.
Reintroducing recycled commodities into the
economy has the potential to increase domestic supply
and lower prices of these commodities, stimulate
demand and increase overall production.
Depending on the level of recycling, real GDP could
increase by up to 0.5 per cent with 13 661 new full-
time equivalent jobs created, predominantly in lower
skilled occupations, thus raising overall welfare.
These results may be understated, as they do not
include the catalytic impacts from expanding recovery
and recycling industries. However, the expansion of
these industries may also come with additional costs.
The results in this paper suggest that South Africa can
significantly alter its current economic growth
trajectory in the short-term to a lower-skilled and
more employment-intensive path, using waste
beneficiation as the strategy to achieve it.
RE
SE
AR
CH
R
EP
OR
T S
ER
IE
S
Suggested citation for this paper:
Hartley, F., Caetano, T. and Daniels R.C. 2016. The general equilibrium impacts of monetising
all waste streams in South Africa. Energy Research Centre. University of Cape Town. November
2016.
Energy Research Centre
University of Cape Town
Private Bag X3
Rondebosch 7701
South Africa
Tel: +27 (0)21 650 2521
Fax: +27 (0)21 650 2830
Email: [email protected]
Website: www.erc.uct.ac.za

Contents
1. Introduction 1
2. Methodology and Assumptions 1
2.1 Model 1
2.2 Scenarios 2
2.3 Assumptions 3
3. Results 4
3.1 DST Scenarios 4
3.1.1 GDP 4
3.1.2 Sector Growth 4
3.1.3 Trade 5
3.1.4 Employment and Wages 5
3.1.5 Households 5
3.2 Individual Waste Streams 6
3.2.1 Electricity generating waste 6
3.2.2 Construction and demolition waste 7
3.2.3 Plastics 8
3.2.4 Glass 8
4. Sensitivity Analysis 9
5. Discussion 9
6. References 10

The general equilibrium impacts of monetising all waste streams in South Africa 1
ENERGY RESEARCH CENTRE
1. Introduction
The recovery, recycling and reuse of waste materials are potential sources of economic activity
and employment in South Africa. Waste materials if recycled can be reintroduced into the
economy, increasing the supply of intermediate and final goods. This could result in lower prices
as a) total supply in the economy increases and b) the supply of recycled goods could possibly be
introduced at reduced prices. Recovery and recycling furthermore provide opportunities for new
industries, labour absorption as well as a production catalyst through its demand for intermediate
goods and services.
In 2011, the Department of Environmental Affairs estimated that approximately 90 per cent (90.2
million tons) of generated waste was landfilled with only 10 per cent recycled (DEA, 2012). In
2014, the Department of Science and Technology (DST) investigated the value of resources lost
through landfilling. It estimated that in 2011 a potential R17 billion worth of commodities were
landfilled with only R8.2 billion recovered and reintroduced into the economy (DST, 2014).
This report estimates the economy-wide implications of reintroducing recycled waste streams in
South Africa. As a first attempt, we estimate the impact of an exogenous increase in supply
through the reintroduction of recycled commodities5. The monetisation of 13 waste streams by
the DST for three scenarios inform the supply shocks implemented.
The benefits and costs associated with the introduction of industries that recover and recycle waste
streams are not considered in this study. As a result, it is likely that the impacts are understated
as the analysis does not account for the catalytic impacts on the economy from increased
intermediate goods and services demand, higher net employment6 and lower waste disposal costs.
Further, the additional positive implications of the environmental benefits are not quantified.
However, including the recovery and recycling industries for the various waste streams would
also bring in additional costs (i.e. financing of investment, opportunity costs of resource use, etc.),
currently not incorporated. This could have an offsetting impact. These issues are investigated for
a single waste stream in Hartly, Caetano & Daniels (2016), but are not explored in this paper.
2. Methodology and Assumptions
2.1 Model
We use the South African General Equilibrium (SAGE) model to estimate the economy-wide
impacts of reintroducing recycled waste streams into the South African economy. SAGE is a
dynamic recursive version of the static computable general equilibrium (CGE) model described
by Lofgren et al. (2002) and was developed by the World Institute for Development Economics
Research at the United Nations University (see Diao and Thurlow (2012) for a description of the
core structure and dynamics).
The model uses a 2009 social accounting matrix (SAM) and includes 49 activities and 85
commodities. The SAM includes 4 labour groups by level of education and 14 expenditure-based
representative households (Davies and Thurlow, 2009).
CGE models simulate the functioning of a market economy and capture the direct and indirect
linkages between different players (i.e. producers, households, government and rest of the world)
while taking into account the impacts of relative price changes and respecting macroeconomic
constraints. As such, it is a useful simulation laboratory for assessing the economy-wide impacts
of shocks to the economy.
5 An increase in supply given that there is an increase in the units of recycled commodities in addition to the virgin
commodities produced by sectors. This is illustrated by a movement of the supply curve to the right for waste
stream sectors.
6 Note that all employment effects estimated in this paper are for full-time equivalent (FTE) jobs.

The general equilibrium impacts of monetising all waste streams in South Africa 2
ENERGY RESEARCH CENTRE
2.2 Scenarios
In 2011, the DST monetised 13 waste streams in South Africa for three recycling scenarios (see
Table 1). These scenarios form the basis of the scenarios considered in this report. We use
Scenario 1, which describes the recycling of waste streams in 2011, to inform the shares of
recycled commodities in the baseline scenario (referred to as Scenario 1).7
The DST estimates that if the share of waste materials recycled increased to 29 per cent (Scenario
2) from 11 per cent (Scenario 1), the value of the commodity reintroduced into the economy
would rise to R12.8 billion. If the share of waste materials increases to 47 per cent (Scenario 3),
R17.4 billion worth of commodity would be reintroduced into the economy and if all waste were
recycled and reintroduced (Scenario 4), the value would increase by three times the initial value
to R25.2 billion.
The largest potential sources for waste stream recovery in value terms identified by the DST are
biomass waste from industry; plastic; municipal waste; and metals. Increasing the recycled share
of these waste streams to 100 per cent would raise the value of commodities reintroduced into the
economy by 156 per cent, accounting for 83 per cent of the potential increase in total waste stream
value.
Table 1: Potential resource value (per year) under different scenarios for resource recovery
Source: DST, 2014
To estimate the economy-wide impacts of increasing the shares of recycled waste materials
reintroduced into the economy, we map the waste streams to commodities within the SAM. Waste
streams are mapped based on their potential uses within the economy as identified by the DST
(DST, 2014). In some cases, simplifying assumptions were made about the potential commodities
from recycled waste streams.8 All values are deflated to 2009 Rands for consistency with the
SAM. Table 2 illustrates the mapping used.
7 The DST estimates are used as in the paper apart from deflating the values to 2009 prices. The SAM is assumed to
include the recycling activities as in Scenario 1, therefore any increase in supply of recycled commodities is
compared to this Baseline SAM.
8 An example of this is waste electric and electronic equipment, which has the potential to feed into numerous
commodity streams due to its composition. For purposes of this analysis, only the three largest components, which
account for 75 per cent, are considered.
Stream Scenario 1 Scenario 2 Scenario 3 Scenario 4 Scenario 1 Scenario 2 Scenario 3 Scenario 4
Municipal waste (non-recyclable portion) 0.0 2.0 4.0 8.1 367.4 0.0 740.5 1481.1 2962.2
Organic component of municipal waste 1.1 1.6 2.1 3.0 188.6 199.6 299.4 399.2 570.3
Biomass waste from industry 0.0 10.9 21.7 36.2 188.6 0.0 2046.9 4093.8 6823.0
Construction and demolition waste 0.8 1.6 2.4 4.7 87.5 66.2 136.5 206.7 413.5
Paper 1.0 1.1 1.4 1.7 744.5 736.0 809.6 1033.0 1291.2
Plastic 0.2 0.5 0.8 1.3 3119.5 734.8 1677.8 2449.4 4082.3
Glass 0.3 0.4 0.6 1.0 490.0 150.5 204.6 282.2 470.3
Metals 2.5 2.7 2.8 3.1 2270.0 5668.1 6022.4 6376.6 7085.1
Tyres 0.0 0.1 0.2 0.2 367.0 3.6 38.0 72.4 90.5
WEEE 0.0 0.0 0.0 0.1 1000.0 6.9 19.5 32.0 64.0
Slag 2.7 3.4 4.0 5.4 175.0 470.0 587.4 704.9 939.9
Ash 2.3 4.8 7.2 36.2 3.0 6.9 14.3 21.7 108.7
Waste oils 0.1 0.1 0.1 0.1 2777.8 146.7 193.3 240.0 333.3
Total 10.9 29.0 47.4 101.1 8189.2 12790.2 17393.1 25234.4
Percent change from Scenario 1 166.6 335.0 828.9 56.2 112.4 208.1
Quantity recovered (million t/year) Value (2013 Rand million/year)Price (R/t)

The general equilibrium impacts of monetising all waste streams in South Africa 3
ENERGY RESEARCH CENTRE
Table 2: Waste stream to SAM mapping
Source 1: Own calculations based on DST (2014)
While most waste streams tend to increase the supply of individual commodities, some like
WEEE9 and metals have an impact on more than one commodity. For these waste streams, we
assume fixed shares for commodities per unit of waste. For example, increasing the recycling of
WEEE to 100 per cent would increase the supply of reintroduced plastics; basic iron and steel;
and non-ferrous metals by 17, 25 and 44 per cent, respectively. Under such a scenario, the total
supply of plastics; basic iron and steel; and non-ferrous metals would increase by 0.04, 0.03 and
0.02 per cent.
Table 3 illustrates the shocks implemented under the different scenarios. The full recovery of
some individual waste streams has a sizeable impact on the supply of commodities. For these
waste streams, we conduct an individual analysis of the waste stream to understand their impacts.
These waste streams have been identified as, (i) waste to energy10; (ii) plastics; (iii) construction
and demolition waste (or increase in cement); and (iv) glass.
Table 3: Supply shocks by scenario
Source: Own calculations based on DST (2014) and 2009 SAM
2.3 Assumptions
As noted earlier, in this analysis we do not account for the benefits and costs associated with the
introduction of recycling industries that would undertake the recovery and recycling of waste
streams. We impose a supply shock through technological change. Production is therefore not
directly changed but rather affected through general equilibrium effects.
The macroeconomic closures assumed are aligned to the stylised facts of South Africa. A balanced
savings-investment approach is taken, as such investment and government expenditure remains
9 WEEE: Waste Electrical and Electronic Equipment.
10 These include municipal waste, organic component of municipal waste and biomass waste from industry. For
simplicity, it is assumed that the increase in waste to energy provides inputs for the electricity and gas distribution
sector directly.
Electricity &
gas
distribution Cement
Paper
products Plastics
Glass
products
Basic iron
& steel
Non-
ferrous
metal
Other
rubber
products Construction
Petroleum
products
Municipal waste (non-recyclable) 100%
Organic component of municipal waste 100%
Biomass waste from industry 100%
Construction and demolition waste 100%
Paper 100%
Plastic 100%
Glass 100%
Metals 85% 15%
Tyres 100%
WEEE 17% 25% 44%
Slag (from mineral processing) 100%
Ash (from power generation) 100%
Waste oils 100%
CGE Model Commodities
Wa
ste S
trea
ms
Per cent change in commodity supply Scenario 2 Scenario 3 Scenario 4 Electricity* Plastics Cement Glass
Electricity & gas distribution 1.9 3.9 6.8 6.8
Cement 0.2 0.4 1.0 1.0
Paper products 0.1 0.3 0.6
Plastics 1.7 3.0 5.9 5.9
Glass products 0.4 1.0 2.4 2.4
Basic iron & steel 0.2 0.4 0.7
Non-ferrous metal 0.1 0.2 0.3
Other rubber products 0.4 0.8 1.0
Construction 0.0 0.0 0.1
Petroleum products 0.0 0.1 0.1
*Electricity refers to waste streams Municipal waste, Organic component of municipal waste and Biomass waste from industry.
Waste Stream Scenario
The general equilibrium impacts of monetising all waste streams in South Africa 4
ENERGY RESEARCH CENTRE
fixed shares of absorption. A flexible exchange rate is assumed and no fiscal balance rule is
imposed. High skilled labour (Grade 12 and higher) is assumed to be scarce and therefore always
employed. There is an excess supply of lower and middle level skilled (Grade 11 and lower)
labour. All labour and capital is mobile across sectors.
3. Results
3.1 DST Scenarios This section presents the results from the DST scenarios, where recovery and recycling are
increased for all waste streams simultaneously. The results from the DST scenarios are compared
to Scenario 1, the baseline scenario, and are presented in Table 4.
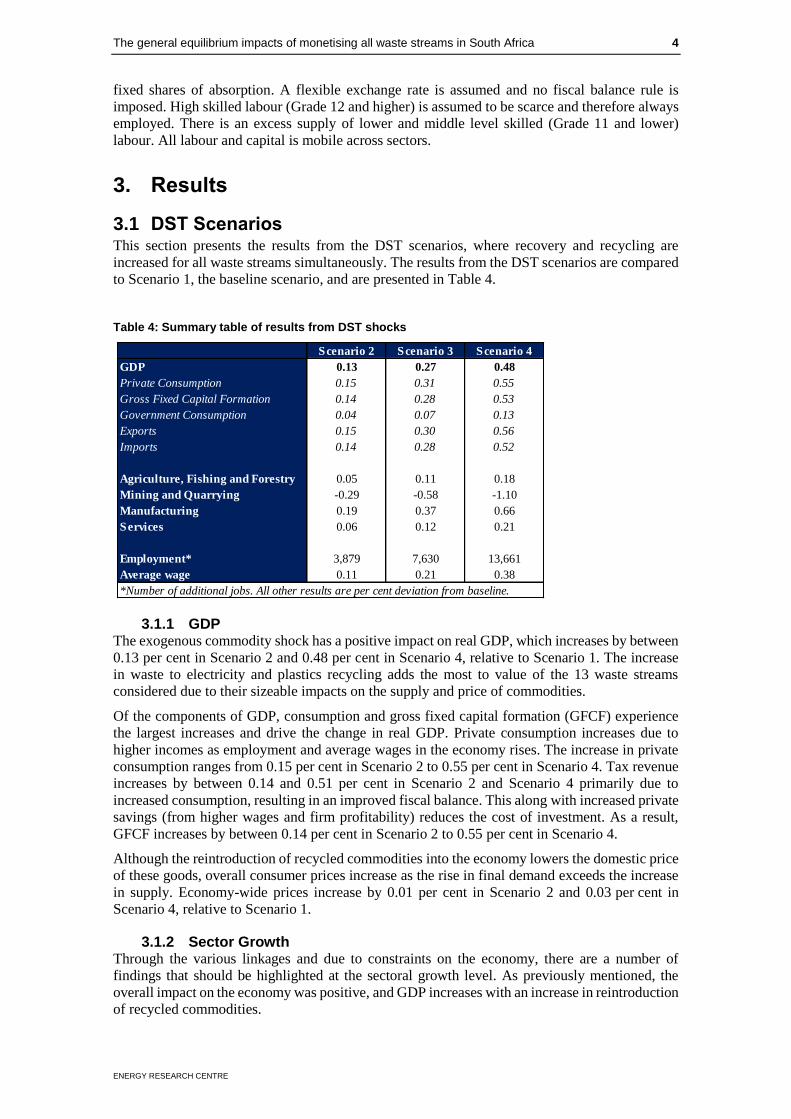
Table 4: Summary table of results from DST shocks
3.1.1 GDP The exogenous commodity shock has a positive impact on real GDP, which increases by between
0.13 per cent in Scenario 2 and 0.48 per cent in Scenario 4, relative to Scenario 1. The increase
in waste to electricity and plastics recycling adds the most to value of the 13 waste streams
considered due to their sizeable impacts on the supply and price of commodities.
Of the components of GDP, consumption and gross fixed capital formation (GFCF) experience
the largest increases and drive the change in real GDP. Private consumption increases due to
higher incomes as employment and average wages in the economy rises. The increase in private
consumption ranges from 0.15 per cent in Scenario 2 to 0.55 per cent in Scenario 4. Tax revenue
increases by between 0.14 and 0.51 per cent in Scenario 2 and Scenario 4 primarily due to
increased consumption, resulting in an improved fiscal balance. This along with increased private
savings (from higher wages and firm profitability) reduces the cost of investment. As a result,
GFCF increases by between 0.14 per cent in Scenario 2 to 0.55 per cent in Scenario 4.
Although the reintroduction of recycled commodities into the economy lowers the domestic price
of these goods, overall consumer prices increase as the rise in final demand exceeds the increase
in supply. Economy-wide prices increase by 0.01 per cent in Scenario 2 and 0.03 per cent in
Scenario 4, relative to Scenario 1.
3.1.2 Sector Growth Through the various linkages and due to constraints on the economy, there are a number of
findings that should be highlighted at the sectoral growth level. As previously mentioned, the
overall impact on the economy was positive, and GDP increases with an increase in reintroduction
of recycled commodities.
Scenario 2 Scenario 3 Scenario 4
GDP 0.13 0.27 0.48
Private Consumption 0.15 0.31 0.55
Gross Fixed Capital Formation 0.14 0.28 0.53
Government Consumption 0.04 0.07 0.13
Exports 0.15 0.30 0.56
Imports 0.14 0.28 0.52
Agriculture, Fishing and Forestry 0.05 0.11 0.18
Mining and Quarrying -0.29 -0.58 -1.10
Manufacturing 0.19 0.37 0.66
Services 0.06 0.12 0.21
Employment* 3,879 7,630 13,661
Average wage 0.11 0.21 0.38
*Number of additional jobs. All other results are per cent deviation from baseline.

The general equilibrium impacts of monetising all waste streams in South Africa 5
ENERGY RESEARCH CENTRE
The impact on domestic production of commodities affected by waste recycling is dependent on
the ability of the private consumption, investment demand and foreign demand to absorb the
increase in supply. In the case of the electricity and plastics sectors, there is a decrease in domestic
production as the demand for virgin product declines. There is a notable decrease in the level of
coal mining activity due to the decrease in coal-fired power generation. Mining and quarrying
GVA declines by 0.29 per cent in Scenario 2, 0.58 per cent in Scenario 3 and 1.1 per cent in
Scenario 4.
Sectors that are the largest users of the recycled commodities experience an increase in GVA, as
lower commodity prices decrease their cost of production and increase their profitability. The
provision of electricity at lower prices creates a favourable environment for electricity intensive
users such as non-ferrous metals; and iron and steel, who experience an increase in GVA by
between 1.6 per cent in Scenario 2 and 5.8 per cent in Scenario 4; and 0.5 per cent in Scenario 2
and 2 per cent in Scenario 4, respectively. This, along with benefits resulting from the
reintroduction of other recycled commodities, drives the increase in manufacturing activity.
Manufacturing GVA increases by 0.19 per cent in Scenario 2 and 0.66 per cent in Scenario 4.
Agricultural and services GVA increases as the intermediate demand for these goods and services
rise. Agricultural GVA increases by between 0.05 per cent in Scenario 2 and 0.18 per cent in
Scenario 4, while services GVA increases by between 0.06 and 0.21 per cent.
3.1.3 Trade The exogenous increase in recycled commodity supply decreases the domestic price of these
goods and makes them more competitive for trade. Lower domestic prices also favourably affect
the competitiveness of benefiting sectors. Total exports in Scenario 4 increases by almost 0.6 per
cent relative to Scenario 1, while in Scenario 2 and 3 it is 0.15 and 0.3 per cent higher respectively.
The rise in exports is largely driven by increased exports of non-ferrous metals; basic iron and
steel; basic chemicals and plastics.
While some export sectors benefit from lower recycled induced prices, there are negative impacts
on others, such as the “other mining” sector, as they cannot compete for factor resources due to
high factor prices. Exports of other mining products decrease by 1.5 per cent. Domestic supply is
insufficient to meet domestic demand at internationally competitive prices. Imports for other
mining products therefore increase by 1.32 per cent. The rise in exports causes an appreciation in
the real exchange rate. This reduces the prices of foreign goods and some commodities. Total
imports increase by 0.52 per cent in Scenario 4; 0.28 per cent in Scenario 3; and 0.14 per cent in
Scenario 2, relative to Scenario 1.
3.1.4 Employment and Wages The increase in activity resulting from lower prices in the economy raises the demand for factors
of production. Total full-time equivalent (FTE) employment in the economy increases by 3 879
jobs in Scenario 2 relative to Scenario 1. Due to more significant price reductions in Scenario 3
and 4, employment increases at a larger scale with 7 630 and 13 661 additional jobs created
respectively. This employment is focused on lower skilled labour, where an excess supply of
labour exists. Non-ferrous metals; basic iron and steel; and basic chemicals experience the largest
increases in employment.
In the case of higher educated workers, the supply constraint raises the average wage as firms
compete for these workers. Average wages are found to increase by 0.1 per cent in Scenario 2 and
almost 0.4 per cent in Scenario 4, relative to Scenario 1. The constraint on high skilled labour
supply, along with capital, limits the ability of the economy to expand as it raises production costs
and reduces firm profitability.
3.1.5 Households On aggregate households experience an increase in income of between 0.17 and 0.6 per cent for
Scenario 2 and Scenario 4, relative to Scenario 1. The rise in incomes is driven by increased
returns to production factors (i.e., labour and capital) as well as increased levels of employment.
This increase however is offset partially through an overall rise in relative prices in the economy.

The general equilibrium impacts of monetising all waste streams in South Africa 6
ENERGY RESEARCH CENTRE
Economy-wide consumer prices increase by between 0.008 and 0.029 per cent in Scenario 2 and
Scenario 4 as demand for resources, goods and services outstrips supply.
In terms of income distribution, wealthier households experience a marginal benefit as they are
generally the owners of capital and supply the largest share of high skilled labour. The benefit to
higher income households is amplified in Scenario 4 due to the larger impact of the constraint on
labour and capital supply.
Figure 1: Change in household incomes
3.2 Individual Waste Streams In this section, we discuss the results for exogenous commodity supply shocks for the individual
waste streams that have the largest impact on the DST scenario results. These results are presented
in Table 5.
Table 5: Individual waste stream results
3.2.1 Electricity generating waste
The combustion of municipal waste (including the organic component) and biomass waste from
industry is a potential source of electricity supply through waste to energy. According to the DST,
waste to energy accounted for 0.13 per cent of total electricity supply in 2011 and was primarily
sourced through the organic component of municipal waste. Fully recycling municipal waste and
biomass from industry has the potential to increase electricity supply by 6.8 per cent.
0.0%
0.1%
0.2%
0.3%
0.4%
0.5%
0.6%
0.7%
1 2 3 4 5 6 7 8 9 10
Ch
an
ge
in a
ver
ag
e in
com
e re
lati
ve
to
Sce
na
rio
1
Household decile
Scenario 4
Scenario 3
Scenario 2
Electricity Plastics Cement Glass
GDP 0.29 0.09 0.01 0.01
Private Consumption 0.36 0.11 0.00 0.01
Gross Fixed Capital Formation 0.24 0.10 0.03 0.01
Government Consumption 0.08 0.02 0.00 0.00
Exports 0.34 -0.01 0.01 0.00
Imports 0.32 -0.01 0.01 0.00
Agriculture, Fishing and Forestry 0.16 0.10 0.00 0.00
Mining and Quarrying -0.29 -0.28 -0.01 -0.03
Manufacturing 0.44 -0.01 -0.01 0.00
Services 0.13 0.04 0.00 0.00
Employment* 8,605 2,766 234 162
Average wage 0.23 0.07 0.01 0.01
*Number of additional jobs. All other results are per cent deviation from baseline.

The general equilibrium impacts of monetising all waste streams in South Africa 7
ENERGY RESEARCH CENTRE
An exogenous increase in the supply of electricity decreases electricity prices as supply exceeds
demand.11 At the same time, the decrease in domestic prices coupled with the increase in supply
reduces the need to import. Imports of electricity decline by 2.6 per cent relative to the baseline
scenario. Tax revenue increases due to the increase in supply, which broadens the sales tax base.
Cheaper electricity prices lower producer costs; and particularly favour energy intensive users
who are largely in the manufacturing sector. Manufacturing production increases by 0.4 per cent
relative to the baseline scenario with non-ferrous and chemical sub-sectors experiencing the
largest increases in activity (3.2 and 2 per cent, respectively). The expansion in output by
electricity intensive users raises the cost of production factors as demand by these industries
increase. Because the supply of highly skilled labour is constrained, wages increase on average
by 0.2 per cent relative to the baseline scenario. The expansion of domestic production is
constrained by high skilled labour and capital supply.
The additional source of electricity supply, along with the higher costs of capital and labour,
results in less electricity production from coal fired plants. As a result, coal production also
decreases relative to the baseline.
Increased returns to labour and capital, coupled with the higher employment of lower skilled
workers, raises household incomes and consumption. The limited ability of the economy to meet
the rise in demand however results in increased imports. Despite the appreciation in the exchange
rate, exports increase as South African firms become more competitive, particularly in the
production of electricity; non-ferrous; and basic chemicals commodities.
On aggregate, real GDP in the economy increases by 0.3 per cent, relative to the baseline with
approximately 9 000 jobs created.
3.2.2 Construction and demolition waste Construction and demolition waste consists of a wide range of materials. A study in the Western
Cape estimated that 33.3 per cent of this waste is made up of concrete and masonry, 25 per cent
of wood, and 12.5 per cent of drywall (Viljoen 2010, in DST 2014). In the baseline scenario,
16 per cent of the construction and demolition waste is recycled, with majority of the crushed
recycled aggregate currently used as backfill in construction, as a substitute or together with
cement depending on the use.
An exogenous increase in the supply of cement, as a main input commodity for construction (60
per cent of overall intermediate demand for cement product), results in a slight increase in GDP
of 0.01 per cent overall. Unlike the other individual waste streams, there is no direct demand for
cement from private households. The use of cement is accounted for by the demand for
construction services by households. The increase in GDP is therefore driven directly by
investment, which increases by 0.03 per cent against the baseline scenario, rather than private
consumption.
The increase in supply of cement results in a decrease in the price of cement by 0.88 per cent,
along with a decrease of 0.05 per cent in the price of construction. Given that construction is a
key investment commodity in the economy, there is an increase in domestic demand and
production for both construction and cement.
There are favourable impacts on a number of sectors as their production costs drop and they
become more profitable. Resources shift to profitable sectors. As a result, less profitable sectors,
such as non-ferrous metals; wood products; and forestry are negatively affected. Total capital
declines by 0.4 per cent for non-ferrous metals, 0.11 per cent for wood products and 0.03 per cent
for forestry. There are also negative employment impacts for these sectors with jobs in the non-
ferrous metals sector decreasing by 0.4 per cent.
The decrease in the price of cement, along with a slight depreciation of the Rand has a positive
impact on trade, as cement exports increase by 4.5 per cent and imports decrease by 0.65 per cent.
11 We assume that electricity prices are reflective of market conditions (i.e. supply and demand).

The general equilibrium impacts of monetising all waste streams in South Africa 8
ENERGY RESEARCH CENTRE
The positive impact on the economy of relatively cheaper cement and construction has an overall
positive impact on employment with 234 jobs created due to the reintroduction of recycled
construction and demolition waste.
3.2.3 Plastics In Scenario 1, the 18 per cent of plastic waste recycled is assumed to account for 1.3 per cent of
total plastics produced in South Africa. Increasing the share of plastic waste recycled to 100 per
cent has the potential to increase domestic plastic supply by 5.9 per cent causing a decrease in
prices of almost 4 per cent. Overall, this has a small positive impact on GDP, which increases by
0.09 per cent relative to Scenario 1.
The increase in GDP is driven by the rise in private consumption demand as household incomes
increase due to increased employment and average wages; and in the case of wealthier households
increased returns to capital. Employment increases by almost 3 000 jobs, while average wages
increase by 0.07 per cent relative to Scenario 1.
Lower plastics prices favourably affect intermediate consumers by lowering production costs and
increasing profitability. Benefitting sectors, which include medical equipment; motor vehicles
and parts; and other chemicals, expand production and demand more labour and capital resources.
This results in an increase in the return to these factors where supply is constrained. Resources
shift away from less profitable sectors such as non-ferrous metals; other mining; and basic
chemicals. Commodities from these sectors are largely exported. As a results exports decline
despite the marginally weaker real exchange rate and increased plastics exports.
The rise in supply reduces the need for as much virgin product, which results in lower domestic
production, and fewer imports. Imports of plastics declines by 6.4 per cent. This coupled with
lower motor vehicle and parts imports reduces total imports by 0.01 per cent.
3.2.4 Glass Whilst glass is a product that can theoretically be recycled an infinite number of times, the DST
report assumes that only the first round of recycling is taken into account. This assumption is
echoed in this report. In the baseline scenario, 32 per cent of glass is recycled, equal to
307 141 tons/year of recycled product. The share of recycled glass was increased to 100 per cent
of product reintroduced as a recycled commodity. This had a positive impact on the economy
overall, with a marginal increase in GDP of 0.01 per cent.
The increase in GDP growth, similar to the plastics waste stream, is mainly driven by an increase
in private consumption demand. In the baseline scenario, 26 per cent of the glass produced
domestically is consumed directly by households.
The price of glass decreases by 2 per cent as a result of the exogenous increase in the supply of
recycled glass to the economy. Although this results in a decline in the intermediate use of glass
by 0.1 per cent, this decline in the price has favourable trade outcomes as glass imports decline
by 0.9 per cent and glass exports increase by 12.7 per cent.
The decrease in the price of glass does have a favourable impact on intermediate consumers as
their production costs are lowered and profitability increased. These sectors include medical
equipment; motor vehicles and parts; beverages and tobacco; and furniture.
There is a decrease in the gross value added (GVA) of the glass sector, as supply exceeds the
demand for glass in the domestic and international market. This has a slightly negative impact on
capital and labour demand from the glass sector, 0.57 per cent for both factors. The positive
impact of lower glass prices on other sectors outweighs this negative impact on employment with
162 jobs created overall and due to supply constraints, an increase in the wage rate of skilled
workers of 0.14 per cent.

The general equilibrium impacts of monetising all waste streams in South Africa 9
ENERGY RESEARCH CENTRE
4. Sensitivity Analysis Sensitivity analysis was conducted on the model parameters, specifically trade elasticities, to
assess whether these play a significant role in the model outcomes. The trade elasticities in SAGE
are based on those used by the Industrial Development Corporation and estimated by van Heerden
et al. (1997). Two scenarios were analysed where the substitutability of recycled commodities
was increased and decreased by 20 per cent respectively. The results from the sensitivity analysis
show no material difference to the outcomes presented in Section 3.2. The variation in real GDP
is less than 0.001 percentage points; therefore marginal changes to the trade elasticities do not
significantly influence the model results.
In our analysis, we assume that the supply of high skilled labour and capital is limited. This
assumption reflects the labour market in South Africa, at least for the short to medium term
(Bhorat et al., 2002; Daniels, 2007). From the results we note that this constraint to growth drives
up wages and returns to capital and limits the ability for companies to expand. As a sensitivity
check we ease this assumption by allowing additional capital and labour to be attracted into the
economy. An upward sloping supply curve is assumed for these factors of production. The results
show that the marginal release in the constraint positively affects the expansion in real GDP
growth. The ability to increase the supply of production factors would therefore enhance the
impact of reintroducing recycled products into the economy.
5. Discussion
While this analysis does not account for the impacts of the recovery and recycling of waste
streams, it highlights the potential that the reintroduction of recycled products may have on
economic growth, FTE employment and welfare. Through economy-wide effects, an increase in
the share of recycled products by 18 per cent has the potential to increase real GDP by 0.1 per
cent and employ an additional 4 000 workers. If the target of 100 per cent of all waste recovered
and recycled were achieved, real GDP could increase by 0.5 per cent and an additional 13 661
jobs could be created.
The analysis assumes a fixed capital and skilled labour supply. Results from the sensitivity
analysis shows that if constraints to production are eased, the economic and employment impacts
can be amplified as more resources are available for production.
This analysis could be greatly improved by the addition of recycling industries in order to include
the potential job creation, enterprise development and macroeconomic impacts of value addition
along waste stream value chains. By not including the addition of these recycling industries, it is
likely that the economic impacts have been understated in this analysis.
There are also a number of social and environmental costs that are borne from the disposal of
waste in landfills, including impacts on health, greenhouse gas emissions, soil and water
contamination to name a few. By reintroducing waste as an economic commodity, these
externalities can be potentially avoided or reduced (DST, 2014). It would be interesting to explore
and account for these externalities in the ‘true’ cost of landfill waste and should be evaluated
further in future work.

The general equilibrium impacts of monetising all waste streams in South Africa 10
ENERGY RESEARCH CENTRE
6. References Bhorat, H., Meyer, J.B. and Mlatsheni, C. 2002. Skilled labour migration from developing
countries: study on South and Southern Africa. Geneva: International Migration Programme,
International Labour Office.
Daniels, R.C. 2007. Skills Shortages in South Africa: A Literature Review. DPRU Working Paper
No. 07/121. [Available online at SSRN: http://ssrn.com/abstract=992111]
Davies, R. and Thurlow J. 2013. A 2009 social accounting matrix for South Africa. Washington
DC, USA: International Food Policy Research Institute. [Available online at:
http://ebrary.ifpri.org/cdm/ref/collection/p15738coll2/id/128029]
Department of Environmental Affairs (DEA). 2012. Draft National Waste Information Baseline
Report. Pretoria, South Africa: Department of Environmental Affairs. [Available online:
http://sawic.environment.gov.za/documents/1880.pdf]
Diao, X. and Thurlow, J. 2012. A recursive dynamic computable general equilibrium model. In:
Diao, X., Thurlow, J., Benin, S. and Fan, S. 2012. Strategies and priorities for African agriculture:
economywide perspectives from country studies. Washington DC, USA: International Food
Policy Research Institute.
Department of Science and Technology (DST). March 2014. The economic benefits of moving up
the waste management hierarchy in South Africa: The value of resources lost through landfilling.
A National Waste Research, Development and Innovation Roadmap for South Africa: Phase 2
Waste RDI Roadmap. Pretoria, South Africa: Department of Science and Technology.
Hartley, F., Caetano, T. and Daniels R.C. 2016. Economic benefits of extended producer
responsibility initiatives in South Africa: The case of waste tyres. University of Cape Town.
November 2016.
Lofgren, H., Harris, R.L. and Robinson, S. 2002. A standard computable general equilibrium
(CGE) model in GAMS. Washington DC, USA: International Food Policy Research Institute.
van Heerden, J.H.P., van der Merwe, S.J. and Naudé, W.A. 1997. Empirical estimation of
elasticties in IDCGEM. South Africa: IDC.