the generative architecture of a digital ecosystem: a ... · pdf filethe generative...
TRANSCRIPT

The Generative Architecture of a Digital Ecosystem:
A Network Perspective
SungYong Um, Youngjin Yoo, Sunil Wattal, Rob J. Kulathinal, Bin Zhang
Temple University
Abstract
Contemporary digital ecosystems are characterized by their generativity, where third-party developers
primarily drive innovations. However, the underlying generative architecture of a digital ecosystem is not
well known. In this study, we draw on a network biology approach to explore the architectural pattern of
how individual software modules in a digital ecosystem interact with one another to produce a seemingly
ever-changing ecosystem. We conduct an empirical study using data from WordPress.org, the world’s
largest blog service platform using text mining and network analysis to extract the API (Application
Programming Interface) components used in plug-ins developed by both WordPress and third-party
developers. We examine the underlying generative structure of the WordPress ecosystem through a co-
expression network of APIs. Even though there is no central designer who coordinates the design of all
plug-ins and the overall growth of the entire WordPress ecosystem, our results show that the way APIs are
used to form complex and dynamic ecosystem of WordPress follows a discernable pattern that is distinct
from known distributions. The analysis further reveals that while the APIs created by the focal firm play a
central role in shaping the architecture of the generativity of the ecosystem, some of the external APIs
developed by other players also have an important role in shaping the ecosystem, showing the distributed
nature of the architecture of the generativity.

1
Introduction
As products and services are becoming increasingly digitalized, firms can no longer simply focus on
enhancing the features and quality of their products through their own innovation efforts (Yoo et al. 2010).
Instead, many firms try to leverage the creativity of others by creating a digital ecosystem (Tiwana et al.
2010). A digital ecosystem consists of: (a) a platform which is designed and maintained by a focal firm and
(b) a collection of third-party developed complementary products (also known as plug-ins). A digital
platform includes a set of boundary resources such as Application Programming Interfaces (APIs) and
Software Development Kits (SDKs) that focal firms provide for third-party developers to facilitate their
development efforts, together with a set of rules and norms that govern the behaviors of the participating
firms (Ghazawneh and Henfridsson 2012a; Tiwana et al. 2010). In the process, third-party developers
leverage APIs that are provided by the platform owner and other firms to create new plug-ins (Eaton et al,
forthcoming).
Previous research on modularity has shown that firms use modules to enhance the flexibility of their
products through a “mixing and matching” strategy without redesigning the entire system (Garud and
Kumaraswamy 1993; Sanchez and Mahoney 1996). However, emerging digital ecosystems with third-party
developers challenge the traditional concept of modularity with a fixed system boundary and fixed set of
relationships among modules (Yoo et al. 2010). To the contrary, new digital ecosystems have unclear and
malleable boundaries as they harness the distributed creativity among heterogeneous actors who bring
diverse knowledge and technological resources in creating new add-on products such as plug-ins or apps
(Yoo et al. 2012). In such digital ecosystems, novel and unanticipated recombinations of existing software
code modules such as APIs often serve as the source of generative and unbounded innovations (Arthur
2009). Therefore, the generativity of a digital ecosystem is fundamentally different from the flexibility of
a closed modular system. While the flexibility of a closed modular system comes from the variety of
modules of the same kind (Baldwin and Clark 2000; Sanchez and Mahoney 1996), the generativity of an
open ecosystem comes from the variety of plug-ins of different kinds (Yoo et al. 2012).

2
In this study, we seek to understand the underlying generative architecture of such digital ecosystems.
Generativity refers to “the capacity of technology to produce unprompted changes driven by large, varied,
and uncoordinated participants” (Zittrain 2006). The logic of generativity offers, therefore, an insight into
how organizations such as Apple and Google offer a large array of innovations through their platforms by
harnessing the creativity of third-party developers. In fact, generativity of digital innovation is driven by
ongoing recombination of heterogeneous technology artifacts, often unanticipated and surprising ways.
Such recombinant of digital technology thus form complex “wakes of innovations” as observed by Boland
et al. (2007). Despite of its theoretical and practical importance, little attention has been paid to the
underlying structure of generativity and how innovations by some actors can instigate complex wakes of
innovations (Boland et al. 2007) that traverse through the entire digital ecosystem.
Information Systems (IS) scholars have studied technology-enabled innovations in organizations
(Sambamurthy et al. 2003; Swanson 1994). However, most of these studies are confined to the context of
firms that innovate following the logic of modularity. Many IS studies focus on how organizations can
modularize and virtualize organizational resources to maximize the efficiency and effectiveness of its
operations (Overby et al. 2010; Yoo et al. 2012; Yoo et al. 2010). As such, existing theories on innovation
in the IS literature cannot effectively capture the dynamic and generative nature of innovations that we see
in contemporary digital ecosystems where innovation occurs through the interplay between the focal firm
and third-party developers (Tiwana et al. 2010).
In order to fill this void in the literature, we draw on models of generativity mainly from network biology.
A network biology perspective focuses on the interactions among existing components (i.e., genes or
proteins in biology) as a way to understand the dynamic structure of cells and organisms (Fleming and
Sorenson 2001; Fleming and Sorenson 2004; Kauffman 1993; Kitano 2002; Levinthal 1997). Specifically,
the field of network biology (in the molecular sense) is concerned with how interactions among genes
produce functionally differentiated cell types in an organism; such interaction patterns among genes are
captured through a co-expression network (Ravasz et al. 2002; Ruan et al. 2010; Stuart et al. 2003; Zhang

3
and Horvath 2005). Such networks are effective in identifying and characterizing patterns of gene
interactions in the form of clusters.
A biological network draws many similarities with a digital ecosystem where components such as APIs,
plug-ins, and mash-ups evolve in a dynamic way, and interactions between these components leads to
innovations in the ecosystem. Based on this insight, we explore the underlying structure of generativity in
a digital ecosystem. In particular, we focus on how independent heterogeneous developers create new plug-
ins by combining diverse APIs. Further, we explore how such independent actions by heterogeneous actors
produce orderly design patterns of an extremely large and complex digital ecosystem without a central
design authority. We use a co-expression network to explore clusters of APIs that are repeatedly used
together to generate plug-ins as a way of understanding the structure of the generativity of a digital
ecosystem (Ravasz et al. 2002). Specifically, we ask:
a) What is the underlying generative structure of a digital ecosystem?
b) What is the role of the focal firm vis-à-vis third-party developers in influencing the generativity in
a digital ecosystem?
We answer these questions using a data set collected from WordPress.org, the world’s largest blog service
platform. The WordPress ecosystem is known for its vibrant and diverse set of functions provided through
a large number of plug-ins, most of which are designed and built by third-party developers. We first review
existing literature on modularity and generativity. Second, we introduce a network biology approach and
the notion of co-expression networks and discuss how they can be used to explain generativity in a digital
ecosystem. Third, we present the results of our empirical study. We conclude by discussing the theoretical
and managerial implications of using the network biology perspective in understanding the generativity of
a digital ecosystem.

4
Literature Review
Modularity
Every since Simon (1962) proposed the notion of modularity as a way of understanding a complex system,
modularity has been one of the core constructs in management research [Schilling, 2002 #4011]. One can
use a modular architecture to represent a complex system divided into a set of subsystems that perform
specific functions and their relationships (Ulrich 1995). As such, modularity offers simplicity in dealing
with a complex system as one can focus on an overall architectural scheme that defines the boundary of the
system, the modules that make up the system, and interfaces among the modules, while leaving the detailed
design of the modules to others. This allows an effective division of labor among different actors during
the design and production of a complex system (Sosa et al. 2004; Staudenmayer et al. 2005).
Not only does modularity reduce the complexity in design and production of a product, it also increases its
flexibility by allowing the “mixing-and-matching” of various modules (Sanchez and Mahoney 1996). Such
a “mixing-and-matching” strategy is possible as one can replace one module with another as long as they
both conform to the same standardized interface (Baldwin and Clark 2000). For example, with personal
computers, a user can use any video board or a monitor as long as it follows the same standard and protocol.
Firms can then increase product variations by leveraging modules in an increasingly “intermeshed” way
(Sanchez 2004).
Traditionally, scholars have focused on the role of a firm who controls the design of a product through its
architectural knowledge (Clark 1985; Henderson and Clark 1990). Recently, however, scholars have begun
to propose that heterogeneous firms can autonomously coordinate (either explicitly or implicitly) their
designs and production of modules without the intervention of the architecture owner when the architecture
is mature enough with a set of clearly articulated interfaces (Staudenmayer et al. 2005). In this sense, a
product can be considered as a network of peer modules that share the same interfaces in order to function
as a whole (Sosa et al. 2005). By leveraging such flexibility stemming from modularity, a firm which owns

5
the architecture can dramatically increase variations in the product and the overall agility of the organization
without incurring high transaction cost (Sambamurthy et al. 2003; Sosa et al. 2004).
While such a network perspective of modular innovations helps us understand production innovations, these
models make implicit assumptions that the boundary of a system is fixed and clearly articulated a priori by
a central authority (Nickerson and Zenger 2004). Therefore, the flexibility of a product and its variations
occur within the confinement of a given architectural scheme (Ulrich 1995). Here, modules are product-
dependent, no matter how diverse they are. That is, the product is designed first and then modules are
designed (Gulati et al. 2012; Yoo et al. 2010)
To the contrary, in digital ecosystems where modules are designed first without considering particular
product architecture, modules are product-agnostic. For example, when Google introduced its popular
Google Maps APIs, these API modules were not designed for specific products. Yet, in a short time, they
were combined with a multitude of other resources available on the Internet (e.g., Craigslist, Facebook,
private databases) to produce thousands of what we in the vernacular call mash-ups. Most of these mash-
ups were not intended, designed, or approved by Google. Now these Google Maps APIs are integrated with
different types of hardware such as mobile phone, portable navigation devices, digital cameras, and
automobiles, with new types of innovations that were not intended by Google being continually created.
There appears to be no explicit modular architecture that provides a fixed boundary of the system in this
case. In a way, innovations in digital ecosystems are unbounded (Yoo et al. 2010). In this paper, we offer a
new theoretical perspective on innovations in digital ecosystems that do not require a priori modular
architectural knowledge defining the boundary and interfaces of a system.
Generative Architecture of a Digital Ecosystem
The idea of generativity is a useful concept to understand the dynamic and unbounded aspect of digital
innovations (Yoo et al. 2010). Zittrain (2006) focuses on particular features of digital technology and the
behavioral traits of actors in order to explain the generativity of digital artifacts. In this paper, we adopt the
6
(re)combinatorial view of digital innovation, focusing on the recombination of existing software code
modules, or APIs, to create new features of an ecosystem as they are implemented as complementary
products, or plug-ins, developed by third-party developers (Chesbrough et al. 2006; Tiwana et al. 2010).
Specifically, we define the generativity of a digital ecosystem as its reproductive capacity to produce
unprompted and uncoordinated changes in its structure and behavior without the control of a central
authority by utilizing existing software modules that can be recombined in novel ways. The term “digital
ecosystem” refers to a set of a platform, APIs, and complementary products (Cusumano and Gawer 2002;
Tiwana et al. 2010) together with a set of actors including the platform owner and third-party developers
(Ghazawneh and Henfridsson 2012b).
At the core of our conceptualization of generative architecture of a digital ecosystem is a rich set of
heterogeneous APIs that produces an ever-changing landscape (Nickerson and Zenger 2004). Many
successful digital ecosystems such as iOS, Facebook, and WordPress critically depend on innovations by
heterogeneous third-party developers who create new digital artifacts (such as software plug-in programs
or apps) in pursuit of their own self-interests and ideas. However, these generative actions by third-party
developers are not entirely random, as they often rely on existing APIs in building their own digital artifacts
(Fleming and Sorenson 2004; Nelson and Winter 1982). APIs are developed not only by platform providers
such as Google, but also by firms that do not have their own platform services. Therefore, the generativity
of a digital ecosystem is an outcome of purposive re-combination of existing heterogeneous APIs
(Chesbrough et al. 2006). Incredibly rich sets of digital artifacts (namely, plug-ins) are derived from
simultaneous interactions among pre-existing APIs. In an abstract way, one can argue that new breeds of
digital artifacts in a digital ecosystem can be created through the creative recombination of existing modules.
To explain the generative architecture of a digital ecosystem, we adopt a network biology perspective that
describes how similar DNA sequences can produce many different cells with diverse functions based on
co-expression of genes (Kauffman 1993).
7
Theory Development
A Network Biology Approach
One of the key goals of network biology is to systematically understand the generativity of complex
biological systems containing multiple cell types deriving from the same genetic informational code
(Barabási and Oltvai 2004). These multiple cell types, exhibiting different functions, are produced through
selective, non-linear, and non-additive interactions among genes (Kitano 2002). While a gene is the basic
functional unit in any genome whose information is stored as DNA, these DNA are eventually translated
into amino acids and assembled as a three-dimensional protein, the basic functional and structural unit of a
cell. Interactions between genes/proteins, also known as epistasis, provide the structural backbone for
intercellular networks and, ultimately, for the complexity that we see in biological systems. Building a co-
expression network is a powerful approach in biology that effectively captures how different genes are co-
expressed in phenotypes through complex generative processes such as cell differentiation and
morphogenesis (Zhang and Horvath 2005). Thus, a co-expression network, via highly dynamic and
generative patterns of interactions among genes, can help us to understand the generativity by which
common genotypes give rise to different phenotypes, thereby, determining how different cells perform
different functions within an organism even though they all share the same set of instructions, i.e., DNA
(Barabási and Oltvai 2004; Ruan et al. 2010; Strogatz 2001; Stuart et al. 2003).
Although the pattern of interactions among genes is non-linear and selective, certain combinations of genes
are repeatedly used across a diverse set of functions. These recurring patterns of gene interactions form the
basis of clusters of functionally similar gene interactions, with varying degrees. In this process, modifier
genes can play important roles in increasing the degree of phenotypic varieties by influencing the expression
of these recurring sets of genes. A modifier gene refers to genes that have little quantitative effects on the
functional expression of gene networks but cause subtly different levels of gene expression (Lobo 2008;

8
Nadeau 2001). Clusters of gene interactions, i.e., gene networks, can differ subtly, by the presence of
modifier genes (Ruan et al. 2010).
Furthermore, the combinations of these gene clusters (i.e., recurring patterns of gene interactions) form the
basis of different cell types. To capture the diversity of cells, researchers are beginning to identify the
landscape of co-expression networks via topological overlaps (Ravasz et al. 2002; Stuart et al. 2003; Zhang
and Horvath 2005). A network topology represents the hierarchical structure of a network, using a bottom-
up approach to identify clusters of gene interactions that are frequently used together (Albert and Othmer
2003), and are useful in understanding the large structure of a complex network (Jeong et al. 2000). Using
a topological network model, one can explore and delineate the possible presence of recurring patterns of
gene interactions in a cell (Zhao et al. 2010). Most importantly, by focusing on topological overlaps, one
does not need to focus on individual genes, but on the network of gene interactions, thus, representing
phenotypes as an interactive network.
A Network Model of Generative Architecture of Digital Ecosystems
An increasing volume of modern digital products, such as plug-ins for web services or mobile apps, consist
of existing software modules (APIs) and additional software codes that connect these modules together and
add additional functionalities such as user interface. Therefore, one can conceptualize the functional
differentiations among different plug-ins through co-expressions of APIs, as biologists can capture the
functional differences among cells through co-expressions of genes(Bullmore and Sporns 2009; Emilsson
et al. 2008; Hawrylycz et al. 2012; Zhang and Horvath 2005). Just as biologists can then construct a gene
co-expression network based of the pattern of gene co-expressions, we can construct a co-expression
network of software modules to characterize the way different APIs are used to create these digital products.
Further, as certain combinations of APIs are likely to be used more frequently than others, we can identify
certain combination of APIs in the same way biology scholars identify recurring gene interactions. The
pattern by which these combined set of APIs are used for different plug-in software products in a digital

9
ecosystem forms the generative architecture of the ecosystem. Furthermore, this generative architecture can
be simplified by identifying topological overlaps of combination.
In this paper, we characterize each plug-in as a combination of APIs. For example, in Figure 1, we have
five different APIs (A0, A1, A2, B0, and B1). APIs labeled as A are developed by one firm and APIs labeled
as B are developed by another firm. These five APIs are used to produce two different plug-ins, represented
by two rectangular boxes. Plug-in 1 (solid line) uses a set of APIs including A0, A1, B0 and B1; Plug-in 2
(dotted line) uses a set of APIs including A0, A1, A2, and B0. From this, we can identify a topological
overlap between the two plug-ins that share A0, A1 and B0.
An important characteristic of a digital ecosystem is the absence of a central design authority that
coordinates and integrates the innovation activities of others (Tiwana et al. 2010). Using the topological
overlap and the co-expression network of APIs, we can examine how different plug-ins are created through
combinations of different APIs.
Figure 1. Topoligical overlaps between two hypothetical two plug-ins
Specifically, we draw on a network biology perspective to explore the landscape of the WordPress
ecosystem in this paper. The WordPress ecosystem consists of a large number of plug-ins that provide offer
functionalities. These plug-ins in turn are crated by combining APIs. Therefore, the relationship among sets
of APIs as shown in the topological overlaps represents the underlying generative architecture of the entire
ecosystem. We further explore the nature of control of an ecosystem by examining the ownership of
B0 A1 A0
A2
B1
APIs by Firm A
APIs by Firm B
Local Software Code
Plug-in 2
Plug-in 1

10
individual APIs that belong to different plug-in types. Ultimately, we offer a new theoretical and empirical
framework of generative architecture in a digital ecosystem.
An Empirical Study
Data
We collected data from WordPress.org (WordPress from hereon). Wordpress offers an excellent example
of how generativity occurs through the participation of third-party developers who develop plug-ins in a
digital ecosystem. Plug-ins are composed of various APIs that extend the original functionality of
WordPress platform system. Here, we categorize APIs into two types: internal and external. Internal APIs
refer to APIs developed in-house by WordPress. Internal APIs allow third-party developers to structure
ideas onto the WordPress platform system. However, they offer a limited set of functions. On the other
hand, external APIs represent APIs provided by web service providers such as Google, Facebook and
Twitter. External APIs offer various sets of functions that WordPress does not offer. Therefore, the
interactions between internal APIs and external APIs form the genetic basis of a rich array of plug-ins.
A total of 23,954 plug-ins were available to analyze the usage of APIs among more than 35,000 plug-ins
listed on WordPress as of December 2014. A text-mining program in Java was developed to identify the
usage of internal and external APIs in these plug-ins. API information was collected from two different
websites in order to automate the extraction process. According to WordPress website, there are 99 internal
APIs. We collect detailed information about internal APIs from the WordPress website. The information
about external APIs was collected from www.programmableweb.com, a website that maintains a directory
of more than 11,000 web APIs and mashups as of December 2014. Our text-mining tool identified a total
of 443 APIs (99 internal APIs + 344 external APIs) in the source code of 23,954 plug-ins.
Therefore, we constructed a 23,954 plug-ins x 443 APIs matrix through the extraction process. We used
the binary values (0 and 1) for the entries of a matrix in order to focus on which APIs are used in a plug-in.
‘0’ represents that an API is not used in a plug-in, while ‘1’ implies that an API is used. 23, 218 plug-ins

11
include at least one API. On average, each plug-in uses 6.66 functionally different APIs (with a standard
deviation of 4.98) with the minimum number of APIs used being 1 and the maximum number 92. Each API
is used 349.16 times among 23, 954 plug-ins (with a standard deviation of 1737.98) with the minimum
number of an API usage is 1 and the maximum number of an API usage is 21, 756.
Analytical Approach
In order to answer the first research question, we build a plug-in co-expression network from our data set.
A plug-in co-expression network is an undirected network. Each node represents a plug-in, and each edge
indicates the connection strength of a pair of plug-ins in terms of the shared usage of APIs (Horvath and
Dong 2008). Each edge indicates a weighted value depending on commonly used APIs. The weight of the
edge is greater when a pair of plug-ins uses the same APIs more frequently. In particular, the weight of
edge is calculated through the topological overlap of APIs’ (re)combinatorial patterns in each plug-in
(Ravasz et al. 2002). Therefore, a co-expression network represents the unbiased metric in quantitatively
estimating the similar (re)combinatorial patterns that essentially determine the underlying structure (Ruan
et al. 2010; Stuart et al. 2003).
We construct a plug-in co-expression network according to the following procedure (Horvath 2011; Zhang
and Horvath 2005). First, we build an adjacency matrix of plug-ins from the data set. An adjacency matrix
maps a 23, 218 x 23, 218 plug-in matrix from the shared use of APIs between a pair of plug-ins. This matrix
helps define the distance between plug-ins depending on how close they are based on the number of shared
APIs. A connection of nodes includes indirect neighboring relationships among plug-ins. An adjacency
matrix is measured between plug-ins i and j represented as 𝑎𝑎𝑎. The matrix shows weighted entries that
range from 0 to 1. 𝑎𝑎𝑎 is equal to 1 when plug-ins i and j share the same set of APIs. If a plug-in does not
use the same APIs, 𝑎𝑎𝑎 will be 0.
Second, we use the topological overlap to estimate the relative inter-connectedness (Doncheva et al. 2012;
Ravasz et al. 2002). Entries of the topological overlap matrix represents the weighted similarity measure in

12
a plug-in network based on the adjacency matrix (Zhao et al. 2010). The topological overlap measure aims
to detect the centrality and the hierarchical architecture of a plug-in network. The number of direct
neighbors of a plug-in i is 𝑎𝑎 = ∑ 𝑎𝑎𝑎𝑎 , where 𝑎𝑎 represents how a plug-in is similar with its
neighboring plug-ins with respect to the usage of APIs and the number of APIs shared by plug-ins i and j
is ∑ 𝑎𝑎𝑎𝑎𝑎𝑎𝑎 ≠𝑎,𝑎 . From this process, we obtain the topological overlap matrix as follows:
𝑎𝑎𝑎𝑎𝑎𝑎𝑎𝑎𝑎𝑎𝑎 𝑎𝑎𝑎𝑎𝑎𝑎𝑎 𝑎𝑎𝑎𝑎𝑎𝑎𝑎 = ∑ 𝑎𝑎𝑎𝑎𝑎𝑎+ 𝑎𝑎𝑎𝑎 ≠𝑎,𝑎
min(𝑎𝑎+ 𝑎𝑎)+1− 𝑎𝑎𝑎, whose value is “0” if plug-ins i
and j are not connected and do not share any APIs. The topological overlap measure offers quantitative
robustness in understanding a complex network (Yip and Horvath 2007). In particular, the topological
overlap measure can segment the boundary of clusters in a network. Similar entry values of topologically
overlapped measure are likely to form a cluster in a network (Ravasz et al. 2002). The hierarchical structure
of a network can be represented through exploring the topological overlap measure, and sub-clusters can
be classified within a cluster.
Third, we draw a dendrogram, or a hierarchical clustering tree, from the hierarchical clustering analysis
(Langfelder et al. 2008). Each entry in a topological overlap matrix represents the distance of network
centrality between plug-ins. A cluster is composed of a group of entries having similar entry values in a
topological overall matrix (i.e., entry values can have the specific range such as 0.90 to 0.92). A hierarchical
cluster analysis allows us to build the hierarchy of given clusters by estimating the degree of dissimilarity
among clusters (Hastie et al. 2009). We agglomerate the degree of dissimilarity from calculating the average
distance among the entries of topological overlap measure. In particular, a dendrogram visualizes the degree
of dissimilarity in each cluster. The dissimilarity degree is proportional to the branch length in a dendrogram.
Each branch indicates a specific cluster of plug-ins. Each leaf at the terminal end of a branch indicates a
plug-in on a dendrogram. A branch length is represented by the height of a dendrogram that specifies a
distance point where two plug-ins or clusters are merged into a single cluster. Thus, we can visually
understand how each plug-in is connected with other plug-ins and how plug-ins can be clustered depending
on the shared usage of APIs.
13
Fourth, we generate a topological overlap plot of the co-expression network in order to get a simplified
view of a complex network to identify hierarchical structure (Bullmore and Sporns 2009; Stuart et al. 2003;
Zhang and Horvath 2005). A topological overlap plot does not only offer the structural pattern of plug-ins
from the cluster of plug-ins but also allows us to understand the connections of plug-ins across different
clusters. Thus, a topological overlap plot offers what a dendrogram cannot provide. In particular, the rows
and columns are characterized from a dendrogram, so we can visually identify how plug-ins are connected
with one another through shared APIs even with plug-ins belong to different clusters. The range colors in
a topological overlap plot represent the different degree of the measure.
Finally, to gain a deeper understanding on the generative architecture of WordPress ecosystem, we explore
our mined network of 23,954 plug-ins and 443 APIs, using a Circos plot (Krzywinski et al. 2009). The
Circos plot applies a circular ideogram layout of API usages on the circular map where plug-ins are aligned
to represent the connectivity between APIs and plug-ins. By applying Circos, we can systematically and
visually examine the design patterns and the impact of internal and external APIs on the generation of plug-
ins in the network of API and plug-in.
Our second research question concerns the control of a digital ecosystem. This control of a digital ecosystem
can enlighten us where the functional variations come from and how much internal and external APIs
contribute to the network structure in a digital ecosystem (Holland 1992; MacCormack et al. 2010). Highly
dynamic and generative patterns of API interactions lead to multiple functional variations and different
network topologies across clusters in a network of a digital ecosystem. Thus, the nature of control of an
ecosystem depends on the combination between internal APIs and external APIs. To answer this second
research question, we use the degree distribution of APIs based on an API network to explore the role of
each API on the network structure. We constructed API interaction network from the same 23, 954 plug-
ins x 273 APIs matrix. In an API interaction network, a node is defined as an API, and its degree refers to
the number of edges connected to the node in the network (Newman 2003). An edge between two nodes
(APIs) means that they are used by the same plug-in. Thus, the degree of APIs in an API interaction network
14
characterizes the overall level of all APIs’ co-expression for all plug-ins. Using the degree of nodes, we
can, therefore, understand how each internal and external APIs contribute to the generativity of a digital
ecosystem.
Results
Underlying Structure of Generativity in a Digital Ecosystem
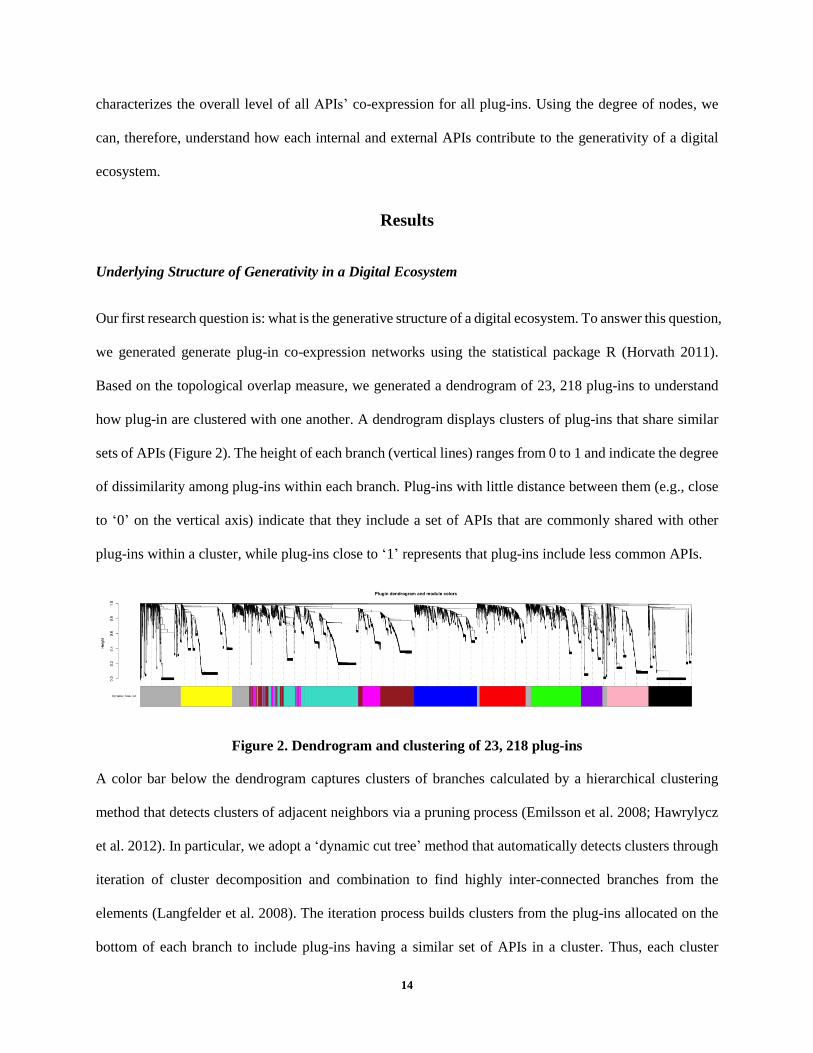
Our first research question is: what is the generative structure of a digital ecosystem. To answer this question,
we generated generate plug-in co-expression networks using the statistical package R (Horvath 2011).
Based on the topological overlap measure, we generated a dendrogram of 23, 218 plug-ins to understand
how plug-in are clustered with one another. A dendrogram displays clusters of plug-ins that share similar
sets of APIs (Figure 2). The height of each branch (vertical lines) ranges from 0 to 1 and indicate the degree
of dissimilarity among plug-ins within each branch. Plug-ins with little distance between them (e.g., close
to ‘0’ on the vertical axis) indicate that they include a set of APIs that are commonly shared with other
plug-ins within a cluster, while plug-ins close to ‘1’ represents that plug-ins include less common APIs.
Figure 2. Dendrogram and clustering of 23, 218 plug-ins
A color bar below the dendrogram captures clusters of branches calculated by a hierarchical clustering
method that detects clusters of adjacent neighbors via a pruning process (Emilsson et al. 2008; Hawrylycz
et al. 2012). In particular, we adopt a ‘dynamic cut tree’ method that automatically detects clusters through
iteration of cluster decomposition and combination to find highly inter-connected branches from the
elements (Langfelder et al. 2008). The iteration process builds clusters from the plug-ins allocated on the
bottom of each branch to include plug-ins having a similar set of APIs in a cluster. Thus, each cluster

15
represents the pattern of API interaction distinct from other clusters. Colors are automatically assigned to
each cluster depending on the size of each cluster. Eleven different colors are used to specify each cluster
as Figure 1 and Table 1 indicates. Note that the grey color does not indicate a specific combinatorial pattern
of cluster as it represents a group of plug-ins that do not show any particular pattern.
Color Grey Turquoise Blue Brown Yellow Green
Number of Plug-ins 3, 080 3, 257 2, 651 2, 319 2, 161 2, 102
Average API usage 9.58 4.29 9.17 6.21 3.34 8.48
Standard Deviation 8.54 1.55 2.81 2.04 1.37 2.88
Maximum API usage 92 12 27 16 12 23
Minimum API usage 1 1 3 3 2 3
Color Red Black Pink Magenta Purple _
Number of Plug-ins 1, 934 1, 808 1, 737 1, 272 897 _
Average API usage 13.02 1.47 3.94 7.01 4.23 _
Standard Deviation 4.44 0.82 1.85 2.06 1.81 _
Maximum API usage 34 6 13 14 12 _
Minimum API usage 3 1 1 3 2 _
Table 1. Plug-in statistics for each cluster of APIs
In Figure 2, some colors in a color bar are interlaced with different colors due to the hierarchical relationship
(Langfelder and Horvath 2007). For example, Pink cluster superseeds Turquoise cluster. That is, while
plug-ins in Pink cluster share the same set of APIs that are repeatedly used by plug-ins in Turquoise cluster;
however, plug-ins in those clusters have a set of additional APIs that are repeatedly used together with the
set of APIs that are heavily used in plug-ins in Turquoise cluster (Emilsson et al. 2008; Ghazalpour et al.
2006).
The nested hierarchy of clusters is more clearly delineated from a topological overlap plot as shown in
Figure 3. A plug-in co-expression network allows us to visually understand the structural patterns of the
WordPress ecosystem from the clusters of 23, 218 plug-ins and the hierarchical relationship among them.

16
A color bar corresponding to the dendrogram in Figure 2 is plotted on the top and left side of the topological
overlap plot. Thus, the connectivity of plug-ins across clusters can be explored from the plot.1
Figure 3. A topology overlap matrix plot of 23, 218 plug-ins
The different degrees of topological overlap within a cluster are represented mainly by two different colors.
A red color represents the dense topological overlap within a topological structure, or high similarity, and
a yellow color indicates the sparse topological overlap, or low similarity. Red-colored plug-ins have more
extensively used the same set of APIs compared to other plug-ins denoted in yellow. Thus, different color-
1 Since Figure 3 contains 23, 218 analyzed plug-ins, the name of each plug-in could not be specifically noted on the
figure.

17
coded regions represent the level of diversified recurring sets of APIs with the combination of modifier
APIs.
On the diagonal of Figure 3, each cluster represents the delineated boundary, which is generated from the
high interaction strength among plug-ins. The interaction strength of a network is represented by the
topological overlap measure calculated from the correlation among plug-ins. A high topological overlap
measure is possible when each plug-in has similar combinatorial patterns of APIs compared to other plug-
ins in the cluster. Therefore, clusters on a diagonal region imply the existence of underlying structural
pattern in a network. An off-diagonal region in the topological overlap plot also represents the interaction
strength, as the interaction among plug-ins across different clusters can be possible. The interaction can be
seen as cross-breeding between different types of plug-ins. As one can expected the interaction strength
across clusters is not strong as that of within a cluster.
Our analysis of a plug-in co-expression network provides an answer to our first research question. We
found an orderly hierarchical structure of plug-ins with clearly differentiated boundaries across them.
Furthermore, this hierarchical structure represents different “species” of plug-ins based on shared genetic
components, namely APIs. Clusters are differentiated based on shared sets of APIs that are common among
plug-ins that belong in the same clusters. Each cluster has a set of APIs with a high degree of topological
overlap. Thus, it appears that certain APIs form functionally “core foundations” (“genetic foundations”) of
plug-in clusters, while other APIs play the role of “peripheral genes” ( “modifier genes”). The cores in the
hierarchical clusters of a complex network system such as molecular network and a system architecture
control the interaction of other nodes to perform general functions, and the peripheries create functional
diversities combined with the cores within a cluster (Liu et al. 2011; Zhao et al. 2006).
We further explore how APIs are actually used in each plug-in to better understand the underlying genetic
structure of different clusters. To do this, we construct a network of plug-ins and APIs using a Circos plot
(Krzywinski et al. 2009). A Circos plot enables “big data” visualization and, in our case, displays how plug-
ins in eleven clusters are connected with both internal and external APIs. Our Circos plot consists of regions

18
that form a circle, with lines that connect these regions, and histograms for regions. In Figure 4, two small
regions at the top of the diagram represent internal (left) and external (right) APIs. The rest of the regions
represent the six plug-in clusters identified in Figures 2 and 3: Grey, Turquoise, Blue, Brown, Yellow,
Green, Red, Black, Pink, Magenta, and Purple in clockwise direction. A blue line indicates a connection
between a plug-in and an internal API, and a red line denotes a connection between a plug-in and an external
API. The histograms above the circular regions indicate how many internal APIs (color blue) and external
APIs (color red) are used on each plug-ins. The Circos plot provides a comprehensive and systematic
blueprint enabling us to understand the role of both internal and external APIs on the generation of plug-
ins, allowing us to identify the genetic foundation and modifier APIs for different clusters of plug-ins.
Figure 4. A Circos plot of a plugin-API network in Word Press Ecosystem
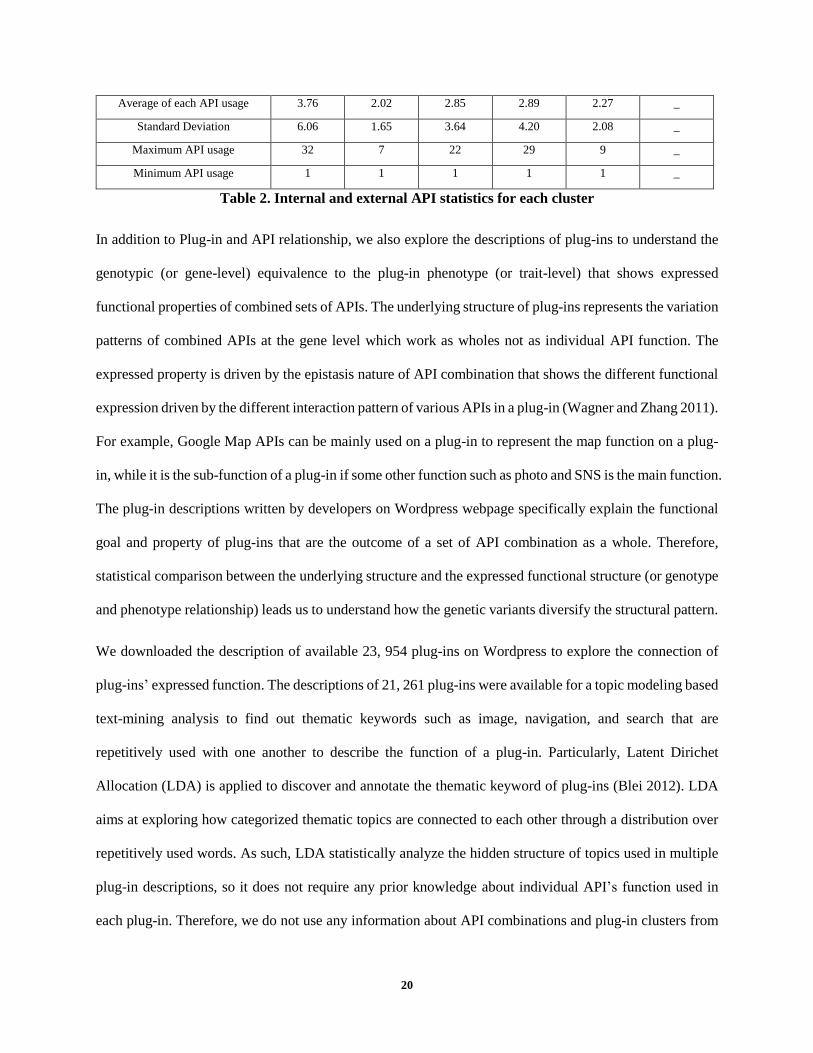
Using the data from the Circos plot, we produce descriptive statistics on each cluster based on internal and
external APIs. Table 2 shows that while the use of internal APIs are somewhat consistent across the eleven

19
clusters showing 79 internal APIs on average (with 15.17 standard deviation), the use of external APIs
varies more across different clusters showing 79 external APIs on average (with 42.69 standard deviation),
indicating that the differences across these clusters are produced through external APIs. The standard
deviation in each cluster is larger than the mean of each API usage in total API usages in Table 2, showing
that certain APIs are clearly more frequently used than other APIs.
Color Grey Turquoise Blue Brown Yellow Green
Total number of API usages 278 179 204 174 124 164
Average of each API usage 106.16 78.12 119.15 82.84 58.14 108.75
Standard Deviation 307.43 402.26 440.33 347.45 275.90 362.38
Maximum API usage 2283 3241 2624 2319 2144 2097
Minimum API usage 1 1 1 1 1 1
Number of internal API usages 99 79 89 92 85 85
Average of each API usage 285.24 171.85 266.15 152.27 83.15 205.6
Standard Deviation 463.82 592.34 637.16 466.93 330.23 483.58
Maximum API usage 2283 2341 2624 2319 2144 2097
Minimum API usage 1 1 1 1 1 1
Number of external API usages 179 100 115 82 39 79
Average of each API usage 7.11 4.08 5.38 4.95 3.61 4.54
Standard Deviation 16.16 6.05 9.80 8.86 4.27 7.19
Maximum API usage 98 27 44 51 19 37
Minimum API usage 1 1 1 1 1 1
Color Red Black Pink Magenta Purple _
Total number of API usages 185 94 120 147 84 _
Average of each API usage 136.12 28.33 57.08 60.72 45.18 _
Standard Deviation 390.41 185.96 242.17 222.96 154.26 _
Maximum API usage 1931 1807 1723 1272 895 _
Minimum API usage 1 1 1 1 1 _
Number of internal API usages 92 57 68 77 51 _
Average of each API usage 269.92 45.40 98.54 113.30 72.94 _
Standard Deviation 520.43 237.24 315.47 298.47 192.95 _
Maximum API usage 1931 1807 1723 1272 895 _
Minimum API usage 1 1 1 1 1 _
Number of external API usages 93 37 52 70 33 _
20
Average of each API usage 3.76 2.02 2.85 2.89 2.27 _
Standard Deviation 6.06 1.65 3.64 4.20 2.08 _
Maximum API usage 32 7 22 29 9 _
Minimum API usage 1 1 1 1 1 _
Table 2. Internal and external API statistics for each cluster
In addition to Plug-in and API relationship, we also explore the descriptions of plug-ins to understand the
genotypic (or gene-level) equivalence to the plug-in phenotype (or trait-level) that shows expressed
functional properties of combined sets of APIs. The underlying structure of plug-ins represents the variation
patterns of combined APIs at the gene level which work as wholes not as individual API function. The
expressed property is driven by the epistasis nature of API combination that shows the different functional
expression driven by the different interaction pattern of various APIs in a plug-in (Wagner and Zhang 2011).
For example, Google Map APIs can be mainly used on a plug-in to represent the map function on a plug-
in, while it is the sub-function of a plug-in if some other function such as photo and SNS is the main function.
The plug-in descriptions written by developers on Wordpress webpage specifically explain the functional
goal and property of plug-ins that are the outcome of a set of API combination as a whole. Therefore,
statistical comparison between the underlying structure and the expressed functional structure (or genotype
and phenotype relationship) leads us to understand how the genetic variants diversify the structural pattern.
We downloaded the description of available 23, 954 plug-ins on Wordpress to explore the connection of
plug-ins’ expressed function. The descriptions of 21, 261 plug-ins were available for a topic modeling based
text-mining analysis to find out thematic keywords such as image, navigation, and search that are
repetitively used with one another to describe the function of a plug-in. Particularly, Latent Dirichet
Allocation (LDA) is applied to discover and annotate the thematic keyword of plug-ins (Blei 2012). LDA
aims at exploring how categorized thematic topics are connected to each other through a distribution over
repetitively used words. As such, LDA statistically analyze the hidden structure of topics used in multiple
plug-in descriptions, so it does not require any prior knowledge about individual API’s function used in
each plug-in. Therefore, we do not use any information about API combinations and plug-in clusters from
21
a plug-in co-expression network analysis. In this way, we try to get analytic robustness in statistically
mapping the genotype-phenotype relationship in the plug-in structure.
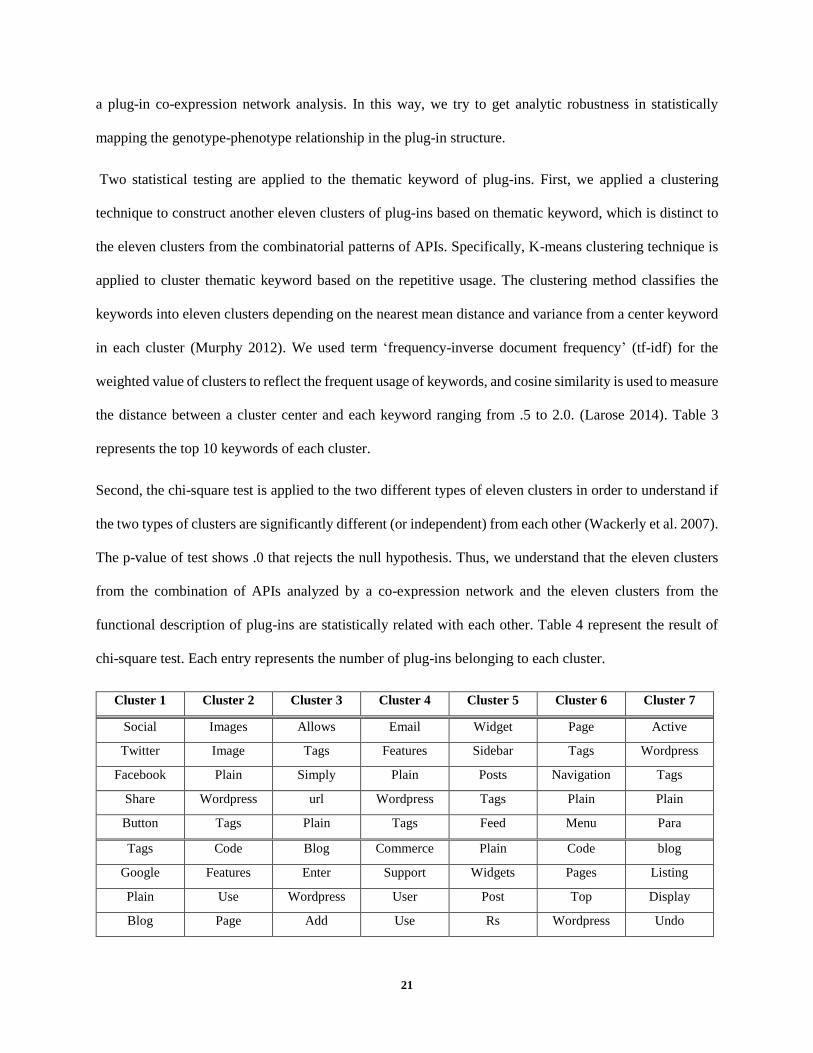
Two statistical testing are applied to the thematic keyword of plug-ins. First, we applied a clustering
technique to construct another eleven clusters of plug-ins based on thematic keyword, which is distinct to
the eleven clusters from the combinatorial patterns of APIs. Specifically, K-means clustering technique is
applied to cluster thematic keyword based on the repetitive usage. The clustering method classifies the
keywords into eleven clusters depending on the nearest mean distance and variance from a center keyword
in each cluster (Murphy 2012). We used term ‘frequency-inverse document frequency’ (tf-idf) for the
weighted value of clusters to reflect the frequent usage of keywords, and cosine similarity is used to measure
the distance between a cluster center and each keyword ranging from .5 to 2.0. (Larose 2014). Table 3
represents the top 10 keywords of each cluster.
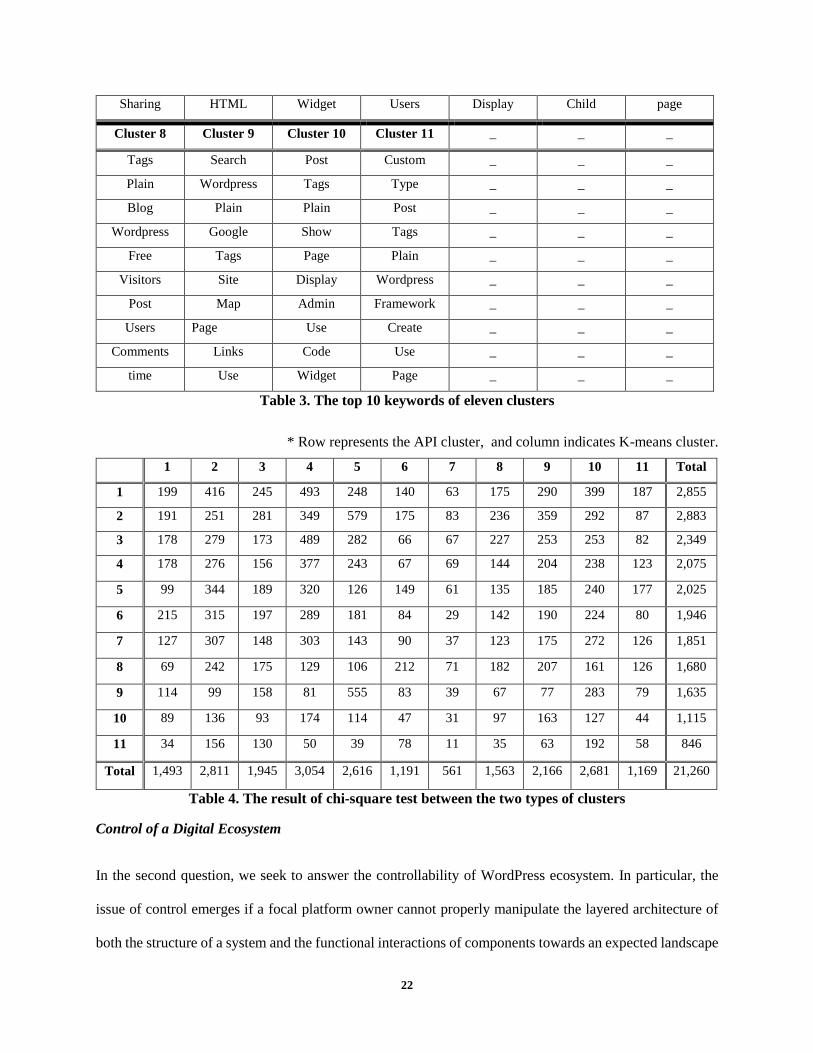
Second, the chi-square test is applied to the two different types of eleven clusters in order to understand if
the two types of clusters are significantly different (or independent) from each other (Wackerly et al. 2007).
The p-value of test shows .0 that rejects the null hypothesis. Thus, we understand that the eleven clusters
from the combination of APIs analyzed by a co-expression network and the eleven clusters from the
functional description of plug-ins are statistically related with each other. Table 4 represent the result of
chi-square test. Each entry represents the number of plug-ins belonging to each cluster.
Cluster 1 Cluster 2 Cluster 3 Cluster 4 Cluster 5 Cluster 6 Cluster 7
Social Images Allows Email Widget Page Active
Twitter Image Tags Features Sidebar Tags Wordpress
Facebook Plain Simply Plain Posts Navigation Tags
Share Wordpress url Wordpress Tags Plain Plain
Button Tags Plain Tags Feed Menu Para
Tags Code Blog Commerce Plain Code blog
Google Features Enter Support Widgets Pages Listing
Plain Use Wordpress User Post Top Display
Blog Page Add Use Rs Wordpress Undo
22
Sharing HTML Widget Users Display Child page
Cluster 8 Cluster 9 Cluster 10 Cluster 11 _ _ _
Tags Search Post Custom _ _ _
Plain Wordpress Tags Type _ _ _
Blog Plain Plain Post _ _ _
Wordpress Google Show Tags _ _ _
Free Tags Page Plain _ _ _
Visitors Site Display Wordpress _ _ _
Post Map Admin Framework _ _ _
Users Page Use Create _ _ _
Comments Links Code Use _ _ _
time Use Widget Page _ _ _
Table 3. The top 10 keywords of eleven clusters
* Row represents the API cluster, and column indicates K-means cluster.
1 2 3 4 5 6 7 8 9 10 11 Total
1 199 416 245 493 248 140 63 175 290 399 187 2,855
2 191 251 281 349 579 175 83 236 359 292 87 2,883
3 178 279 173 489 282 66 67 227 253 253 82 2,349
4 178 276 156 377 243 67 69 144 204 238 123 2,075
5 99 344 189 320 126 149 61 135 185 240 177 2,025
6 215 315 197 289 181 84 29 142 190 224 80 1,946
7 127 307 148 303 143 90 37 123 175 272 126 1,851
8 69 242 175 129 106 212 71 182 207 161 126 1,680
9 114 99 158 81 555 83 39 67 77 283 79 1,635
10 89 136 93 174 114 47 31 97 163 127 44 1,115
11 34 156 130 50 39 78 11 35 63 192 58 846
Total 1,493 2,811 1,945 3,054 2,616 1,191 561 1,563 2,166 2,681 1,169 21,260
Table 4. The result of chi-square test between the two types of clusters
Control of a Digital Ecosystem
In the second question, we seek to answer the controllability of WordPress ecosystem. In particular, the
issue of control emerges if a focal platform owner cannot properly manipulate the layered architecture of
both the structure of a system and the functional interactions of components towards an expected landscape
23
particularly when a system represent complex and heterogeneous nature (Liu et al. 2011). The plug-ins that
are generated by third party developers construct the unanticipated structure of WordPress ecosystem, and
the heterogeneous external APIs are used for the functional diversity of plug-ins. The two different layers
of WordPress ecosystem are not separated with each other but closely mapped for the topological nature of
WordPress ecosystem, as the set of API interactions construct the structure of plug-ins, which represent the
interaction of APIs in the other way around (Gao and Iyer 2006; Yoo et al. 2010). Thus, to answer the issue
of control , we need to find out specific APIs that are most heavily connected with other APIs in forming
different clusters in WordPress ecosystem through the degree of APIs (Sorrentino et al. 2007; Wang and
Chen 2002; Zhao et al. 2006). In order to do this, we constructed an undirected network in which nodes are
APIs, and a set of edges between some nodes is characterized as a plug-in.
In this API network, if two APIs have been used in the same plug-in, the two nodes are connected. The
edge list for constructing the API-API network is generated from the same matrix of 23,954 plug-in × 443
APIs. The list contains 13,104 edges among 443 nodes. The degree distribution of the API-API network is
shown in Figure 5. APIs that are heavily connected with other APIs in creating plug-ins would have a higher
degree. In particular, to understand the mixture of the degree distribution of two different API types, we
analyzed how each internal API and external API is ranked across the degree distribution. We use different
colors to represent internal and external APIs. If there is a difference in distribution pattern existing between
internal and external API, we can identify the difference from the visualization. In Figure 5, blue dots
indicate an internal API, and red crosses show external APIs. The highest degree of blue dots is 436 and
the lowest degree is 26, while the degree of red crossess is ranged from 1 to 169.

24
Figure 5. API degree distribution in 2014 Word Press Ecosystem
Our analysis of the mixture of the degree distribution of two API types reveals that the majority of internal
WordPress APIs occupies the left side of the overall hybrid distribution (i.e., more interactions), while the
majority of external APIs from third-party developers occupy the right side and tail of the distribution. This
pattern coincides with the premise that the left side represents the APIs that form the core foundations of
plug-in clusters, while the lower end of the distribution contain peripheral APIs that produce variants
through weaker epistatic effects to diversify the function of plug-ins (Levinthal 1997). Thus, the genetic
foundations of APIs are used across all plug-ins in general to interact with Wordpress. Thus, it appears as
though APIs forming the core foundations of clusters are primarily internal APIs developed by WordPress:
even though WordPress.org is an open ecosystem, WordPress exercises an extensive control over the

25
evolution and generativity of the ecosystem through its own 99 APIs. At the same time, our results also
show that some external APIs are competing for their spots with internal APIs in the left side of degree
distribution. In particular, these external APIs are shown as red crosses intervened with blue dots
particularly distributed in the range of degree from 100 to 200 in Figure 5. Thus, these several external APIs
are heavily co-expressed with other internal APIs for a large variety of plug-ins. However, we do not
statistically understand if the external APIs form a part of core foundations of the WordPress ecosystems.
We explore whether the external APIs are categorized into the core foundations or periphery APIs from the
core/periphery analysis that offers a key mechanism of understanding the complex interaction between
internal and external APIs (Borgatti and Everett 2000). The cores represent the node representing high
degree (or highly connected with other nodes) that implies the general usage among plug-ins, while the
peripheries imply low degree (or the loosely connected nodes with the cores) that are mainly connected
with high degree nodes for the functional diversity of plug-ins (Csermely et al. 2013). The core foundations
of network topology can be decomposed into different layered structures depending on the degree of
individual nodes that characterizes network properties (Garas et al. 2012; Rombach et al. 2014). In
particular, we specify the topology of core APIs into two layered structures. The universal cores refer to
the innermost APIs represent the most frequently used APIs across all 11 clusters in a plug-in network. The
cluster cores represent the core APIs that spread in each 11 cluster in a plug-in network and that placed into
the outer layers in the topology of an API network. Thus, the cluster cores are the core of each cluster that
are highly connected APIs with peripheries creating the diversity of plug-ns and structural uniqueness of
each cluster. By considering the 11 clusters information of plug-in network, we specifically consider the
information how APIs are connected with one another in the entire API network.
We considered the weighted and unweighted value of edges as a way to categorize APIs into different
structural layers from the core/periphery analysis (Borgatti and Everett 2000; Žiberna 2007). The
unweighted value of edges identifies the core foundations that include both the innermost and outer layer
list of APIs, while the weighted value narrows down the list of cores into the innermost APIs (Garas et al.

26
2012). First, the universal cores were selected from the analysis of the entire API network with the weighted
value of edges. The universal cores include 12 different APIs listed on the top of degree distribution ranging
from 278 to 436. We also did core/periphery analysis for the 11 different clusters of plug-in network in
order to gain robustness if APIs categorized into the universal cores are also the member of innermost cores
in each cluster. From the list of universal core APIs, we can understand that internal APIs mainly control
the entire WordPress ecosystem. We can identify the 12 universal core APIs from the analyzed result shown
in Figure 6 where most heavily connected internal APIs are the universal core foundation of WordPress
ecosystem as shown in Table 5. The x and y axis of Figure 6 represent the list of APIs where the small
square include the universal core APIs, and color blue lines demarcate the cores and peripheries in the
visualized result.

27
Figure 6. Core/Periphery analysis of an API network
Internal API Name Degree of Internal API Internal API Name Degree of External API
add_action 436 delete_option 325
get_option 414 add_shortcode 311
update_option 398 add_option 302
add_filter 376 register_setting 282
register_activati-on_hook 345 setting_fields 279
Apply_filters 332 register_deactivation_hook 278
Table 5. Internal APIs forming the core foundations in the degree distribution
Second, we did the analysis with unweighted value in each 11 cluster of plug-in network after removing
the list of universal core APIs. This is the main step to understand if the several external APIs interlaced in

28
the internal APIs in the middle of degree distribution are considered as the cluster core foundations.2 The
agglomerated list of cluster cores in each clusters were matched with the degree of APIs ranging from 94
to 277 where the group of APIs placed in the middle of degree distribution. The cluster core foundations
represent the middle section of degree distribution that is distinct to the universal core and the periphery.
There are few mismatched APIs between the degree distribution and the core lists of each cluster: four
external APIs ranging from 94 to 227 in the degree distribution and four internal APIs from the
agglomerated list of cluster core APIs among 95 APIs. However, the mismatched APIs were categorized
into the same group of APIs included in 95 APIs from the statistical analysis (Toivonen et al. 2011; Zhou
et al. 2014).
From the core/periphery analysis, we can understand that the external APIs interlaced into the internal APIs
placed in the middle of the degree distribution are categorized into the core foundations. While most
external APIs serve as periphery APIs that are used to produce variant plug-ins in the cluster, these external
APIs have now become part of core foundation of the WordPress.org ecosystem. So, while WordPress does
have extensive control over the ecosystem, it shares its control with key external firms whose APIs have
invaded its genetic network. Based on this premise, we can then identify top 20 most heavily connected
external APIs that are part of the core APIs of WordPress ecosystem as shown in Table 6. 12 web service
platform providers offer the 20 external APIs: Akismet, Amazon, Facebook, Flicker, Github, Google,
Gravatar, Instagram, Linkedin, SoundCloud Twitter, and YouTube.
External API Name Degree of External API External API Name Degree of External API
Facebook Real-time Updates 169 Google Ajax Search 124
Twitter 168 Google Earth 124
Flicker 143 Summize Twitter Search 120
Facebook Ads 134 LinkedIn 105
YouTube 133 SoundCloud 97
Google Maps 132 Akismet 96
Gravatar 130 Google Chart 96
2 Appendix includes a table showing the number of categorized APIs.

29
Amazon S3 128 GitHub 94
Google Font 127 Google Geocoding 94
Facebook 126 Instagram 94
Table 6. External APIs forming the cluster cores in the degree distribution
Discussion
Emerging digital ecosystems can be characterized by their potential for unbounded innovations driven by
the active participation of heterogeneous third-party developers. While the role of traditional modular
architecture for innovation and how it should be managed is well understood (Baldwin and Clark 2000;
Clark 1985; Ethiraj and Levinthal 2004; Henderson and Clark 1990; Langlois 2002; Schilling 2000; Sosa
et al. 2007; Ulrich 1995), the nature of generative architecture of digital ecosystems and how it should be
managed remain relatively unexplored.
In this study, we address what makes up the underlying generative architecture of a digital ecosystem. We
also address the nature of the control of such generative architecture in a digital ecosystem. Drawing on
methods developed in network biology, we analyzed WordPress ecosystem. Our results complement
previous studies on modular architecture by showing that the generative architecture underpins a dynamic
and highly evolving open digital ecosystem that does not have a fixed boundary. Our results show that a
highly complex, dynamic, yet orderly ecosystem can emerge without a central architect. The ecosystem
contains several nested clusters that are built on unique genetic foundations. Nested cluster structure
provides the underlying architecture of the highly generative digital ecosystem.
In order to build such an ecosystem, the owner of the platform of the ecosystem must first provide genetic
foundations of the ecosystem. These genetic foundations can then attract other third-party developers who
in turn bring modifier APIs to enrich the diversity and the scale of the ecosystem. Furthermore, in order to
build such a dynamic and generative ecosystem, the platform owner may have to allow other external APIs
to invade the genetic foundations of the ecosystem. As in the case of biological systems, these new modifier
genes can provide a fuel for the growth of the ecosystem (Nadeau 2003).

30
A network biology perspective offers a powerful lens to understand the ever-changing landscape of a digital
ecosystem. Kauffman (1993) characterizes rugged regions such as different clusters of plug-ins. The
topologically overlapped APIs are understood as local optima, often defined as “basins of attractors”, that
can lead to the generation of many new plug-ins (Levinthal 1997). These basins of attractors decide the
degree of development of a particular functional class. Therefore, highly topologically overlapped areas in
the dendrogram can be understood as a basin of attractor from a network biology perspective, and it is those
regions where new plug-ins will likely emerge. The combinations of APIs that are used in the basins of
attractors form the genetic foundations of the clusters of plug-ins. Such genetic foundations of basins of
attractors then provide a basic set of APIs that third-party developers can use to experiment with new APIs
and new functions that lead to the emergence of new types of plug-ins in the ecosystem. Our Circos plot
analysis reveals specific APIs that form the genetic foundation for each cluster.
Our study also provides a new perspective on the relationship between platform owner and third-party
developers in an open digital ecosystem. Unlike the modular architecture, the role of third-party developers
are not restricted to the enhancement of the existing function, but the emergence of entirely new clusters of
plug-ins. Albeit in small in numbers, some external APIs can become integrated into the genetic foundations
of different clusters of plug-ins, whose characteristics are determined by the interactions between internal
and external APIs. Thus, our finding suggests that platform owners who want to build a highly generative
ecosystem must pay attention to seeding and controlling the core foundations of their ecosystems that form
various basins of attractors in the ecosystem’s landscape. Even if a firm “owns” a platform, it can become
irrelevant if other firms control those genetic foundations of the ecosystem.
At the same time, our results show that the platform owner needs to relent and permit popular APIs as a
part of their platform. For example, WordPress has allowed the twenty different external APIs that are
frequently used together with other WordPress APIs. Such insight might provide a theoretical basis for
what happens in the competitive landscape of the mobile ecosystem represented by Apple, Google,
Blackberry, and Windows. External APIs contribute to diversify the (re)combinatorial patterns of APIs in

31
a plug-in network and lead to the change of a network structure by increasing the number of nested
hierarchies. The hierarchical structure was constructed with various functional types of APIs offered from
a digital ecosystem which ultimately changes the depth and breadth of a plug-in network. External APIs
enable the connection of different internal APIs and introduce the implementation of other external APIs
through diversifying (re)combination patterns with internal APIs. Thus, addressing external APIs do not let
external platform owners control an internal platform system but instigate the emergence of various
attractors in the ecosystem’s landscape.
There are a number of limitations in this study. First, although each plug-in shows functionally different
traits, we cannot normalize them in a systematic way. Second, since we only use a single data set from
December 2014, we cannot see how generative architecture of an open digital ecosystems evolve over time.
Third, since we only looked at one ecosystem, we are not able to compare across different ecosystems that
might have different underlying generative architectures, with varying degrees of generativity.
Despite of these limitations, we believe that our paper offers a useful guide to help understand rapidly
evolving innovation across a digital ecosystem in a systematic way. By unearthing the generative
architecture of a digital ecosystem, we offer an explanation on how rapid and continuous innovations can
take place in a dynamic digital environment.
Future research can look at how digital ecosystems evolve as new APIs appear over time. In particular, we
can study the changing nature of clusters and their genetic foundations over time, and some of exogenous
and endogenous factors that would influence the evolution of the ecosystem and the clusters within. Also,
future research can look at the interaction among different digital ecosystems. Our study shows that some
of external APIs became parts of core APIs.. It seems that many of those APIs are part of other digital
ecosystems – some are complementary, while others are substitutive to WordPress. Thus, one can imagine
the co-evolution of digital ecosystems who are interacting with other neighboring digital ecosystems
through APIs that are interpenetrating these different ecosystems. Future research should look at such co-
evolutionary dynamics of multiple digital ecosystems.

32
Conclusion
Digital ecosystem represents the most fertile and dynamic areas of innovation. This dynamism derives from
unbounded systemic features, causing generativity to emerge in unpredictable ways. However, within the
current innovation discourse it is difficult to fully explain the phenomenon of a digital ecosystem as current
studies of innovation are based on the assumption that systems are bounded and controlled by a central
authority (i.e., hierarchical architecture). To complement existing studies, we begin to draw on concepts
and tools from network biology. A co-expression network provides an ideal way of explaining the
mechanism of generativity. In particular, comparing the topology of modules is a reliable method as it
focuses on mutually interacting modules. If we can specifically find the pattern, we can make a predictable
model for generativity in a digital ecosystem. While we acknowledge the limitation in generalizing the case
of the WordPress ecosystem, we hope that this study will provide an initial step to explore both theoretical
and methodological applications in understanding the order of new systems.

33
References
Albert, R., and Othmer, H. G. 2003. "The Topology of the Regulatory Interactions Predicts the Expression
Pattern of the Segment Polarity Genes in Drosophila Melanogaster," Journal of theoretical biology
(223:1), pp. 1-18.
Arthur, W. B. 2009. The Nature of Technology: What It Is and How It Evolves. New York: Free Press.
Baldwin, C. Y., and Clark, K. B. 2000. "Design Rules, Vol. 1: The Power of Modularity,").
Barabási, A. L., and Oltvai, Z. N. 2004. "Network Biology: Understanding the Cell's Functional
Organization," Nature Reviews Genetics (5:2), pp. 101-113.
Blei, D. M. 2012. "Probabilistic Topic Models," Communications of the ACM (55:4), pp. 77-84.
Boland, R. J., Lyytinen, K., and Yoo, Y. 2007. "Wakes of Innovation in Project Networks: The Case of
Digital 3-D Representations in Architecture, Engineering and Construction," Organization Science
(18:4), pp. 631-647.
Borgatti, S. P., and Everett, M. G. 2000. "Models of Core/Periphery Structures," Social networks (21:4),
pp. 375-395.
Bullmore, E., and Sporns, O. 2009. "Complex Brain Networks: Graph Theoretical Analysis of Structural
and Functional Systems," Nature Reviews Neuroscience (10:3), pp. 186-198.
Chesbrough, H. W., Vanhaverbeke, W., and West, J. 2006. Open Innovation: Researching a New Paradigm.
Oxford University Press, USA.
Clark, K. B. 1985. "The Interaction of Design Hierarchies and Market Concepts in Technological
Evolution," Research Policy (14:5), pp. 235-251.
Clauset, A., Shalizi, C. R., and Newman, M. E. J. 2009. "Power-Law Distributions in Empirical Data,"
SIAM review (51:4), pp. 661-703.
Csermely, P., London, A., Wu, L.-Y., and Uzzi, B. 2013. "Structure and Dynamics of Core/Periphery
Networks," Journal of Complex Networks (1:2), pp. 93-123.
Cusumano, M. A., and Gawer, A. 2002. "The Elements of Platform Leadership," MIT Sloan management
review (43:3), pp. 51-58.
Doncheva, N. T., Assenov, Y., Domingues, F. S., and Albrecht, M. 2012. "Topological Analysis and
Interactive Visualization of Biological Networks and Protein Structures," Nature protocols (7:4),
pp. 670-685.
Emilsson, V., Thorleifsson, G., Zhang, B., Leonardson, A. S., Zink, F., Zhu, J., Carlson, S., Helgason, A.,
Walters, G. B., and Gunnarsdottir, S. 2008. "Genetics of Gene Expression and Its Effect on
Disease," Nature (452:7186), pp. 423-428.
Erdős, P., and Rényi, A. 1960. "On the Evolution of Random Graphs," Citeseer.
Ethiraj, S. K., and Levinthal, D. 2004. "Modularity and Innovation in Complex Systems," Management
Science (50:2), pp. 159-173.
Fleming, L., and Sorenson, O. 2001. "Technology as a Complex Adaptive System: Evidence from Patent
Data," Research Policy (30:7), pp. 1019-1039.
Fleming, L., and Sorenson, O. 2004. "Science as a Map in Technological Search," Strategic Management
Journal (25:8‐ 9), pp. 909-928.
Gao, L. S., and Iyer, B. 2006. "Analyzing Complementarities Using Software Stacks for Software Industry
Acquisitions," Journal of Management Information Systems (23:2), pp. 119-147.
Garas, A., Schweitzer, F., and Havlin, S. 2012. "A K-Shell Decomposition Method for Weighted
Networks," New Journal of Physics (14:8), p. 083030.
Garud, R., and Kumaraswamy, A. 1993. "Changing Competitive Dynamics in Network Industries: An
Exploration of Sun Microsystems' Open Systems Strategy," Strategic Management Journal (14:5),
pp. 351-369.
34
Ghazalpour, A., Doss, S., Zhang, B., Wang, S., Plaisier, C., Castellanos, R., Brozell, A., Schadt, E. E.,
Drake, T. A., and Lusis, A. J. 2006. "Integrating Genetic and Network Analysis to Characterize
Genes Related to Mouse Weight," PLoS genetics (2:8), p. e130.
Ghazawneh, A., and Henfridsson, O. 2012. "Balancing Platform Control and External Contribution in
Third-Party Development: The Boundary Resources Model," Information Systems Journal (22:2).
Gulati, R., Puranam, P., and Tushman, M. 2012. "Meta‐ Organization Design: Rethinking Design in
Interorganizational and Community Contexts," Strategic Management Journal (33:6), pp. 571-586.
Hastie, T., Tibshirani, R., Friedman, J., Hastie, T., Friedman, J., and Tibshirani, R. 2009. The Elements of
Statistical Learning. Springer.
Hawrylycz, M. J., Lein, E. S., Guillozet-Bongaarts, A. L., Shen, E. H., Ng, L., Miller, J. A., van de Lagemaat,
L. N., Smith, K. A., Ebbert, A., and Riley, Z. L. 2012. "An Anatomically Comprehensive Atlas of
the Adult Human Brain Transcriptome," Nature (489:7416), pp. 391-399.
Henderson, R. M., and Clark, K. B. 1990. "Architectural Innovation: The Reconfiguration of Existing
Product Technologies and the Failure of Established Firms," Administrative Science Quarterly), pp.
9-30.
Holland, J. H. 1992. "Genetic Algorithms," Scientific American (267:1), pp. 66-72.
Horvath, S. 2011. Weighted Network Analysis: Applications in Genomics and Systems Biology. Springer
Verlag.
Horvath, S., and Dong, J. 2008. "Geometric Interpretation of Gene Coexpression Network Analysis," PLoS
computational biology (4:8), p. e1000117.
Jeong, H., Tombor, B., Albert, R., Oltvai, Z. N., and Barabási, A. L. 2000. "The Large-Scale Organization
of Metabolic Networks," Nature (407:6804), pp. 651-654.
Kauffman, S. A. 1993. The Origins of Order. Oxford University Press New York.
Kitano, H. 2002. "Systems Biology: A Brief Overview," Science (295:5560), pp. 1662-1664.
Krzywinski, M., Schein, J., Birol, İ., Connors, J., Gascoyne, R., Horsman, D., Jones, S. J., and Marra, M.
A. 2009. "Circos: An Information Aesthetic for Comparative Genomics," Genome research (19:9),
pp. 1639-1645.
Langfelder, P., and Horvath, S. 2007. "Eigengene Networks for Studying the Relationships between Co-
Expression Modules," BMC systems biology (1:1), p. 54.
Langfelder, P., Zhang, B., and Horvath, S. 2008. "Defining Clusters from a Hierarchical Cluster Tree: The
Dynamic Tree Cut Package for R," Bioinformatics (24:5), pp. 719-720.
Larose, D. T. 2014. Discovering Knowledge in Data: An Introduction to Data Mining. John Wiley & Sons.
Levinthal, D. A. 1997. "Adaptation on Rugged Landscapes," Management science (43:7), pp. 934-950.
Liu, Y.-Y., Slotine, J.-J., and Barabási, A.-L. 2011. "Controllability of Complex Networks," Nature
(473:7346), pp. 167-173.
Lobo, I. 2008. "Same Genetic Mutation, Different Genetic Disease Phenotype," Nature Education (1:1).
MacCormacka, A., Baldwin, C., Rusnak, J., and Park, S. F. 2010. "The Architecture of Complex Systems:
Do Core-Periphery Structures Dominate?," MIT Slone Research Paper no. 4770-10).
Murphy, K. P. 2012. Machine Learning: A Probabilistic Perspective. MIT press.
Nadeau, J. H. 2001. "Modifier Genes in Mice and Humans," Nature Reviews Genetics (2:3), pp. 165-174.
Nadeau, J. H. 2003. "Modifier Genes and Protective Alleles in Humans and Mice," Current opinion in
genetics & development (13:3), pp. 290-295.
Nelson, R. R., and Winter, S. G. 1982. An Evolutionary Theory of Economic Change. Belknap press.
Newman, M. E. 2003. "The Structure and Function of Complex Networks," SIAM review (45:2), pp. 167-
256.

35
Nickerson, J. A., and Zenger, T. R. 2004. "A Knowledge-Based Theory of the Firm—the Problem-Solving
Perspective," Organization Science (15:6), pp. 617-632.
Overby, E., Slaughter, S. A., and Konsynski, B. 2010. "Research Commentary-the Design, Use, and
Consequences of Virtual Processes," Information Systems Research (21:4), pp. 700-710.
Ravasz, E., Somera, A. L., Mongru, D. A., Oltvai, Z. N., and Barabási, A. L. 2002. "Hierarchical
Organization of Modularity in Metabolic Networks," Science (297:5586), pp. 1551-1555.
Rombach, M. P., Porter, M. A., Fowler, J. H., and Mucha, P. J. 2014. "Core-Periphery Structure in
Networks," SIAM Journal on Applied mathematics (74:1), pp. 167-190.
Ruan, J., Dean, A. K., and Zhang, W. 2010. "A General Co-Expression Network-Based Approach to Gene
Expression Analysis: Comparison and Applications," BMC systems biology (4:1), p. 8.
Sambamurthy, V., Bharadwaj, A., and Grover, V. 2003. "Shaping Agility through Digital Options:
Reconceptualizing the Role of Information Technology in Contemporary Firms," Mis Quarterly),
pp. 237-263.
Sanchez, R. 2004. "Creating Modular Platforms for Strategic Flexibility," Design Management Review
(15:1), pp. 58-67.
Sanchez, R., and Mahoney, J. T. 1996. "Modularity, Flexibility, and Knowledge Management in Product
and Organization Design," Strategic Management Journal), pp. 63-76.
Simon, H. A. 1962. "The Architecture of Complexity," Proceedings of the American philosophical society),
pp. 467-482.
Sorrentino, F., di Bernardo, M., Garofalo, F., and Chen, G. 2007. "Controllability of Complex Networks
Via Pinning," Physical Review E (75:4), p. 046103.
Sosa, M. E., Agrawal, A., Eppinger, S. D., and Rowles, C. M. 2005. "A Network Approach to Define
Modularity of Product Components."
Sosa, M. E., Eppinger, S. D., and Rowles, C. M. 2004. "The Misalignment of Product Architecture and
Organizational Structure in Complex Product Development," Management science), pp. 1674-1689.
Sosa, M. E., Browning, T., and Mihm, J. 2007. "Studying the Dynamics of the Architecture of Software
Products," pp. 4-7.
Staudenmayer, N., Tripsas, M., and Tucci, C. L. 2005. "Interfirm Modularity and Its Implications for
Product Development*," Journal of Product Innovation Management (22:4), pp. 303-321.
Strogatz, S. H. 2001. "Exploring Complex Networks," Nature (410:6825), pp. 268-276.
Stuart, J. M., Segal, E., Koller, D., and Kim, S. K. 2003. "A Gene-Coexpression Network for Global
Discovery of Conserved Genetic Modules," Science (302:5643), p. 249.
Swanson, E. B. 1994. "Information Systems Innovation among Organizations," Management science), pp.
1069-1092.
Tiwana, A., Konsynski, B., and Bush, A. A. 2010. "Platform Evolution: Coevolution of Platform
Architecture, Governance, and Environmental Dynamics," Information Systems Research (21:4),
pp. 675-687.
Toivonen, H., Zhou, F., Hartikainen, A., and Hinkka, A. 2011. "Compression of Weighted Graphs,"
Proceedings of the 17th ACM SIGKDD international conference on Knowledge discovery and data
mining: ACM, pp. 965-973.
Ulrich, K. 1995. "The Role of Product Architecture in the Manufacturing Firm," Research Policy (24:3),
pp. 419-440.
Wackerly, D., Mendenhall, W., and Scheaffer, R. 2007. Mathematical Statistics with Applications. Cengage
Learning.
Wagner, G. P., and Zhang, J. 2011. "The Pleiotropic Structure of the Genotype–Phenotype Map: The
Evolvability of Complex Organisms," Nature Reviews Genetics (12:3), pp. 204-213.
Wang, X. F., and Chen, G. 2002. "Pinning Control of Scale-Free Dynamical Networks," Physica A:
Statistical Mechanics and its Applications (310:3), pp. 521-531.

36
Yip, A. M., and Horvath, S. 2007. "Gene Network Interconnectedness and the Generalized Topological
Overlap Measure," BMC bioinformatics (8:1), p. 22.
Yoo, Y., Boland, R. J., Lyytinen, K., and Majchrzak, A. 2012. "Organizing for Innovation in the Digitized
World," Organization Science (23:5), pp. 1398-1408.
Yoo, Y., Henfridsson, O., and Lyytinen, K. 2010. "Research Commentary---the New Organizing Logic of
Digital Innovation: An Agenda for Information Systems Research," Information Systems Research
(21:4), pp. 724-735.
Zhang, B., and Horvath, S. 2005. "A General Framework for Weighted Gene Co-Expression Network
Analysis," Statistical applications in genetics and molecular biology (4:1), p. 1128.
Zhao, J., Yu, H., Luo, J.-H., Cao, Z.-W., and Li, Y.-X. 2006. "Hierarchical Modularity of Nested Bow-Ties
in Metabolic Networks," BMC bioinformatics (7:1), p. 386.
Zhao, W., Langfelder, P., Fuller, T., Dong, J., Li, A., and Hovarth, S. 2010. "Weighted Gene Coexpression
Network Analysis: State of the Art," Journal of Biopharmaceutical Statistics (20:2), pp. 281-300.
Zhou, F., Toivonen, H., and King, R. D. 2014. "The Use of Weighted Graphs for Large-Scale Genome
Analysis," PloS one (9:3), p. e89618.
Zhu, J., Zhang, B., Smith, E. N., Drees, B., Brem, R. B., Kruglyak, L., Bumgarner, R. E., and Schadt, E. E.
2008. "Integrating Large-Scale Functional Genomic Data to Dissect the Complexity of Yeast
Regulatory Networks," Nature genetics (40:7), pp. 854-861.
Žiberna, A. 2007. "Generalized Blockmodeling of Valued Networks," Social networks (29:1), pp. 105-126.
Zittrain, J. 2006. "The Generative Internet," Harvard Law Review (119), pp. 1974-2040.

37
Appendix
Name of Internal API Functional Objective of Internal API
add_action Hooking a function of plug-in to be activated
add_filter Hooking a function to a specific filter action.
add_option Adding a named option/value to the options database table
add_shortcode Hooking a simple set of functions to use code in post content
apply_filter Calling the functions added to a filter hook
delete_option Safely removing a named option/value pair from the database of Wordpress.
get_option Safely offering a way to get values from the database of Wordpress.
register_activation_hook Registering a plugin function to be operated on Wordpress.
register_deactivation_hook Registering a plugin function to be run when a plugin is deactivated.
register_setting Registering a setting of plug-in and sanitizes callback.
setting_fields Setting a page with action and option page
update_option Updating a named option/value pair to the options database of Wordpress.
update_option Updating a named option/value pair to the options database of Wordpress.
* www. wordpress.org provides the WordPress API information.
Name of External API Functional Objective of External API
Akismet Offering anti-spam service from analyzing the pattern of data from sites
Amazon S3 Offering secure and durable storage service for any size of data
Facebook Allowing automatically update Facebook.
Facebook Ads Offering methods to manage advertisement running within Facebook
Real_Time_Updates
Enableing any webpage to subscribe and change data in Facebook
Flicker Enabling to access on photos stored in Flicker
GitHub Enabling to fork projects, send pull request, and monitor development
Google Ajax Search Embeding Google Search service.
Google Chart Allowing to display data on any web page
Google Earth Allowing developers to add Google Earth plug-in objects to a site.
Google Font Adding web fonts to any web page
Google Geocoding A kind of Google Maps to offer a direct way to access an HTTP request
Google Maps Allowing to embed Google Maps onto web pages of outside developers
Gravatar Allowing to create profiles and avatars on a web page

38
Instagram Enabling to share photos stored in Instagram webpage
LinkedIn Allowing registered users to access on LinkedIn webpage
SoundCloud Allowing to upload, record, and share users audio from the webpage
Summize Twitter search Enabling to create profiles and avatars.
Twitter Allowing to access core Twitter data.
YouTube Allowing to perform any operations on YouTube
* www.programmableweb.com and each platform service webpage offer the external API information.
Cluster
(Plug-in
Number)
Total Number of
Internal API Total Number of
External API Total Number of
Universal
Core API
Total Number of
Cluster Core
Internal API
Total Number of
Cluster Core
External API
Grey
(3080)
99 179 12 81 16
Turquoise
(3257)
112 67 11 19 6
Blue
(2651)
86 118 12 40 10
Brown
(2319)
86 88 11 30 1
Yellow
(2161)
72 52 12 15 0
Green
(2102)
84 80 12 22 2
Red
(1934)
92 133 12 24 0
Black
(1808)
46 48 10 9 1
Pink
(1737)
61 59 12 12 0
Magenta
(1272)
72 75 12 22 2
Purple
(897)
51 33 12 6 0
The number of API types in each cluster

39