the global spectrum of plant form and function
TRANSCRIPT

1 4 j a n u a r y 2 0 1 6 | V O L 5 2 9 | n a T u r E | 1 6 7
arTicLEdoi:10.1038/nature16489
The global spectrum of plant form and functionSandra Díaz1, jens Kattge2,3, johannes H. c. cornelissen4, ian j. Wright5, Sandra Lavorel6, Stéphane Dray7, Björn reu8,9, Michael Kleyer10, christian Wirth2,3,11, i. colin Prentice5,12, Eric Garnier13, Gerhard Bönisch2, Mark Westoby5, Hendrik Poorter14, Peter B. reich15,16, angela T. Moles17, john Dickie18, andrew n. Gillison19, amy E. Zanne20,21, jérôme chave22, S. joseph Wright23, Serge n. Sheremet’ev24, Hervé jactel25,26, christopher Baraloto27,28, Bruno cerabolini29, Simon Pierce30, Bill Shipley31, Donald Kirkup32, Fernando casanoves33, julia S. joswig2, angela Günther2, Valeria Falczuk1, nadja rüger3,23, Miguel D. Mahecha2,3 & Lucas D. Gorné1
Vascular plants are the main entry point for energy and matter into the Earth’s terrestrial ecosystems. Their Darwinian struggle for growth, survival and reproduction in very different arenas has resulted in an extremely wide variety of form and function, both across and within habitats. Yet it has long been thought1–8 that there is a pattern to be found in this remarkable evolutionary radiation—that some trait con-stellations are viable and successful whereas others are not.
Empirical support for a strongly limited set of viable trait combina-tions has accumulated for traits associated with single plant organs, such as leaves7,9–12, stems13,14 and seeds15–17. Evidence across plant organs has been rarer, restricted geographically or taxonomically, and often contradictory18–29. How tightly whole-plant form and function are restricted at the global scale remains unresolved.
Here we present the first global quantitative picture of essential functional diversity of extant vascular plants. We quantify the volume, shape and boundaries of this functional space via joint consideration of six traits that together capture the essence of plant form and func-tion: adult plant height, stem specific density, leaf size expressed as
leaf area, leaf mass per area, leaf nitrogen content per unit mass, and diaspore mass. Our dataset, based on a recently updated communal plant trait database30, covers 46,085 vascular plant species from 423 families and to our knowledge spans the widest range of growth-forms and geographical locations to date in published trait analyses, includ-ing some of the most extreme plant trait values ever measured in the field (Table 1, Extended Data Fig. 1). On this basis we reveal that the trait space actually occupied is strongly restricted as compared to four alternative null hypotheses. We demonstrate that plant species largely occupy a plane in the six-dimensional trait space. Two key trait dimensions within this plane are the size of whole plants and organs on the one hand, and the construction costs for photosynthetic leaf area, on the other. We subsequently show which sections of the plane are occupied, and how densely, by different growth-forms and major taxonomic groups. The design opportunities and limits indicated by today’s global spectrum of plant form and function provide a founda-tion to achieve a better understanding of the evolutionary trajectory of vascular plants and help frame and test hypotheses as to where and
Earth is home to a remarkable diversity of plant forms and life histories, yet comparatively few essential trait combinations have proved evolutionarily viable in today’s terrestrial biosphere. By analysing worldwide variation in six major traits critical to growth, survival and reproduction within the largest sample of vascular plant species ever compiled, we found that occupancy of six-dimensional trait space is strongly concentrated, indicating coordination and trade-offs. Three-quarters of trait variation is captured in a two-dimensional global spectrum of plant form and function. One major dimension within this plane reflects the size of whole plants and their parts; the other represents the leaf economics spectrum, which balances leaf construction costs against growth potential. The global plant trait spectrum provides a backdrop for elucidating constraints on evolution, for functionally qualifying species and ecosystems, and for improving models that predict future vegetation based on continuous variation in plant form and function.
1Instituto Multidisciplinario de Biología Vegetal (IMBIV), CONICET and FCEFyN, Universidad Nacional de Córdoba, Casilla de Correo 495, 5000 Córdoba, Argentina. 2Max Planck Institute for Biogeochemistry, Hans-Knöll-Straße 10, 07745 Jena, Germany. 3German Centre for Integrative Biodiversity Research (iDiv) Halle-Jena-Leipzig, Deutscher Platz 5e, 04103 Leipzig, Germany. 4Systems Ecology, Department of Ecological Science, Vrije Universiteit, De Boelelaan 1085, 1081 HV Amsterdam, The Netherlands. 5Department of Biological Sciences, Macquarie University, Sydney, New South Wales 2109, Australia. 6Laboratoire d’Ecologie Alpine, UMR 5553, CNRS – Université Grenoble Alpes, 38041 Grenoble Cedex 9, France. 7Laboratoire de Biométrie et Biologie Evolutive, UMR5558, Université Lyon 1, CNRS, F-69622 Villeurbanne, France. 8Institute of Biology, University of Leipzig, Johannisallee 21, 04103 Leipzig, Germany. 9Escuela de Biología, Universidad Industrial de Santander, Cra. 27 Calle 9, 680002 Bucaramanga, Colombia. 10Landscape Ecology Group, Institute of Biology and Environmental Sciences, University of Oldenburg, D-26111 Oldenburg, Germany. 11Department of Systematic Botany and Functional Biodiversity, University of Leipzig, Johannisallee 21, 04103 Leipzig, Germany. 12AXA Chair in Biosphere and Climate Impacts, Grand Challenges in Ecosystems and the Environment and Grantham Institute – Climate Change and the Environment, Department of Life Sciences, Imperial College London, Silwood Park Campus, Buckhurst Road, Ascot SL5 7PY, UK. 13Centre d’Ecologie Fonctionnelle et Evolutive (UMR 5175), CNRS-Université de Montpellier - Université Paul-Valéry Montpellier - EPHE, 34293 Montpellier Cedex 5, France. 14Plant Sciences (IBG-2), Forschungszentrum Jülich GmbH, D-52425 Jülich, Germany. 15Department of Forest Resources, University of Minnesota, St Paul, Minnesota 55108, USA. 16Hawkesbury Institute for the Environment, University of Western Sydney, Penrith New South Wales 2751, Australia. 17Evolution & Ecology Research Centre, School of Biological, Earth and Environmental Sciences, UNSW Australia, Sydney, New South Wales 2052, Australia. 18Collections , The Royal Botanic Gardens Kew, Wakehurst Place, Ardingly, West Sussex, RH17 6TN, UK. 19Center for Biodiversity Management, P.O. Box 120, Yungaburra, Queensland 4884, Australia. 20Department of Biological Sciences, George Washington University, Washington DC 20052, USA. 21Center for Conservation and Sustainable Development, Missouri Botanical Garden, St Louis, Missouri 63121, USA. 22UMR 5174 Laboratoire Evolution et Diversité Biologique, CNRS & Université Paul Sabatier, Toulouse 31062, France. 23Smithsonian Tropical Research Institute, Apartado 0843-03092, Balboa, Ancón, Panama. 24Komarov Botanical Institute, Prof. Popov Street 2, St Petersburg 197376, Russia. 25INRA, UMR1202 BIOGECO, F-33610 Cestas, France. 26Université de Bordeaux, BIOGECO, UMR 1202, F-33600 Pessac, France. 27International Center for Tropical Botany, Department of Biological Sciences, Florida International University, Miami, Florida 33199, USA. 28INRA, UMR Ecologie des Forêts de Guyane, 97310 Kourou, French Guiana. 29Department of Theoretical and Applied Sciences, University of Insubria, Via J.H. Dunant 3, I-21100 Varese, Italy. 30Department of Agricultural and Environmental Sciences (DiSAA), University of Milan, Via G. Celoria 2, I-20133 Milan, Italy. 31Département de biologie, Université de Sherbrooke, Sherbrooke, Quebec J1K 2R1, Canada. 32Biodiversity Informatics and Spatial Analysis, Jodrell Building, The Royal Botanic Gardens Kew, Richmond TW9 3AB, UK. 33Unidad de Bioestadística, Centro Agronómico Tropical de Investigación y Enseñanza (CATIE), 7170 Turrialba, 30501, Costa Rica.
© 2016 Macmillan Publishers Limited. All rights reserved

1 6 8 | n a T u r E | V O L 5 2 9 | 1 4 j a n u a r y 2 0 1 6
ArticlereSeArcH
how ecological filtering and evolution might further shape the Earth’s plant trait space.
The trait space occupied by plants worldwideCertain traits can be thought of as indexing positions of species along key dimensions of plant ecological strategy directly relevant to growth, survival and reproduction19,20,22,31–33. We chose six traits whose fun-damental importance for ecological strategy has been established unequivocally and for which data have recently become available for an unprecedented number of species worldwide30. Among the six key traits (see Methods for details and references) adult plant height (H) corresponds with the ability to pre-empt light resources and disperse diaspores. Stem specific density (SSD) reflects a trade-off between growth potential and mortality risk from biomechanical or hydraulic failure. Leaf area (LA, size of an individual leaf) has important conse-quences for leaf energy and water balance. Leaf mass per area (LMA) and leaf nitrogen content per unit mass (Nmass) express different aspects of leaf strategy for resource capture and conservation: LMA reflects a trade-off between carbon gain and longevity, while Nmass reflects a trade-off between the benefits of photosynthetic potential and the costs of acquiring nitrogen and suffering herbivory. Diaspore mass (the mass of an individual dispersed seed or spore; SM) reflects a trade-off between seedling survival versus colonization ability in space and time. Ranges of trait variation span from 2 (SSD, Nmass) to 13 orders of magnitude (SM) (Table 1).
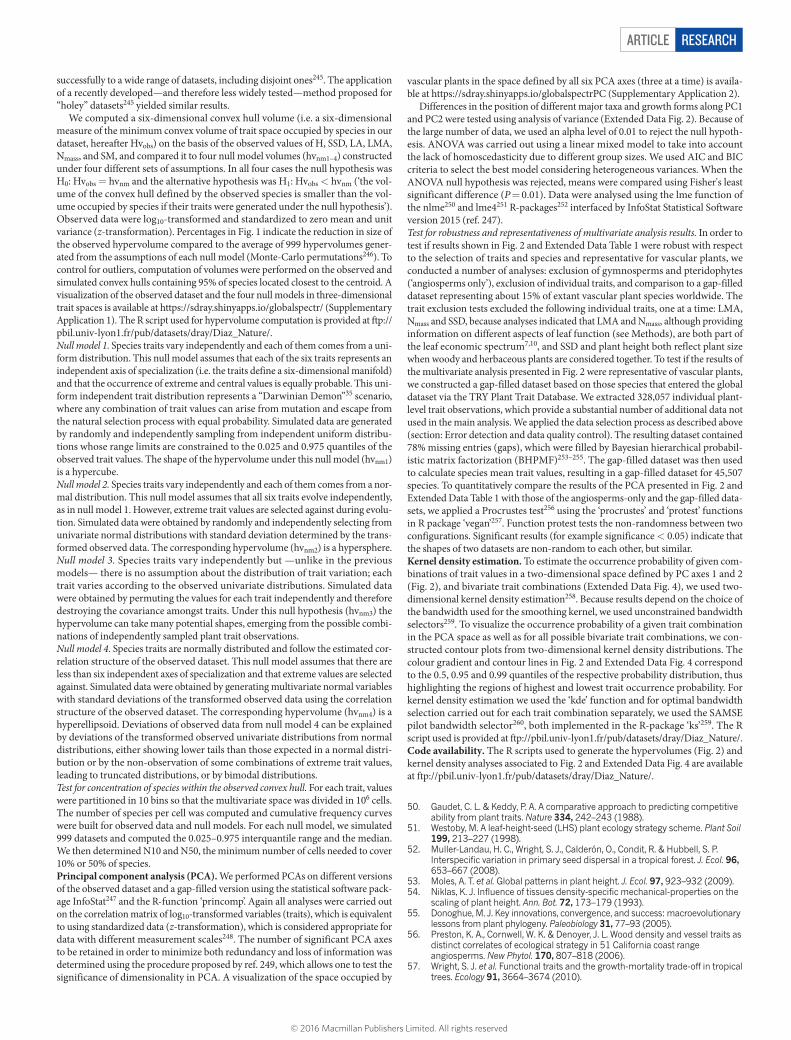
We investigated which portion of the six-dimensional trait space is occupied by vascular plants that now live on Earth. There are two pri-mary reasons why plants might occupy a subset of the potential trait space: (1) values of independent traits are distributed along each axis in a clumped, non-uniform manner; and (2) there are inherent corre-lations between the values of different traits. We therefore built four null models varying the trait distributions and their correlation struc-ture. We computed the volume of the six-dimensional convex hull34, i.e. the smallest convex volume in hyperspace that contains the (log10- and z-transformed) observed values of H, SSD, LA, LMA, Nmass and SM (for a visualization see https://sdray.shinyapps.io/globalspectr/; Supplementary Application 1), and compared it against hypervolumes from four null hypotheses (hvnm1 to hvnm4; shown diagrammatically in Fig.1 and described in detail in Methods). Hypervolumes hvnm1 to hvnm3 assume that the traits vary independently, resulting in a functional space spanning along six orthogonal axes. Null model 1 assumes that any combination of trait values can arise and escape natural selection with equal probability (for example ref. 35), thus extreme and central values are equally likely, each trait having a uniform distribution, and hvnm1 approximating a hypercube. Null model 2 assumes that extreme trait values are selected against during evolution and each trait has a log-normal distribution, with hvnm2
approximating a hypersphere. Null model 3 imposes no assumptions about trait distributions but instead allows each trait to be distrib-uted as observed and assumes traits are independent of one other. Null model 4 assumes that extreme values are selected against (i.e., log-normally distributed) and maintains the observed correlation structure among traits. Relative to null models 1 to 3, null model 4 collapses the multidimensional trait-space occupied by plants (hvnm4) into an elongated hyperellipsoid.
We found that the observed hypervolume (hvobs) is much smaller than hypervolumes expected under the first three null models (hvnm1 to hvnm3) (Fig. 1). While closer in size to hvnm4, it is still 20% smaller. It also shows greater aggregation of species (‘lumpiness’) in multivariate
hvnm1
Observed spectrum
hvnm4
hvobs–18.05 %–63.91 %
hvnm3
hvnm2
–98.05 % –72.43 %
Null model 3 Traits distributedas observed and independent from each other
Null model 1 Traits uniformlydistributed and independent from each other
Null model 2 Traits normallydistributed and independent from each other
Null model 4 Traits normally distributed and correlated as observed
Figure 1 | The volume in trait space occupied by vascular plant species is strongly constrained compared to theoretical null models. The five diagrams are pictorial representations based on three out of the six trait dimensions forming the hypervolumes under scrutiny. The hypervolumes are constructed on the basis of log10- and z-transformed observed values of H, SSD, LA, LMA, Nmass and SM (observed hypervolume = hvobs), or on the bases of four different null models of multivariate variation of those traits (hvnm1 to hvnm4) (see Methods). Numbers adjacent to arrows indicate percentage reductions in size of hvobs compared to the null-model hypervolumes (all significant at P < 0.001).
Table 1 | Range of variation in functional traits, geographic distribution and climatic conditionsAbbreviation Range No. of species
Adult plant height (m) H 0.001* to 90† 24,720
Stem specific density (mg mm−3) SSD 0.06‡ to 1.39§ 11,356
Leaf area (mm2) LA 0.79* to 2.79 × 10⁶|| 12,173
Leaf mass per area (g m−2) LMA 4.9¶ to 1,507# 10,490
N content per unit leaf mass (mg g−1) Nmass 2.48 to 68.98** 8,695
Diaspore mass (mg) SM 5.15 × 10⁻⁶†† to 2.05 × 10⁷‡‡ 24,779
Diaspore mass (mg) excluding pteridophytes SM 3.0 × 10⁻⁴§§ to 2.05 × 10⁷‡‡ 24,449
Latitude (degrees) 55 S to 83.17 N
Altitude (m) −59 to 5,249
Mean annual temperature (°C) −27.22 to 29.97
Mean annual sum of precipitation (mm yr−1) <5 to 7,693
Latitude and altitude are based on species occurrences in the Global Biodiversity Information Facility database (http://www.gbif.org). Mean annual temperature and annual sum of precipitation refer
to CRU0.5 degree climatology. *Wolffia arrhiza and Azolla microphylla; †Sequoia sempervirens and Eucalyptus regnans; ‡Utricularia vulgaris; §Caesalpinia sclerocarpa; ||Victoria amazonica; ¶Myriophyllum
aquaticum; #Agave americana; Hakea erecta; **Dipcadi glaucum; ††Blechnaceae; ‡‡Lodoicea maldivica; §§Laelia undulata and Alectra vogelii.
© 2016 Macmillan Publishers Limited. All rights reserved

1 4 j a n u a r y 2 0 1 6 | V O L 5 2 9 | n a T u r E | 1 6 9
Article reSeArcH
space than expected under each of the null models (Supplementary Table 1). Thus the restriction of the observed hypervolume mainly reflects correlations among the six traits, and also—to a smaller degree—a greater concentration than expected under multivariate normality. In sum, the trait hypervolume occupied by living vascular plants is strongly constrained, converging towards a relatively small set of successful trait combinations.
Main trends of variationWithin the observed worldwide plant trait space we identified the main independent dimensions of variation. Seventy-four percent of the variation in the six-dimensional space was accounted for by the plane defined by the first two principal components (PC), the only PC found to contain significant, non-redundant information (Fig. 2, Extended Data Table 1 and Extended Data Fig. 2; all PC displayed at https://sdray.shinyapps.io/globalspectrPC; Supplementary Application 2). Within this plane two notable dimensions of trait variation stand out. One dimension runs from short species tending to have small diaspores to tall species tending to have large diaspores (lower left to upper right in Fig. 2a, ‘H–SM’, more strongly associated with PC1 than PC2). The other (upper left to lower right in Fig 2a, ‘LMA–Nmass’, more strongly associated with PC2 than PC1) runs from species with
cheaply constructed, ‘acquisitive’ leaves (low-LMA, nitrogen-rich) to species with ‘conservative’ leaves (high-LMA, nitrogen-poor) that are expected to have longer leaf lifespan and higher survival in the face of abiotic and biotic hazards7,10,36. Stem specific density (SSD) and leaf area (LA) also load heavily on the plane and are correlated with both the H–SM and the LMA–Nmass dimensions (Fig 2a, Extended Data Table 1). Although SSD and SM increase with plant height, at any given H there is considerable independent variation in both (Extended Data Fig. 3a, f), and at any given LMA and Nmass there is considera-ble independent variation in LA (Extended Data Figs 3b, c). These general patterns are robust (Extended Data Table 1) with respect to species selection (for example, considering angiosperms rather than all species), to re-running analyses on a 45,507-species ‘gap-filled’ trait matrix rather than the 2,214-species six-trait matrix, and to exclusion of individual traits (for example, using only one rather than both leaf economic traits). The outer reaches of the main plane of variation represent extreme combinations of plant size and leaf structure and function (see circled numbers in Fig. 2a, and Extended Data Table 2 for illustrative species), with a wide gradient of intermediate trait combinations between them, together expressing the rich variety of ways in which plants balance the challenges of growth, survival and reproduction.
Figure 2 | The global spectrum of plant form and function. a, Projection of global vascular plant species (dots) on the plane defined by principal component axes (PC) 1 and 2 (details in Extended Data Table 1 and Extended Data Fig. 2). Solid arrows indicate direction and weighing of vectors representing the six traits considered; icons illustrate low and high extremes of each trait vector. Circled numbers indicate approximate position of extreme poles of whole-plant specialization, illustrated by typical species (Extended Data Table 2). The colour gradient indicates
regions of highest (red) to lowest (white) occurrence probability of species in the trait space defined by PC1 and PC2, with contour lines indicating 0.5, 0.95 and 0.99 quantiles (see Methods, kernel density estimation). Red regions falling within the limits of the 0.50 occurrence probability correspond to the functional hotspots referred to in main text. b, c, location of different growth-forms (b) and major taxa (c) in the global spectrum.
–4 –2 0 2 4
–4
–2
0
2
PC1
–4 –2 0 2
23
4
5
LA
LMA
Nmass
1
4 PC1
PC
2
AngiospermGymnospermPteridophyte
–4 –2 0 2 4
–4
–2
0
2
–4
–6
–2
0
2
4
PC1
PC
2P
C2
WoodyNon-woody
a
b c
SM
H
SSD
0.99
0.990.95
0.5
0.5
© 2016 Macmillan Publishers Limited. All rights reserved

1 7 0 | n a T u r E | V O L 5 2 9 | 1 4 j a n u a r y 2 0 1 6
ArticlereSeArcH
Major taxa, growth-forms, and functional hotspotsDifferent plant groups distribute unevenly in the global spectrum of form and function. Both herbaceous and woody growth-forms show considerable variation along the two main dimensions (Fig 2b). The two groups are offset along the H–SM dimension (Fig. 2b), with woody species, on average, being taller and having larger seeds and leaves; woody species also tend to have higher SSD and LMA than herba-ceous species (Extended Data Fig. 3a–e). Also, although taller species have larger seeds in both herbaceous and woody species-groups, the relationship is only very weak in herbaceous species (Extended Data Figs 3f and 4). In sum, the distinction in traits between herbaceous and woody growth-forms goes beyond the obvious difference in height and stem structure that has been recognized since antiquity37. At the same time, there exist commonalities in trait coordination and trade-offs across both herbaceous and woody plants, shown here at a global scale for the first time. For example, herbaceous and woody plants overlap widely along the LMA-Nmass dimension (Fig. 2b), particularly in regard to Nmass (Extended Data Fig. 3c), and LMA and Nmass are largely inde-pendent from LA in both groups (Extended Data Fig. 3b, c). Further, while neither SSD nor LMA increases with plant stature within either group (Extended Data Figs 3a, e and 4), LA increases with H in both (Extended Data Fig. 3d). These multivariate trends are summarised by the clear distinction of herbaceous and woody species-groups along PC1, and their broad overlap along PC2 (Extended Data Fig. 2a).
There are also strong differences in trait-space occupancy by major taxa. For gymnosperms, high costs of seed packaging and abortion are thought to set a lower bound on seed size38,39. Accordingly in Fig 2c gymnosperms are confined to the right hand side (see also Extended Data Fig. 2b, and, for examples, Extended Data Table 2). The emergence of angiosperms allowed a considerable extension into smaller seed size40 that is manifest in extant species. This also opened up lifestyles involving colonization of open ground, shorter lifespans and herbaceous growth-form (towards the left of Fig. 2a). The sec-ond major angiosperm innovation whose footprint is evident in the trait space concerns xylem vessels. Angiosperm vessels are longer and larger- diameter conduits than gymnosperm and pteridophyte tracheids, permitting much higher hydraulic conductivities. This, together with a greater density of leaf veins, has allowed angiosperms to deliver a faster transpiration stream while requiring less volume within the leaf41. These anatomical innovations have made it possible for angiosperms to extend the range of leaf stomatal conductances and photosynthetic capacities to higher values (requiring coordinated higher Nmass) and the range of LMA to lower values compared to gym-nosperms and pteridophytes (Fig. 2c). Higher hydraulic conductivity presumably also enabled the evolution of very large leaves in angio-sperms, and a far wider variety in leaf morphology too. Nevertheless, while angiosperm innovations have expanded trait space considerably towards higher leaf Nmass and LA and (compared with gymnosperms) lower diaspore mass, angiosperms also converged on the same zones of trait space as gymnosperms and pteridophytes, as seen in the lower right and lower left of the global trait plane (Fig. 2c).
There are two clear functional hotspots—areas of particularly dense species occupation—in trait space (Fig. 2a). The bimodality resides in H and in SSD, rather than in LMA, Nmass or LA (Extended Data Fig. 4). The first hotspot almost entirely corresponds to herba-ceous plants and lies at the core of the distribution of both graminoid (grass-like) and non-graminoid herbs, having small, acquisitive leaves and small seeds. The second hotspot lies within the trait space occu-pied by woody plants, positioned towards the upper right corner of Fig. 2a. It consists mostly of tree species of moderate to great height with large leaves and large seeds; plants other than angiosperms are almost completely absent from it. Many phylogenetically distant fam-ilies and orders of angiosperms are represented within each hotspot (Supplementary Table 2), indicating that these prevalent ecological trait constellations represent successful solutions acquired repeatedly through the evolutionary history of vascular plants.
DiscussionOur findings show that the trait space currently occupied by vascular plants is quite restricted compared to the range of possibilities that would exist if traits varied independently. Importantly, this finding arises from the combined analysis of six traits describing different plant organs, and from a wider spread of taxa and life histories than has previously been possible. It yields the most comprehensive pic-ture to date of how the remarkable functional diversity of vascular plants seen on Earth today has been able to evolve within very general constraints. This worldwide functional six-trait space is wide, diverse and lumpy, with its fringes occupied by species (indicated with circled numbers in Fig. 2a) ranging from the short model plant thale cress (Arabidopsis thaliana) to the 60-m tall Brazil Nut tree (Berthollettia excelsa), from flimsy watermilfoil (Myriophyllum spicatum) to tough monkey puzzle tree (Araucaria araucana), from the tender but toxic devil’s snare (Datura stramonium) to the hardy needlewood (Hakea leucoptera), from the minute leaves and seeds of heather (Calluna vulgaris) to the large leaves and seeds of lotus (Nelumbo nucifera) (description and additional illustrative species in Extended Data Table 2). Yet, this variation of the six key traits is largely concentrated into a plane.
Stem density, leaf size and diaspore size represent trade-offs within distinct aspects of plant biology32, and in previous studies of trends across different plant organs, these traits have shown considerable variation that is independent from whole-plant size and leaf carbon economy. However, those analyses were based on far more restricted datasets than considered here, in terms of growth-forms, habitats, or both, considering for example tropical woody species21–23,26, tem-perate semiarid pine forests24, or countrywide herbaceous floras27. At the global scale of our study, these three traits do not constitute major independent dimensions; rather, substantial variation in them is captured by the plane that summarizes global variation in vascu-lar plant design (Fig. 2). Our results are correlative and cannot prove rigorously why such a large share of the potential trait volume is not occupied. Still, from first principles many more combinations of traits than those observed seem feasible as far as biomechanics and evolu-tionary genetics are concerned. We suggest the concentration into two dimensions and the lumpiness within that plane reflect the major trait constellations that are competent and competitive across the ecological situations available on Earth today.
The patterns described here pertain to fundamental aspects of form and function critical to growth, survival and reproduction of the vast majority of vascular plants on Earth. Importantly, plants converge and diverge in many more ways than explored here, through variation in a vast array of traits beyond the scope of our analysis, related to the fine-tuning of different taxa to specific abiotic and biotic conditions in their habitat (for example refs 42–44). Such variation fits within the more general patterns shown here.
More broadly, our findings are directly relevant to a number of long-running and emerging broad-scale scientific initiatives. First, our findings provide the widest empirical context so far for examining theories that have focused on plant ecological strategies—on differ-ent aspects of the Darwinian struggle for existence. For example, the H–SM dimension could be seen as reflecting the r (colonization) ver-sus K (exploitation) continuum4,45. The LMA–Nmass dimension reflects the A (adversity-selection) continuum4,46, acquisitive-conservative continuum5,7,19,20 or leaf economic spectrum10. The positions signalled by numbers 3, 4, and 5 in Fig. 2a (and described in Extended Data Table 2) could arguably roughly correspond to the stress-tolerant, ruderal, and competitor strategies of Grime3,11,19. Interestingly, the functional hotspots lie at intermediate positions on the plane rather than at any of these extreme positions (that is, r versus K, acquisitive versus conservative resource economy, C, S or R-strategy).
Second, the global spectrum we describe has potential to improve emerging large-scale vegetation and ecosystem models (for exam-ple see refs 47–49) because we clearly show (Fig. 2a and Extended
© 2016 Macmillan Publishers Limited. All rights reserved

1 4 j a n u a r y 2 0 1 6 | V O L 5 2 9 | n a T u r E | 1 7 1
Article reSeArcH
Data Fig. 4) that only a limited set of combinations are observed from six plant traits most fundamental to survival, growth and reproduction.
More generally, our findings—as encapsulated in the plane of Fig. 2—establish a backdrop against which many other facets of plant biology can be placed into a broader context. Plant lineages, evolution-ary trajectories, and historical and contemporary plant communities and biomes can be mapped onto this global trait spectrum. Trait vari-ation in any given physical setting can be compared to the worldwide background. Model species such as Arabidopsis thaliana (located at one extreme of the spectrum) can be positioned against this backdrop, helping to judge how typical or otherwise their physiology and natural history might be. The global spectrum of plant form and function is thus, in a sense, a galactic plane within which we can position any plant—from star anise to sunflower—based on its traits.
Online Content Methods, along with any additional Extended Data display items and Source Data, are available in the online version of the paper; references unique to these sections appear only in the online paper.
Received 16 September; accepted 26 November 2015.
Published online 23 December 2015.
1. Schimper, A. Plant-geography upon a Physiological Basis (Oxford Univ. Press, 1903).
2. Warming, E. Ecology of Plants (Clarendon, 1909).3. Grime, J. P. Vegetation classification by reference to strategies. Nature 250,
26–31 (1974).4. Southwood, T. R. E. Habitat, the templet for ecological strategies? J. Anim. Ecol.
46, 337–365 (1977).5. Chapin, F. S. The mineral nutrition of wild plants. Annu. Rev. Ecol. Syst. 11,
233–260 (1980).6. Niklas, K. J. The Evolutionary Biology of Plants (Univ. of Chicago Press, 1997).7. Reich, P. B., Walters, M. B. & Ellsworth, D. S. From tropics to tundra: global
convergence in plant functioning. Proc. Natl Acad. Sci. USA 94, 13730–13734 (1997).
8. Ackerly, D. Functional strategies of chaparral shrubs in relation to seasonal water deficit and disturbance. Ecol. Monogr. 74, 25–44 (2004).
9. Field, C. H. & Mooney, H. A. in On the Economy of Plant Form and Function (ed. Givnish, T. J.) pp. 25–49 (Cambridge Univ. Press, 1986).
10. Wright, I. J. et al. The worldwide leaf economics spectrum. Nature 428, 821–827 (2004).
11. Pierce, S., Brusa, G., Vagge, I. & Cerabolini, B. E. L. Allocating CSR plant functional types: the use of leaf economics and size traits to classify woody and herbaceous vascular plants. Funct. Ecol. 27, 1002–1010 (2013).
12. Li, L. et al. Leaf economics and hydraulic traits are decoupled in five species-rich tropical-subtropical forests. Ecol. Lett. 18, 899–906 (2015).
13. Chave, J. et al. Towards a worldwide wood economics spectrum. Ecol. Lett. 12, 351–366 (2009).
14. Zanne, A. E. et al. Angiosperm wood structure: Global patterns in vessel anatomy and their relation to wood density and potential conductivity. Am. J. Bot. 97, 207–215 (2010).
15. Salisbury, E. Seed size and mass in relation to environment. Proc. R. Soc. B 186, 83–88 (1974).
16. Thompson, K. Seeds and Seed Banks. New Phytol. 106, 23–34 (1987).17. Moles, A. T., Falster, D. S., Leishman, M. R. & Westoby, M. Small-seeded species
produce more seeds per square metre of canopy per year, but not per individual per lifetime. J. Ecol. 92, 384–396 (2004).
18. Lambers, H. & Poorter, H. Inherent variation in growth rate between higher plants: a search for physiological causes and ecological consequences. Adv. Ecol. Res. 23, 187–261 (1992).
19. Grime, J. P. et al. Integrated screening validates primary axes of specialisation in plants. Oikos 79, 259–281 (1997).
20. Díaz, S. et al. The plant traits that drive ecosystems: evidence from three continents. J. Veg. Sci. 15, 295–304 (2004).
21. Wright, I. J. et al. Relationships among ecologically important dimensions of plant trait variation in seven neotropical forests. Ann. Bot. 99, 1003–1015 (2007).
22. Poorter, L. et al. Are functional traits good predictors of demographic rates? Evidence from five neotropical forests. Ecology 89, 1908–1920 (2008).
23. Baraloto, C. et al. Decoupled leaf and stem economics in rain forest trees. Ecol. Lett. 13, 1338–1347 (2010).
24. Laughlin, D. C., Leppert, J. J., Moore, M. M. & Sieg, C. H. A multi-trait test of the leaf-height-seed plant strategy scheme with 133 species from a pine forest flora. Funct. Ecol. 24, 493–501 (2010).
25. Freschet, G. T., Cornelissen, J. H. C., Van Logtestijn, R. S. P. & Aerts, R. Evidence of the ‘plant economics spectrum’in a subarctic flora. J. Ecol. 98, 362–373 (2010).
26. Patiño, S. et al. Coordination of physiological and structural traits in Amazon forest trees. Biogeosciences 9, 775–801 (2012).
27. Pierce, S., Bottinelli, A., Bassani, I., Ceriani, R. M. & Cerabolini, B. E. L. How well do seed production traits correlate with leaf traits, whole-plant traits and plant ecological strategies? Plant Ecol. 215, 1351–1359 (2014).
28. Price, C. A. et al. Are leaf functional traits ‘invariant’ with plant size and what is ‘invariance’ anyway? Funct. Ecol. 28, 1330–1343 (2014).
29. Cornwell, W. K. et al. Functional distinctiveness of major plant lineages. J. Ecol. 102, 345–356 (2014).
30. Kattge, J. et al. TRY–a global database of plant traits. Glob. Change Biol. 17, 2905–2935 (2011).
31. Weiher, E. et al. Challenging Theophrastus: a common core list of plant traits for functional ecology. J. Veg. Sci. 10, 609–620 (1999).
32. Westoby, M., Falster, D. S., Moles, A. T., Vesk, P. A. & Wright, I. J. Plant ecological strategies: some leading dimensions of variation between species. Annu. Rev. Ecol. Syst. 33, 125–159 (2002).
33. Garnier, E., Navas, M. & Grigulis, K. Plant Functional Diversity - Organism Traits, Community Structure, and Ecosystem Properties (Oxford Univ. Press, 2016).
34. Cornwell, W. K., Schwilk, L. D. & Ackerly, D. D. A trait-based test for habitat filtering: convex hull volume. Ecology 87, 1465–1471 (2006).
35. Leimar, O. Evolutionary change and Darwinian demons. Selection 2, 65–72 (2001).
36. Coley, P. D., Bryant, J. P. & Chapin, F. S. III. Resource availability and plant antiherbivore defense. Science 230, 895–899 (1985).
37. Theophrastus. Enquiry into Plants and Minor Works on Odours and Weather Signs (translated by Hort, A. F) (Heinemann, 1916).
38. Haig, D. & Westoby, M. Seed size, pollination costs and angiosperm success. Evol. Ecol. 5, 231–247 (1991).
39. Lord, J. M. & Westoby, M. Accessory costs of seed production and the evolution of angiosperms. Evolution 66, 200–210 (2012).
40. Eriksson, O., Friis, E. M. & Löfgren, P. Seed size, fruit size and dispersal spectra in angiosperms from the Early Cretaceous to the Late Tertiary. Am. Nat. 156, 47–58 (2000).
41. Boyce, C. K., Brodribb, T. J., Feild, T. S. & Zwieniecki, M. A. Angiosperm leaf vein evolution was physiologically and environmentally transformative. Proc. R. Soc. B 276, 1771–1776 (2009).
42. Grubb, P. J. The maintenance of species-richness in plant communities: the importance of the regeneration niche. Biol. Rev. Camb. Philos. Soc. 52, 107–145 (1977).
43. Grubb, P. J. in The Population Structure of Vegetation (ed. White, J.) pp. 595– 621 (Springer, 1985).
44. Grime, J. P. Declining plant diversity: empty niches or functional shifts? J. Veg. Sci. 13, 457–460 (2002).
45. MacArthur, R. H. & Wilson, E. O. The Theory of Island Biogeography (Princeton Univ. Press, 1967).
46. Greenslade, P. Adversity selection and the habitat templet. Am. Nat. 122, 352–365 (1983).
47. van Bodegom, P. M., Douma, J. C. & Verheijen, L. M. A fully traits-based approach to modeling global vegetation distribution. Proc. Natl Acad. Sci. USA 111, 13733–13738 (2014).
48. Scheiter, S., Langan, L. & Higgins, S. I. Next-generation dynamic global vegetation models: learning from community ecology. New Phytol. 198, 957–969 (2013).
49. Harfoot, M. B. J. et al. Emergent global patterns of ecosystem structure and function from a mechanistic general ecosystem model. PLoS Biol. 12, e1001841 (2014).
Supplementary Information is available in the online version of the paper.
Acknowledgements We are grateful to the many researchers who contributed to this study by making their data available, helping to check information, and/or providing comments at various stages. The study was supported by the TRY initiative on plant traits (http://www.try-db.org). The TRY database is hosted at the Max Planck Institute for Biogeochemistry (Jena, Germany) and supported by DIVERSITAS/Future Earth, the German Centre for Integrative Biodiversity Research (iDiv) Halle-Jena-Leipzig, and BACI (grant ID 640176). The study has also been partially supported by the following institutions and grants to S.Di.: Universidad Nacional de Córdoba and CONICET, FONCyT (PICT 554) and SECyT (Argentina), The Leverhulme Trust, UK, and Inter-American Institute for Global Change Research (IAI) SGP-CRA2015 (supported by US National Science Foundation grant GEO-1138881).
Author Contributions Order in list of authors reflects overall participation in this article. S.Dí., J.K. and S.L. designed the study. S.Dí., J.K., J.H.C.C., I.J.W., S.L., M.K., C.W., E.G., I.C.P , M.W., H.P., P.B.R., A.T.M., J.D, A.N.G., A.E.Z., J.C., S.J.W., S.N.S., H.J., C.B., B.C., S.P., B. S. and D.K. contributed substantial amounts of data. S.Dí., J.K., G.B., A.G. and V.F. constructed the database. S.Dí., J.K., J.H.C.C., I.J.W., S.L., S.Dr., B.R., M.K., C.W., E.G., F.C., J.S.J., N.R., M.D.M. and L.D.G. carried out analyses. S.Di., J.K., J.H.C.C., I.J.W., S.L., M.K., C.W., I.C.P., M.W. and P.B.R. wrote the article with contributions from S.Dr., B.R., E.G., H.P., A.T.M., J.D., A.N.G., A.E.Z., J.C., S.J.W., S.N.S., H.J., C.B., B.C., S.P., B.S., DK, F.C., M.D.M. and L.D.G.
Author Information Reprints and permissions information is available at www.nature.com/reprints. The authors declare no competing financial interests. Readers are welcome to comment on the online version of the paper. Correspondence and requests for materials should be addressed to S.Dí. ([email protected]).
© 2016 Macmillan Publishers Limited. All rights reserved

ArticlereSeArcH
MeThODSPlant trait definitions and ecological meaning. Adult plant height (typical height of the upper boundary of the main photosynthetic tissues at maturity; hereafter H) is the most common measure of whole plant size and indicates ability to pre-empt resources, including the ability of taller plants to display their leaves above those of others and therefore outcompete them; it also relates to whole plant fecundity and facilitation of seed dispersal32,50–53. Taller plants intercept more light but, trading off against that, construction and maintenance costs and risk of breakage increase with height22,54. Large stature has been repeatedly selected for in different lineages during the evolution of land plants, although achieved very differently in different clades55.
Stem specific density (dry mass per unit of fresh stem volume; SSD) is a sec-ond key index of construction costs and structural strength. Although SSD is more commonly measured on trees, here we used data for both herbaceous and woody species. At least among woody species, stem specific density is positively linked with plant mechanical strength, hydraulic safety and resistance to biotic agents13,14,56. In high-precipitation systems wood density underpins a succes-sional continuum running from low-SSD, fast-growing, light-demanding species to high-SSD, slow-growing, shade-tolerant species. More broadly SSD characterizes a trade-off between fast growth with high mortality rates versus slow growth with high survival25,57.
Leaf area (one-sided surface area of an individual lamina; LA) is the most com-mon measure of leaf size. It is relevant for light interception and has important consequences for leaf energy and water balance58–60. LA affects leaf temperature via boundary layer effects. The larger the lamina, the lower the heat exchange, the diffusion of carbon dioxide and water vapour per unit leaf area between a leaf and the surrounding air. LA is known to be constrained by climatic and microclimatic conditions and also by the allometric consequences of plant size, anatomy and architecture61–63.
Leaf dry mass per unit of lamina surface area (leaf mass per area; LMA) and leaf nitrogen content per unit of lamina dry mass (Nmass) reflect different aspects of leaf-level carbon-gain strategies, in particular the «leaf economic spectrum» running from “conservative” species with physically robust, high-LMA leaves with high construction costs per unit leaf area and long expected leaf lifespan (and thus duration of photosynthetic income) to “acquisitive” species with tender, low-cost low-LMA leaves, and short leaf lifespan5,9,10,18–20,32,64,65. LMA relates the area of light interception to leaf biomass, being an expression of how much carbon is invested per unit of light-intercepting area, and thus reflecting a trade-off between construction cost and longevity of lamina. Nmass is directly related to photosyn-thesis and respiration, as the majority of leaf nitrogen is found in metabolically active proteins. Nmass reflects a trade-off between, on the one hand, two different costs that increase with higher Nmass (to acquire N, and potentially suffer more herbivory) and, on the other hand, the greater photosynthetic potential that higher Nmass allows.
Diaspore mass (mass of an individual seed or spore plus any additional struc-tures that assist dispersal and do not easily detach; SM) indexes species along a dimension describing the trade-off between seedling competitiveness and survival on the one hand, and dispersal and colonization ability on the other16,66–68. As a broad generalization small seeds can be produced in larger numbers with the same reproductive effort and, at a given plant height, be dispersed further away from the parent plant and form persistent seed banks, whereas large seeds facilitate survival through the early stages of recruitment, and higher establishment in the face of environmental hazards (for example deep shade, drought, herbivory)32,69–72.Dataset description. We compiled a global dataset containing 46,085 species and 601,973 cells, of which 92,212 correspond to quantitative species-level trait information, based on > 800,000 trait measurements for the six traits of interest on > 500,000 plant individuals. The vast majority of data were compiled from pre-existing smaller datasets contributed to the TRY Plant Trait Database30 (https://www.try-db.org, accessed May 2015). The dataset was supplemented by published data not included in TRY and a small number of original unpublished data by W. J. Bond, J.H.C.C., S.Di., L. Enrico, M. T. Fernandez-Piedade, L.D.G., D.K., M.K., N. Salinas, E.-D. Schulze, K. Thompson, and R. Urrutia. The final dataset (BLOB) was derived from 175 studies10,11,13,20,21,23–25,56,57,64,65,73–235.
In this global analysis, each species, identified subspecies or local variety is represented by a single value for each trait. This value is the geometric mean of all the observations of a trait present in the TRY Plant Trait Database and addi-tional databases incorporated to the present dataset. The number of observations per trait and species range from a single one (in the case of rare, geographically restricted species) to hundreds (in the case of common species with wide geo-graphical distribution). In this way, the analysis incorporates the high intraspecific variation that is sometimes observed in widespread species30,185,236–238. In addition and fully acknowledging their existence, intraspecific variations are assumed to
be comparatively small in the context of the vast range of variation contained in this worldwide dataset30.
Species names were standardized and attributed to families according to The Plant List (http://www.theplantlist.org/; accessed 2015). Attribution of families to higher-rank groups was made according to APG III (2009) (http://www.mobot.org/MOBOT/research/APweb/). Information about primary growth-form (wood-iness, woody, semi-woody, non-woody) and secondary growth-form (herbaceous non-graminoid, herbaceous graminoid, herbaceous non-graminoid/shrub, shrub, shrub/tree, tree, climber, succulent, other) was added based on a look-up table of categorical plant-traits30 (https://www.try-db.org/TryWeb/Data.php#3) and additional information from various sources; >86% species were allocated to cat-egories according to primary growth-form, and >80% according to secondary growth-form.
Species distribution data were derived from the Global Biodiversity Information System (GBIF; http://www.gbif.org) and combined with 0.5 × 0.5 degree gridded long term climate information derived from CRU (http://www.cru.uea.ac.uk/data).Trait measurement. In the case of published datasets, trait measurement methods are in the original publications listed in Dataset description. In the case of unpub-lished records, they were measured following the protocols specified in the context of the LEDA project (https://www.leda-traitbase.org) or in ref. 239 (http://www.nucleodiversus.org/index.php?mod=page&id=79). All data were unit-standard-ized and subjected to error detection and quality control (see below).Treatment of pteridophyte spore mass. The trait values for diaspore mass of pterido-phytes were estimated based on literature data for spore radius (r). We made crude assumptions that spores would be broadly spherical, with volume = (4/3)πr3, and that their density would be 0.5 mg mm−3. Although these assumptions were clearly imprecise, we are confident they result in spore masses within the right order of magnitude (and several orders of magnitude smaller than seed mass of spermato-phytes). Most data were from ref. 240, data for Sadleria pallida were from ref. 241, for Pteridium aquilinum from ref. 242, and for Diphasiastrum spp. from ref. 243.Treatment of stem specific density in herbaceous species. Data on stem specific density (SSD) are available for a very large number of woody species, but only for very few herbaceous species. To incorporate this fundamental trait in our analysis, we complemented SSD of herbaceous species using an estimation based on leaf dry matter content (LDMC), a much more widely available trait, and its close correlation to stem dry matter content (StDMC, the ratio of stem dry mass to stem water-saturated fresh mass). StDMC is a good proxy of SSD in herba-ceous plants with a ratio of approximately 1:1 (ref. 100), despite substantial dif-ferences in stem anatomy among botanical families244, including those between non-monocotyledons and monocotyledons (where sheaths were measured). We used a data set of 422 herbaceous species collected in the field across Europe and Israel, and belonging to 31 botanical families144 to parameterize linear rela-tionships of StDMC to LDMC. The slopes of the relationship were significantly higher for monocotyledons than for other angiosperms (F = 12.3; P < 0.001); within non-monocotyledons, the slope for Leguminosae was higher than that for species from other families. We thus used three different equations to predict SSD for 1963 herbaceous species for which LDMC values were available in TRY: one for monocotyledons (SSD = 0.888 × LDMC + 2.69), one for Leguminosae (SSD = 0.692 × LDMC + 47.65), and a third one for other non-monocotyledons (SSD = 0.524 × LDMC + 95.87).Error detection and data quality control. The curation of the dataset faced a double challenge: (1) detecting erroneous entries (due to errors in sampling, measurement, unit conversion, etc.); and (2) ensuring that extreme values that correspond to truly extreme values of traits in nature are not mistakenly identified as outliers and therefore excluded from the dataset. To deal with these challenges, we took the following approach: Trait records measured on juvenile plants and on plants grown under non-natural environmental conditions were excluded from the data-set. Duplicate trait records (same species, similar trait values, no information on different measurement locations or dates) and obvious errors (for example LMA < 0) were excluded from the dataset. We then identified potential outliers follow-ing the approach described in ref. 30. Trait records with a distance of >4 stand-ard deviations from the mean of species, genus, family or higher-rank taxonomic group were excluded from the dataset unless their retention could be justified from external sources. Trait records with a distance of >3 standard deviations from the mean of species, genus, family or phylogenetic group were identified, checked by domain experts for plausibility and retained or excluded accordingly. The remaining dataset was used to calculate species mean trait values. Finally, the ten most extreme species mean values of each trait (smallest and largest) were again checked for reliability against external sources.Construction of observed and simulated six-trait convex hull hypervolumes. In order to explore the constraints underlying the trait space occupied by species in our dataset, we used the convex hull approach of ref. 34, which has been applied
© 2016 Macmillan Publishers Limited. All rights reserved
Article reSeArcH
successfully to a wide range of datasets, including disjoint ones245. The application of a recently developed—and therefore less widely tested—method proposed for “holey” datasets245 yielded similar results.
We computed a six-dimensional convex hull volume (i.e. a six-dimensional measure of the minimum convex volume of trait space occupied by species in our dataset, hereafter Hvobs) on the basis of the observed values of H, SSD, LA, LMA, Nmass, and SM, and compared it to four null model volumes (hvnm1–4) constructed under four different sets of assumptions. In all four cases the null hypothesis was H0: Hvobs = hvnm and the alternative hypothesis was H1: Hvobs < hvnm (‘the vol-ume of the convex hull defined by the observed species is smaller than the vol-ume occupied by species if their traits were generated under the null hypothesis’). Observed data were log10-transformed and standardized to zero mean and unit variance (z-transformation). Percentages in Fig. 1 indicate the reduction in size of the observed hypervolume compared to the average of 999 hypervolumes gener-ated from the assumptions of each null model (Monte-Carlo permutations246). To control for outliers, computation of volumes were performed on the observed and simulated convex hulls containing 95% of species located closest to the centroid. A visualization of the observed dataset and the four null models in three-dimensional trait spaces is available at https://sdray.shinyapps.io/globalspectr/ (Supplementary Application 1). The R script used for hypervolume computation is provided at ftp://pbil.univ-lyon1.fr/pub/datasets/dray/Diaz_Nature/.Null model 1. Species traits vary independently and each of them comes from a uni-form distribution. This null model assumes that each of the six traits represents an independent axis of specialization (i.e. the traits define a six- dimensional manifold) and that the occurrence of extreme and central values is equally probable. This uni-form independent trait distribution represents a “Darwinian Demon”35 scenario, where any combination of trait values can arise from mutation and escape from the natural selection process with equal probability. Simulated data are generated by randomly and independently sampling from independent uniform distribu-tions whose range limits are constrained to the 0.025 and 0.975 quantiles of the observed trait values. The shape of the hypervolume under this null model (hvnm1) is a hypercube.Null model 2. Species traits vary independently and each of them comes from a nor-mal distribution. This null model assumes that all six traits evolve independently, as in null model 1. However, extreme trait values are selected against during evolu-tion. Simulated data were obtained by randomly and independently selecting from univariate normal distributions with standard deviation determined by the trans-formed observed data. The corresponding hypervolume (hvnm2) is a hypersphere.Null model 3. Species traits vary independently but —unlike in the previous models— there is no assumption about the distribution of trait variation; each trait varies according to the observed univariate distributions. Simulated data were obtained by permuting the values for each trait independently and therefore destroying the covariance amongst traits. Under this null hypothesis (hvnm3) the hypervolume can take many potential shapes, emerging from the possible combi-nations of independently sampled plant trait observations.Null model 4. Species traits are normally distributed and follow the estimated cor-relation structure of the observed dataset. This null model assumes that there are less than six independent axes of specialization and that extreme values are selected against. Simulated data were obtained by generating multivariate normal variables with standard deviations of the transformed observed data using the correlation structure of the observed dataset. The corresponding hypervolume (hvnm4) is a hyperellipsoid. Deviations of observed data from null model 4 can be explained by deviations of the transformed observed univariate distributions from normal distributions, either showing lower tails than those expected in a normal distri-bution or by the non-observation of some combinations of extreme trait values, leading to truncated distributions, or by bimodal distributions.Test for concentration of species within the observed convex hull. For each trait, values were partitioned in 10 bins so that the multivariate space was divided in 106 cells. The number of species per cell was computed and cumulative frequency curves were built for observed data and null models. For each null model, we simulated 999 datasets and computed the 0.025–0.975 interquantile range and the median. We then determined N10 and N50, the minimum number of cells needed to cover 10% or 50% of species.Principal component analysis (PCA). We performed PCAs on different versions of the observed dataset and a gap-filled version using the statistical software pack-age InfoStat247 and the R-function ‘princomp’. Again all analyses were carried out on the correlation matrix of log10-transformed variables (traits), which is equivalent to using standardized data (z-transformation), which is considered appropriate for data with different measurement scales248. The number of significant PCA axes to be retained in order to minimize both redundancy and loss of information was determined using the procedure proposed by ref. 249, which allows one to test the significance of dimensionality in PCA. A visualization of the space occupied by
vascular plants in the space defined by all six PCA axes (three at a time) is availa-ble at https://sdray.shinyapps.io/globalspectrPC (Supplementary Application 2).
Differences in the position of different major taxa and growth forms along PC1 and PC2 were tested using analysis of variance (Extended Data Fig. 2). Because of the large number of data, we used an alpha level of 0.01 to reject the null hypoth-esis. ANOVA was carried out using a linear mixed model to take into account the lack of homoscedasticity due to different group sizes. We used AIC and BIC criteria to select the best model considering heterogeneous variances. When the ANOVA null hypothesis was rejected, means were compared using Fisher's least significant difference (P = 0.01). Data were analysed using the lme function of the nlme250 and lme4251 R-packages252 interfaced by InfoStat Statistical Software version 2015 (ref. 247).Test for robustness and representativeness of multivariate analysis results. In order to test if results shown in Fig. 2 and Extended Data Table 1 were robust with respect to the selection of traits and species and representative for vascular plants, we conducted a number of analyses: exclusion of gymnosperms and pteridophytes (‘angiosperms only’), exclusion of individual traits, and comparison to a gap-filled dataset representing about 15% of extant vascular plant species worldwide. The trait exclusion tests excluded the following individual traits, one at a time: LMA, Nmass and SSD, because analyses indicated that LMA and Nmass, although providing information on different aspects of leaf function (see Methods), are both part of the leaf economic spectrum7,10, and SSD and plant height both reflect plant size when woody and herbaceous plants are considered together. To test if the results of the multivariate analysis presented in Fig. 2 were representative of vascular plants, we constructed a gap-filled dataset based on those species that entered the global dataset via the TRY Plant Trait Database. We extracted 328,057 individual plant-level trait observations, which provide a substantial number of additional data not used in the main analysis. We applied the data selection process as described above (section: Error detection and data quality control). The resulting dataset contained 78% missing entries (gaps), which were filled by Bayesian hierarchical probabil-istic matrix factorization (BHPMF)253–255. The gap-filled dataset was then used to calculate species mean trait values, resulting in a gap-filled dataset for 45,507 species. To quantitatively compare the results of the PCA presented in Fig. 2 and Extended Data Table 1 with those of the angiosperms-only and the gap-filled data-sets, we applied a Procrustes test256 using the ‘procrustes’ and ‘protest’ functions in R package ‘vegan’257. Function protest tests the non-randomness between two configurations. Significant results (for example significance < 0.05) indicate that the shapes of two datasets are non-random to each other, but similar.Kernel density estimation. To estimate the occurrence probability of given com-binations of trait values in a two-dimensional space defined by PC axes 1 and 2 (Fig. 2), and bivariate trait combinations (Extended Data Fig. 4), we used two- dimensional kernel density estimation258. Because results depend on the choice of the bandwidth used for the smoothing kernel, we used unconstrained bandwidth selectors259. To visualize the occurrence probability of a given trait combination in the PCA space as well as for all possible bivariate trait combinations, we con-structed contour plots from two-dimensional kernel density distributions. The colour gradient and contour lines in Fig. 2 and Extended Data Fig. 4 correspond to the 0.5, 0.95 and 0.99 quantiles of the respective probability distribution, thus highlighting the regions of highest and lowest trait occurrence probability. For kernel density estimation we used the ‘kde’ function and for optimal bandwidth selection carried out for each trait combination separately, we used the SAMSE pilot bandwidth selector260, both implemented in the R-package ‘ks’259. The R script used is provided at ftp://pbil.univ-lyon1.fr/pub/datasets/dray/Diaz_Nature/.Code availability. The R scripts used to generate the hypervolumes (Fig. 2) and kernel density analyses associated to Fig. 2 and Extended Data Fig. 4 are available at ftp://pbil.univ-lyon1.fr/pub/datasets/dray/Diaz_Nature/.
50. Gaudet, C. L. & Keddy, P. A. A comparative approach to predicting competitive ability from plant traits. Nature 334, 242–243 (1988).
51. Westoby, M. A leaf-height-seed (LHS) plant ecology strategy scheme. Plant Soil 199, 213–227 (1998).
52. Muller-Landau, H. C., Wright, S. J., Calderón, O., Condit, R. & Hubbell, S. P. Interspecific variation in primary seed dispersal in a tropical forest. J. Ecol. 96, 653–667 (2008).
53. Moles, A. T. et al. Global patterns in plant height. J. Ecol. 97, 923–932 (2009).54. Niklas, K. J. Influence of tissues density-specific mechanical-properties on the
scaling of plant height. Ann. Bot. 72, 173–179 (1993).55. Donoghue, M. J. Key innovations, convergence, and success: macroevolutionary
lessons from plant phylogeny. Paleobiology 31, 77–93 (2005).56. Preston, K. A., Cornwell, W. K. & Denoyer, J. L. Wood density and vessel traits as
distinct correlates of ecological strategy in 51 California coast range angiosperms. New Phytol. 170, 807–818 (2006).
57. Wright, S. J. et al. Functional traits and the growth-mortality trade-off in tropical trees. Ecology 91, 3664–3674 (2010).
© 2016 Macmillan Publishers Limited. All rights reserved

ArticlereSeArcH
89. Pyankov, V. I., Kondratchuk, A. V. & Shipley, B. Leaf structure and specific leaf mass: the alpine desert plants of the Eastern Pamirs, Tadjikistan. New Phytol. 143, 131–142 (1999).
90. Carswell, F. E. et al. Photosynthetic capacity in a central Amazonian rain forest. Tree Physiol. 20, 179–186 (2000).
91. Fonseca, C. R., Overton, J. M., Collins, B. & Westoby, M. Shifts in trait-combinations along rainfall and phosphorus gradients. J. Ecol. 88, 964–977 (2000).
92. Shipley, B. & Lechowicz, M. J. The functional co-ordination of leaf morphology, nitrogen concentration, and gas exchange in 40 wetland species. Ecoscience 7, 183–194 (2000).
93. Wilson, K. B., Baldocchi, D. D. & Hanson, P. J. Spatial and seasonal variability of photosynthetic parameters and their relationship to leaf nitrogen in a deciduous forest. Tree Physiol. 20, 565–578 (2000).
94. Koike, F. Plant traits as predictors of woody species dominance in climax forest communities. J. Veg. Sci. 12, 327–336 (2001).
95. Niinemets, Ü. Global-scale climatic controls of leaf dry mass per area, density, and thickness in trees and shrubs. Ecology 82, 453–469 (2001).
96. Bond-Lamberty, B., Wang, C. & Gower, S. T. Aboveground and belowground biomass and sapwood area allometric equations for six boreal tree species of northern Manitoba. Can. J. For. Res. 32, 1441–1450 (2002).
97. Bond-Lamberty, B., Wang, C., Gower, S. T. & Norman, J. Leaf area dynamics of a boreal black spruce fire chronosequence. Tree Physiol. 22, 993–1001 (2002).
98. Meir, P. et al. Acclimation of photosynthetic capacity to irradiance in tree canopies in relation to leaf nitrogen concentration and leaf mass per unit area. Plant Cell Environ. 25, 343–357 (2002).
99. Shipley, B. Trade-offs between net assimilation rate and specific leaf area in determining relative growth rate: relationship with daily irradiance. Funct. Ecol. 16, 682–689 (2002).
100. Shipley, B. & Vu, T. T. Dry matter content as a measure of dry matter concentration in plants and their parts. New Phytol. 153, 359–364 (2002).
101. Vendramini, F. et al. Leaf traits as indicators of resource-use strategy in floras with succulent species. New Phytol. 154, 147–157 (2002).
102. Cornelissen, J. H. C. et al. Functional traits of woody plants: correspondence of species rankings between field adults and laboratory-grown seedlings? J. Veg. Sci. 14, 311–322 (2003).
103. Loveys, B. R. et al. Thermal acclimation of leaf and root respiration: an investigation comparing inherently fast-and slow-growing plant species. Glob. Change Biol. 9, 895–910 (2003).
104. Mencuccini, M. The ecological significance of long-distance water transport: short-term regulation, long-term acclimation and the hydraulic costs of stature across plant life forms. Plant Cell Environ. 26, 163–182 (2003).
105. Ogaya, R. & Peñuelas, J. Comparative field study of Quercus ilex and Phillyrea latifolia: photosynthetic response to experimental drought conditions. Environ. Exp. Bot. 50, 137–148 (2003).
106. Pillar, V. D. & Sosinski, E. E. An improved method for searching plant functional types by numerical analysis. J. Veg. Sci. 14, 323–332 (2003).
107. Quested, H. M. et al. Decomposition of sub-arctic plants with differing nitrogen economies: a functional role for hemiparasites. Ecology 84, 3209–3221 (2003).
108. Sack, L., Cowan, P. D., Jaikumar, N. & Holbrook, N. M. The ‘hydrology’of leaves: co-ordination of structure and function in temperate woody species. Plant Cell Environ. 26, 1343–1356 (2003).
109. Xu, L. & Baldocchi, D. D. Seasonal trends in photosynthetic parameters and stomatal conductance of blue oak (Quercus douglasii) under prolonged summer drought and high temperature. Tree Physiol. 23, 865–877 (2003).
110. Adler, P. B., Milchunas, D. G., Lauenroth, W. K., Sala, O. E. & Burke, I. C. Functional traits of graminoids in semi-arid steppes: a test of grazing histories. J. Appl. Ecol. 41, 653–663 (2004).
111. Cornelissen, J. H. C. et al. Leaf digestibility and litter decomposability are related in a wide range of subarctic plant species and types. Funct. Ecol. 18, 779–786 (2004).
112. Fagúndez, J. & Izco, J. Seed morphology of Calluna salisb. (Ericaceae). Acta Botánica Malacitana 29, 215–220 (2004).
113. Givnish, T. J., Montgomery, R. A. & Goldstein, G. Adaptive radiation of photosynthetic physiology in the Hawaiian lobeliads: light regimes, static light responses, and whole-plant compensation points. Am. J. Bot. 91, 228–246 (2004).
114. Hill, M. O., Preston, C. D. & Roy, D. B. PLANTATT - Attributes of British and Irish Plants: Status, Size, Life History, Geography and Habitats http://nora.nerc.ac.uk/9535/1/PLANTATT.pdf (Centre for Ecology & Hydrology, NERC, 2004).
115. Kühn, I., Durka, W. & Klotz, S. BiolFlor: a new plant-trait database as a tool for plant invasion ecology. Divers. Distrib. 10, 363–365 (2004).
116. Sack, L. Responses of temperate woody seedlings to shade and drought: do trade-offs limit potential niche differentiation? Oikos 107, 110–127 (2004).
117. Von Holle, B. & Simberloff, D. Testing Fox’s assembly rule: does plant invasion depend on recipient community structure? Oikos 105, 551–563 (2004).
118. Bakker, C., Rodenburg, J. & Van Bodegom, P. M. Effects of Ca-and Fe-rich seepage on P availability and plant performance in calcareous dune soils. Plant Soil 275, 111–122 (2005).
119. Craine, J. M., Lee, W. G., Bond, W. J., Williams, R. J. & Johnson, L. C. Environmental constraints on a global relationship among leaf and root traits of grasses. Ecology 86, 12–19 (2005).
120. Gachet, S., Véla, E. & Tatoni, T. BASECO: a floristic and ecological database of Mediterranean French flora. Biodivers. Conserv. 14, 1023–1034 (2005).
58. Givnish, T. J. & Vermeij, G. J. Sizes and shapes of liane leaves. Am. Nat. 110, 743–778 (1976).
59. Givnish, T. J. Comparative studies of leaf form: assessing the relative roles of selective pressures and phylogenetic constraints. New Phytol. 106, 131–160 (1987).
60. Farquhar, G. D., Buckley, T. N. & Miller, J. M. Optimal stomatal control in relation to leaf area and nitrogen content. Silva Fennica 36, 625–637 (2002).
61. Ackerly, D. D. & Donoghue, M. J. Leaf size, sapling allometry, and Corner’s rules: phylogeny and correlated evolution in maples (Acer). Am. Nat. 152, 767–791 (1998).
62. Niklas, K. J. Plant Allometry: the Scaling of Form and Process (Univ. of Chicago Press, 1994).
63. Cornelissen, J. H. C. A triangular relationship between leaf size and seed size among woody species: allometry, ontogeny, ecology and taxonomy. Oecologia 118, 248–255 (1999).
64. Poorter, H., Niinemets, U., Poorter, L., Wright, I. J. & Villar, R. Causes and consequences of variation in leaf mass per area (LMA): a meta-analysis. New Phytol. 182, 565–588 (2009).
65. Bocanegra-González, K. T., Fermández-Mendez, F. & Galvis-Jiménez, J. F. Grupos funcionales de árboles en bosques secundarios de la región Bajo Calima (Buenaventura, Colombia). Bol. Cient. Mus. Hist. Nat. 19, 17–40 (2015).
66. Thompson, K., Band, S. R. & Hodgson, J. G. Seed size and shape predict persistence in soil. Funct. Ecol. 7, 236–241 (1993).
67. Moles, A. T. & Westoby, M. Seed size and plant strategy across the whole life cycle. Oikos 113, 91–105 (2006).
68. Schleicher, A., Biedermann, R. & Kleyer, M. Dispersal traits determine plant response to habitat connectivity in an urban landscape. Landscape Ecol. 26, 529–540 (2011).
69. Leishman, M. R. & Westoby, M. Hypotheses on seed size: tests using the semiarid flora of western New South Wales, Australia. Am. Nat. 143, 890–906 (1994).
70. Muller-Landau, H. C. The tolerance-fecundity trade-off and the maintenance of diversity in seed size. Proc. Natl Acad. Sci. USA 107, 4242–4247 (2010).
71. Thomson, F. J., Moles, A. T., Auld, T. D. & Kingsford, R. T. Seed dispersal distance is more strongly correlated with plant height than with seed mass. J. Ecol. 99, 1299–1307 (2011).
72. Ben-Hur, E., Fragman-Sapir, O., Hadas, R., Singer, A. & Kadmon, R. Functional trade-offs increase species diversity in experimental plant communities. Ecol. Lett. 15, 1276–1282 (2012).
73. Schulze, E.-D. & Schulze, I. Distribution and control of photosynthetic pathways in plants growing in the Namib Desert with special regard to Welwitschia mirabilis. Madoqua 9, 5–13 (1976).
74. Schulze, E. D., Eller, B. M., Thomas, D. A., Willert, D. J. V. & Brinckmann, E. Leaf temperatures and energy balance of Welwitschia mirabilis in its natural habitat. Oecologia 44, 258–262 (1980).
75. Zheng, W. Silva Sinica: Volume 1–4 (China Forestry Publishing House, Beijing, 1983).
76. Shipley, B. & Parent, M. Germination responses of 64 wetland species in relation to seed size, minimum time to reproduction and seedling relative growth rate. Funct. Ecol. 5, 111–118 (1991).
77. Fitter, A. H. & Peat, H. J. The ecological flora database. J. Ecol. 82, 415–425 (1994).
78. Shipley, B. Structured interspecific determinants of specific leaf area in 34 species of herbaceous angiosperms. Funct. Ecol. 9, 312–319 (1995).
79. Cornelissen, J. H. C. An experimental comparison of leaf decomposition rates in a wide range of temperate plant species and types. J. Ecol. 84, 573–582 (1996).
80. Cornelissen, J. H. C., Diez, P. C. & Hunt, R. Seedling growth, allocation and leaf attributes in a wide range of woody plant species and types. J. Ecol. 84, 755–765 (1996).
81. Atkin, O. K., Westbeek, M., Cambridge, M. L., Lambers, H. & Pons, T. L. Leaf respiration in light and darkness. Plant Physiol. 113, 961–965 (1997).
82. Gillison, A. N. & Carpenter, G. A generic plant functional attribute set and grammar for dynamic vegetation description and analysis. Funct. Ecol. 11, 775–783 (1997).
83. Castro-Diez, P., Puyravaud, J. P., Cornelissen, J. H. C. & Villar-Salvador, P. Stem anatomy and relative growth rate in seedlings of a wide range of woody plant species and types. Oecologia 116, 57–66 (1998).
84. Atkin, O. K., Schortemeyer, M., McFarlane, N. & Evans, J. R. The response of fast-and slow-growing Acacia species to elevated atmospheric CO2: an analysis of the underlying components of relative growth rate. Oecologia 120, 544–554 (1999).
85. Bahn, M. et al. in Land Use Changes in European Mountain Ecosystems: ECOMONT Concepts and Results (eds Cernusca, A., Tappeiner, U. & Bayfield, N.) pp. 247–255 (Blackwell Wissenschaft, 1999).
86. Hickler, T. Plant functional types and community characteristics along environmental gradients on Oland’s Great Alvar (Sweden). MSci. thesis, Univ. of Lund (1999).
87. Medlyn, B. E. et al. Effects of elevated [CO2] on photosynthesis in European forest species: a meta-analysis of model parameters. Plant Cell Environ. 22, 1475–1495 (1999).
88. Meziane, D. & Shipley, B. Interacting determinants of specific leaf area in 22 herbaceous species: effects of irradiance and nutrient availability. Plant Cell Environ. 22, 447–459 (1999).
© 2016 Macmillan Publishers Limited. All rights reserved

Article reSeArcH
121. Han, W., Fang, J., Guo, D. & Zhang, Y. Leaf nitrogen and phosphorus stoichiometry across 753 terrestrial plant species in China. New Phytol. 168, 377–385 (2005).
122. Kirkup, D., Malcolm, P., Christian, G. & Paton, A. Towards a digital African flora. Taxon 54, 457–466 (2005).
123. Louault, F., Pillar, V. D., Aufrere, J., Garnier, E. & Soussana, J. F. Plant traits and functional types in response to reduced disturbance in a semi-natural grassland. J. Veg. Sci. 16, 151–160 (2005).
124. Moles, A. T. et al. A brief history of seed size. Science 307, 576–580 (2005).125. Nakahashi, C. D., Frole, K. & Sack, L. Bacterial leaf nodule symbiosis in Ardisia
(Myrsinaceae): does it contribute to seedling growth capacity? Plant Biol. 7, 495–500 (2005).
126. Peco, B., de Pablos, I., Traba, J. & Levassor, C. The effect of grazing abandonment on species composition and functional traits: the case of dehesa grasslands. Basic Appl. Ecol. 6, 175–183 (2005).
127. Rentería, L., Jaramillo, V. J., Martinez-Yrízar, A. & Pérez-Jiménez, A. Nitrogen and phosphorus resorption in trees of a Mexican tropical dry forest. Trees 19, 431–441 (2005).
128. Sack, L., Tyree, M. T. & Holbrook, N. M. Leaf hydraulic architecture correlates with regeneration irradiance in tropical rainforest trees. New Phytol. 167, 403–413 (2005).
129. Schweingruber, F. H. & Landolt, W. The xylem database. http://www.wsl.ch/dendropro/xylemdb/ Swiss Federal Research Institute WSL, updated 2014.
130. Sheremet’ev, S. N. Herbs on the soil moisture gradient (water relations and the structural-functional organization). KMK, Moscow 271 (2005).
131. Vile, D. Significations Fonctionnelle et Ecologique des Traits des Especes Vegetales: Exemple dans une Succession Post-Cultural Mediterraneenne et Generalisations. PhD thesis, Univ. Montpellier 2 (2005).
132. Bakker, C., Van Bodegom, P. M., Nelissen, H. J. M., Ernst, W. H. O. & Aerts, R. Plant responses to rising water tables and nutrient management in calcareous dune slacks. Plant Ecol. 185, 19–28 (2006).
133. Cavender-Bares, J., Keen, A. & Miles, B. Phylogenetic structure of Floridian plant communities depends on taxonomic and spatial scale. Ecology 87 (Suppl), S109–S122 (2006).
134. Kazakou, E., Vile, D., Shipley, B., Gallet, C. & Garnier, E. Co-variations in litter decomposition, leaf traits and plant growth in species from a Mediterranean old-field succession. Funct. Ecol. 20, 21–30 (2006).
135. Kerkhoff, A. J. & Enquist, B. J. Ecosystem allometry: the scaling of nutrient stocks and primary productivity across plant communities. Ecol. Lett. 9, 419–427 (2006).
136. Poorter, L. & Bongers, F. Leaf traits are good predictors of plant performance across 53 rain forest species. Ecology 87, 1733–1743 (2006).
137. Sack, L. & Frole, K. Leaf structural diversity is related to hydraulic capacity in tropical rain forest trees. Ecology 87, 483–491 (2006).
138. Sack, L., Melcher, P. J., Liu, W. H., Middleton, E. & Pardee, T. How strong is intracanopy leaf plasticity in temperate deciduous trees? Am. J. Bot. 93, 829–839 (2006).
139. Campbell, C. et al. Acclimation of photosynthesis and respiration is asynchronous in response to changes in temperature regardless of plant functional group. New Phytol. 176, 375–389 (2007).
140. Cavender-Bares, J., Sack, L. & Savage, J. Atmospheric and soil drought reduce nocturnal conductance in live oaks. Tree Physiol. 27, 611–620 (2007).
141. Cornwell, W. K., Bhaskar, R., Sack, L. & Cordell, S. Adjustment of structure and function of Hawaiian Metrosideros polymorpha at high vs. low precipitation. Funct. Ecol. 21, 1063–1071 (2007).
142. Craven, D. et al. Between and within-site comparisons of structural and physiological characteristics and foliar nutrient content of 14 tree species at a wet, fertile site and a dry, infertile site in Panama. For. Ecol. Manage. 238, 335–346 (2007).
143. Domingues, T. F., Martinelli, L. A. & Ehleringer, J. R. Ecophysiological traits of plant functional groups in forest and pasture ecosystems from eastern Amazonia, Brazil. Plant Ecol. 193, 101–112 (2007).
144. Garnier, E. et al. Assessing the effects of land-use change on plant traits, communities and ecosystem functioning in grasslands: a standardized methodology and lessons from an application to 11 European sites. Ann. Bot. 99, 967–985 (2007).
145. Lavergne, S. & Molofsky, J. Increased genetic variation and evolutionary potential drive the success of an invasive grass. Proc. Natl Acad. Sci. USA 104, 3883–3888 (2007).
146. Meir, P., Levy, P. E., Grace, J. & Jarvis, P. G. Photosynthetic parameters from two contrasting woody vegetation types in West Africa. Plant Ecol. 192, 277–287 (2007).
147. Müller, S. C., Overbeck, G. E., Pfadenhauer, J. & Pillar, V. D. Plant functional types of woody species related to fire disturbance in forest–grassland ecotones. Plant Ecol. 189, 1–14 (2007).
148. Pierce, S., Ceriani, R. M., De Andreis, R., Luzzaro, A. & Cerabolini, B. The leaf economics spectrum of Poaceae reflects variation in survival strategies. Plant Biosyst. 141, 337–343 (2007).
149. Pierce, S., Luzzaro, A., Caccianiga, M., Ceriani, R. M. & Cerabolini, B. Disturbance is the principal α-scale filter determining niche differentiation, coexistence and biodiversity in an alpine community. J. Ecol. 95, 698–706 (2007).
150. Price, C. A. & Enquist, B. J. Scaling mass and morphology in leaves: an extension of the WBE model. Ecology 88, 1132–1141 (2007).
151. Scherer-Lorenzen, M., Schulze, E.-D., Don, A., Schumacher, J. & Weller, E. Exploring the functional significance of forest diversity: a new long-term
experiment with temperate tree species (BIOTREE). Perspect. Plant Ecol. Evol. Syst. 9, 53–70 (2007).
152. Schurr, F. M. et al. Colonization and persistence ability explain the extent to which plant species fill their potential range. Glob. Ecol. Biogeogr. 16, 449–459 (2007).
153. Swaine, E. K. Ecological and Evolutionary Drivers of Plant Community Assembly in a Bornean Rain Forest. PhD thesis, Univ. of Aberdeen (2007).
154. Vaieretti, M. V., Díaz, S., Vile, D. & Garnier, E. Two measurement methods of leaf dry matter content produce similar results in a broad range of species. Ann. Bot. 99, 955–958 (2007).
155. Coomes, D. A., Heathcote, S., Godfrey, E. R., Shepherd, J. J. & Sack, L. Scaling of xylem vessels and veins within the leaves of oak species. Biol. Lett. 4, 302–306 (2008).
156. Cornwell, W. K. et al. Plant species traits are the predominant control on litter decomposition rates within biomes worldwide. Ecol. Lett. 11, 1065–1071 (2008).
157. Hoof, J., Sack, L., Webb, D. T. & Nilsen, E. T. Contrasting structure and function of pubescent and glabrous varieties of Hawaiian Metrosideros polymorpha (Myrtaceae) at high elevation. Biotropica 40, 113–118 (2008).
158. Kleyer, M. et al. The LEDA Traitbase: a database of life-history traits of the Northwest European flora. J. Ecol. 96, 1266–1274 (2008).
159. Kraft, N. J. B., Valencia, R. & Ackerly, D. D. Functional traits and niche-based tree community assembly in an Amazonian forest. Science 322, 580–582 (2008).
160. Kurokawa, H. & Nakashizuka, T. Leaf herbivory and decomposability in a Malaysian tropical rain forest. Ecology 89, 2645–2656 (2008).
161. Quero, J. L. et al. Relating leaf photosynthetic rate to whole-plant growth: drought and shade effects on seedlings of four Quercus species. Funct. Plant Biol. 35, 725–737 (2008).
162. Reich, P. B. et al. Scaling of respiration to nitrogen in leaves, stems and roots of higher land plants. Ecol. Lett. 11, 793–801 (2008).
163. Royal Botanical Gardens Kew Seed Information Database (SID). Version 7.1. http://data.kew.org/sid/ (2015).
164. Scoffoni, C., Pou, A., Aasamaa, K. & Sack, L. The rapid light response of leaf hydraulic conductance: new evidence from two experimental methods. Plant Cell Environ. 31, 1803–1812 (2008).
165. Shiodera, S., Rahajoe, J. S. & Kohyama, T. Variation in longevity and traits of leaves among co-occurring understorey plants in a tropical montane forest. J. Trop. Ecol. 24, 121–133 (2008).
166. van Bodegom, P. M., Sorrell, B. K., Oosthoek, A., Bakker, C. & Aerts, R. Separating the effects of partial submergence and soil oxygen demand on plant physiology. Ecology 89, 193–204 (2008).
167. Bragazza, L. Conservation priority of Italian Alpine habitats: a floristic approach based on potential distribution of vascular plant species. Biodivers. Conserv. 18, 2823–2835 (2009).
168. Ciocarlan, V. The Illustrated Flora of Romania. Pteridophyta et Spermatopyta. (Editura Ceres Bucharest, 2009).
169. Craine, J. M. et al. Global patterns of foliar nitrogen isotopes and their relationships with climate, mycorrhizal fungi, foliar nutrient concentrations, and nitrogen availability. New Phytol. 183, 980–992 (2009).
170. Dunbar, S., Sporck, M. & Sack, L. Leaf trait diversification and design in seven rare taxa of the Hawaiian Plantago radiation. Int. J. Plant Sci. 170, 61–75 (2009).
171. Fyllas, N. M. et al. Basin-wide variations in foliar properties of Amazonian forest: phylogeny, soils and climate. Biogeosciences 6, 2677–2708 (2009).
172. Green, W. USDA PLANTS Compilation, Version 1. http://bricol.net/downloads/data/PLANTSdatabase/ National Plant Data Center Baton Rouge (2009).
173. Kattge, J., Knorr, W., Raddatz, T. & Wirth, C. Quantifying photosynthetic capacity and its relationship to leaf nitrogen content for global-scale terrestrial biosphere models. Glob. Change Biol. 15, 976–991 (2009).
174. Malhado, A. C. M. et al. Spatial trends in leaf size of Amazonian rainforest trees. Biogeosciences 6, 1563–1576 (2009).
175. Manning, P., Houston, K. & Evans, T. Shifts in seed size across experimental nitrogen enrichment and plant density gradients. Basic Appl. Ecol. 10, 300–308 (2009).
176. Moretti, M. & Legg, C. Combining plant and animal traits to assess community functional responses to disturbance. Ecography 32, 299–309 (2009).
177. Paula, S. et al. Fire-related traits for plant species of the Mediterranean Basin: Ecological Archives E090-094. Ecology 90, 1420 (2009).
178. Poorter, L. Leaf traits show different relationships with shade tolerance in moist versus dry tropical forests. New Phytol. 181, 890–900 (2009).
179. Reich, P. B., Oleksyn, J. & Wright, I. J. Leaf phosphorus influences the photosynthesis-nitrogen relation: a cross-biome analysis of 314 species. Oecologia 160, 207–212 (2009).
180. Tecco, P. A., Diaz, S., Cabido, M. & Urcelay, C. Functional traits of alien plants across contrasting climatic and land-use regimes: do aliens join the locals or try harder than them? J. Ecol. 98, 17–27 (2009).
181. Wirth, C. & Lichstein, J. W. The Imprint of Species Turnover on Old-Growth Forest Carbon Balances-Insights from a Trait-Based Model of Forest Dynamics in Old-growth Forests - Function, Fate and Value 81–113 (eds. Wirth, C., Gleixner, G. & Heimann, M.) (Springer-Verlag, 2009).
182. Cerabolini, B. E. L. et al. Can CSR classification be generally applied outside Britain? Plant Ecol. 210, 253–261 (2010).
183. Domingues, T. F. et al. Co-limitation of photosynthetic capacity by nitrogen and phosphorus in West Africa woodlands. Plant Cell Environ. 33, 959–980 (2010).
© 2016 Macmillan Publishers Limited. All rights reserved

ArticlereSeArcH
184. Hao, G. Y., Sack, L., Wang, A. Y., Cao, K. F. & Goldstein, G. Differentiation of leaf water flux and drought tolerance traits in hemiepiphytic and non-hemiepiphytic Ficus tree species. Funct. Ecol. 24, 731–740 (2010).
185. Messier, J., McGill, B. J. & Lechowicz, M. J. How do traits vary across ecological scales? A case for trait-based ecology. Ecol. Lett. 13, 838–848 (2010).
186. Ordoñez, J. C. et al. Plant strategies in relation to resource supply in mesic to wet environments: does theory mirror nature? Am. Nat. 175, 225–239 (2010).
187. Peñuelas, J. et al. Faster returns on ‘leaf economics’ and different biogeochemical niche in invasive compared with native plant species. Glob. Change Biol. 16, 2171–2185 (2010).
188. Powers, J. S. & Tiffin, P. Plant functional type classifications in tropical dry forests in Costa Rica: leaf habit versus taxonomic approaches. Funct. Ecol. 24, 927–936 (2010).
189. Willis, C. G. et al. Phylogenetic community structure in Minnesota oak savanna is influenced by spatial extent and environmental variation. Ecography 33, 565–577 (2010).
190. Blonder, B., Violle, C., Bentley, L. P. & Enquist, B. J. Venation networks and the origin of the leaf economics spectrum. Ecol. Lett. 14, 91–100 (2011).
191. Brown, K. A. et al. Assessing natural resource use by forest-reliant communities in Madagascar using functional diversity and functional redundancy metrics. PLoS One 6, e24107 (2011).
192. Butterfield, B. J. & Briggs, J. M. Regeneration niche differentiates functional strategies of desert woody plant species. Oecologia 165, 477–487 (2011).
193. Campetella, G. et al. Patterns of plant trait–environment relationships along a forest succession chronosequence. Agric. Ecosyst. Environ. 145, 38–48 (2011).
194. Craine, J. M. et al. Functional consequences of climate change-induced plant species loss in a tallgrass prairie. Oecologia 165, 1109–1117 (2011).
195. de Araujo, A. C. et al. LBA-ECO CD-02 C and N Isotopes in Leaves and Atmospheric CO2, Amazonas, Brazil. Oak Ridge National Laboratory Distributed Active Archive Center, Oak Ridge, Tennessee, USA http://dx.doi.org/10.3334/ORNLDAAC/1097 (2012).
196. Laughlin, D. C., Fule, P. Z., Huffman, D. W., Crouse, J. & Laliberte, E. Climatic constraints on trait-based forest assembly. J. Ecol. 99, 1489–1499 (2011).
197. Milla, R. & Reich, P. B. Multi-trait interactions, not phylogeny, fine-tune leaf size reduction with increasing altitude. Ann. Bot. 107, 455–465 (2011).
198. Onoda, Y. et al. Global patterns of leaf mechanical properties. Ecol. Lett. 14, 301–312 (2011).
199. Prentice, I. C. et al. Evidence of a universal scaling relationship for leaf CO2 drawdown along an aridity gradient. New Phytol. 190, 169–180 (2011).
200. Sandel, B., Corbin, J. D. & Krupa, M. Using plant functional traits to guide restoration: a case study in California coastal grassland. Ecosphere 2, art23 (2011).
201. Tucker, S. S., Craine, J. M. & Nippert, J. B. Physiological drought tolerance and the structuring of tallgrass prairie assemblages. Ecosphere 2, art48 (2011).
202. Yguel, B. et al. Phytophagy on phylogenetically isolated trees: why hosts should escape their relatives. Ecol. Lett. 14, 1117–1124 (2011).
203. Adriaenssens, S. Dry Deposition and Canopy Exchange for Temperate Tree Species under High Nitrogen Deposition. PhD thesis, Ghent Univ. (2012).
204. Beckmann, M., Hock, M., Bruelheide, H. & Erfmeier, A. The role of UV-B radiation in the invasion of Hieracium pilosella—A comparison of German and New Zealand plants. Environ. Exp. Bot. 75, 173–180 (2012).
205. Choat, B. et al. Global convergence in the vulnerability of forests to drought. Nature 491, 752–755 (2012).
206. Craine, J., Towne, E. G., Ocheltree, T. & Nippert, J. Community traitscape of foliar nitrogen isotopes reveals N availability patterns in a tallgrass prairie. Plant Soil 356, 395–403 (2012).
207. Frenette-Dussault, C., Shipley, B., Léger, J. F., Meziane, D. & Hingrat, Y. Functional structure of an arid steppe plant community reveals similarities with Grime’s C-S-R theory. J. Veg. Sci. 23, 208–222 (2012).
208. Gallagher, R. V. & Leishman, M. R. A global analysis of trait variation and evolution in climbing plants. J. Biogeogr. 39, 1757–1771 (2012).
209. Guerin, G. R., Wen, H. & Lowe, A. J. Leaf morphology shift linked to climate change. Biol. Lett. 8, 882–886 (2012).
210. Gutiérrez, A. G. & Huth, A. Successional stages of primary temperate rainforests of Chiloé Island, Chile. Perspect. Plant Ecol. Evol. Syst. 14, 243–256 (2012).
211. Guy, A. L., Mischkolz, J. M. & Lamb, E. G. Limited effects of simulated acidic deposition on seedling survivorship and root morphology of endemic plant taxa of the Athabasca Sand Dunes in well-watered greenhouse trials. Botany 91, 176–181 (2012).
212. Han, W. et al. Floral, climatic and soil pH controls on leaf ash content in China’s terrestrial plants. Glob. Ecol. Biogeogr. 21, 376–382 (2012).
213. Minden, V., Andratschke, S., Spalke, J., Timmermann, H. & Kleyer, M. Plant trait–environment relationships in salt marshes: Deviations from predictions by ecological concepts. Perspect. Plant Ecol. Evol. Syst. 14, 183–192 (2012).
214. Minden, V. & Kleyer, M. Testing the effect–response framework: key response and effect traits determining above-ground biomass of salt marshes. J. Veg. Sci. 22, 387–401 (2011).
215. Pierce, S., Brusa, G., Sartori, M. & Cerabolini, B. E. L. Combined use of leaf size and economics traits allows direct comparison of hydrophyte and terrestrial herbaceous adaptive strategies. Ann. Bot. 109, 1047–1053 (2012).
216. Spasojevic, M. J. & Suding, K. N. Inferring community assembly mechanisms from functional diversity patterns: the importance of multiple assembly processes. J. Ecol. 100, 652–661 (2012).
217. Vergutz, L., Manzoni, S., Porporato, A., Novais, R. F. & Jackson, R. B. A Global Database of Carbon and Nutrient Concentrations of Green and Senesced
Leaves. Oak Ridge National Laboratory Distributed Active Archive Center, Oak Ridge, Tennessee, USA http://dx.doi.org/10.3334/ORNLDAAC/1106 (2012).
218. Williams, M., Shimabokuro, Y. E. & Rastetter, E. B. LBA-ECO CD-09 Soil and Vegetation Characteristics, Tapajos National Forest, Brazil. Oak Ridge National Laboratory Distributed Active Archive Center, Oak Ridge, Tennessee, USA http://dx.doi.org/10.3334/ORNLDAAC/1104 (2012).
219. Wright, J. P. & Sutton-Grier, A. Does the leaf economic spectrum hold within local species pools across varying environmental conditions? Funct. Ecol. 26, 1390–1398 (2012).
220. Auger, S. & Shipley, B. Interspecific and intraspecific trait variation along short environmental gradients in an old-growth temperate forest. J. Veg. Sci. 24, 419–428 (2013).
221. Blonder, B., Violle, C. & Enquist, B. J. Assessing the causes and scales of the leaf economics spectrum using venation networks in Populus tremuloides. J. Ecol. 101, 981–989 (2013).
222. Byun, C., Blois, S. & Brisson, J. Plant functional group identity and diversity determine biotic resistance to invasion by an exotic grass. J. Ecol. 101, 128–139 (2013).
223. Chen, Y., Han, W., Tang, L., Tang, Z. & Fang, J. Leaf nitrogen and phosphorus concentrations of woody plants differ in responses to climate, soil and plant growth form. Ecography 36, 178–184 (2013).
224. Conti, G. & Díaz, S. Plant functional diversity and carbon storage–an empirical test in semi-arid forest ecosystems. J. Ecol. 101, 18–28 (2013).
225. Conti, G., Enrico, L., Casanoves, F. & Diaz, S. Shrub biomass estimation in the semiarid Chaco forest: a contribution to the quantification of an underrated carbon stock. Ann. For. Sci. 70, 515–524 (2013).
226. Demey, A. et al. Nutrient input from hemiparasitic litter favors plant species with a fast-growth strategy. Plant Soil 371, 53–66 (2013).
227. Kichenin, E., Wardle, D. A., Peltzer, D. A., Morse, C. W. & Freschet, G. T. Contrasting effects of plant inter-and intraspecific variation on community-level trait measures along an environmental gradient. Funct. Ecol. 27, 1254–1261 (2013).
228. Pahl, A. T., Kollmann, J., Mayer, A. & Haider, S. No evidence for local adaptation in an invasive alien plant: field and greenhouse experiments tracing a colonization sequence. Ann. Bot. 112, 1921–1930 (2013).
229. Brando, P. M. et al. Abrupt increases in Amazonian tree mortality due to drought-fire interactions. Proc. Natl Acad. Sci. USA 111, 6347–6352 (2014).
230. Everwand, G., Fry, E. L., Eggers, T. & Manning, P. Seasonal variation in the vapacity for plant trait measures to predict grassland carbon and water fluxes. Ecosystems (N. Y.) 17, 1095–1108 (2014).
231. Fry, E. L., Power, S. A. & Manning, P. Trait-based classification and manipulation of plant functional groups for biodiversity–ecosystem function experiments. J. Veg. Sci. 25, 248–261 (2014).
232. Iida, Y. et al. Linking functional traits and demographic rates in a subtropical tree community: the importance of size dependency. J. Ecol. 102, 641–650 (2014).
233. Blonder, B. et al. Testing models for the leaf economics spectrum with leaf and whole-plant traits in Arabidopsis thaliana. AoB Plants 7, plv049 (2015).
234. Meng, T.-T. et al. Responses of leaf traits to climatic gradients: adaptive variation versus compositional shifts. Biogeosciences Discuss. 12, 7093–7124 (2015).
235. Burrascano, S. et al. Environmental filtering of wild boar rooting activity on understorey composition and functional traits. Community Ecol. 16, 244–253 (2015).
236. Albert, C. H. et al. Intraspecific functional variability: extent, structure and sources of variation. J. Ecol. 98, 604–613 (2010).
237. Gillison, A. N. in Vegetation Ecology 2nd edn (eds. van der Maarel, E. & Franklin, J.) pp. 347–386 (Wiley Online Library, 2013).
238. Niinemets, Ü., Keenan, T. F. & Hallik, L. A worldwide analysis of within-canopy variations in leaf structural, chemical and physiological traits across plant functional types. New Phytol. 205, 973–993 (2015).
239. Pérez-Harguindeguy, N. et al. New handbook for standardised measurement of plant functional traits worldwide. Aust. J. Bot. 61, 167–234 (2013).
240. Page, C. N. The ferns of Britain and Ireland (Cambridge Univ. Press, 1997).241. Lloyd, R. M. Spore morphology of the Hawaiian genus Sadleria (Blechnaceae).
Am. Fern J. 66, 1–7 (1976).242. Conway, E. Spore production in bracken (Pteridium aquilinum (L.) Kuhn).
J. Ecol. 45, 273–284 (1957).243. Stoor, A. M., Boudrie, M., Jérǒme, C., Horn, K. & Bennert, H. W. Diphasiastrum
oellgaardii (Lycopodiaceae, Pteridophyta), a new lycopod species from Central Europe and France. Feddes Repert. 107, 149–157 (1996).
244. Büntgen, U., Psomas, A. & Schweingruber, F. H. Introducing wood anatomical and dendrochronological aspects of herbaceous plants: applications of the Xylem Database to vegetation science. J. Veg. Sci. 25, 967–977 (2014).
245. Blonder, B., Lamanna, C., Violle, C. & Enquist, B. J. The n-dimensional hypervolume. Glob. Ecol. Biogeogr. 23, 595–609 (2014).
246. Manly, B. J. Randomization, Bootstrap and Monte Carlo Methods in Biology (Chapman & Hall, 1997).
247. Di Rienzo, J. A. et al. InfoStat version 2015. Grupo InfoStat, FCA, Universidad Nacional de Córdoba, Argentina. (Cordoba, 2015).
248. Jongman, R. H. G., ter Braak, C. J. F. & van Tongeren, O. F. R. Data Analysis in Community and Landscape Ecology. (Pudor, Wageningen, 1987).
© 2016 Macmillan Publishers Limited. All rights reserved

Article reSeArcH
255. Schrodt, F. et al. BHPMF – a hierarchical Bayesian approach to gap-filling and trait prediction for macroecology and functional biogeography. Glob. Ecol. Biogeogr. 24, 1510–1521 (2015).
256. Peres-Neto, P. R. & Jackson, D. A. How well do multivariate data sets match? The advantages of a Procrustean superimposition approach over the Mantel test. Oecologia 129, 169–178 (2001).
257. Oksanen, J. et al. vegan: Community Ecology Package, version 2.0–7. http://CRAN.R-project.org/package=vegan (2008).
258. Wand, M. & Jones, M. Kernel Smoothing (Chapman and Hall, 1995).259. Duong, T. ks: Kernel density estimation and kernel discriminant analysis for
multivariate data in R. J. Stat. Softw. 21, 1–16 (2007).260. Duong, T. & Hazelton, M. Plug-in bandwidth matrices for bivariate kernel
density Estimation. J. Nonparametr. Stat. 15, 17–30 (2003).261. New, M., Hulme, M. & Jones, P. Representing twentieth-century space-time
climate variability. Part I: Development of a 1961-90 mean monthly terrestrial climatology. J. Clim. 12, 829–856 (1999).
262. Whittaker, R. J. Communities and Ecosystems (Macmillan, 1975).263. Warton, D. I., Wright, I. J., Falster, D. S. & Westoby, M. Bivariate line-fitting
methods for allometry. Biol. Rev. Camb. Philos. Soc. 81, 259–291 (2006).
249. Dray, S. On the number of principal components: a test of dimensionality based on measurements of similarity between matrices. Comput. Stat. Data Anal. 52, 2228–2237 (2008).
250. Pinheiro, J., Bates, D., DebRoy, S. & Sarkar, D. Nlme: Linear and Nonlinear Mixed Effects Models. “nlme” R package version 3.1-108. http://CRAN.R-project.org/package=nlme (2013).
251. Bates, D., Maechler, M. & Bolker, B. Lme4: linear mixed-effects models using S4 classes. R package version 0.999999-2. http://lme4.r-forge.r-project.org/ (2013).
252. R Development Core Team. R: A language and environment for statistical computing. https://www.r-project.org/ (R Foundation for Statistical Computing, 2014).
253. Shan, H. et al. Gap filling in the Plant Kingdom: trait prediction using Hierarchical Probabilistic Matrix Factorization. Proceedings of the 29th International Conference on Machine Learning (ICML) http://arxiv.org/abs/1206.6439 (2012).
254. Fazayeli, F., Banerjee, A., Kattge, J., Schrodt, F. & Reich, P. B. Uncertainty quantified matrix completion using Bayesian Hierarchical Matrix Factorization in 13th International Conference on Machine Learning and Applications (ICMLA), http://dx.doi.org/10.1109/ICMLA.2014.56 (2014).
© 2016 Macmillan Publishers Limited. All rights reserved
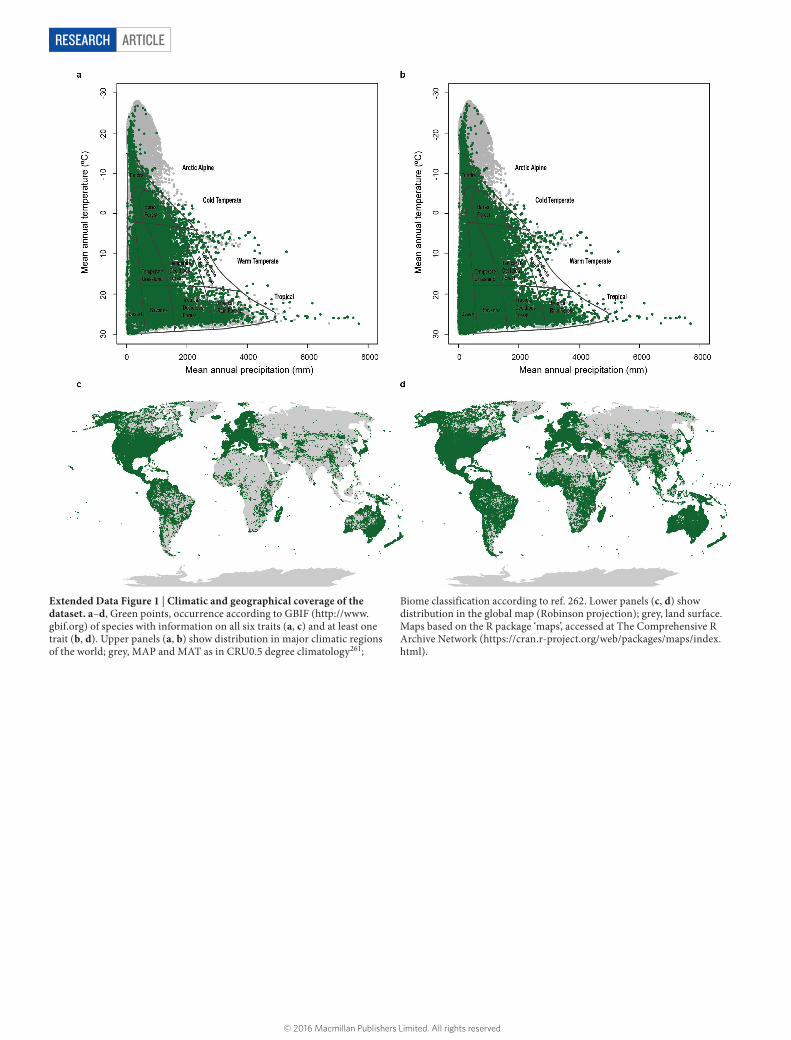
ArticlereSeArcH
Extended Data Figure 1 | Climatic and geographical coverage of the dataset. a–d, Green points, occurrence according to GBIF (http://www.gbif.org) of species with information on all six traits (a, c) and at least one trait (b, d). Upper panels (a, b) show distribution in major climatic regions of the world; grey, MAP and MAT as in CRU0.5 degree climatology261;
Biome classification according to ref. 262. Lower panels (c, d) show distribution in the global map (Robinson projection); grey, land surface. Maps based on the R package ‘maps’, accessed at The Comprehensive R Archive Network (https://cran.r-project.org/web/packages/maps/index.html).
© 2016 Macmillan Publishers Limited. All rights reserved

Article reSeArcH
Extended Data Figure 2 | Tests of the distribution of growth-forms (a) and major taxa (b) in trait space. Woody and non-woody species differed significantly in their positions along PC1 but not along PC2. Angiosperms differed significantly from gymnosperms and pteridophytes in their positions along both axes; gymnosperms and pteridophytes differed in their position along PC1 but not along PC2 (see Methods for details
of PCA analysis and a posteriori tests). Whiskers denote ± 3 s.d. from mean; n woody = 1,001; n non-woody = 1,209; n angiosperms = 2,120; n gymnosperms = 80; n pteridophytes = 14). Horizontal bars and dots within boxes indicate mean and median, respectively. Means with the same letter are not significantly different (Fisher’s least significant difference; P > 0.01).
© 2016 Macmillan Publishers Limited. All rights reserved

ArticlereSeArcH
Extended Data Figure 3 | Selected bivariate relationships underlying the global spectrum of plant form and function, showing herbaceous (green) and woody (black) species separately. See Extended Data Fig. 4 for standardized major axes statistics (slope, r2, sample size) of these and all other pairwise trait combinations.
Plant height (m)
Ste
m s
peci
fic d
ensi
ty (
mg
mm
−3)
10−2 10−1 1 101 102
0.1
0.3
1
a
non−woodywoody
Leaf area (mm2)
Leaf
mas
s pe
r ar
ea (
g m
−2)
101 103 105
101
102
103
b
Leaf area (mm2)
Leaf
nitr
ogen
con
tent
(m
g g−1
)
101 103 105
48
1632
64
c
Plant height (m)
Leaf
are
a (m
m2 )
10−2 10−1 1 101 102
101
103
105
d
Plant height (m)
Leaf
mas
s pe
r ar
ea (
g m
−2)
10−2 10−1 1 101 102
101
102
103
e
Plant height (m)
Dia
spor
e m
ass
(mg)
10−2 10−1 1 101 102
10−4
10−2
110
210
4
f
© 2016 Macmillan Publishers Limited. All rights reserved

Article reSeArcH
Extended Data Figure 4 | Bivariate relationships between the six traits that underlie the global spectrum of plant form and function. The lower left portion of the matrix shows two-dimensional probability density distributions of bivariate trait relationships derived through kernel density estimation (see Methods). The colour gradient indicates regions of highest (red) to lowest (white) occurrence probability of trait combinations with contour lines indicating 0.5, 0.95 and 0.99 quantiles. The upper right portion contains standardized major axis (SMA)263 statistics (slope, r2, sample size n, and statistical significance, NS, P > 0.05; *0.05 > P > 0.01; **0.01 > P > 0.001; ***P < 0.001 ) for the corresponding
relationships for all species (a), and for herbaceous (h) and woody species (w) separately. The diagonal displays the total sample sizes for each trait. For traits showing a strongly bimodal distribution, the all-species slope and correlation should be treated with caution. Pteridophytes show a discontinuous distribution in SM, but otherwise fall well within the general distribution of points; they represent less than 1% of the dataset, therefore including or excluding them does not significantly alter any of the relationships. SMAs were fitted using SMATR v.2 (http://www.bio.mq.edu.au/ecology/SMATR/).
© 2016 Macmillan Publishers Limited. All rights reserved

ArticlereSeArcH
extended Data Table 1 | Principal component analyses (PCAs) of global plant trait data
Eigenvalues and trait loadings of principal components (PC1 and PC2) in six different PCAs. Main analysis corresponds to the PCA performed on 2,214 species for which values of all six traits were available, and which is reported in the main text and expressed graphically in Fig. 2. The rest of the columns correspond to PCAs carried out on angiosperms only (2,120 species), on all taxa but excluding LMA, Nmass or SSD one at a time (2,214 in all cases), and on a gap-filled dataset of 45,507 species with missing trait records imputed using BHPMF (See Methods). The results of all PCAs show strong similarity, indicating robustness of the pattern obtained in the main analysis. Only PC1 and PC2 were identified as significant (see Methods) and therefore are reported here. All PCAs were performed on the correlation matrix of log10-transformed traits.
© 2016 Macmillan Publishers Limited. All rights reserved
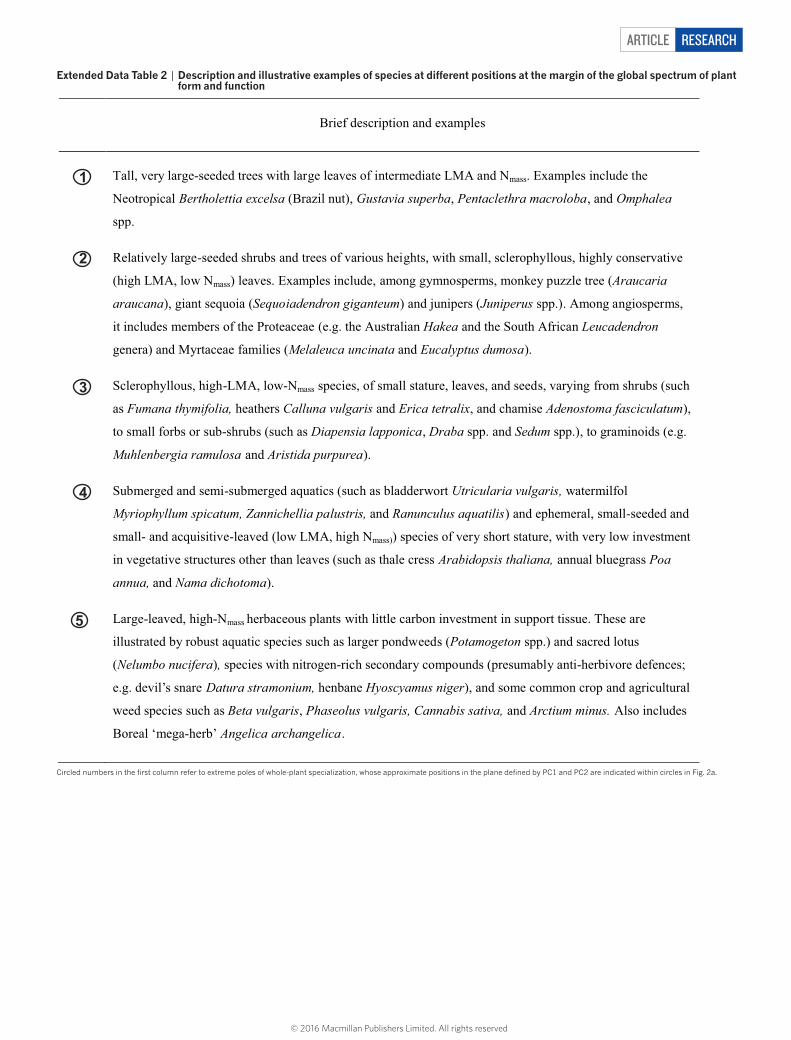
Article reSeArcH
extended Data Table 2 | Description and illustrative examples of species at different positions at the margin of the global spectrum of plant form and function
Circled numbers in the first column refer to extreme poles of whole-plant specialization, whose approximate positions in the plane defined by PC1 and PC2 are indicated within circles in Fig. 2a.
Brief description and examples
1 Tall, very large-seeded trees with large leaves of intermediate LMA and Nmass. Examples include the
Neotropical Bertholettia excelsa (Brazil nut), Gustavia superba, Pentaclethra macroloba, and Omphalea
spp.
2 Relatively large-seeded shrubs and trees of various heights, with small, sclerophyllous, highly conservative
(high LMA, low Nmass) leaves. Examples include, among gymnosperms, monkey puzzle tree (Araucaria
araucana), giant sequoia (Sequoiadendron giganteum) and junipers (Juniperus spp.). Among angiosperms,
it includes members of the Proteaceae (e.g. the Australian Hakea and the South African Leucadendron
genera) and Myrtaceae families (Melaleuca uncinata and Eucalyptus dumosa).
3 Sclerophyllous, high-LMA, low-Nmass species, of small stature, leaves, and seeds, varying from shrubs (such
as Fumana thymifolia, heathers Calluna vulgaris and Erica tetralix, and chamise Adenostoma fasciculatum),
to small forbs or sub-shrubs (such as Diapensia lapponica, Draba spp. and Sedum spp.), to graminoids (e.g.
Muhlenbergia ramulosa and Aristida purpurea).
4 Submerged and semi-submerged aquatics (such as bladderwort Utricularia vulgaris, watermilfol
Myriophyllum spicatum, Zannichellia palustris, and Ranunculus aquatilis) and ephemeral, small-seeded and
small- and acquisitive-leaved (low LMA, high Nmass)) species of very short stature, with very low investment
in vegetative structures other than leaves (such as thale cress Arabidopsis thaliana, annual bluegrass Poa
annua, and Nama dichotoma).
5 Large-leaved, high-Nmass herbaceous plants with little carbon investment in support tissue. These are
illustrated by robust aquatic species such as larger pondweeds (Potamogeton spp.) and sacred lotus
(Nelumbo nucifera), species with nitrogen-rich secondary compounds (presumably anti-herbivore defences;
e.g. devil’s snare Datura stramonium, henbane Hyoscyamus niger), and some common crop and agricultural
weed species such as Beta vulgaris, Phaseolus vulgaris, Cannabis sativa, and Arctium minus. Also includes
Boreal ‘mega-herb’ Angelica archangelica.
© 2016 Macmillan Publishers Limited. All rights reserved