the gmo experience in north and south america · 2009-12-18 · the gmo experience in north and...
TRANSCRIPT
46 Int. J. Technology and Globalisation, Vol. 2, Nos. 1/2, 2006
Copyright © 2006 Inderscience Enterprises Ltd.
The GMO experience in North and South America
Greg Traxler Department of Agricultural Economics and Rural Sociology, Auburn University, AL 36849, USA E-mail: [email protected]
Abstract: This paper surveys the level and distribution of economic impacts of GMOs in the Americas from 1996–2004. Key institutional factors influencing GMO diffusion are discussed. In 2004 the Americas accounted for 94%, of world GMO area. Diffusion has been concentrated; four countries, four crops and two traits account for the vast majority of area. The economic benefits of the diffusion of GMOs have been widely shared among farmers, industry, and consumers even though delivery has been through the private sector. GMOs have had a favourable environmental impact by facilitating reduced pesticide use and adoption of conservation tillage.
Keywords: biotechnology; Latin America; impacts.
Reference to this paper should be made as follows: Traxler, G. (2006) ‘The GMO experience in North and South America’, Int. J. Technology and Globalisation, Vol. 2, Nos. 1/2, pp.46–64.
Biographical notes: Greg Traxler is Professor of agricultural economics at Auburn University in Alabama. He received his PhD from Iowa State University. His research interests include the effects of technological change in agriculture in developed and developing countries, the impact of biotechnology research, the valuation of genetic plant resources and the distribution of benefits from patented crop varieties. He has completed studies of the diffusion and impact of Bt cotton in the USA and in Mexico and of RR soybean in the USA and Argentina. He has worked on projects for FAO, Inter-American Development Bank, CGIAR, The World Bank, and CIMMYT.
1 Introduction
More than 78 million ha were planted to genetically modified organisms (GMOs) in North and South America (Nsam) in 2004. The region includes the world’s top four GMO growing countries (USA, Argentina, Canada, and Brazil) and accounts for 94% of the world’s transgenic crop area (James, 2004). This concentration of area in North and South America is largely explained by the focus of the transnational developers of GMOs on the huge US market and countries with similar climates and with existing business ties. Virtually 100% of world GMO areas are planted to varieties of maize, soybeans, canola or cotton that is herbicide tolerant, that contain a Bt gene for insect resistance, or that contain both events. All types of GMOs currently being used were introduced in the Americas before spreading to other areas of the world.

The GMO experience in North and South America 47
There have been many obstacles to the diffusion of GMOs. A significant anit-GMO sentiment has slowed delivery of GMOs in Brazil, Mexico and other countries. Establishing the appropriate scientific infrastructure, developing additional human resources, conflicts over property rights and difficulties in establishing biosafety laws and regulations have been common challenges for all countries of the hemisphere. Nonetheless, the diffusion of GMO technology has been rapid when compared to nearly any previous agricultural innovation. But this exists alongside the fact that many scientific and industry observers have been disappointed by the limited geographic reach and product line scope of biotechnology.
The USA and Canada have led in the development, testing and regulatory approval of GMOs. Brazil and Mexico have significant public sector biotechnology research capacity as well. By 2005, the USA had approved for commercialisation 68 different events appearing in 14 different crops, and Canada had approved 48 events (Table 1). Fourteen NSAm countries had held GMO field trials and eight have commercialised GMO crops. The development of the successful GMOs has been financed by the private sector, but with significant public sector support in Canada, USA, Mexico, Brazil and Argentina (Table 2). All GMOs grown commercially are products developed for US or Canadian markets and have spilled over for use in other countries.
This paper reviews the use of GMOs in the Americas. Other recent papers have reviewed studies of farm level benefits, without mention of the distribution of benefits (Brookes and Barfoot, 2005), or of impacts in all developing countries (Qaim and Matuschke, 2005). Here we present evidence on how economic benefits have been shared among industry, farmers, and consumers in North and South America. Some data on the effect of GMO adoption on pesticide use will also be presented. The focus will be on the availability and use of GMO technology. Using this information, some of the key challenges for the expansion of biotechnology in the region will be discussed.
Table 1 Number of GMO events receiving regulatory approval and GMO cropped area, by country, through September 2005
Country Number of
events approved
Number of different crops with approvals
GMO area (1000 ha)
Crops planted commercially
USA 68 14 47,600 Cotton, soy, maize, canola Canada 48 13 5,400 Soy, maize, canola Argentina 9 3 16,200 Cotton, soy, maize, Mexico 8 2 100 Cotton, soy Brazil 2 2 5,000 Soy Colombia 1 1 5 Cotton Uruguay 2 2 300 Soy, maize Honduras 1 1 0.5 Maize Paraguay 0 0 1,200 Soy
Source: James (2004), National biosafety committees, AGBIOS (2005)

48 G. Traxler
Table 2 GMO field trials by type of institution, through 2000
Argentina Brazil Mexico USA No. Percentage No. Percentage No. Percentage No. Percentage
Multinational firms 247 78 77 52 193 87 4,836 73 Smaller firms 55 17 41 28 9 4 1,117 17 Public sector 14 4 29 20 20 9 648 10
Source: Trigo et al. (2002)
2 GMO use in the USA
2.1 Insect resistant cotton in the USA, Mexico and Argentina
Transgenic Bt cotton was first grown in the USA and Mexico in 1996 and has subsequently been introduced in Argentina, Australia, South Africa, China, Indonesia, Colombia and India. The first cotton varieties containing a Bt gene were introduced commercially through a licensing agreement between the gene discoverer, Monsanto, and the leading cotton germplasm firm in the USA, Delta and Pine Land Company (D&PL). Some of the same US varieties were subsequently introduced in other countries. Herbicide tolerant (HT) varieties were also introduced in the USA in 1996, and ‘stacked’ containing both the Bt and the HT events, appeared in 1998. Herbicide tolerant and stacked cotton varieties containing both have not been adopted in significant areas in any other NSAm country. In the first year of commercial availability in the US, BollgardTM cotton was planted on 850,000 ha or 15% of the total cotton area. By 2003, approximately 3.8 million ha or 73% of US cotton area was planted to GMO cotton varieties (USDA). This is distributed as 730,000 ha of Bt cotton, 1.7 million ha of RoundupReady (RR) cotton, and 1.4 million ha of stacked (Bt + RR) cotton varieties.
Bt cotton is not a solution for all pest control problems, so adoption has varied greatly across growing regions in the USA, Mexico, and other countries, depending on the availability of suitable varieties and most importantly, depending on the particular combination of pest control problems. In both the US and Mexico, BollgardTM cotton varieties have been rapidly accepted by farmers in areas where Budworm-Bollworm Complex (BBWC) is the primary pest problem, particularly when resistance to chemical pesticides is high. When boll weevils or other pest populations are high, farmers achieve coincidental control of the BBWC with the use of broad-spectrum chemicals, or pesticide mixtures, reducing the value of Bt control. In the USA, adoption has been slowest in California and Texas where suitable Bt varieties have not been available and most rapid in states where chemical pesticide resistance has been most pronounced. Patterns of infestation levels and economic losses also vary widely across the main growing regions in Mexico and have been important determinants of adoption of Bt cotton there (Table 3). Bt cotton adoption has been low and restricted to large-scale farmers in Argentina due to the large price premium charged for transgenic seeds (Qaim et al., 2003).

The GMO experience in North and South America 49
Table 3 Adoption of Bt cotton and geographic distribution of pest problems in Mexico’s major cotton areas
2.1.1 Farm and aggregate economic impacts of Bt cotton
There is great annual and geographic fluctuation in estimates of the actual yield performance difference between Bt and conventional cotton. Insect infestations vary widely across time and space, and the relative performance of Bt cotton is highest when pest pressure is heaviest.

50 G. Traxler
Field level studies of the performance of Bt cotton have been completed in the USA (Falck-Zepeda et al., 2000a, 2000b, 2000c), Mexico (Traxler et al., 2003), Argentina (Qaim and de Janvry, 2003), Australia (Fitt, 2003), South Africa (Ismael et al., 2001), China (Pray et al., 2002), and India (Qaim and Zilberman, 2003). In all three NSAm countries, Bt cotton varieties had higher effective yields, were more profitable, and saved on pesticide expenditures. Several studies have estimated the aggregate impact and the functional distribution of benefits from the introduction of transgenic varieties on benefits to producers, consumers and industry (Frisvold et al., 2000; Falck-Zepeda et al., 2000b; Price et al., 2003). These studies use estimates of the farm level cost savings and model world cotton supply and demand within an economic framework to calculate benefits. This framework takes account of the fact that, as the new technology reduces the cost of production, farmers may expand supply and that as prices drop, consumers may demand slightly more cotton. These price changes affect the level of calculated benefits. Part of the motivation for these studies has been that, except for a few varieties in China, the Bt cotton transgenics have all been patented private sector innovations. Patent holders may hold some monopoly power over pricing of their innovation. Certainly, the price of transgenic seed has been higher than that of seed of conventional varieties, and technology fees are charged on top of such high prices for GM seeds. Does this mean that the marketing firms are extracting all of the benefits generated by the innovation? This is an unlikely outcome because farmers must be receiving some benefits, or they would not choose to adopt. It will generally be true that an innovator will only be able to extract part of the economic benefits created through their research effort. There will always be benefit ‘spillovers’ to be enjoyed by other members of society. The empirical studies mentioned above have found that the benefits from biotechnology innovations have been widely shared among consumers, producers and industry (Figures 1 and 2).
Figure 1 Bt cotton benefit distribution, China, Argentina, and Mexico
aIndustry revenue (i.e., administrative and marketing costs not deducted). b1999. cAverage for 1997 and 1998 seasons. dAvergate for 1996, 1998 seasons.
Source: bPray et al. (2002), cTraxler et al. (2003) and eQaim and deJanury (2003)
The GMO experience in North and South America 51
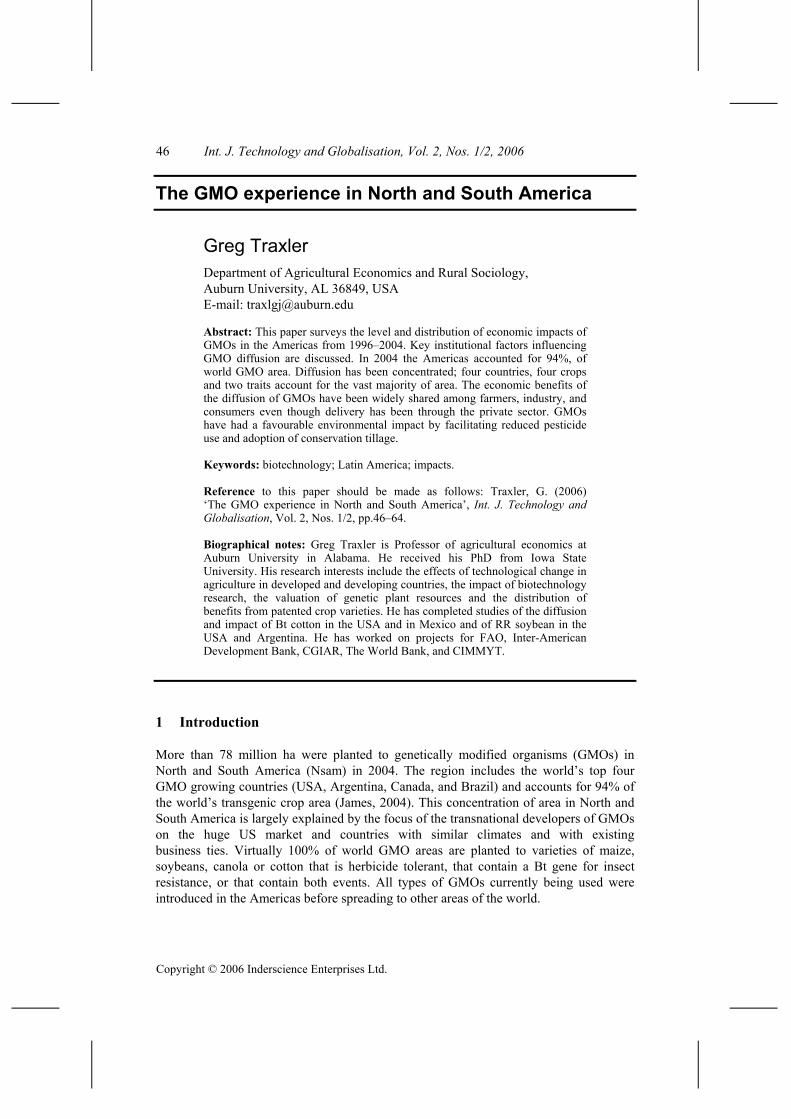
Figure 2 Benefits from introduction of Bt cotton in the USA
Falck-Zepeda et al. (2000a, 2000b, 2000c) calculate the annual distribution of benefits among cotton producers, consumers and germplasm suppliers from the introduction of Bt cotton in the USA for the 1996–1998 period using a standard economic surplus model (Alston et al., 1995). The estimated amount and distribution of benefits from the introduction of Bt cotton fluctuates from year to year, but total annual benefits created averaged approximately $215 million during 1996–1998 (Figure 2). The average benefit shares were 45% to US farmers, 36% to germplasm suppliers and 19% to cotton consumers. Frisvold et al. (2000) use different modelling assumptions1 to calculate aggregate welfare changes from the introduction of Bt cotton in the same period. They estimate a smaller amount of average total benefits ($181 million), and a smaller share of benefits to US farmers (20%) and more to US consumers (27%). The share of benefits to industry is estimated at 38%. Price et al. calculate benefits for 1997 using two different model specifications. Their average total benefit estimate was $257 million, with 34% going to farmers, 30% to industry, and 36% to consumers.
The average benefit shares from the introduction of Bt cotton in the Comarca Lagunera region of Mexico2 were 16% for germplasm suppliers and 84% for farmers (Traxler et al., 2003). Consumer benefits were assumed to be zero because Mexico’s small cotton area would not influence the world cotton price. The per hectares change in variable profit accruing to farmers varied widely between the two years, with an average figure of $335. Therefore, for the two years, an estimated total of more than $6 million in benefits was produced. In this calculation as in the welfare calculations for the USA, not the entire amount attributed to Monsanto is truly a net benefit, because costs such as seed distributor compensation, administrative and marketing costs were not accounted for. The $1.5 million revenue from seed sales is not a large sum for a company such as Monsanto with $5.49 billion in annual revenue. The large annual fluctuations are largely caused by variability in pest infestation levels – in years of heavy pest pressure, Bt cotton produces a large advantage over conventional cotton varieties. Because Mexico grows a small share of the world’s cotton, there was no effect on consumers’ benefits.
Qaim and de Janvry find a much different distribution of benefits from Bt cotton in Argentina. They estimated that 79% of benefits went to industry and 21% to farmers. They attribute the small share of benefits accruing to farmers to the high price and slow adoption of Bt cotton seed in Argentina. They suggest that Monsanto would have increased profit through if they had introduced Bt cotton at a lower price in Argentina even though this would have lowered the benefit share to Monsanto.
52 G. Traxler
Bt cotton impacts have been studied more than RR cotton, even though the RR gene is grown over a larger area. The studies that have appeared support the conclusion that RR cotton varieties reduce pesticide costs and lead to higher per acre profit. (Marra et al., 2003; Fernandez-Cornejo et al., 2003). Price et al. estimate total benefits at $231.8 million in 1997. US farmers received 20.0% of benefits, industry 68%, and consumers – 12%.
2.1.2 Effect of Bt cotton on use of chemical pesticides
Bt insect resistance is a highly selective pesticide, controlling only several lepidoptera species, and not harming other instects. Bt cotton is totally or highly effective in controlling several lepidoptera species known as the budworm-bollworm complex (BBWC) – the pink bollworm (Pectinophora gossypiella), cotton bollworm (Helicoverpa zea) – and is partially effective in controlling tobacco budworm (Heliothis virescens) and fall armyworm (Spodoptera frugiperda). In many major cotton-growing areas, BBWC is a major or the major pest control problem, but pesticide use is also conditioned by the presence of other cotton pests such at boll weevil (see James, 2002). As a result, the effect of the introduction of Bt cotton on pesticide usage varies from region to region. In areas where BBWC is a major pest Bt varieties have contributed to a dramatic reduction in pesticide use.
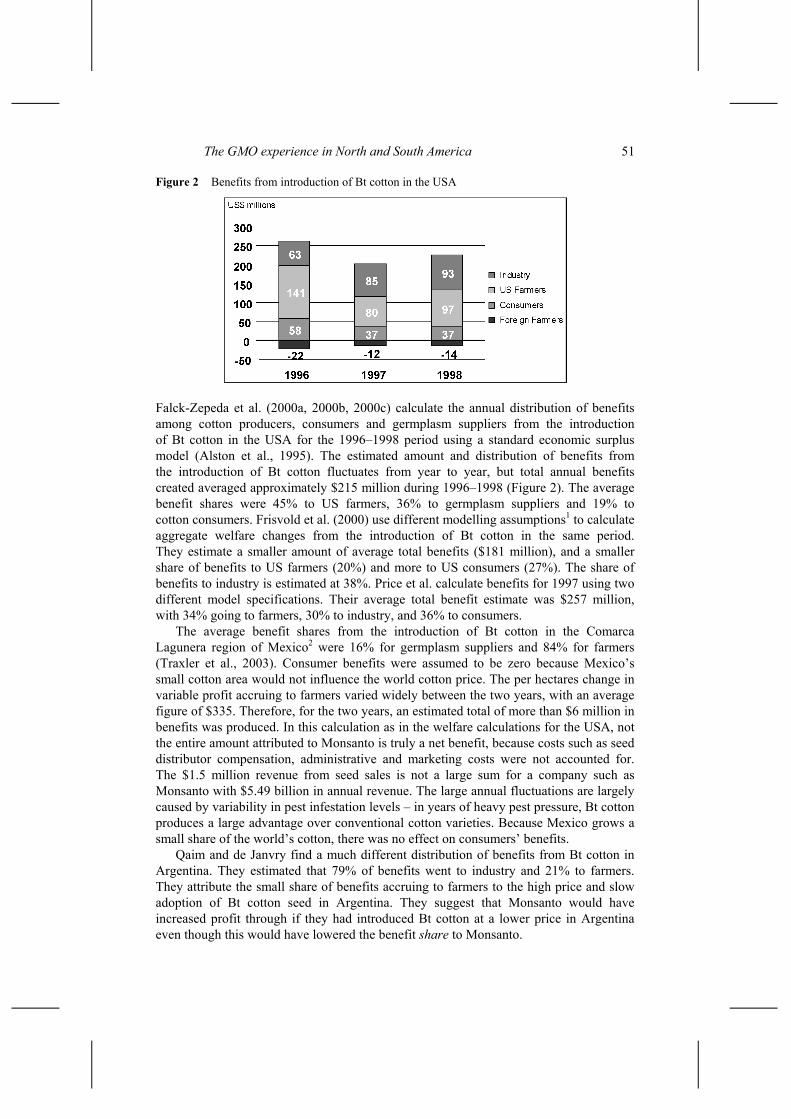
In the USA, the number of pesticide applications used against BBWC has fallen from 4.6 in 1992–1995 to 0.8 applications in 1999–2004 (Figure 3). Carpenter and Ginanessi (2001) estimate that the average annual reduction in use of pesticides on cotton in the USA has been approximately 1,000 tons of active ingredients. Pesticide use also declined in Mexico as Bt cotton use grew from 0 in 1995–1996 33% in 2000 (Table 4). A 50% reduction in insecticide use and a substitution away from highly toxic chemicals was also reported in Argentina (Qaim et al., 2003).
Figure 3 The number of pesticide applications for budworm-bollworm complex, selected US states, 1992–2001
Source: Williams (various years) Cotton Crop Loss Data. Accessed at http://www.msstate.edu/Entomology/Cotton.html

The GMO experience in North and South America 53
Table 4 Average number of insecticide applications targeted to principal cotton pests in the Comarca Lagunera, 1995–2000
Year Pink
bollworm Tobacco budworm Conchuela
Fall army worm White fly Totala
1995 3 2 0 1 1 6 1996 7 2 0.3 2 2 7.35 1997 1.5 2.5 2 1.5 0.4 5.1 1998 2.5 1.3 1 2.1 0.2 4.5 1999 0 0 2 1 1 3.5 2000 0 1 1.5 0.2 0 2
aTotals do not equal row sums because multiple pests are targeted in some applications. Source: Sánchez-Arellano (2000). Data from Plant Health Authority insecticide use records
2.2 Herbicide tolerant soybeans in the USA, Argentina and Paraguay
2.2.1 Adoption
RR soybeans were commercially released in the Argentina and the USA in 1996. The sale and use of RR technology is protected in the USA through patents and sales contracts with farmers, but neither form of intellectual property protection is used in Argentina. Thus in Argentina, RR soybeans are widely available from sources other than Monsanto, and Argentine farmers pay a relatively small price markup. Argentine farmers are legally allowed to use farm-saved seeds. The sale of pirated seed, including sales in Brazil and Paraguay is widespread. Adoption proceeded rapidly in both countries. By 2003, more than 95% of Argentine soybean area, and 80% of US area was cultivated with RR seeds. In addition, soybean area in Argentina has nearly doubled since the introduction of RR technology.
The first company to commercially release RR soybean varieties in Argentina was Nidera, the largest seed company in Argentina. Because Monsanto failed to obtain a patent for the RR technology in Argentina, Nidera obtained royalty-free access to Monsanto’s RR technology in the late 1980s (Qaim and Traxler, 2005). Nidera channelled the technology through the Argentine biosafety process and received commercial approval for several RR soybean varieties in 1996. Monsanto itself and other companies only followed in subsequent years. By 2001, there were seven companies providing over 50 different RR varieties in Argentina. Except for Nidera, these companies pay license fees to Monsanto. Thus, both Nidera and Monsanto capture some revenue from RR technology.
2.2.2 Farm and aggregate economic impacts of herbicide tolerant soybeans
Argentine farmers are not required to sign special purchase contracts, as used by Monsanto in the USA. This means that farmers are allowed to retain seeds from their harvest for future plantings. The national seed institute in Argentina, INASE, estimated that in 2001 farm-saved seeds accounted for 30% of all soybeans planted. Although sales of farm-saved and other uncertified materials are prohibited under national law, unauthorised sales are estimated to account for another 35% of total seed consumption.

54 G. Traxler
The remaining 35% are certified seeds sold by authorised seed companies. Weak intellectual property protection and the widespread use of farm-saved and black market seeds have placed downward price pressure in formal seed markets in Argentina. As a result, RR soybean seed can be purchased at a very small markup over the price of conventional seed. In January 2004 Monsanto announced that they were ceasing seed operations in the country due to the widespread sale of black market seed (Burke, 2003). If farmers in Argentina, Brazil and Paraguay were paying the same per ha royalty as US farmers, industry would be collecting nearly $200 million annually in technology fees from RR soybean technology.
Yields of RR soybeans are not significantly different from yields of conventional soybeans in either the USA or Argentina. The farm level benefits of RR soybeans are generated primarily through reduced herbicide, tillage and management costs. Many farmers switched to low-till or even no-till cultivation practices after adoption of RR soybeans and machinery and labour costs are also lower due to the reduced time needed for harvesting (Doanes Marketing Research, 2001; Qaim and Traxler, 2005). Due to the lower incidence of green weeds in RR plots, the combine harvester can be operated at higher speed without the danger of clogging.
In Argentina total variable cost of production is about 8% ($21 per ha) lower for RR soybeans than for a conventional crop. In the USA for 1996, Hubbell et al. (2000) reported cost savings between $17 per ha and $30 per ha for the USA as a whole. Moschini et al. (2000) estimated a cost advantage of $20 per ha for 2000. Gianessi et al. (2002) calculated RR cost advantages of $40 per ha for many US states, in some cases even higher than this. The different results do not suggest a clear pattern over time. Taking an average over all sources, it appears that cost savings in the USA are similar to those in Argentina, even though the prices for RR seeds and glyphosate are lower in Argentina than in the USA.
Welfare effects of the spread of RR soybeans in the USA have been analysed in a few studies (Price et al., 2003; Moschini et al., 2000; Falck-Zepeda et al., 2000c) but only Qaim and Traxler (2005) has explicitly modeled the diffusion of the technology in Argentina. Qaim and Traxler found that in 2001, RR soybeans created more than $1.2 billion, or about 4% of the value of the world soybean crop, in economic benefits at the global level. The largest share of these overall benefits went to soybean consumers, who gained $652 million due to lower prices. Soybean producers received net benefits of $158 million, and biotechnology and seed firms received $421 million as technology revenue.3 Soybean producers in countries where RR technology is not available faced losses of $291 million in 2001 due to the induced decline of about 2% ($4.06/mt) in world market prices. This underlines that national restrictions to GM technology access can bring about considerable taxation of the domestic farm sector. A case in point is Brazil, the second largest soybean producer in the world. RR soybeans have now received official approval for commercialisation in Brazil.4 According to industry estimates, farm level benefits in Brazil could be similar to those in Argentina (Paarlberg, 2001).
Farmers in Argentina and the USA had large welfare gains that increased as RR adoption increased. Argentine farmers were receiving surplus of more than $300 million by 2001 and US farmers received surplus of $145 million in 2001. Although the RR area in the USA is larger than in Argentina, net producer surplus has been larger in Argentina since 1999 because the share of adopting farmers in Argentina exceeds the share in the USA. For example, in 2001, more than 9.6 million hectares were still planted to

The GMO experience in North and South America 55
conventional soybeans in the USA, compared to only about 1 million ha in Argentina. This example clearly shows that, because of technology spillovers, producer benefits are not confined to the innovating country. Farmers in developing countries have much to gain when they are given access to suitable foreign technologies.
The average share of surplus going to producers over the 1996–2001 period was 14% (Table 5). About half the benefits went to consumers of soybeans, and about one third went to industry. These shares were stable through time, but the surplus distribution across countries shifted as diffusion accelerated in Argentina. The USA has clearly been the big winner from GMO soy, but its share of total surplus has fallen from 89% to 56%, as Argentina’s total share increased from a net loss in 1996 to 27% of total world benefits in 2001.
Table 5 Shares of total world surplus by area and functional group, 1996–2001
Argentina Producer Consumer Industry Share world total 1996 1% 0% 0% 4% 1997 5% 0% 1% 6% 1998 11% 0% 2% 13% 1999 17% 0% 2% 20% 2000 21% 1% 2% 24% 2001 25% 0% 2% 27% Avg 16% 0% 2% 18% USA 1996 40% 12% 37% 89% 1997 34% 12% 34% 80% 1998 27% 11% 34% 73% 1999 16% 12% 32% 60% 2000 12% 13% 32% 57% 2001 12% 12% 32% 56% Avg 24% 12% 34% 69% Rest of world 1996 –5 9 – 15% 1997 –46 75 – 14% 1998 –13 229 – 15% 1999 –187 354 – 20% 2000 –215 388 – 18% 2001 –291 498 – 17% Average world total 16% 1996 16% 47% 37% 100% 1997 16% 49% 35% 100% 1998 15% 49% 36% 100% 1999 11% 54% 34% 100% 2000 11% 54% 35% 100% 2001 13% 53% 34% 100% Avg 14% 51% 35% 100%
Source: Qaim and Traxler (2005)

56 G. Traxler
Monopoly rents for private firms in the USA are sizable. On the other hand, because of weak intellectual property protection in Argentina, technology revenues there are much smaller, accounting for just 8% of the total Argentine surplus (2% of total world surplus). Falling prices for RR seeds and a growing informal market will further reduce this revenue stream over time.5 However, these results also show that private firms will gain something from their innovations even without effective patent protection. Given the big market size, Argentina will remain interesting for foreign seed companies, even though intellectual property protection is weaker than in the USA.
2.2.3 RR soybeans: environmental effects
RR soybeans change the use patterns of tillage and chemical herbicide use. Glyphosate substitutes for a number of other products, with the result that per hectare herbicide expenditures decline. Table 6 shows that in Argentina the average number of herbicide applications slightly increases, while herbicide amounts used per hectare more than double. In the USA, the use of RR soybeans has been reported to lead to a decrease in the number of applications, with aggregate herbicide amounts more or less unaffected (Fernandez-Cornejo and McBride, 2000; Doanes Marketing Research, 2001).
Table 6 Herbicide use effects of RR soybean adoption in Argentina
Conventional
soybeans (n = 59) RR soybeans
(n = 59) Percent
difference Number of herbicide applications 1.97 2.30 16.8 Total amount of herbicides (l/ha) 2.68 5.57 107.8
Herbicides in toxicity class II (l/ha) 0.42 0.07 –83.3 Herbicides in toxicity class III (l/ha) 0.68 0.00 –100.0 Herbicides in toxicity class U (l/ha) 1.58 5.50 248.1
Share of farmers using no-till practices 0.42 0.80 90.5 Number of tillage passes per plot 1.66 0.69 –58.4 Machinery time (h/ha) 2.52 2.02 –19.8 Fuel (l/ha) 53.03 43.70 –17.6
Source: Qaim and Traxler (2003)
Herbicides differ in their mode of action, duration of residual activity, and toxicity, so an increase in total herbicide amounts does not inevitably entail negative environmental effects. Glyphosate essentially has no residual activity and is rapidly decomposed to organic components by microorganisms in the soil. According to the international classification of pesticides, glyphosate belongs to toxicity class U, “active ingredients unlikely to present acute hazard in normal use” (WHO, 1988). As Table 6 shows, adoption of RR soybeans led to an almost complete abandonment of herbicides belonging to toxicity classes II and III. There are no other herbicides used in soybeans which belong to toxicity class I. Consequently, RR technology has led to an increase in the use of a relatively harmless herbicide and a significant reduction in the use of more hazardous herbicides.

The GMO experience in North and South America 57
The major reason for the rise in the number of herbicide applications is the farmers’ conversion to no-till practices that require pre-seeding chemical weed control. Although RR soybeans were not the only factor for the rapid adoption of no-till practices in the second half of the 1990s, Table 6 suggests that they played an important role. Whereas only 42% of the farmers in our sample used no-till for conventional soybeans, 80% of them use this practice on their RR plots.6 The use of no-till is estimated to have increased from around 300,000 hectares in 1990–1991 to over 14 million hectares in the 2001–2002 season (Chudnovsky, 2005). No-till helps to preserve the soil texture and reduces the risk of wind and water erosion, with concomitant positive environmental effects. RR farmers who did not completely switch to no-till usually pursue a reduced-tillage system for soybeans. On average, the technology reduced the number of tillage operations by one passage per field. Overall, the number of machinery hours is reduced by 20%, and fuel savings are almost 10 litres per ha.
A survey of 452 farmers conducted in 2001 for the US Soybean Association (Doanes) found that the use of conservation tillage methods increased from 60% of farmers to 83% since the introduction of Roundup Ready soybean varieties in 1996. When farmers in the survey were asked what factor had the greatest impact toward the adoption of reduced tillage or no-tillage in soybeans during the past five years, 54% responded that it was the introduction of Roundup Ready soybeans (p.15). The next most important factor was mentioned by just 15% of respondents.
2.3 Transgenic maize and canola
Transgenic maize is grown in the USA (11.4 million ha), Canada (0.7 million ha), Argentina (1.1 million ha) and Honduras (500 ha). In the USA, 40% of maize area is in transgenics with 25% in Bt, 11% in RR and the remaining 4% in stacked varieties. It is difficult to calculate the benefits from Bt maize because of the extreme geographic variability in incidence of the European Corn Borer, and few farmers use chemical control. Carpenter and Gianessi estimate an aggregate net economic gain to US farmers of $28 million. In an ex-ante analysis for the year 2000 Alston et al. (2003) estimate a total gain of 86 million for US farmers and 51 million to industry.
Approximately 3.2 million ha of RR canola were grown in Canada in 2003, and another 0.4 million ha were grown in the USA (James). Philips (2003) estimates that the total benefits generated in 2000 were about $47 million accruing to producers, $93 million to industry, and $21 million to consumers. The shares to producers, industry and consumers are 29%, 57%, and 14%.
3 Value-enhanced GMOs
A second wave of genetically modified organisms (GMOs), referred to as value-enhanced crops (VEC) or product quality trait GMOs, includes those plant varieties that have one or more output characteristic modified, adding end user value to the commodity. VECs have the potential to provide momentum to the agricultural biotechnology industry and to enhance productivity worldwide (US Department of Agriculture Economic Research Service, 1999). Two VECs, high oleic soybeans and laurate canola, have been introduced commercially in the USA and are planted on approximately 100,000 ha (Penn, 2000). No VECs have been introduced in other Nsam countries. US biosafety trial data indicate

58 G. Traxler
a significant level of investment by industry in developing VEC GMOs. Between 1998 and 2005, product quality has accounted for 18% of all US trials. Industry interest peaked in the mid-1990s. In 1994 and 1995, more trials were conducted for product quality than for any other phenotype category. The diffusion of VEC GMOs has been hampered by the difficulty that industry has had in developing a business model that will provide sufficient incentives for farmers, the seed industry and grain merchandisers to coordinate their efforts (Jefferson-Moore and Traxler, 2005).
4 Biosafety, GMOs, and seed piracy in Brazil, Argentina and Paraguay
James estimates that in 2004, Paraguay planted 1.2 million ha of RR soybean and that Brazil planted 5 million ha. This is despite the fact that it was not until 2005 that the planting of RR soybeans for commercial use was approved in Brazil or Paraguay. Brazil has allowed by presidential decree the provisional harvest and marketing of RR soybean under ‘amnesty’ plans in 2003 and 2004, while Paraguay has allowed RR soybeans to be planted and marketed without any governmental acknowledgement of the existence of the GMO crop. Because biosafety approval came after the planting season had begun, GMO production in 2005 was still based on black market seeds originating in Argentina. Monsanto has arrived at an arrangement to collect royalties at point of sale in Brazil. Negotiations are underway in Argentina and Paraguay for similar arrangements. The institution of endpoint royalties has been controversial and it remains to be seen whether or not this will be an effective mechanism for stemming the sale of pirated seed and returning royalties to Monsanto and the seed companies.
The seed markets in Argentina, Brazil and Paraguay have undergone important changes since the introduction of GMO varieties. The delay in legalising the planting of RR soybean in Paraguay and Brazil has had a negative effect on the commercial market. The commercial market for seed firms dried up as farmers eager to plant RR varieties had no option other than to turn to the black market. The share of soybean area planted with certified seed has fallen from 60% in 1996–1997 to just 5% in 2004–2005 in Rio Grande do Sul. S Silveira and de Carvalho (2005). Figures are not available for seed markets in the other two countries, but black market seed sales dominate there as well. An important question for the future delivery of GMO varieties is whether the system in place to collect royalties will provide an adequate incentive for private sector investment in the development and delivery of improved GMO varieties.
5 Where to from here
This paper has reviewed the experience with the use of transgenic crop varieties in North and South America. The transgenic crop introductions that have been evaluated have delivered large economic benefits to farmers, consumers and industry. The per hectare savings, particularly from Bt cotton, have been very large when compared with nearly any technological innovation introduced over the past few decades. Even though the transgenic crops have been delivered through the private, rather than the public sector, the benefits have been widely distributed among industry, farmers and final consumers. This suggests that the monopoly position engendered by intellectual property protection does not automatically lead to excessive industry profits. Evidence from

The GMO experience in North and South America 59
Argentina (Qaim and de Janvry, 2003) and Mexico (Traxler et al., 2003) suggest that small farmers have had no more difficulty than larger farmers in adopting the new technologies.
The environmental effects of transgenic crops have been strongly positive to date. In virtually all instances insecticide use on Bt cotton is significantly lower than on conventional varieties and glyphosate has been substituted for more toxic and persistent herbicides in RR soybeans, canola, cotton and maize. Furthermore, an increase in the use of reduced tillage has accompanied RR soybeans and cotton. Negative environmental consequences have not been documented in any setting where transgenic crops have been deployed to date. Nonetheless, the long term environmental concerns deserve continued monitoring because of the newness and the novel nature of genetic transformation technology. The main concerns voiced are whether insect resistance to the Bt gene will develop, and whether gene flow to landraces and to related plant species will have a negative effect on biodiversity or to problems controlling noxious weeds.
The use of GMOs has delivered large benefits to many farmers in the NSam region, but one of the most striking aspects of the experience has been the concentration of GMO use to two traits and four major commercial crops in a few countries. Bt cotton and RR soybeans have been deployed to most of the main growing areas in Nsam. Bt maize and RR varieties of maize and cotton however have been limited to the USA, Canada and Argentina. And no commercial GMO applications developed specifically to address problems of tropical agriculture here have yet appeared. The delivery of GMOs has also been concentrated in the hands of a few providers. All GMOs have been based on genetic events that are the property of multinational corporations. Many important policy questions will have to be addressed over the coming years if the benefits of biotechnology are to reach small farmers and growers of minor crops (Pingali and Traxler, 2002).
At present all GMOs in use are the result of technology spillovers from the US commercial seed market. With the exception of a few events in China, all GMOs grown commercially anywhere in the world are derived from events developed for US or Canadian markets. The private sector agricultural biotechnology investments of the past 25 years were made with the one of these markets in mind.7 NSam contains five of the 14 largest seed markets (Table 7). The combined seed market in these countries is more than $9 billion. NSam countries have also been ahead of countries in other regions to put biosafety committees in place. Four of the first five countries to approve events for commercialisation are located in NSam (USA, Canada, Mexico and Argentina), followed by Brazil in 1998. This reflects both the presence of public sector scientific capacity to perform the biosafety assessment, and a degree of political and social willingness to accept biotechnology – factors that many countries still struggle with. The many small countries of the hemisphere are severely disadvantaged with respect to their ability to attract investments in their seed markets, and with marshalling the scientific talent needed to staff a national biosafety committee.
The factors that have not been important are as interesting to consider as the factors that have been important. With the exception of canola in Canada, public sector scientific discoveries were not a part of the technology development phase of GMOs. Public sector scientific contributions occurred far upstream, or were missing altogether. Paraguay is a striking example. In 2005 it had the sixth largest GMO area in the world, yet it has no biotechnology research capacity. Secondly, GMO use in Brazil, Paraguay, and Argentina has occurred with limited or no ability to protect the intellectual property of technology

60 G. Traxler
developers. However, it must be recognised that Argentina, Brazil (and Mexico) are making intense efforts to improve national scientific capacity and intellectual property protection. It seems likely that while in the short run technology can be accessed without these two capacities, future use of GMOs will be limited without progress in these areas.
Table 7 Estimated size of the domestic market for seed and other planting material of selected countries (in USD million)
Country Sales USA 5,700 China 3,000 Japan –2,500 France 1,930 Brazil 1,500 Germany 1,000 India 1000 Argentina 930 Italy 780 Canada 550 Russian Fed 500 Korea 400 Australia 400 Mexico 350 Taiwan 300 Spain 300 Poland 260 Czech 200 UK 257 Turkey 250 Netherlands 208 South Africa 217 Hungary 200 Denmark 170 Austria 170 Morocco 160 Sweden 155 Greece 140 Egypt 140 Belgium 130 Chile 120 Serbia&Mtngro 120 Nigeria 120 Finland 103
The GMO experience in North and South America 61
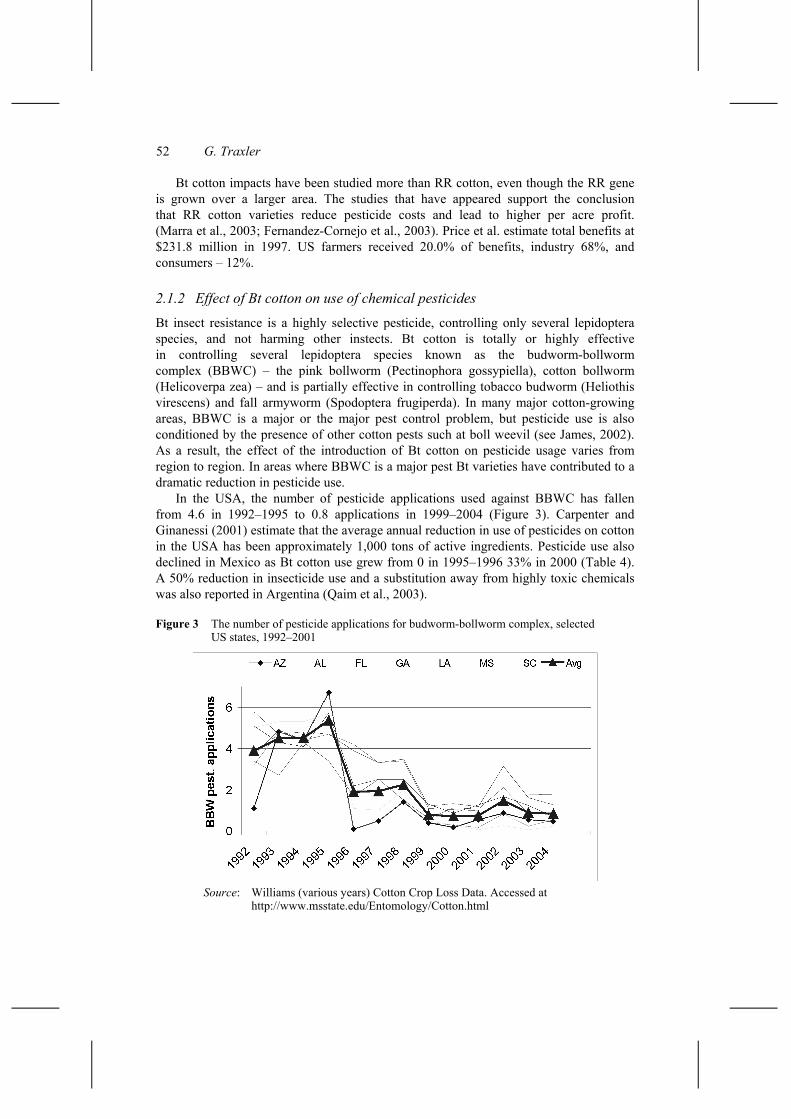
Table 7 Estimated size of the domestic market for seed and other planting material of selected countries (in USD million) (continued)
Country Sales
New Zealand 90 Slovakia 90 Switzerland 80 Paraguay 70 Tunisia 70 Uruguay 70 Bangladesh 60 Portugal 60 Ireland 60 Israel 50 Kenya 50 Colombia 40 Bolivia 35 Zimbabwe 30 Peru 30 Slovenia 30 Saudi Arabia 18 Zambia 15 Ecuador 12 Malawi 10 Dominican Rep 7 Uganda 6 25,243*
*This total represents the sum of the commercial seed markets of the listed countries. The commercial world seed market is assessed at approximately US$ 30 billion.
Source: International Seed Federation (2005)
GMO diffusion has been anything but predictable so far. A decade ago, few would have foreseen that there would be just two commercially successful GMO traits in 2005. Research is underway to improve food maize, wheat, rice, tubers and many vegetable crops. Biotechnology holds immense potential to address many of the most difficult production problems that plague the region’s farmers. However it must be realised that it has been ten years since the first transgenic crops appeared, and there are still only two novel traits (Bt insect resistance and herbicide tolerance) that have had important effects on world food production, and the effect on developing country agriculture has been minor. While the science of biotechnology is advancing rapidly, the institutional capacity to deliver biotechnology faces significant challenges.

62 G. Traxler
References AGBIOS GM Crop Database (2005) http://www.agbios.com/main.php, accessed September 28. Alston, J.M., Hyde, J., Marra, M.C. and Mitchell, P.D. (2003) ‘An ex ante analysis of the benefits
from the adoption of corn rootworm resistant transgenic corn technology’, AgBioForum, Vol. 5, No. 3, pp.71–84, Available on the World Wide Web: http://www.agbioforum.org.
Alston, J.M., Norton, G.W. and Pardey, P.G. (1995) Science Under Scarcity: Principles and Practice for Agricultural Research Evaluation and Priority Setting, Cornell University Press, Ithaca NY.
Brookes, G. and Barfoot, P. (2005) ‘GM crops: the global economic and environmental impact – the first nine years 1996–2004’, AgBioForum, Vol. 8, Nos. 2–3, pp.187–196.
Burke, H. (2003) Monsanto Exits Argentina Soy Biz Despite Soy Boom Reuters, January 18. Carpenter, J.E. and Gianessi, L.P. (2001) Agricultural Biotechnology: Updated Benefits Estimates,
National Center for Food and Agricultural Policy, Washington DC. Chudnovsky, D. (2005) The Diffusion of Biotech Crops in the Argentine Agriculture Sector, Paper
presented at the workdshop Socio-Economic Issues in Agricultural Biotechnology in Developing Countries, Bellagio, Italy, May 31–June 2.
da Silveira, J.M.F.J. and de Carvalho Borges, I. (2005) An Overview of the Current State of Agricultural Biotechnology in Brazil, Paper presented at the workdshop Socio-Economic Issues in Agricultural Biotechnology in Developing Countries, Bellagio, Italy, May 31–June 2.
Doanes Marketing Research (2001) Conservation Tillage Study The American Soybean Association, St Louis. Accessed at http://www.soygrowers.com/ctstudy/.
Falck-Zepeda, J.B., Traxler, G. and Nelson, R.G. (2000a) Rent Creation and Distribution from the First Three Years of Planting Bt Cotton, ISAAA Briefs No. 14. International Service for the Acquisition of Agri-biotech Applications, Ithaca NY.
Falck-Zepeda, J.B., Traxler, G. and Nelson, R.G. (2000b) ‘Surplus distribution from the introduction of a biotechnology innovation’, American Journal of Agricultural Economics, Vol. 82, No. 2, pp.360–69.
Falck-Zepeda, J.B., Traxler, G. and Nelson, R.G. (2000c) ‘Rent creation and distribution from biotechnology innovations: the case of Bt cotton and herbicide-tolerant soybeans in 1997’, Agribusiness, Vol. 16, No. 1, pp.21–32.
Fernandez-Cornejo, J. and McBride, W.D. (2000) Genetically Engineered Crops for Pest Management in US Agriculture: Farm Level Effects, AER No. 786, Economic Research Service, US Department of Agriculture.
Fernandez-Cornejo, J., Klotz-Ingram, C., Heimlich, R., Soule, M., McBride, W. and Jans, S. (2003) ‘Economic and environmental impacts of herbicide tolerant and insect resistant crops in the United States’, in Kalaitzandonakes, N. (Ed.): Economic and Environmental Impacts of First Generation Biotechnologies, Kluwer Academic, New York.
Fitt, G.P. (2003) ‘Deployment and impact of Bt cottons in Australia’, in Kalaitzandonakes, N. (Ed.): The Economic and Environmental Impacts of Agbiotech: A Global Perspective, Kluwer Academic Press/Plenum Publications, New York.
Frisvold, G., Tronstad, R. and Mortensen, J. (2000) Effects of Bt Cotton Adoption: Regional Differences and Commodity Program Effects, Paper presented at the Western Agricultural Economics Association Meeting, Vancouver, Canada, June 30.
Gianessi, L.P., Silvers, C.S., Sankula, S. and Carpenter, J.E. (2002) ‘Plant biotechnology: current and potential impact for improving pest management in US agriculture; an analysis of 40 case studies’, National Center for Food and Agricultural Policy, Washington DC.
Hubbell, B.J., Marra, M.C. and Carlson, G.A. (2000) ‘Estimating the demand for a new technology: Bt cotton and insecticide policies’, American Journal of Agricultural Economics, Vol. 82, pp.118–132.
International Seed Federation (2005) Accessed 1 October, at http://www.worldseed.org/ statistics.htm.

The GMO experience in North and South America 63
Ismael, Y., Bennett, R. and Morse, S. (2001) Farm Level Impact of Bt Cotton in South Africa. Biotechnology and Development Monitor, No. 48, pp.15–19.
James, C. (2002) ‘Global review of commercialized transgenic crops: 2001 feature: Bt cotton’, International Service for the Acquisition of Agri-biotech Applications, Ithaca NY.
James, C. (2004) Preview: Global Status of Commercialized Biotech/GM Crops: 2004, ISAAA Briefs No. 32-2004, ISAAA, Ithaca, NY.
Jefferson-Moore, K.Y. and Traxler, G. (2005) ‘Second generation GMOs – where to from here?’, AgBioForum, Vol. 8, pp.143–150.
Marra, M., Pardey, P. and Alston, J. (2003) ‘The payoffs to transgenic field crops: an assessment of the evidence’, AgBioForum, Vol. 5, No. 2, pp.43–50, Available on the World Wide Web: http://www.agbioforum.org.
Moschini, G., Lapan, H. and Sobolevsky, A. (2000) ‘Roundup ready® soybeans and welfare effects in the soybean complex’, Agribusiness, Vol. 16, pp.33–55.
Paarlberg, R.L. (2001) The Politics of Precaution: Genetically Modified Crops in Developing Countries, Johns Hopkins University Press, Baltimore.
Penn, J.B. (2000) ‘Biotechnology in the pipeline: Sparks companies’ update’, Proceedings of the 2000 Beltwide Cotton Conference, National Cotton Council, Memphis, TN.
Philips, P.W.B. (2003) ‘The economic impact of herbicide tolerant canola in Canada’, in Kalaitzandonakes, N. (Ed.): Economic and Environmental Impacts of First Generation Biotechnologies, Kluwer Academic, New York.
Pingali, P.L. and Traxler, G. (2002) ‘The changing locus of agricultural research: will the poor benefit from biotechnology and privatization trends?’, Food Policy, Vol. 27, pp.223–238.
Pray, C.E., Huang, J., Hu, R. and Rozelle, S. (2002) ‘Five years of Bt cotton in China – the benefits continue’, The Plant Journal, Vol. 31, No. 4, pp.423–430.
Price, G.K., Lin, W., Falck-Zepeda, J.B. and Fernandez-Cornejo, J. (2003) Size and Distribution of Market Benefits from Adopting Biotech Crops, Economic Research Service/USDA Technical Bulletin No. (TB1906), November.
Qaim, M. and de Janvry, A. (2003) ‘Genetically modified crops, corporate pricing strategies, and farmers’ adoption: the case of Bt cotton in Argentina’, American Journal of Agricultural Economics, Vol. 85, No. 4, November, pp.814–828.
Qaim, M. and Matuschke, I. (2005) ‘Impacts of genetically modified crops in developing countries: a survey’, Quarterly Journal of International Agriculture, Vol. 44, No. 3, pp.207–227.
Qaim, M. and Traxler, G. (2005) ‘Roundup ready soybeans in Argentina: farm level, environmental, and welfare effect’, Agricultural Economics, Vol. 32, pp.73–86.
Qaim, M. and Zilberman, D. (2003) ‘Yield effects of genetically modified crops in developing countries’, Science, Vol. 299, February 7, pp.900–902.
Qaim, M., Cap, E.J. and de Janvry, A. (2003) ‘Agronomics and sustainability of transgenic cotton in Argentina’, AgBioForum, Vol. 6, Nos. 1–2, pp.41–47, Available on the World Wide Web: http://www.agbioforum.org.
Sánchez-Arellano, J. (2000) Situacion Actual de la Campaña Contra las Plagas del Algodonero en la Region Lagunera, Draft publication, Regional Plant Health Office, Torreón, Coahuila, Mexico.
Traxler, G., Godoy-Avila, S., Falck-Zepeda, J. and Espinoza-Arellano, J. (2003) ‘Transgenic cotton in Mexico: economic and environmental impacts’, in Kalaitzandonakes, N. (Ed.): Economic and Environmental Impacts of First Generation Biotechnologies, Kluwer Academic, New York, pp.183–202.
Trigo, E., Traxler, G., Pray, C. and Echeverría, R. (2002) Agricultural Biotechnology and Rural Development in Latin America and The Caribbean: Implications for IDB Lending, Technical Paper RUR-107, Sustainable Development Department, Inter-American Development Bank, Washington DC.

64 G. Traxler
US Department of Agriculture Economic Research Service (1999) ‘Value-enhanced crops: Biotechnology’s next stage’, Agricultural Outlook, March, Economic Research Service/USDA, Washington DC.
WHO (1988) The WHO Recommended Classification of Pesticides by Hazard and Guidelines to Classification, WHO Document VBC/88.953, World Health Organization, Geneva.
Williams, M. (various years) Cotton Crop Loss Data, Accessed at http://www.msstate.edu/ Entomology/Cotton.html.
Notes 1Frisvold et al. assumes nonlinear supply and demand curves and a pivoting shift in the supply curve, while Falck-Zepeda et al. assume linear supply and demand and a parallel supply shift. See Price et al. for a summary of the effect of modelling choices on benefit distribution for Bt cotton, or Alston et al. for a detailed presentation of each modelling framework.
2Surplus calculations were done only for the Comarca Lagunera region, rather than all of Mexico because of data availability
3As in the cotton studies, gross technology revenues are used as a measure of monopoly rent. No research, marketing, or administration costs are deducted. If we assume, for example, that these costs amount to 33% of technology fee revenues, the monopoly rent would fall to around $280 million (26% of total surplus).
4Moschini et al. (2000) show comparatively small producer surplus effects for South America in 2000. In their regional approach the gains for farmers in Argentina are offset by losses to Brazilian producers.
5For insect-resistant cotton in China, Pray et al. (2002) also reported relatively low and decreasing private-sector returns due to weak IP protection.
6RR technology has similarly increased adoption of reduced tillage and no-till in the USA (Doanes Marketing Research, 2001).
7Investments in canola research were focused on the Canadian market (Philips, 2003). The basic point holds that investments were motivated by the existence of a large, dynamic seed market.