the halal-based equity investments in kuwait€¦ · the halal-based equity investments in kuwait...
TRANSCRIPT

The Halal-Based Equity Investments in
Kuwait
Khaled Obaid Alotaibi
A Thesis Submitted to the University of Dundee in Fulfillment of the
Requirements for the Degree of Doctor of Philosophy
January 2014

ii
Table of Content
List of Tables .........................................................................................................................................vi
List of Figures ..................................................................................................................................... viii
List of Appendices .................................................................................................................................. x
Glossary of Arabic Terms Used ......................................................................................................... xii
Abbreviations ...................................................................................................................................... xiv
Acknowledgement ............................................................................................................................... xvi
Declaration........................................................................................................................................ xviii
Certificate ......................................................................................................................................... xviii
Abstract................................................................................................................................................ xix
Chapter 1: Introduction ......................................................................................................................... 1
1.1 Introduction .................................................................................................................................... 2
1.2 Background .................................................................................................................................... 3
1.3 Islamic Investment Guidelines ..................................................................................................... 10
1.4 Pure, Mixed and Sin Equity Investments ...................................................................................... 15
1.5 Thesis Structure ............................................................................................................................ 22
1.6 Summary ...................................................................................................................................... 25
Chapter 2: An overview of the Gulf Cooperation Council (GCC) Stock Markets and Islamic
Investment Industry ............................................................................................................................. 27
2.1 Introduction .................................................................................................................................. 28
2.2 An Overview of the Emerging GCC Stock Markets ..................................................................... 28
2.3 The Development of Kuwait Stock Exchange (KSE) ................................................................... 38
2.4 An Overview of Islamic Finance and Investment Industry in the GCC ........................................ 46
2.5 Summary ...................................................................................................................................... 57
Chapter 3: A Review of the Literature on Ethical and Islamic Funds ............................................. 59
3.1 Introduction .................................................................................................................................. 60
3.2 An Overview of Modern Portfolio Theory ................................................................................... 61
3.3 Background to Ethical and Faith-Based Investments ................................................................... 64
3.4 Non-Islamic Ethical Equity Investments ...................................................................................... 73
3.4.1 Screening Criteria .................................................................................................................. 73
3.4.2 The Performance ................................................................................................................... 76
3.4.3 Performance of Sin Stocks .................................................................................................... 84
3.5 Islamic Investments ...................................................................................................................... 86

iii
3.5.1 Screening ............................................................................................................................... 86
3.5.1.1 Qualitative Screening ......................................................................................................... 88
3.5.1.2 Quantitative Screening ....................................................................................................... 91
3.5.2 The performance.................................................................................................................... 97
3.6 Summary .................................................................................................................................... 100
Chapter 4: Research Methodology and Methods............................................................................. 102
4.1 Introduction ................................................................................................................................ 103
4.2 Philosophical Assumptions and Research Methodology ............................................................ 103
4.2.1 Assumptions about the Nature of Social Science................................................................. 104
4.2.2 Assumptions about the Nature of Society ............................................................................ 108
4.2.3 Research Paradigms............................................................................................................. 109
4.3 The Research Objectives and Philosophical Assumptions Underpinning the Present Study ...... 115
4.4 Research Methods ...................................................................................................................... 121
4.4.1 Semi-Structured Interviews ................................................................................................. 122
4.4.2 Content Analysis ................................................................................................................. 128
4.4.3 The Quantitative Methods ................................................................................................... 131
4.4.3.1 The Risk-Adjusted Performance Measures ....................................................................... 131
4.5 Summary .................................................................................................................................... 135
Chapter 5: Practitioners’ Perspectives of Halal Investments ......................................................... 136
5.1 Introduction ................................................................................................................................ 137
5.2 Sample and Research Method .................................................................................................... 138
5.3 Growth of Islamic funds in the GCC .......................................................................................... 141
5.3.1 Motivations to Invest and offer Halal investments .............................................................. 143
5.3.1.1 Investors‘ Motivations ...................................................................................................... 143
5.3.1.2 Fund Managers Motivations ............................................................................................. 145
5.4 The Concept of Halal Investments ............................................................................................. 146
5.4.1 Definition of Pure Halal and Mixed Halal Stocks ............................................................... 149
5.4.2 The inclusion of Mixed Halal Stocks .................................................................................. 154
5.5 The Shariah Screening Criteria Adopted By Islamic Funds ....................................................... 159
5.5.1 The Qualitative and Quantitative Screening Process ........................................................... 159
5.5.2 Positive Screening ............................................................................................................... 168
5.5.3 Harmonization Screening Criteria ....................................................................................... 169
5.5.4 The Source of Information Used in Screening ..................................................................... 172
5.6 Factors Affecting the Performance of Islamic Funds.................................................................. 175
5.6.1 Asset allocation of PH and MH stocks ................................................................................ 175
5.6.2 The Purification of Islamic Funds ....................................................................................... 182
5.7 Portfolio Performance Evaluation .............................................................................................. 183

iv
5.8 Summary .................................................................................................................................... 189
Chapter 6: The Impact of Different Halal-based Screenings on Investment Portfolios ................ 193
6.1 Introduction ................................................................................................................................ 194
6.2 Screening criteria and process .................................................................................................... 195
6.3 Data Collection ........................................................................................................................... 199
6.4 Screening Results ....................................................................................................................... 202
6.5 Halving the Financial Screening Criteria .................................................................................... 223
6.6 Portfolio Construction ................................................................................................................ 239
6.7 Summary .................................................................................................................................... 246
Chapter 7: Evaluating the Performance of Halal and non-Halal Portfolios .................................. 248
7.1 Introduction ................................................................................................................................ 249
7.2 Data collection ........................................................................................................................... 251
7.2.1 Statistical Tests for analyzing the Portfolios‘ Mean Returns ............................................... 255
7.3 Descriptive Statistics .................................................................................................................. 258
7.3.1 Descriptive Statistics before Halving the Financial Screening Criteria ............................... 258
7.3.2 Descriptive Statistics after Halving the Financial Screening Criteria .................................. 266
7.4 Analysis of the Portfolios‘ Return Performance ......................................................................... 271
7.5 Analysis of the Portfolios‘ Return Correlation ........................................................................... 279
7.6 Analysis of the Portfolios‘ Risk-Adjusted Return Performance ................................................. 284
7.6.1 The Results of the Portfolios‘ Risk-Adjusted Return Performance Analysis Using the
Interest-Based Risk-free Rate ............................................................................................. 285
7.6.2 The Results of the Portfolios‘ Risk-Adjusted Return Performance Analysis using a Shariah-
Compliant Risk-free Rate ................................................................................................... 293
7.7 Summary .................................................................................................................................... 296
Chapter 8: The Performance of the Halal and non-Halal Portfolios, a Matched Pair and a
General Linear Model (GLM) Analysis ........................................................................................... 299
8.1 Introduction ................................................................................................................................ 300
8.2 Descriptive Statistics and Risk-Adjusted Performance of the Matched Pairs ............................. 301
8.3 Analysis of Factors affecting the Financial Performance of Stocks in KSE ............................... 315
8.3.1 The Results of the GLM Analysis Using AAOIFI‘s (2006) Screening Criteria for the Shariah
Classification Factor ........................................................................................................... 321
8.3.2 The Results of the GLM Analysis using AAOIFI‘s Halved Screening Thresholds for the
Shariah Classification Factor ............................................................................................. 330
8.4 Summary .................................................................................................................................... 333
Chapter 9: Conclusion ....................................................................................................................... 335
9.1 Introduction ................................................................................................................................ 336
9.2 Main Findings and Contribution to Knowledge ......................................................................... 338
9.3 Limitations of the Study ............................................................................................................. 342

v
9.4 Future Research .......................................................................................................................... 345
9.5 Concluding Thoughts ................................................................................................................. 348
References ........................................................................................................................................... 349
Arabic References .............................................................................................................................. 373
Appendices .......................................................................................................................................... 377

vi
List of Tables
Table 2.3: The Development of the GCC Financial Markets ................................................................. 31
Table 2.4: Overview of GCC Stock Markets; Number of Listed Companies, Market Capitalization,
Value and Volume Treaded, from 2002-2012 ........................................................................................ 33
Table 2.5: The Kuwait 15 Index (KSX15) Constituents as of December 2012 ...................................... 42
Table 2.6: Evolution of the Islamic Financial Markets ........................................................................... 47
Table 2.7: Total Assets of Islamic Banks in the GCC from 2008-2012 .................................................. 49
Table 2.8: The Pure Islamic and Shariah-compliant stocks in KSE by sectors ...................................... 53
Table 2.9: Islamic and Conventional Investment Funds in the GCC region ........................................... 55
Table 3.1: Comparison between Conventional, Ethical, and Islamic Equity investment funds .............. 71
Table 3.2: Common Ethical Equity Investment Screens Adopted by SRI Funds ................................... 74
Table 3.3: Religious-Based Equity Investment Funds ............................................................................ 75
Table 3.4: Qualitative Shariah Screens .................................................................................................. 89
Table 3.5: Financial Shariah Screens ..................................................................................................... 93
Table 4.1: The Regulation-Radical Change Dimension ....................................................................... 108
Table 5.1: Interviewees‘ Summary Details........................................................................................... 139
Table 5.2: Growth Drivers of the Halal Equity Investment in the GCC ............................................... 142
Table 5.2: Definition of PH Stock ........................................................................................................ 149
Table 5.3: The Need to Include MH Stocks in Islamic Portfolios ........................................................ 154
Table 5.5: Definition of Screening ....................................................................................................... 160
Table 5.4: Fund Managers‘ Asset Allocation of Halal-Based Stocks across Different Sectors ............ 176
Table 6.1: Results for Financial Screening as at 31/12/ 2005 ............................................................... 203
Table 6.2: An Analysis of Mixed Halal (MH) and Mixed Sin (MS) Stocks by Year ........................... 207
Table 6.3: The Final Screening Results for Mixed Companies over the 2005-2010 Period, Based on
AAOIFI (2006) Screens, Ranked According to their Market Value in Million (K.D) .......................... 209
Table 6.4 Changes in Mixed Stocks‘ Shariah Classification over the Sample Period .......................... 214
Table 6.5, Panel A: Screening results as at the end of December 2005 ................................................ 216
Table 6.5, Panel B: Screening results at the end of December 2006..................................................... 216
Table 6.5, Panel C: Screening results at the end of December 2007..................................................... 217
Table 6.5, Panel D: Screening results at the end of December 2008 .................................................... 217
Table 6.5, Panel E: Screening results at the end of December 2009 ..................................................... 218
Table 6.5, Panel F: Screening results at the end of December 2010 ..................................................... 218
Table 6.6: Mixed Halal (MH) and Mixed Sin (MS) Stocks by Year after and Before Halving the
Financial Screening Thresholds ........................................................................................................... 225

vii
Table 6.7: The Final Screening Results for Mixed Companies over the 2005-2010 Period, Based on the
Halved AAOIFI (2006) Screens Thresholds, Ranked According to their Market Value in Million (K.D)
............................................................................................................................................................. 227
Table 6.8: Changes in Mixed Stocks‘ Shariah Classification over the Sample Period Before and After
Halving the Financial Screening Thresholds ........................................................................................ 231
Table 6.9, Panel A: Screening results After Halving Thresholds at the end of December 2005 ........... 233
Table 6.9, Panel B: Screening results After Halving Thresholds at the end of December 2006 ........... 233
Table 6.9, Panel C: Screening results After Halving Thresholds at the end of December 2007 ........... 234
Table 6.9, Panel D: Screening results After Halving Thresholds at the end of December 2008 ........... 234
Table 6.9, Panel E: Screening results After Halving Thresholds at the end of December 2009 ........... 235
Table 6.9, Panel F: Screening results After Halving Thresholds at the end of December 2010 ............ 235
Table 6.10: The Asset Allocation for Portfolios P1-P19 over the Sample Period (2005-2010) ............ 244
Table 7.1: Descriptive Statistics for the Weekly Data, Panel A: The Full Sample Period (2006-2011)259
Table 7.2: Descriptive Statistics for Portfolios after Halving AAOIFI‘s Financial Criteria ................. 266
Table 7.3: The Analysis of Variance (ANOVA) Results for all 19 portfolios ...................................... 272
Table 7.4: The Friedman‘s Test Results for the 19 Portfolios .............................................................. 274
Table 7.5: The Friedman‘s Test Results for 6 Halal-Based Portfolios during the Bearish Period ........ 275
Table 7.6: The Paired Sample T – Statistics for Comparison between Row and Column Portfolios
during the Bearish Period ..................................................................................................................... 277
Table 7.7: Portfolio Returns Correlations ............................................................................................. 281
Table 7.8: The Risk-adjusted Performance Analysis and Rankings of the 19 portfolios ...................... 286
Table 7.9: The Risk-adjusted Performance Analysis and Rankings of the 19 Portfolios for the Bearish
Period (2010-2011), using a Shariah-Compliant and Conventional Risk-free Rates ............................ 294
Table 8.1: Descriptive Statistics and Performance Measures for the Five Matched Pairs portfolios .... 304
Table 8.2: Results of the GLM the Analysis, Factors and Interaction Effects ...................................... 321
Table 8.3: Multiple Comparisons of the Mean Stock Returns of KSE in Each Sector ......................... 325
Table 8.4: Multiple Comparisons of the Mean Stock Returns of KSE for each Year ........................... 325
Table 8.5: Results of the GLM Analysis, Factors and Interaction Effects Using Halved AAOIFI‘s
Screening Thresholds ........................................................................................................................... 331

viii
List of Figures
Figure 1.1: The Holistic picture of Islam as a way of life ......................................................................... 5
Figure 1.2: Shariah’s Primary and Secondary Sources ............................................................................ 6
Figure 2.1: The GCC Countries and the Surrounding Region ................................................................ 30
Figure 2.2: Performance of GCC Stock Markets: June 2005- Dec. 2012 ............................................... 37
Figure 2.3: Islamic Companies in the GCC ............................................................................................ 51
Figure 2.3: Number of Institutions under the Financial System in Kuwait ............................................. 54
Figure 4.1: Assumptions about the Nature of Social Science ............................................................... 105
Figure 4.2: Four Paradigms underlying Social Research ...................................................................... 110
Figure 4.3: The Chronological Order the Empirical Work ................................................................... 119
Figure 6.1: The Portfolio Creation Process .......................................................................................... 196
Figure 6.2: The Average Number of MH Stocks in Each Sector Based on the Original and Halved
AAOIFI‘s 2004 Financial Screening Criteria ....................................................................................... 238
Figure 6.3: The Average Number of MH Stocks in Each Sector Based on the Original and Halved
AAOIFI‘s 2006 Financial Screening Criteria ....................................................................................... 238
Figure 6.4: Breakdown of Portfolios Using AAOIFI 2004 and 2006 Financial Screening Criteria ...... 242
Figure 6.5: Breakdown of Portfolios Using AAOIFI 2004 and 2006 Halved Financial Screening Criteria
............................................................................................................................................................. 243
Figure 7.1: The Performance of the KSE and the Control Portfolio (CP) that contains All Sample stocks
............................................................................................................................................................. 254
Figure 7.2: The Performance of 8 selected Portfolios during the Full Sample Period (2006-2011)...... 261
Figure 7.3: The Performance of Mixed Halal and Mixed Sin Portfolios during the Full Sample Period
(2006-2011).......................................................................................................................................... 263
Figure 7.4: The Performance of Halal-Based Portfolios during the Full Sample Period (2006-2011) . 265
Figure 7.5: The Performance of 5 Selected Portfolios and the KSE Index during the Full Sample Period
(2006-2011).......................................................................................................................................... 269
Figure 7.6: The Performance of Halal-Based Portfolios after Halving the AAOIFI‘s 2006 Financial
Screening Criteria during the Full Sample Period (2006-2011)............................................................ 270
Figure 7.7: Box Plot of the 19 Portfolios for the Full Sample Period (2006-2011) .............................. 273
Figure 8.1: The performance of the PH (A) and Sin (A) Matched Pair Portfolios (I) during the Full
Sample Period (2006-2011).................................................................................................................. 306
Figure 8.2: The performance of the PH (B) and MH (A) Matched Pair Portfolios (II) during the Full
Sample Period (2006-2011).................................................................................................................. 307
Figure 8.3: The performance of the Sin (B) and MH (B) Matched Pair Portfolios (III) during the Full
Sample Period (2006-2011).................................................................................................................. 308

ix
Figure 8.4: The performance of the PH (C) and MH-Halved (A) Matched Pair Portfolios (IV) during the
Full Sample Period (2006-2011) .......................................................................................................... 309
Figure 8.5: The performance of the MH-halved and Sin Matched Pair Portfolios (V) during the Full
Sample Period (2006-2011).................................................................................................................. 311
Figure 8.6: Return and Risk of the Matched Pairs Portfolios for the Full Sample Period (2006-2011) 312
Figure 8.7: Return and Risk of the Matched Pairs Portfolios for the Bullish Period (2006-2007) ........ 312
Figure 8.8: Return and Risk of the Matched Pairs Portfolios for the GFC Period (2008-2009)............ 313
Figure 8.9: Return and Risk of the Matched Pairs Portfolios for the Bearish Period (2010-2012) ....... 313
Figure 8.11: KSE Sectors Performance from 2006-2011 ..................................................................... 327

x
List of Appendices
Appendix 1.1: Comparison of AAOIFI‘s Screening Criteria for Mixed Halal Stocks in 2004 and 2006
............................................................................................................................................................. 377
Appendix 2.1: The Area and Population of each GCC Country ........................................................... 377
Appendix 2.2: The Performance of the official KSE index and MSCI Kuwait index........................... 378
Appendix 2.3: The Stock Price Maximum Daily Change..................................................................... 378
Appendix 2.4: the Differences between Islamic and Conventional Banking ........................................ 379
Appendix 3.1: Summary of Studies on the Performance of Ethical Investments .................................. 380
Appendix 3.2: Summary of Studies on the performance Islamic Investments ...................................... 383
Appendix 4.1: Interview‘s Authorization Letter ................................................................................... 386
Appendix 5.1 Interview Questions ....................................................................................................... 387
Appendix 6.1: The Final Screening Results for Mixed Companies over the 2005-2010 Period Based on
AAOIFI 2004 Screening Criteria, Ranked According to their Market Value in Million (K.D) ............ 390
Appendix7.1: The Paired Sample T–Statistics for Comparison between Row and Column Portfolios for
the Full Sample Period (2006-2011) .................................................................................................... 393
Appendix 7.2: The Paired Sample T–Statistics for Comparison between the Row and Column Portfolios
for the Full Sample Period (2006-2007) ............................................................................................... 394
Appendix 7.3: The Paired Sample T–Statistics for Comparison between the Row and Column Portfolios
for the Full Sample Period (2008-2009) ............................................................................................... 395
Appendix 7.4: The Performance of the Four Large-Sized Stocks in the KSE Market during the Full
Sample Period (2006-2011).................................................................................................................. 396
Appendix 7.5: The Correlation between the Ranking of the Sharpe, Treynor, and Jensen Measures with
the conventional risk-free Rate ............................................................................................................. 396
Appendix 7.6, Panel A: The Risk-Adjusted Performance for the Full Sample Period (2006-2011) using
Sharpe Ratio ......................................................................................................................................... 397
Appendix 7.6, Panel B: The Risk-Adjusted Performance for the Full Sample Period (2006-2011) using
Treynor Ratio ....................................................................................................................................... 398
Appendix 7.7, Panel A: The Risk-Adjusted Performance for the Bullish Period (2006-2007) using
Sharpe Ratio ......................................................................................................................................... 399
Appendix 7.7, Panel B: The Risk-Adjusted Performance for the Bullish Period (2006-2007) using
Treynor Ratio ....................................................................................................................................... 400
Appendix 7.8, Panel A: The Risk-Adjusted Performance for the GFC Period (2008-2009) Using Sharpe
Ratio ..................................................................................................................................................... 401
Appendix 7.8, Panel B: The Risk-Adjusted Performance for the GFC Period (2008-2009) Using
Treynor Ratio ....................................................................................................................................... 402

xi
Appendix 7.9, Panel A: The Risk-Adjusted Performance for the Bearish Period (2010-2011) using
Sharpe Ratio ......................................................................................................................................... 403
Appendix 7.9, Panel B: The Risk-Adjusted Performance for the Bearish Period (2010-2011) using
Sharpe Ratio ......................................................................................................................................... 404
Appendix 7.10: The Correlation between the rankings of the Sharpe, Treynor, and Jensen Measures
with the Shariah-compliant benchmarks for the Bearish Period (2010-2011) ...................................... 405
Appendix 7.11: The Correlation between the rankings of the Sharpe, Treynor, and Jensen Measures
Using the Conventional and the Shariah-Compliant rates for the Bearish Period (2010-2011)............ 405
Appendix 7.12: The Performance of the T-bond and the Murabahah rates .......................................... 405
Appendix to 8.1: Summary Information about the Matched Pair Sample ............................................ 406
Appendix 8.2: Summary of Risk, Return, and Risk-Adjusted Returns of Portfolio in the Matched Pairs
............................................................................................................................................................. 409
Appendix 8.3: Information of Companies included in the GLM .......................................................... 410
Appendix 8.4: Mean Returns of Stock Based on their Sharia Classification in Banking Sector ........... 413
Appendix 8.5: Mean Returns of Stock Based on their Sharia Classification in Investment Sector ....... 414
Appendix 8.6: Mean Returns of Stock Based on their Sharia Classification in Insurance Sector ......... 415
Appendix 8.7: Mean Returns of Stock Based on their Sharia Classification in Real Estate Sector ...... 416
Appendix 8.8: Mean Returns of Stock Based on their Sharia Classification in Industrial Sector ......... 417
Appendix 8.9: Mean Returns of Stock Based on their Sharia Classification in Service Sector ............ 418
Appendix 8.10: Mean Returns of Stock Based on their Sharia Classification in Food Sector .............. 419
Appendix 8.11: Mean Returns of Stock Based on their Sharia Classification in Real Estate Sector
Before and After Halving AAOIFI‘s (2006) Screens ........................................................................... 420
Appendix 8.12: Mean Returns of Stock Based on their Sharia Classification in Industrial Sector Before
and After Halving AAOIFI‘s (2006) Screens ....................................................................................... 421
Appendix 8.13: Mean Returns of Stock Based on their Sharia Classification in Service Sector Before
and After Halving AAOIFI‘s (2006) Screens ....................................................................................... 422
Appendix 8.14: Mean Returns of Stock Based on their Sharia Classification in Food Sector Before and
after Halving AAOIFI‘s (2006) Screens............................................................................................... 423

xii
Glossary of Arabic Terms Used
Akhlaq Ethics, or morality.
Allah The Arabic word that means God.
Almanakh Market An unofficial parallel stock exchange market (an over-the counter market)
evolved in 1972 in Kuwait.
Aqidah Belief or faith.
faqih A person trained in fiqh or Shariah scholar.
Fatwa A religious opinion, ruling or provision presented to a person who seeks it
with regard to an incidence that has already occurred or expected to occur.
Fiqh Islamic Jurisprudence.
Gharar Excessive uncertainty.
Halal Permissible, legitimate, or lawful.
Haram Unlawful, prohibited, forbidden, or sin.
Ibadat Worship.
Ijara Installment leasing.
Ijma The consensus of opinions by all of the Shariah scholars or jurists in a
certain era.
Ijtihad The application of the faculty of reasoning by qualified Shariah scholars for
the purpose of forming an opinion with respect to an issue on which there is
little or nothing in the Qur’an or the Sunnah
khalifa A vicegerent.
Maqasid al-Shariah The holistic objectives that Shariah attempt to accomplish, or the general
purposes and wisdom behind all or most of Shariah rulings.
Maslahah General benefit, interest or advantage.
Maysir Games of chance.
Muamalat Transactions.
Mudarabah A form of partnership in which one partner finances the project (rub al-mal)
usually the customer, while the other party (Mudarib), usually the IFI,
manages it. The Mudarib would be entitled to certain amount of profit at a
pre-determined rate as a reward for their contribution in managing the fund.
Murabahah The resale of assets or goods with an agreed upon profit mark-up on the
cost, for instance the bank agrees to buy as asset from a third party and then

xiii
resell it to its client with a mark-up, the client purchases the asset either
immediate or deferred payment.
Musharakah Partnership contract in which both parties contribute capital and may form a
joint Management.
Qiyas Analogical deduction, which seeks to establish a similarity between new
cases and early practices found in the Qur’an or Sunnah.
Qur’an The last revealed word of Allah to the Prophet Muhammad by the Angel
Gabriel.
Riba Interest.
Shariah Islamic law or sometimes called fiqh (Islamic Jurisprudence).
Sukuk Commonly referred to as the Islamic equivalent of bonds, particularly they
are certificates of equal value representing undivided shares in ownership of
tangible assets, usufruct and services.
Sunnah The authentic tradition that comprises all the Hadiths, which are the
transmitted reports by the Prophet Muhammad‘s companions of what he
said, did, or approved.
Takaful Social guarantee, which is a Shariah compliant insurance alternative to
conventional insurance.
Tawarruq A contract in which the seller, a financial institution, arranges a transaction
by selling a commodity to the client for deferred payment. The institution
then sells the commodity, as an agent on behalf of the client to a third party,
in the market and then credits the price to the account of the client.
Ummah Nation.
Umumbalwa Unfavorable widespread situations affecting most people and are difficult to
avoid.
Usul al-fiqh The fundamentals of jurisprudence.
Zakat An annual obligatory financial levy on all surplus wealth and agricultural
income of Muslims to help the needy.

xiv
Abbreviations
AAOIFI Accounting and Auditing Organization for Islamic Financial Institutions
All Halal-M.C Pure Halal and (MH-M.C) Stocks
All Halal-M.C-Halved PH and (MH-M.C- Halved) stocks
All Halal-TA PH and (MH-T.A) Stocks
All Halal-TA-Halved PH and (MH-T.A- Halved) stocks
All Sin-M.C Sin and (MS-M.C) Stocks
All Sin-M.C- Halved Sin and (MS-M.C- Halved) stocks
All Sin-T.A Sin and (MS-T.A) Stocks
All Sin-T.A-Halved Sin and (MS-T.A- Halved) stocks
ANOVA Analysis of Variance
CAPM Capital Asset Pricing Model
CBK Central Bank of Kuwait
CMA Capital Market Authority
CML Capital Market Line
CP Control Portfolio
DFM Dubai Financial Market
DIB Dubai Islamic bank
DIFX Abu Dhabi Securities Market
DJIMI Dow Jones Islamic Market Index
FM Fund managers
FTSE Financial Times Shariah Index
GCC Gulf Cooperation Council
GDP Gross Domestic Product
GFC Global Financial Crisis
GIFF Global Islamic Finance Forum
GLM General Linear Model
HCCAS Higher Consultant Committee for Application of Shariah law in Kuwait
ICB International Classification Benchmark
IDB Islamic Development Bank
IFIs Islamic financial institutions
IFRS International Financial Reporting Standards
IFSB Islamic Financial Services Board
IIBR Islamic Interbank Benchmark Rate
IPO Initial Public Offering
IS Islamic stocks
KAMCO Kuwait Asset Management Company
KFH Kuwait Finance House
KIA Kuwait Investment Authority
KIB Kuwait International Bank

xv
KSE Kuwait Stock Exchange
KSX15 Market capitalization weighted index that tracks the performance of top
15 companies in the KSE
MENA Middle East and North Africa
MH Mixed Halal stocks
MH-M.C Mixed Halal stocks that comply with AAOIFI‘s (2006) financial criteria
MH-M.C- Halved Stocks that comply with a halving of AAOIFI‘s (2006) financial criteria
thresholds
MH-T.A Mixed Halal stocks that comply with AAOIFI‘s (2004) financial criteria
MH-T.A- Halved MH stocks that comply with a halving of AAOIFI‘s (2004) financial
criteria thresholds
MPT Modern Portfolio Theory
MS Mixed Sin stocks
MSCI Morgan Stanley Capital International
MSCI Morgan Stanley Capital International
MS-M.C Mixed Sin stocks that fail to comply with AAOIFI‘s (2006) financial
criteria
MS-M.C- Halved Stocks of companies that fail to comply with a halving of AAOIFI‘s
(2006) financial criteria thresholds
MS-T.A Mixed Sin stocks that fail to comply with AAOIFI‘s (2004) financial
criteria
MS-T.A- Halved Stocks of companies that fail to comply with a halving of AAOIFI‘s
(2004) financial criteria thresholds
MV Average Market Value
NBK National Bank of Kuwait
NCB Saudi Arabia National Commercial Bank
OIC Organization of Islamic Conferences
OPEC Organization of Petroleum Exporting Countries
PBUH Peace Be Upon Him
PH Pure Halal Stocks
SAC Securities Commission‘ Shariah Advisory Council in Malaysia
SCS Shariah-compliant stocks
SML Security Market Line
SRI Social Responsible Investment
SS Shariah Supervisory baod member (SSB) or Shariah Auditors
interviewee
SSB Shariah Supervisory Board
UAE United Arab Emirates
UKIFS UK Islamic Finance Secretariat

xvi
Acknowledgement
First of all, most praises and thanks are due to Allah Almighty, the most beneficent and
compassionate, who bestowed me with the ability to complete this thesis. Further, I would like
to express my sincere thanks to a number of individuals and organizations who have provided
me with invaluable support throughout my academic journey. First, I am indebted to my
supervisors, Professor Christine Helliar and Dr. Nongnuch Tantisantiwong for their guidance,
constructive criticisms, commitment, and encouragement. I feel greatly privileged to have
worked under their supervision.
Second, I owe my mother and father (Shahah and Professor Obaid) a great deal of gratitude for
always believing in me, for their continuous love and their support in my decisions. My hard-
working parents have sacrificed their lives for myself and my brother and sisters and have
provided us with unconditional love and care for us. Without the blessing of Allah and them I
could not have made it here. I am also grateful to my beloved grandmothers (Mereida and
Sarah) for their encouragement and prayers for the successful completion of this thesis. Sadly,
my grandmother Mereida could not see the accomplishment of my thesis, as she passed away
during my studies. I wished she could have lived for another few years for my graduation, but
hopefully, one day we will meet in paradise, by the mercy of Allah, and she will be proud of
me. Special thanks to my oldest sister (Maryam) and her husband (Menawir) who always
encouraged me and asked about me, as well as my brother (Muhammed) and sisters (Shayma,
Abrar, and Fatma).
Third, I would also like to convey my deepest appreciation to my precious wife (Nouf) for her
love and care, without her sacrifice and support this work could not have been achieved. My
profound thanks are also due to my two beautiful daughters (Misk and Shahah) who enlighten
my life and bring happiness to it and have made the stay in Dundee enjoyable.

xvii
Fourth, very special thanks go to my employer in Kuwait, the Public Authority for Applied
Education and Training (PAAET) to sponsor my PhD. I dedicate this work to my beloved
country, Kuwait, and the Islamic investment industry that I used to work in, hoping that this
thesis will contribute to its development.
Fifth, I am also thankful to all the staff in the School of Business, Accounting and Finance
Division, for their helpful feedback on my presentations at the school seminars. I would like to
extend my thanks to Dr. Dick Brown and Professor David Power who have been helpful in
providing advice many times during my quantitative empirical work. Further, special thanks go
to Dr. Theresa Dunne, our PhD program director, to her support and encouragement
throughout my studies, especially after my first supervisor left to go to Australia.
Sixth, my grateful thanks go to all of the interviewees who participated in this research for their
invaluable contribution and input to the current thesis. I also want to thank Dr. Abdulaziz Al-
Qassar, Dr. Essa Zaki, Dr. Fahad Almudhaf, Dr. Jarah Al-Fadhli, Dr. Muhammed Al-Qattan,
Dr. Wael Al-Rashed, and Yahya Al-Hamadi, who provided me with constructive feedback and
invaluable comments and suggestions at the beginning of my research project.
Seventh, I am thankful to all my friends and colleagues for providing support and true
friendship in Dundee, especially Abdul Aziz Al-Sahlawi, Ahmed Al-Rajeh, Dr. Ahmed
Hassan, Dr. Ayman Al-Buloushi, Ibraheem Alshikhmubarrak, Dr. Ibraheem Al-Zahrani, Dr.
Meftah Amer, Muhammad Al-Jumali, and Dr. Salem Eltkhtash, and to my friends in Kuwait,
particularity Dr. Abdul Rahman Al-Falah, Fahad Alnafisi, Dr. Abdullah Almazrouee, Dr.
Faleh Al-Rashidi, Dr. Hisham Almujamed, Mubarak Al-Mutari, Dr. Omar Al-Mutawaa, Dr.
Omar Bin Ghaith, Dr. Saud Al-Ghanim, and Dr. Shebeeb Al-Shammari.
Finally, my thanks go to each individual who has contributed to the success of this thesis but
whom I inadvertently omitted.

xviii
Declaration
I hereby declare that I am the author of this thesis: that the work of which this thesis is a record
has been done by myself, and that it has not previously been accepted for a higher degree.
Signed…………..…………… Date……………..………….
Khaled Obaid Alotaibi
Certificate
We certify that Khaled Obaid Alotaibi has worked the equivalent of eight terms on this
research, and that the conditions of the relevant ordinance and regulations have been fulfilled.
Signed………………………... Date………………..……….
Professor Christine Helliar
Signed………………………... Date………………..……….
Dr. Nongnuch Tantisantiwong

xix
Abstract
Most of the prior research in the area of Islamic Investments has looked at performance; little
attention has been given to the relationship between screening criteria and performance,
especially in the GCC region. Therefore, this thesis examines the impact of using different
screening criteria on the creation, and hence the performance of, Halal portfolios in Kuwait. In
contrast to previous studies, the present study breakdowns Halal stocks in to ‗pure Halal‘ (PH)
and ‗Mixed Halal‘ (MH), and the non-Halal stocks in to ‗Sin‘ and ‗Mixed Sin‘ (MS). This is
to respond to the debate among Shariah scholars about the screening criteria, whether the fatwa
on investing in them should be revisited and is it the right time to move towards pure Halal
investments only. Specifically, this study explores the impact of tightening the current
screening criteria on the creation and performance of Halal portfolios under different market
conditions. Hence, broadly speaking, this thesis examine the issues associated with the creation
and performance assessment of the Halal and non-Halal portfolios.
For the purpose of this study, both quantitative and qualitative methods were employed.
Firstly, due to the scarcity of literature, information and issues related to screening and
performance were discussed with 58 face-to-face interviews with key figures in the Islamic
investment funds industry in the GCC. The interviews explore whether MH are good
investments from a Shariah perspective, and if there is a need to revisit the fatwa and the
screening criteria. Secondly, different Halal portfolios were constructed based on the screening
definitions suggested by the interviewees using a content analysis of companies‘ annual reports
listed in Kuwait Stock Exchange (KSE). This is to investigate the impact of applying different
screens on the size of the Halal asset universe and whether it is possible to create diversified
pure portfolios or at least MH that are close to pure Halal portfolios. Thirdly, quantitative
methods were employed to examine whether these Halal portfolios are good investments from
a financial perspective, using parametric and non-parametric statistical analysis and traditional
risk-adjusted performance measures. Performance was first compared with the KSE market
and a control portfolio (CP) as benchmarks then a ‗matched pair‘ approach was also conducted.
Finally, a general linear model (GLM) was applied to inspect whether the Shariah
classification of stocks or other factors such as firm size, sector, and the global financial crisis
(GFC) impact on performance.
The findings from the interviews suggest that PH and MH investee companies are different
types of Halal investments, and that there are a growing number of Islamic funds and
individual investors that invest only in PH stocks, driven by religious motivations. Further,
some interviewees seriously questioned the Shariah-compliance of MH stocks and thought of
the fatwa that allows MH stocks should be revisited. Therefore, many interviewees agreed that
the financial screening criteria needed to become tighter and that companies in Muslim
countries should be treated differently from western ones as noted by Wilson (2005).
Interviewees revealed that AAOIFI‘s screening criteria are widely adopted in the GCC but
most interviewees believed that the change in AAOIFI‘s criteria in 2006 from total asset to
market capitalization was intended to expand the Halal asset universe. Nonetheless, the
analysis of companies‘ annual reports finds that the use of AAOIFI (2006) during the GFC
resulted in a sizeable number of MH equities being re-categorised as MS stocks, but without
harming portfolios‘ performance.
Further, the statistical analyses suggest that there is no penalty for Halal investments during the
full, the bullish or GFC periods, even after halving the screening thresholds. Differences were

xx
only identified during the bearish period, showing that some sin portfolios performed better,
but overall, Halal portfolios did not underperform either the CP or the KSE index in any of the
sample periods.
Moreover, the GLM analysis also supports this finding that the Shariah-compliance of stocks
is not the main factor affecting performance, but rather the sector they belong to and the GFC
period. Hence, Islamic funds should consider allocating their investments more in the non-
financial sectors rather than in the financial sector, especially during bearish markets to
improve diversification. Nevertheless, there are fewer PH non-financial stocks, so, a ban on
investment in MH stocks is premature, but ‗tightening‘ the MH stocks‘ financial screening
thresholds is currently a better option. Some interviewees, also suggested that PH investors
could diversify their portfolios by investing across all GCC stocks markets. Thus, Islamic fund
managers need to be active fund managers focusing on certain sectors and markets in different
market conditions.
Halving the financial screening thresholds did not hurt MH portfolios‘ performance because
the loss in the number of MH stocks is compensated for by the lower interest-bearing gearing
ratio of the individual companies suggested by the halved thresholds. This is supported by
previous studies that report a negative relationship between stock returns and firms‘ gearing,
especially during market downturns (Penman et al., 2007; George and Hwang, 2010; Bhatt and
Sultan, 2012).
Finally, the screening analysis reveals an inadequate level of disclosure for assessing Sharia-
compliance from companies‘ annual reports. This highlights the need for harmonizing the
Shariah screening criteria, and the development of accounting and auditing standards based on
Islamic values rather than western ones to reflect the unique characteristics of Halal
investment.

1
Chapter 1: Introduction

2
1.1 Introduction
This research is motivated by the significant growth of the Islamic investment funds industry in
the Gulf Cooperation Council (GCC) countries and particularly in Kuwait. Prior studies argue
that Islamic funds provide competitive performance characteristics while addressing ethical
and religious values (Abullah et al., 2007; Merdad et al., 2010; Hassan et al., 2010;
BinMahfous and Hassan, 2012; Ashraf, 2013), which seem to be inconsistent with portfolio
theory if these Shariah (Islamic law) screens result in a significantly smaller investment
universe than conventional funds. In contrast, other studies show that Islamic funds
underperform conventional unrestricted funds (Derigs and Marzban, 2009; Hayat and Kraeussl,
2011) (see Chapter 3). It is therefore, of interest to examine the impact of using different
screening methods on the creation, and hence the performance of, Halal portfolios. In the
GCC, it is common to find Islamic funds and investors investing in both ‗pure‘ Halal (PH) and
‗mixed‘ Halal (MH) stocks1 that contain some ‗sin‘ element based on certain Shariah screens.
2
In addition, some Islamic funds and investors invest only in pure Halal stocks. This is because
investing in MH stocks was established by a fatwa (a Shariah opinion)3 at the time when pure
Halal stocks were rare, and hence, this was granted as an exception, and is not an ideal Islamic
investment option (Al-Shubali, 2005; Al-Tunaji, 2009; Al-Nifasa, 2010). Thus, voices have
been raised to revisit this fatwa with current information and empirical evidence (Al-Tunaji,
2009) to see whether Islamic funds (and investors) still need to invest in MH investee
companies. Therefore, contrary to most academic research on Islamic equity investments, this
thesis responds to these calls and, hence bridges this significant gap in the literature. Therefore,
the primary purpose of this study is to increase our knowledge and understanding of the issues
1 The concept and screening criteria of Pure (PH) and Mixed Halal (MH) stocks are elaborated in Chapter 5 and a brief definition of these terms is provided in section 1.4. 2 The Islamic funds’ screening criteria is discussed in Chapter 3. 3 Fatwa is defined in detail later in this chapter.

3
associated with the creation and performance assessment of the Halal and non-Halal portfolios
to investigate whether Islamic funds, and religious and ethically driven investors bear any
financial penalty in order to comply with their values. Further, this study examines the impact
of using different screening methods on the creation and hence performance of Halal
portfolios. Moreover, the thesis explores the impact of making the screening ‗tighter‘ and
‗stricter‘ on the choice of securities in Halal portfolios, to investigate whether it is possible to
move towards pure Halal investments without compromising performance. Finally, this thesis
seeks to discover whether the Shariah-compliant classification of stocks, firm size, sector or
global financial crisis (GFC) period affect performance.
In order to achieve these research objectives, the thesis attempts to answer the following
research questions: (i) how do participants define and screen PH and MH equity investments?;
(ii) do participants believe that MH stocks are still necessary for a Halal diversified portfolio?;
(iii) is there a financial penalty for investing in Halal equity portfolios?; (iv) did AAOIFI‘s
change in screening criteria in 2006 affect portfolio creation and performance?; (v) is there an
impact of halving AAOIFI‘s screening thresholds on portfolios creation and performance?; and
(vi) does the Shariah-compliant classification of stocks, firm size, sector or GFC period affect
performance?
The chapter introduces the reader to Islam, Shariah law, and Islamic investment guidelines in
sections 1.2 and 1.3 as a background to this thesis. Section 1.4 elaborates on the debate related
to the Shariah legitimacy of MH stocks which has motivated the current research. Section 1.5
outlines the structure of the thesis and section 1.6 concludes.
1.2 Background
Muslims believe that Islam is not a new religion but rather the continuation and culmination of
previous religions, as they are all from the same source, Allah, the Arabic word that means

4
God, the one and only true God who created the whole universe (Ahmad, 2010; Kettell, 2011).
However, Islam is a comprehensive religion that contains guidelines and rules that cover all
aspects of life, at the individual as well as collective levels in matters of faith, worship, social
life and economic factors (Al-Buraey, 1988; Haneef, 1996; Vogel and Hayes, 1998; Khan,
1999; Qadhi, 2002; Al-Zuhayli, 2005; Laldin, 2008; Ahmad, 2010). Thus, it is not just a
religion but it is a way of life that should be practiced and reflected upon in all Muslim‘s
actions (Qadhi, 2002; Bakar, 2008).
Islam literally means submission, obedience, surrender, and peace and full submission and
obedience to Allah (Kamali, 2006; Ahmad, 2010). Muslims believe that Islamic teachings are
direct orders from Allah, providing absolute guidance to human beings (Kamali, 2006; Kettell,
2011).4To follow Allah‘s commands and Shariah, believers follow the thoughts of his final
messenger on earth, Muhammad, peace be upon him (PBUH)5 (Fiqh
6 Encyclopedia ,vol. 4
,p259).
Islam comprises three main components namely: Aqidah (belief), Akhlaq (ethics and morality),
and Shariah (Al-Jazaeri, 1995; Zaidan, 1999; Kettell, 2011) as shown in Figure 1.1.
4 Several translations of the Holy Qur’an are used in this thesis to convey the English from the Arabic text. Such as: Khan and Al-Hilali (1999), Al-Islami(1997), Asad(2008) and websites such as: http://www.altafsir.com/TafseerQuran.asp 5 PBUH is an abbreviation for; peace be upon him, it is always preferable to mention this statement when saying or writing the prophet Muhammad’s name (Alyahsobi, 2002). Having said that, (PBUH) will be mentioned once to reflect this fact. 6Fiqh briefly refers Islamic Jurisprudence and will defined later chapter.

5
Figure 1.1: The Holistic picture of Islam as a way of life
Note: This figure illustrates a holistic picture of Islam being a way of life.
Source: Adapted from Zadian (1999), Lee and Detta (2007), Kettell (2011), and Aljazaeri (2013)
Shariah literally means the way or the path to a watering way (oasis) in the desert and is
technically concerned with Islamic law, or sometimes called Islamic Jurisprudence (Fiqh)
(Bakar, 2008; Kettell, 2011). Shariah governs all forms of practical actions that confirm faith
and belief (Vogel and Hayes, 1998; Bakar, 2008). In other words, Shariah refers to commands,
prohibitions, guidance, and principles that Allah has addressed to mankind pertaining to their
conduct in this world and salvation in the hereafter (Kamali, 2006). As illustrated in Figure 1.1,
Shariah is divided into two Jurisprudence elements: Ibadat (worship) and Muamalat
(transactions). Ibadat is concerned about the person‘s relationship to Allah which often refers
to the five pillars of Islam (Haneef, 1996), while Muamalat is concerned about person to
person relationships (Al-Jazaeri, 1995). Furthermore, Muamalat has three components:
politics, social and economics (Al-Jazaeri, 1995; Zaidan, 1999; Kettell, 2011). The root of
Islam
Aqidah
(Faith and Belief)
Shariah
(Islamic law or Jurisprudence )
Ibadat
Worship Allah
(Prayers , Fast, Hajj)
Muamalat
(All transactions other than worship)
Political Issues
Economic and Commercial
Issues
Investment and Finance
Social Issues
Akhlaq
(Ethics and Morality)

6
Islamic investment and finance, which is the focus of this thesis, is found under the economic
and commercial system that forms a significant segment of Shariah, which cannot be isolated
from ethics and beliefs as they are all integrated components of Islam.
Shariah is the Islamic legal system associated with a code of behavior (Vogel and Hayes,
1998; Lewis, 2001; Lee and Detta, 2007). Shariah has two main sources, primary sources and
secondary sources (Al-Buraey, 1988; Bakar, 2008; Visser, 2009; Kettell, 2011) as
demonstrated in Figure 1.2.
Figure 1.2: Shariah’s Primary and Secondary Sources
Source: adapted from Al-Buraey (1988), Bakar (2008), and Visser (2009)
The primary sources are the Holy Qur’an and Sunnah. The Holy Qur’an is the last revealed
word of Allah to the Prophet Muhammad by the Angel Gabriel (Ahmad, 2010). Sunnah (the
authentic tradition) that comprises all the Hadiths, which are the transmitted reports by the
Prophet Muhammad‘s companions of what he said, did, or approved (Kamali, 2006; Philips,
2006). The holy Qur’an provides general principles and the essential practice of Islam but it
does not go into details; the details are provided by the prophet Muhammad in his Sunnah, thus
Shariah Sources
Primary Sources
The Holy Qur'an
The Sunnah /Hadith
Secondary
Sources
Ijtihad
(Independent reasoning)
Qiyas
(Analogy)
Ijma
(Consensus)

7
the Sunnah acts as an interpretation of the Qur’an and adds to it (Ahmad, 2010).7 Nevertheless,
neither the Qur’an nor Sunnah cover every circumstance that a person might encounter and
there are many other contemporary issues (Vogel and Hayes, 1998; Kamali, 2006; Bakar,
2008).
The Qur’an is not a legal document but rather a book of religious and moral principles and
exhortations that also embody important legal enunciations (Lee and Detta, 2007). Therefore,
Shariah scholars also rely on secondary sources described in Figure 1.2. First, Ijtihad, which
refers to the application of the faculty of reasoning by qualified Shariah scholars for the
purpose of forming an opinion with respect to an issue on which there is little or nothing in the
Qur’an or the Sunnah (Vogel and Hayes, 1998; Attia, 2007; Bakar, 2008). Second is the Ijma
that refers to the consensus of opinions by all of the Shariah scholars or jurists in a certain era
(Philips, 2006; Bakar, 2008). Third is the Qiyas (analogical deduction) which seeks to establish
a similarity between new cases and early practices found in the Qur’an or Sunnah, so as to
extend the ruling from an original case, mentioned by primary text (Qur’an or Sunnah) to a
new case with the same common cause as the former (Bakar, 2008; Zaidan, 1999; Al-Zuhayli,
2005). Thus, Shariah scholars do not use Qiyas to produce a new law, but use it to reach a new
ruling on a different matter. For example, drinking wine is explicitly forbidden in the Qur’an,
due to its intoxicating effect; therefore, whenever this cause is found (intoxication) prohibition
is applicable, such as in the case of narcotic drugs (Al-Qaradawi, 2005).8
The primary and secondary sources of Shariah sources presented in Figure 1.2 are discussed in
depth under a discipline known as Usul al-fiqh (the fundamentals of jurisprudence) which is
concerned with establishing a scientific proof of Islamic derivation of substantive legal
7 The Sunnah functions similar to New Testament of the bible because it interprets the Old Testament. Furthermore, the process of collection, compilation and authentication of Sunnah and the New Testament all occurred after the demise of Moses, Jesus and Muhammad. 8 For more details about Shariah sources, see Vogel and Hayes (1998), Al-Zuhayli (2005), Bakar (2008), and Kettell (2011).

8
principles (Vogel and Hayes, 1998; Attia, 2007; Al-Mubarak and Osmani, 2010; Kettell,
2011). Fiqh, which literally means deep understanding, refers to the science of rulings
extracted from detailed Shariah sources and the process of gaining knowledge of Shariah
through jurisprudence (Fiqh Encyclopedia, 1995). A person trained in fiqh is known as a faqih
or Shariah scholar. The Faqih is able to determine legal rulings or provisions known as fatwa.
There are five rulings: obligatory; recommended; prohibited (Haram); disapproved; and
permissible (Halal) (Al-Zuhayli, 2005; Al-Qaradawi, 2005; Bakar, 2008). At the time of the
Prophet Muhammad, issues were addressed without controversy based on revelations received
from Allah, or on his personal opinion subsequently confirmed or corrected by revelation. But
after the Prophet‘s death, there was a need for this role and Islamic jurisprudence developed
over the centuries by four different schools of thoughts (Al-Dihlawi, 2003; Ahmad, 2010;
Philips, 2006).9 Although the four jurisprudence schools correspond to different methods of
conducting jurisprudence, they are all equally accepted by all Muslims around the world (Al-
Dihlawi, 2003; Bakar, 2008).10
However, for issues that are not discussed within the four
Jurisprudence schools (e.g. investing in the stock market) Ijtihad is exercised within large
groups of Shariah scholars and specialists institutions such as the Council of Islamic
Jurisprudence Academy. These entities work side by side with professionals and experts
because one of the fiqh rules of issuing a fatwa is that it should be based on a deep
conceptualization and understanding of the case. The Accounting and Auditing Organization
9 The four Sunni schools, named after the jurists who taught them, are in chronological order: The Hanafi (rationalist) school; the Maliki school (traditionalist), the Shafi school (moderate) and the Hanbali school (fundamentalist) (Al-Dihlawi, 2003; Bakar, 2008). They all agree on the fundamental Shariah principles derived from the Qur’an and Sunnah. However, they sometimes hold differing views on their interpretation and application of law (Alasrag, 2010). Sunni Muslims are the vast majority of Muslims (90%).They follow the four schools of Jurisprudence. Shia Muslims did not exist until a later stage in Islamic history. Most Shias (between 68% and 80%) live in four countries: Iran, Pakistan, India and Iraq (see the Pew Research Center’s Forum on Religion and Public Life web site; http://www.pewforum.org/Muslim/Mapping-the-Global-Muslim-Population(6).aspx#footnote). 10 More details about the four schools of thoughts are found in Al-Dihlawi (2003); Philips (2006), and Bakar (2008).

9
for Islamic Financial Institutions (AAOIFI) has issued its Shariah standard No.29 that
discusses the stipulations and ethics of fatwas in an institutional framework defining a fatwa,
as:
―Shariah opinion presented to a person who seeks it with regard to an incidence that has
already occurred or expected to occur. It does not refer to answering queries pertaining to
hypothetical incidence.‖ (p.400)
This is why the Shariah Supervisory boards (SSB) are sometimes called fatwa committees as
their primary function is basically issuing fatwa. They base their fatwa on the primary and
secondary sources of Shariah and employ their own interpretations in some cases (Siddiqui,
2007). There are certain conditions and requirements for those who issue fatwa SSB to be
fulfilled.11
Rosly (2010) outlines that in order to determine Shariah compliance, or the legitimacy, of a
financial transaction, a SSB should consider more than just on contractual basis, and include
Maqasid al-Shariah,12
financial reporting, and legal documentation. According to Al-
Ghazzali13
the objective of Shariah is to promote the wellbeing of all mankind by protecting
their faith or religion, their human self, their intellect, their posterity, and their wealth (Attia,
2007). Choudhury and Hussain (2005, p.216) highlight that:
―There is a rich premise for the normative principles of ethics and values emanating from
Islam to be incorporated in the matters of money, finance, accountability and the real
economy.‖
There are several investment principles or guidelines that underpin Islamic investment, as
derived from the Quar’an, Sunnah, or Ijtihad (Sano, 2000; Hassan and Lewis, 2007; Derigs
11 These are discussed in more detail in the AAOIFI Shariah Standard No.29 (2008, pp.397- 407). 12 Maqasid al-Shari’ah is the holistic objectives that Shariah attempt to accomplish, the general purposes and wisdom behind all or most of Shariah rulings (Attia, 2007; Ziqaba, 2010; Rosly, 2010; Yaacob and Donglah, 2012). 13 Al-Ghazzali is a great Islamic philosopher and Shafi jurist, he died in (505 A.H/1058A.D). A.H is an abbreviation of After Hijra. Hijra means emigration, which was the start of the Islamic calendar, that day when Prophet Muhammad emigrated from Mekkah to Madinah, which was in 622 A.D. The Prophet died in 11A.H/632 A.D.

10
and Marzban, 2008; Kettell, 2011) in order to accomplish Maqasid al-Shariah (Ziqaba, 2010;
Rosly, 2010). These are discussed in the next section.
1.3 Islamic Investment Guidelines
Islamic investment involves the prohibition of Riba (interest), Maysir (games of chance),
Gharar (taking excessive risks in contracts), Haram (unlawful) activities that include unethical
business (Sano, 2000; Sultan, 2007; Kettell, 2011) together with the payment of part of ones
wealth to benefit society (Zakat)14
( Khan, 1999; Imam and Kpodar, 2010; Rosly, 2010). These
should be the basic requirements that govern Islamic investment decision makers who wish to
adhere to Shariah objectives. In addition, others add the prohibition of monopolies,
extravagance and stinginess and the promotion of justice, fairness, and honesty (Laldin, 2008;
Al-Qaradawi, 2005). Some argue that, in order to achieve Shariah’s holistic objectives,
environmental issues should also be considered in the practices and investment decisions of
Islamic financial institutions (IFIs)15
(Hassan, 2005; Kamla, 2006, Kamla et al., 2009). This is
based on the concept of khalifa (a vicegerent) that is highlighted several times in the Qur’an
and asserts that humankind holds a privileged position in Allah‘s creation on earth with a
responsibility for caring for Allah‘s earthly creations (Kamla et al., 2009), so abusing one of
his creations, whether a living being or a natural resource, is considered as sin in Islam
(Hassan, 2005). Looking after living beings or natural resources is a good deed, and people are
rewarded for that. The prophet Muhammad affirmed this, as translated by Hassan (2005, p.17):
―the believers who plants a tree, a person, or an animal eats thereof, but it is regarded as
having given a charitable gift (for which there is great recompense)‖.
14 Zakat is an Arabic term that means literally purification, growth and blessing. It is an annual obligatory financial levy on all surplus wealth and agricultural income of Muslims (Khan, 1999) to help the needy (Zuhayli, 2003). 15 Islamic financial institutions (IFIs) include: banks, investment house, financing entity, Takaful (co-operative insurance) or re-Takaful that adheres fully to Shariah law and is overseen by a SSB, which is also reflected in its articles of association (Alqahtani, 2012).

11
In another Hadith, the prophet asserts the importance of sustainable land and nature as
translated by Hassan (2005, p.18) as follows: ―When doomsday comes, if someone has a palm
shoot in his hand, he should plant it‖. Thus, environmental issues are deeply rooted in the
teachings of the Qur’an and Sunnah.
The prohibition of Riba is one of the important guidelines that distinguishes Islamic
investments from ethical or social responsible investment (SRI). Riba is an Arabic word that
means ‗to grow‘, ‗expand‘, ‗increase‘, ‗inflate‘ or ‗excess‘ (Al-Razi, 1994, p.285). More
precisely, riba has been defined in the fiqh terminology as any unjustified increase in capital
for which no compensation is given (from the Shariah perspective) (Al-Zuhayli, 2009). Thus,
any lending or borrowing that occurs in conventional banking based on riba is prohibited no
matter how small or large payment is and whether it is paid as fixed or variable percentage of
the principal, or an absolute amount, in advance or on maturity, a gift or service to be received
as a condition for a loan (Chapra, 1985; Lewis, 2001; Ahmad and Hassan, 2007; Ayub, 2007).
The prohibition of riba is based on many statements in the Holy Qur’an, Hadith and Ijma. For
example, Allah clearly stated in the Qur’an that:
―O you who believe! Fear Allah and give up what remains of your demand for riba if you are
indeed believers. If you do not, take notice of war from Allah and his Messenger: but if you
repent, you shall have your capital sum: deal not unjustly, and you shall not be dealt with
unjustly.‖ [2:278-279].
―That they took riba, though they were forbidden; and they devoured people‘s wealth
wrongfully: we have prepared for those amongst them who reject faith a grievous
punishment‖ [4:161].
Interest, or usury, is not unique to Islam or the pre-Islamic period but also dates back to other
religions such as Christianity and Judaism, which deemed interest an illegal and punishable

12
practice (Suhail, 1999; Mews and Abraham, 2007; Ayub, 2007; Hossain, 2009; Abul Rahman,
2010).16
Many argue that the prohibition of riba comes from Maqasid al-Shariah (Ziqaba, 2010). For
instance, several articles attempt to examine the underlying meaning of the prohibition of
interest in the modern Islamic financial system (Chapra, 2000; Zaher and Hassan, 2001; El-
Gamal, 2004; Nur, 2005; Ahmad and Hassan, 2007; Bakar, 2008; Chapra, 2009; Hossain,
2010). In general, they all argue that interest causes evil in society and is immoral. These
studies generally emphasise that money in Islam, unlike within an interest based system, is not
a commodity but rather a medium of exchange and a measurement and store of wealth. Thus,
charging interest for lending money is not allowed. Furthermore, it is argued that interest
establishes an injustice between lenders and borrowers because earning money without any
effort does not make that earning legitimate from a Shariah perspective; there is a principle
that states that earnings are not legitimate until a risk is taken (Usmani, 2010). Thus, lenders
should not be guaranteed a positive return without putting in any effort, whilst entrepreneurs
that borrow are not rewarded with a positive return for their hard work and management
(Ahmad and Hassan, 2007). In addition, Zaher and Hassan (2001) also rationalize the
prohibition of riba as increasing efficiency, stability and growth. This is because the principles
of Islam promote socio-economic justice and the equitable distribution of income and wealth,
16 According to Hossain (2009, p.243-244) the Old Testament in the Bible states:
“Torah and Talmud,16 encourage the granting of loans but without interest. Charging interest has been considered as worst sins and has forbidden according to Jewish law… Similarly, the early Christian Church connected to the New Testament, declared that any kind of interest was against divine law, preventing pious and outwardly pious Christians from using capital for mercantile purposes. In 1179, Pope Alexander III excommunicated usurers, which in that period was seen as an extremely harsh punishment”.

13
including a just return from all members of society from economic development (Chapra,
1985; Choudhury and Hussain, 2005).17
Indeed, the avoidance of interest marks a fundamental difference between Islamic and
conventional financial companies (Khan and Mirakhor, 1989; Nur, 2005). Therefore, investing
in the stocks of any conventional interest-based financial institution or company whose core
activities contradict Shariah is clearly prohibited and considered as sin in Shariah (Al-Nashmi,
1998; Al-Salaami, 1998; Al-Qurdi, 2001; Al-Birwari, 2001; AL-Sulaman, 2005; Al-Tunaji,
2009). Similarly, investing in fixed-income securities, preferred stocks and/or convertible notes
is also prohibited as the principal is guaranteed and the predetermined rate of return stipulated
(Siddiqui, 2007). Furthermore, margin trading and short selling in the operational aspect of
stocks are also prohibited in Shariah because they include interest (Usmani, 2010).
Moreover, there are certain activities that deemed to be sin (Haram), which may include the
following: (i) gambling and gaming; (ii) adult entertainment and pornography; (iii) Gharar
(excessive uncertainty; an example would be conventional insurance companies); and (iv) the
manufacture or sale of Haram products such as alcohol pork, or tobacco. Therefore, investing
in companies engaged directly in these activities is prohibited in Shariah (Khatkhatay and
Nisar, 2007; Sultan, 2007; Derigs and Marzban, 2008; Abul Rahman et al., 2010; Kettell,
2011; Ho et al., 2012).
Al-Qaradawi (2005) notes that the rationale behind the prohibition of gambling or lotteries is
that it makes people dependent on chance, luck and empty wishes, taking them away from
serious work and productive efforts. However, in Islam, an individual‘s property is sacred and
17 For Muslim investors, knowing the rationale behind the prohibition of Riba (Interest) is not much important as the prohibition of it is stated in the Quar’an and Hadith. This is why Al-Razi as quoted by Nur (2005, p23) argues that:
“The prohibition of riba is provided by the text of Qur’an. It is not necessary for humanity to know the rationale of the prohibition. Therefore, the prohibition of riba must be regarded as definitely known even though we do not know the rationale of its prohibition”.

14
may not be taken away from the owner except through lawful exchange, or unless he or she
gives it freely as a gift or to charity (Qadhi, 2002). Accordingly, taking property from a person
who has lost it through gambling is unlawful. Furthermore, engagement in the manufacture or
trade of any Haram product such as alcohol or pork is prohibited based on verse [4:90] and the
Hadith that states:
―Surely, Allah and His messenger have prohibited the sale of wine, the flesh of dead animals,
swine and idols‖.
Shariah scholars have applied Qiyas to conclude that trading in any harmful product such as
tobacco is sin because of the dangerous effects on one‘s health, wealth, family and society (Aal
Ash-Sheikh et al., 2000).18
This is a general rule designed to prohibit anything that causes a
person‘s death, either quickly or gradually, or is harmful to his or her health or community (Al-
Qaradawi, 2005; Dusuki, 2007). As the prophet said as translated by Al-Qaradawi (2005,
p.79): ―do no harm yourself or others‖. Thus, consuming or selling tobacco is a sin in Shariah,
because seeking benefit through harming others is prohibited (Islam and Al-Khateeb, 1995;
Aal Ash-Sheikh et al., 2000; Al-Qaradawi, 2005; Dusuki, 2007). In addition, the purpose of
Shariah rulings is to protect the faith, souls, minds, private parts, and money, hence it is an
obligation to protect individuals‘ health and wealth, as well as the whole of society (Islam and
Al-Khateeb, 1995; Dusuki, 2007).
Furthermore, evidence of the prohibition of immoral activities is derived from the Qur’an and
Sunnah. For instance, Allah states in the Qur’an:
―The things that my Lord hath indeed forbidden are: shameful deeds, whether open or secret.‖
[7:33]
―Do not go near to adultery. Surely it is a shameful deed and evil, opening roads (to other
evils)" [17:32].
18 The Qur’an states that “do not kill yourselves, verily Allah is to you Ever-Merciful” *4:29+.

15
Therefore, not only is adultery prohibited, but also anything that leads to illegal sex (outside
marriage), nudity and pornography (Al-Qaradawi, 2005) due to its negative effects on the
society‘s health and behavior (Dusuki, 2007). All of these prohibitions have implications for
what Shariah-compliant funds cannot invest in, as discussed next.
1.4 Pure, Mixed and Sin Equity Investments
Islamic investment funds have to eliminate the stocks of companies that indulge in ‗sin‘
activities as their core business; (e.g. manufacturing or distributing alcohol). Shariah scholars
allow investments in the stocks of companies that fully conform to Shariah guidelines, which
do not borrow or keep surplus cash in interest-bearing accounts (Usmani, 2010). However,
investment in companies whose core business is Halal, but that sometimes borrow or receive
small amounts of interest or sin revenue is widely debated by Shariah scholars from different
schools of thought (Abdul Rahman et al., 2010). These companies are usually called mixed
companies, as their core businesses are Halal but may include some earnings generated from
Haram non-operating activities (Usmani, 2010). The term ‗mixed‘ investee companies is not
found in the academic literature that discuss the screening or performance of Islamic funds, as
Islamic funds‘ equity assets are described as Shariah-compliant stocks. Hence, the literature
does not distinguish between mixed Halal stocks (MH), mixed sin stocks (MS), or pure Halal
stocks (PH). The difference between MH and MS is that former comply with certain screening
criteria, while the latter ones fail to comply with such criteria.
The debate about mixed companies is elaborated only in the Arabic figh literature (see: Kuwait
Finance House, 199819
; Al-Nashmi, 1998; Al-Salaami, 1998; Al Manea, 1998; Al-Qurdi, 2001;
Al-Birwari, 2001; Al-Quradaqi, 2002; Al-Khalel, 2005; Al-Shubali, 2005; Al- Sulaman, 2005;
19 Kuwait Finance House has published a book containing the six conference papers presented by well-known Shariah scholars on this and other issues covered at this conference (three allowed MH stocks while three did not). See the references in the Arabic references section.

16
Al-Nifasa, 2010). These studies discuss the legitimacy of investment in such stocks from a
Shariah point of view based on the premise that it is common for companies in a global
interest-based financial system to borrow from conventional financial institutions to finance
their activities (Kamal, 2001; Abdul Rahman et al., 2010). Many Islamic international bodies
have contributed to the development of the Shariah-compliant equity investment industry,
including: the Organization of Islamic Conferences (OIC); the Fiqh Academy; AAOIFI; the
Islamic Development Bank (IDB); and the Islamic Financial Services Board (IFSB) (Ho et al.,
2012). In particular, this issue was first discussed at the seventh conference of the OIC Fiqh
Academy in Saudi Arabia on 9-14 May 1992, then subsequently at a conference held by the
Kuwait Finance House in Kuwait on 2-4 November 1998 (Al-Quradaqi, 2002).20
During that
period, very few IFIs existed that offered Shariah-compliant financing to large companies21
or
could be invested in by Islamic fund managers or even individual Muslim investors. However,
since then, the number of IFIs has increased. For instance, it is more popular nowadays in the
GCC countries to find Islamic funds and investors who only invest in ‗pure‘ Halal stocks that
have a SSB.22
Indeed, it is the role of the SSB to ensure persistently that such companies do not
engage in any Haram transactions (Abdul Rahman, 2010; Kasim et al., 2013). Companies that
do not have a SSB may involve in Haram activities currently or in the future (e.g. by placing
any surplus income in an interest-bearing account or investing in conventional bonds).
20 The SSB of Al-Rajhi (Islamic) bank in Saudi Arabia has discussed the legitimacy of MH stocks in their Shariah resolution no. 485 in 23/ 8/ 1422 H (according to the Islamic calendar) that corresponds to 8/11/2001 and approved the investments in such stocks given that they were compliant with their screening criteria (similar to AAOIFI’s screens) but restricted this approval to the necessity of such investment (see Al-Tamimi, 2005; Al-Nifasa, 2009; Al-Tunaji, 2009). See Appendix 1.1 for AAOIFI’s screening criteria (2004) and (2006). 21 Shariah-compliant financing could take different forms, such as Murabah, Ijara (instalment leasing) and Musharakah. For instance, with regard to real estate, instead of borrowing money, the bank obtains a property and leases it to a Shariah-compliant investor, who pays rent instead of interest, which is called Ijara (Mirakhor and Zaidi, 2007; Usmani, 2010). For further details on the Islamic finance instruments, see: Vogel and Hayes (1998), Nyazee (1999), Mirakhor and Zaidi (2007), El-Gamal (2006); Bakar (2008); Visser (2009), and Usmani (2010). 22 See Chapter 2 for more details about the diffusion of IFI and Islamic funds.

17
Some Shariah scholars forbid investments in the stocks of companies with any degree of
involvement in Haram activities (see: Al-Qurdi, 2001; Al-Nashmi, 1998). This is why some
investors avoid investing in ‗mixed‘ stocks even if the Haram element is a minor component of
the business, such as airlines, hotels and supermarket chains that sell alcohol or pork (Wilson,
2004; Al-Qurdi, 2001; Al-Tunaji, 2009). This, nevertheless, results in a limited selection of
potential securities to put in to a portfolio (Wilson, 2004, 2005; Derigs and Marzban, 2008).
The Shariah scholars who forbid investment in MH stocks (with any degree of Haram
element) rely on the previous texts quoted from the Qur’an and Sunnah that prohibit such
activities, as well as other texts that highlight the importance of pure earnings, such as the
Qur’an:
―Help you one another in virtue, righteousness and piety but don not help one another in sin
and transgression‖ [4:2].
Also, in the Hadith as translated by Qadhi (2002, p.34) the prophet said:
―O People! Allah is al-Tayyib (Pure), and He only accepts that which is pure! Allah has
commanded the believers what He has commanded the Messengers, for He said, ‗O
Messengers! Eat from the pure foods, and do right,‘ and He said, ‗O you who believe! Eat
from the pure and good foods we have given you‖.
Hence, the Hadith shows the importance of pure Halal food and deeds and of not mixing them
with Haram ones. This includes how money is earned and spent, as seeking Halal sustenance
and earnings is an obligation for every Muslim (Qadhi, 2002), because Allah accepts what is
pure. The following Hadith as translated by Qadhi (2002, p.35) for instance signifies that Allah
only accepts pure Halal charity:
―Whoever gives charity equivalent to a date, from his pure earnings- and Allah only accept
pure- then Allah will accept it with his right hand, then He will nurture if for its companion,
like one of you nurtures his foal, until it becomes like a mountain‖.
Therefore, Shariah scholars who forbid investments in any MH companies do not need to
differentiate between a large or small Haram element (Al-Nashmi, 1998; Al-Salaami, 1998;
Al-Qurdi, 2001), arguing that a person who trivializes any sinful deed indicates that he has a

18
weakness in his faith (Qadhi, 2002). Hence, Khatkhatay and Nisar (2007) suggest that MH
companies should be considered unacceptable, even if their Haram activities are comparatively
minor. Moreover, Al-Tunaji (2009) suggests that that investment in MH stocks should be re-
evaluated.
Furthermore, those who disallow MH stocks base their argument on the fact that a shareholder
of a company is a partner in that company and hence, according to the figh literature, an agent
for other partners in matters relating to their joint business (Usmani, 2010; Al-Zuhayli, 2009).
Thus, if the company is engaged in a Haram transaction, this means that the shareholder of that
company has authorized (tacitly) the management to proceed with it, and hence will also be
rightfully attributed to him and bears the sin too (Usmani, 2010).
On the other hand, another group of Shariah scholars, who form the majority of SSBs of
Islamic funds, permit investment in MH stocks (Al-Birwari, 2001). They argue that being a
shareholder of a company is different from being in a simple partnership, as discussed in the
old figh literature (Al-Quradaqi, 2002; Al-Nifasa, 2010).23
This is because all of the actions of
a partnership are rightfully attributed to each partner, while a large number of shareholders
own the stocks of a company and the opinions of individual shareholders can be dominated by
the majority shareholders (Al-Quradaqi, 2002; Usmani, 2010). Therefore, if a shareholder
raises an objection at an Annual General Meeting about a particular Haram transaction but is
overruled by the majority, it is unfair to say that he has approved that transaction or should be
held accountable for it (Usmani, 2010). Nevertheless, all of the Shariah scholars who allow
MH stocks require shareholders to purify any interest based income or other non-Halal income
23 Another argument outlined in the old fiqh literature focuses on Muslims and non-Muslims jointly sharing the management of a company, as some prohibited activities in Shariah might not be prohibited by other religions, which could lead the non-Muslim partner to invest in such Haram activities, especially if he or she manages the company. For that reason, many jurists from all schools of thought discourage such MH companies, although they are not prohibited; if Muslims manage them, then they are permissible according to all jurists (Al-Quradaqi, 2002; Al-Khalel, 2005).

19
by donating it to charity (Elgari, 2002; Khalel, 2005; Al-Shubali, 2005; Khatkhatay and Nisar,
2007; Ayub, 2007; Hassan and Lewis, 2007; Derigs and Marzban, 2008; Abdul Rahman et al.,
2010).24
Furthermore, these groups of scholars who allow investment in MH stocks argue that
the existing global financial system is dominated by the tenets of capitalism. Hence, finding
fully Shariah-compliant securities is difficult within the pervasiveness of interest transactions
(Al-Quradaqi, 2002; Khatkhatay and Nisar, 2007; Derigs and Marzban, 2008; Usmani, 2010).
Thus, investing only in PH investee companies may create a hardship for Muslim investors,
because the majority of listed stocks are MH companies (SAC, 1997;25
AAOIFI, 2004; Al-
Shubali, 2005; Al-Khalel, 2005; Al-Nifasa, 2010), including big blue chip stocks and leading
stocks in the markets. Henceforth, based on the Shariah principles that, ―hardship always calls
for relaxation‖ and ―if necessity arises, prohibited matters can be allowable‖26
, some Shariah
scholars tolerate investments in MH stocks as an exception in certain conditions (Kamal, 2001;
Al-Quradaqi, 2002; SAC, 2007), until a reasonable number of pure Halal stocks become
available (Al-Tunaji, 2009; Al-Nifasa, 2010), as derived from the following Qu‘ranic verse:
―Allah intends for you ease and does not intend for you hardship‖ [2:185].
It is also based on the following Shariah rules as translated by SAC (2007, p.128):27
―Adversity allows for measures to bring about ease.‖
24 Donating non-Halal earnings to charity is unique to Islamic investment funds, as mentioned in Table 3.1 (Chapter 3) and see Chapter 5. However, Shariah scholars indicate that this charitable giving will not be rewarded by Allah in the hereafter, as it is impure and Allah will only accept what is pure, so it should not be spent on building mosques, printing the Qur’an or paying Zakat (Al-Quradaqi, 2002). 25 SAC is the abbreviation of the Securities Commission Shariah Advisory Council in Malaysia. 26 The term necessity is described in Islamic jurisprudence as the case when a person fears extreme difficulty or danger that he is almost sure will harm him, in order to protect five necessary things: religion; the soul; money; reason; and honor. This case allows him to do something illicit or leave a duty or delay it or make some haram things to become halal, however, certain conditions should be applied, such as: (i) necessity exists in reality and is not illusory, potential, or expected; (ii)there will be no other permissible ways to prevent the evil other than those which contradict Shariah;(iii) they should be limited to the needed amount and should be restricted to the duration of the excuse to drive the evil away only, because necessities should be evaluated in a proper and carful manner and the principle that states that If cause of forbiddance disappears, the forbidden thing reappears (Al-Qardawi,2005; Ibin Juzai,2005). 27 SAC, at its second meeting on 21 August 1996, discussed the status of MH stocks and concluded that they can be included in the list of Shariah-compliant Securities based on certain screening criteria (See SAC, 2007, P.150).

20
―If a situation faces a problem, Shariah allows for a way out.‖
―Something forbidden which occurs widely (and which is difficult to avoid), Shariah brings
relief to those affected‖.
They also argue that, if a company‘s primary business is Halal but it keeps its surplus income
in an interest bearing account, for instance, the fact that it receives a small incidental (non-
operating) interest income will not render all of the company‘s business Haram (Usmani,
2010), based on the figh principle that mixing an immaterial proportion of Haram with a
majority of Halal does not render the whole entity Haram (Al-Quradaqi, 2002). Moreover,
based on the figh discussion, if there is an invalid Haram condition in the contract, this does
not render the entire contract invalid (Al-Zuhayli, 2005, 2009). Finally, it is argued that
investing in certain companies (e.g. utilities, infrastructure industries) has importance and
general benefit for Muslim nations and countries, given that the Haram element is very small
(Al-Quradaqi, 2002; Al-Shubali, 2005; SAC, 2007).
This debate among Shariah scholars, especially among those who seek to discourage
investment in MH stocks, had made Muslim involvement in the stock markets very scant
during the past few decades. Nevertheless, changes took place in the 1990‘s due to the
development of more open jurisprudence views and allowing MH equity investments, led to
the emergence of several Islamic indices (Hussein and Omran, 2005; Hassan and Lewis, 2007)
and attracted more interest in Islamic equity investment.
Nonetheless, allowing investments in MH stocks is not ideal, and is rather, a contemporary
stage, and thus, further steps should be taken to encourage Islamic funds and investors to move
towards investing in only pure Halal investee companies (Al-Tunaji, 2009). Therefore, these
Shariah views on MH stocks, has led some to call for the fatwa on investing in mixed
companies to be revisited in light of the growth of these purely Islamic companies (Al-Tunaji,
2009) especially in GCC region (elaborated in the next chapter). This is because the fatwa

21
allowing MH stocks is restricted to the need and necessity for such investment which may no
longer exist nowadays (Al-Quradaqi, 2002; Al-Khalel, 2005; Al-Shubali, 2005; Al-Tunaji,
2009; Al-Nifasa, 2010).
Therefore, contrary to other Islamic fund studies, this thesis is motivated in providing empirical
evidence as whether there is still a need to invest in MH stocks in Kuwait, as case study of the
GCC, considered the hub of Islamic finance and investment, triggered by their mounting oil
wealth and economic growth (El-Qorchi, 2005; Hasan and Dridi, 2010; KFH research, 2011).
In particular, this thesis examines whether it is possible to create a diversified portfolio of pure
or at least close to pure Halal portfolios without paying a penalty. If there is no significant
downside for using the ‗stricter‘ definitions of Shariah-compliant portfolios, then there is a
valid reason to justify banning investments in MH stocks by Islamic funds based on the current
screening criteria (see Appendix 1.1 for AAOIFI‘s screening criteria). However, if there is a
cost to such strict Shariah screens, investors can decide on whether or not they wish to limit
their investments to a restricted set of investments in PH stocks or continue investing in MH
stocks depending on their religious values. Henceforth, unlike the prior research on the topic,
this thesis investigates the screening and performance of ‗pure‘ Halal (PH) stocks, ‗mixed
Halal‘ (MH) stocks, ‗mixed sin‘ (MS) stocks, and ‗sin‘ stocks of various sectors under
different market conditions.
Further, the current thesis seeks to discover the impact of using an appropriate Shariah-
compliant alternative as the risk-free rate when measuring the risk-adjusted performance of
Halal portfolios. This is based on the argument that conventional portfolio performance
evaluation measures fail to account for the ethical and Islamic motives of investors (see
Rahimie, 2010, Ooi and Lajbcygier, 2013). In particular, traditional portfolios performance
measures, the Sharpe and Traynor ratios, use interest-based instruments such as T-bills as a

22
proxy for the risk-free rate which is banned in Shariah. Finally, the thesis explores the key
factors that impact on stocks performance and whether the Shariah classification of stocks to
PH, MH, MS, and Sin is important (before and after reducing the screening thresholds).
This thesis contributes to the limited research on the performance and screening of Islamic
funds as it bridges the gap between the professional and academic research. The findings of
this thesis will support SSBs, regulators (including AAOIFI), and policy makers on deciding
whether to revisit the current Shariah screening criteria of MH stocks and pave the way to
develop Shariah alternative evaluation measures and benchmarks that are interest-free. The
results of this thesis are also of interest to Islamic fund managers and investors, as it provides
insights into stock selection and screening processes, and asset allocation strategies that may
generate higher financial returns under different market conditions.
1.5 Thesis Structure
The remainder of the thesis is structured as follows. Chapter 2 provides the background to the
equity investment environment in the GCC and to Islamic investment development in
particular. It presents an overview of the GCC economies and the historical development of
their stock markets with more emphasis on Kuwait. The final part of the chapter sheds light on
the development of Islamic investment industry in the GCC.
Chapter 3 contains a comprehensive review of the academic literature on the screening and
performance of ethical and Islamic funds. First, this chapter supplies an overview of modern
portfolio theory (MPT). Second, it offers a background to ethical and faith-based investment
funds. Then the chapter reviews the prior research on the screening and performance of ethical
funds and finally it discusses the literature on the screening and performance of Islamic funds.
The research methodology and methods used in this study are elaborated in Chapter 4. In
particular, it gives an overview of the different philosophical underpinnings of social research

23
whilst it outlines the philosophical assumptions adopted for the inquiry of this thesis and hence
the research paradigm and methods. The research methods (qualitative and quantitative)
employed are discussed briefly and their appropriateness within the chosen functionalist
paradigm. More details of the research methods are elaborated in the relevant empirical
chapters.
The empirical research is discussed in chapters 5-8. Since the literature on the performance and
screening of Islamic equity investments is dearth, the thesis attempts first to gain information
related to Islamic fund screening processes, and of performance evaluation measures from a
wide number of key practitioners who were interviewed, including Islamic fund managers,
SSBs, investors, and regulators. The results of the 58 semi-structured interviews form the
content of Chapter 5. Further, this chapter analyses whether the Islamic funds are good
investments from a Shariah point of view. Particularly, the results provide views on the
concept of Halal equity investments (PH and MH), the screening criteria, the necessity to
revisit the screening criteria of MH stocks, current methods of portfolio performance
evaluation and the appropriateness of using traditional portfolio evaluation measures.
Chapter 6 creates different Halal portfolios based on the screening definitions suggested by the
interviewed practitioners and the literature using a content analysis of companies‘ annual
reports. Particularly, the chapter describes the qualitative and quantitative Shariah screening
process and reports the screening results of companies before and after halving the screening
thresholds to examine the impact of applying different screens on the size of the Halal asset
universe.
Chapter 7 examines the performance of the different portfolios created in Chapter 6. This
chapter presents the results of the quantitative analysis to understand the return and risk
characteristics of the Halal (PH and MH Halal) and non-Halal (Sin and MS) portfolios under

24
different screens during the sample period (2006-2011) which includes 3 sub-periods (bullish
period 2006/7, financial crisis period 2008/9, and bearish period 2010/11). The chapter
employs various parametric and non-parametric statistical tests of portfolios returns and the
three traditional risk-adjusted returns, namely: Sharpe (1966) Treynor (1965), and Jensen
(1968). The final part of the chapter shows the portfolios‘ performance after replacing the risk-
free rate component of traditional performance measures with a Shariah-compliant one (the
Murabahah28
rate of return).
Chapter 8 takes the analysis of Chapter 7 a step further by applying two different approaches,
namely; a matched pairs approach, and a general linear model (GLM). The matched pairs
approach controls for firm‘s size and sector when comparing the performance of different
Halal and non-Halal portfolios, whereas, the GLM is fitted to the data to test for the source of
variance in the returns of Kuwait Stock Exchange (KSE) equities by examining the importance
of Shariah classification of stocks to Halal and non-Halal under the current and halved
screens, a firm‘s size, sector, and the impact of the GFC period. Specifically, this is to discover
whether the Shariah classification of stocks (before and after reducing the screening
thresholds) affects performance.
Finally, Chapter 9 concludes the current thesis. It summarizes the main findings that have
emerged from the empirical analysis. The chapter highlights the contributions of the study as
well as suggesting result policy implications. Further, the chapter outlines limitations of the
current study and concludes by suggesting avenues for future research.
28 Murabahah is the resale of assets or goods with an agreed upon profit mark-up on the cost, for instance the bank agrees to buy as asset from a third party and then resell it to its client with a mark-up, the client purchases the asset either immediate or deferred payment (Mirakhor and Zaidi, 2007). A main deference between Murabahah and interest-based lending is that the mark-up is not stipulated in terms of time period; hence, if the client fails to make a deferred payment on time, the mark-up does not increase. Further, the bank owns the asset between the two sales, thus bears the associated risks (see Mirakhor and Zaidi, 2007).

25
1.6 Summary
This chapter has introduced the reader to the thesis which follows. It first sheds light on Islam
as a way of life and its components, namely: Aqidah (belief); Akhlaq (ethics and morality); and
Shariah. The chapter asserts that Islamic investment and finance is rooted under the
commercial transaction discipline that forms a significant segment of Shariah, which cannot be
isolated from ethics and beliefs as they are all integrated components of Islam. The sources of
Shariah have been discussed briefly. The subject of this thesis (MH equity investments) falls
under one of the secondary sources of Shariah, namely Ijtihad, as qualified Shariah scholars
apply their own reasoning to come up with an opinion on the Shariah-compliance of investing
in MH companies. This explains why there is a debate among Shariah scholars about the
compliance of MH stocks and their screening criteria. In addition, it shows the potential to
revisit the old Ijtihad that allowed MH equity investments in the 1990‘s based on updated
information and empirical evidence that may emerge from this thesis. The thesis examines
Shariah views on MH stocks and whether the fatwa on investing in them should be revisited as
many Shariah scholars agree that MH investment are not ideal, and further steps may need be
taken to encourage Islamic funds to move towards making only pure Halal investments only.
Therefore, this thesis is interested in examining the issues associated with the creation and
performance assessment of the Halal and non-Halal portfolios. Particularly, the qualitative
analysis (interviews) explores first whether Islamic funds are currently good investments from
a Shariah perspective, and if there is a need to revisit the tolerance of MH screening criteria. In
addition, the quantitative analysis (Chapters 6-8) investigates whether Islamic funds are good
investments from a financial perspective. Particularly, the empirical chapters examine if it is
possible to create diversified pure portfolios or at least MH but close to pure Halal portfolios,
without bearing a financial cost. Further, this study empirically investigates whether it is the

26
Shariah classification of stocks, firm‘s size, sector, and the GFC period that impact
performance. Hence, if there is no significant cost for PH investments, having ‗stricter‘
Shariah-compliant portfolio, and Shariah classification of stocks is not affecting performance,
then there is a valid reason for Shariah scholars to justify banning investment in MH stocks
based on current screens. Finally, the chapter outlines the structure of the thesis and highlights
the material contained in the subsequent chapters.

27
Chapter 2: An overview of the Gulf Cooperation Council (GCC)
Stock Markets and Islamic Investment Industry

28
2.1 Introduction
This chapter provides the background to the context of the present study, and presents a
description of the investment environment for Halal and non-Halal stocks in the GCC region
with an emphasis on Kuwait. It introduces the reader to the economies of the Gulf Cooperation
Council (GCC) countries and the development of their stock markets. It highlights their
performance in light of the global financial crisis (GFC) and the ‗Arab Spring‘ political crisis.
Furthermore, the chapter sheds light on the development of Kuwait‘s economy and stock
exchange. Finally, the chapter attempts to provide insights into the Islamic finance and
investment industry in the GCC. More weight has been given to Kuwait, as it will be the main
context of the empirical investigation of this thesis.
The remainder of the current chapter is organized as follows. Section 2.2 outlines and discusses
the GCC countries‘ historical and economic background. Section 2.3 then presents an overview
of the performance of the GCC stock markets, while section 2.4 elaborates on the development
of the KSE. An overview of the Islamic finance and investment industry in the GCC is
provided in section 2.5, with a focus on Kuwait. Finally, section 2.6 offers some preliminary
conclusions.
2.2 An Overview of the Emerging GCC Stock Markets
On May 25, 1981, Bahrain, Kuwait, Oman, Saudi Arabia, and the United Arab Emirates
(UAE) established the Gulf Cooperation Council (GCC) (Mohanty et al., 2011). These Arab
countries share similar characteristics, such as their religion, language, history, traditions, and
geography (Abu-Hassin, 2010).29
The aim of the GCC was to build political and economic ties
29 Shariah is the principal source of law in the GCC, but is generally adopted in matters such as family matters, succession, and applied to some extent torts and criminal law.

29
among these six counties members.30
Previously, these countries had been colonized by the
west but Saudi Arabia gained independence from Britain in 1934 and Oman gained it in 1650
after the departure of the Portuguese colonists, Kuwait gained its independence from British
colonization in 1961, while Bahrain, Qatar, and the UAE achieved theirs in 1971(Jamhour,
2011).
The GCC states are located on the west coast of the Arabian Gulf,31
and extend from the
southern borders of Iraq and Jordan to the northern borders of Yemen and eastwards to the Red
Sea, as shown in Figure 2.1 below. Saudi Arabia accounts for about 83% of the land area of the
GCC region and 65% of its population, while Oman is the second largest in terms of land area
but third with regard to population size, after the UAE, while Qatar and then Bahrain follow
Kuwait in terms of both land area and population (see Appendix 2.1).The GCC region has a
huge desert landscape, with no rivers or lakes and infrequent rainfall except in Oman and
certain cities in the south of Saudi Arabia.
30
Particularly, Article (4) of the GCC Charter (as reported in the GCC customs union report, 2012, p.7) outlined that the basic objectives of the Cooperation Council include, inter alia, “to effect coordination, integration and inter-connection between Member States in all fields in order to achieve unity between them”. Nevertheless, the essential motive in creating the GCC block was to strengthen the political security and economic interests of those countries in the face of the political instability during that time in the region, due to the Iranian revolution occurring in 1979 and the First Gulf War between Iraq and Iran breaking out in 1980 (Jamhour, 2011). 31 Iranians call this body of water the "Persian Gulf" while Arab countries call it the "Arabian Gulf" or "Arabic Gulf" or "Arab Gulf". The name Persian Gulf is still recognized by as the legal international standard by the United Nations. Iran has warned Google it will face "serious damages" if it does not denote the area as the Persian Gulf. Further, when the National Geographic Society decided to feature both terms in its 2004 world atlas edition, Iranians launched a huge internet offensive. In 2010, it warned that airlines using the term Arabian Gulf on in-flight monitors would be barred from Iranian airspace. (See: http://www.bbc.co.uk/news/world-middle-east-18108246 )

30
Figure 2.1: The GCC Countries and the Surrounding Region
Source: Department of Geography, Kuwait University
The stock markets in the Middle East are fairly recent compared to the developed markets in
the west, yet grew quickly (Al Mutari, 2011) prior to the GFC (Balli et al., 2013). The GCC
countries have implemented economic reforms in recent decades, including financial
liberalization (Akoum et al., 2012) allowing foreign investors directly to purchase stocks in
that country‘s markets (Henry, 2000). In this context, the GCC‘s policy of removing capital
flow restrictions has led to more openness across the region (Bley and Saad, 2011).
The GCC market liberalization, and the accumulation of wealth and liquidity has contributed to
the emergence of the formal trading of securities and the establishment of stock markets in the
region (Bley and Chen, 2006; Al-Hunnayan, 2011; Akoum et al., 2012). Although some form

31
of trading in securities had existed in the GCC region since 1935, it was not until the 1980s that
formal stock markets were established in the GCC, as shown in Table 2.3.
Table 2.3: The Development of the GCC Financial Markets
Country Stock
Trading
Begins
Current
Market
System
Established
Electronic
Trading
Since
Foreign Investment Ceiling for Listed Stocks
Bahrain 1957 1987 1987 49% in general, 10% for a single entity; some banks &
insurance companies are 100% open to foreign ownership;
100% in general for GCC nationals.
Kuwait 1952 1983 1995 100% in general, 49% for some banks.
Oman 1988 1998 1998 Up to 70% with further restrictions at the company level;
restrictions may differ for GCC nationals.
Qatar 1997 1997 2002 25% in general.
Saudi
Arabia
1935 1985 1988 25% for GCC nationals; other foreign investors may access
the market via mutual funds managed by Saudi banks.
UAE 1989 2000 2000 49% in general, through different restrictions may apply to
individual companies; 100% for GCC nationals with the
company‘s approval.
Note: This table shows the development of the GCC stock markets and the restriction on foreign investment,
stating when stock trading began, the current stock market system, and the date when electronic trading was
established in each GCC country. The last column outlines the foreign investment ceiling for investing in listed
stocks.
Source: Bley and Chen (2006) and Standard and Poor‘s Global Stock Market factbook (2009, p.338) for the
foreign investment restrictions information.
Table 2.3 outlines the development of the GCC financial markets, revealing that trading first
started in Saudi Arabia; the oldest stock market in the region was established in Kuwait in
1983, while the newest financial markets are found in the UAE [the Dubai Financial Market
(DFM) and the Abu Dhabi Securities Market (DIFX)]. Table 2.3 shows that the most open
market for foreign investment is the KSE, while the Saudi Arabia stock market is the most
restricted, as foreign investors may access it only via mutual funds, as reported by Standard &
Poor‘s (2009, p.338). The market liberalization in Kuwait compared to other GCC countries

32
has contributed positively to the stock market. According to Standard & Poor‘s (2009, p.341),
there are no restrictions on entering or exiting the financial market in any GCC country, with
the exception of Saudi Arabia. Compared to other emerging markets, the GCC financial
markets are currently vastly advanced in terms of regulations and technology, as the stock
exchanges are electronically linked with the banks, settlement and clearing agencies, and
brokerage firms for the faster, more reliable execution of transactions (Al-Hunnayan, 2011).
The financial markets in the GCC are the largest in the Middle East region in terms of market
capitalization and volume (Al-Mutari, 2011) and the Saudi financial market is the largest in the
MENA countries (Al-Mutari, 2011). According to Standard & Poor‘s (2009, p.30), of the top
40 stock markets around the world, Saudi Arabia stock market is ranked 21st and 20th in the
world for total market capitalization and total traded value respectively, followed by Kuwait.32
Table 2.4 shows the number of listed companies, market capitalization, and value and volume
traded from 2002-2012 for each GCC stock market.
32 The UAE’s two financial markets and Qatar (ranked 32nd and 29th, 35th and 28th, and 40th in both cases, respectively. The Omani and Bahraini stocks markets were not among the MSCI top 40 stock markets.

33
Table 2.4: Overview of GCC Stock Markets; Number of Listed Companies, Market Capitalization, Value and Volume Treaded,
from 2002-2012
2002 2003 2004 2005 2006 2007 2008 2009 2010 2011 2012
Number of Listed Companies
Bahrain 42 42 42 47 49 43 45 49 44 44 40
Kuwait 95 108 125 158 180 196 204 204 214 213 211
Oman 96 96 96 96 124 120 122 120 119 136 144
Qatar 25 28 29 31 36 40 42 48 43 42 42
Saudi Arabia 68 70 73 77 86 111 127 135 146 150 157
UAE 37 44 53 89 102 120 130 133 130 130 130
Total 363 388 418 498 577 630 670 689 696 715 724
Market Cap. (US$ bn)
Bahrain 7.60 9.70 13.50 17.40 21.10 27.00 19.90 16.92 20.82 17.20 16.00
Kuwait 35.80 61.50 75.20 142.10 143.80 210.50 121.10 96.30 128.76 105.30 100.00
Oman 5.20 6.60 7.60 12.70 12.90 23.00 15.00 17.32 19.97 18.30 20.10
Qatar 10.60 26.70 40.40 87.10 60.90 95.50 76.70 87.84 123.63 125.60 126.30
Saudi Arabia 74.90 157.30 305.90 646.00 326.30 519.00 246.50 318.73 352.49 338.80 373.40
UAE 29.90 39.60 82.30 231.40 168.70 257.40 132.00 135.86 104.76 93.80 103.20
Total 164.00 301.40 524.90 1136.70 733.70 1132.40 611.20 672.98 750.42 699.00 739.00
Value Traded (US$ bn)
Bahrain 0.20 0.30 0.50 0.70 1.30 1.10 2.10 0.48 0.29 0.30 0.30
Kuwait 22.70 55.10 51.80 97.60 59.20 135.50 129.70 75.52 44.43 21.80 25.90
Oman 0.60 1.50 1.90 3.60 2.30 5.20 8.70 5.93 3.42 2.50 2.60
Qatar 0.90 3.20 6.40 28.30 20.50 29.90 48.20 25.52 18.44 22.90 15.60
Saudi Arabia 35.70 159.10 473.00 1103.70 1402.80 682.10 523.50 336.87 201.91 292.90 514.10
UAE 1.10 2.00 18.20 140.60 120.40 151.00 146.30 67.83 28.27 15.50 19.40
Total 61.20 221.20 551.80 1374.50 1606.50 1004.80 858.50 512.15 296.76 355.90 577.90
Volume (million stocks)
Bahrain 353 406 336 458 728 851 1,676 852 612 519 628
Kuwait 27,834 49,563 33,544 52,338 37,658 70,433 80,924 106,411 74,692 38,343 84,243

34
Oman 192 315 345 512 926 2,989 4,199 6,062 3,019 2,366 4,142
Qatar 80 190 317 1,033 1,865 3,411 3,894 3,450 2,094 2,303 1,760
Saudi Arabia 11,430 35,414 63,675 70,996 73,439 58,862 59,683 56,647 33,007 48,536 86,134
UAE 209 561 6,069 34,146 51,356 157,318 126,344 152,363 55,953 40,964 56,902
Total 40,098 86,449 104,286 159,483 165,971 293,864 276,718 325,786 169,377 133,031 233,808
Note: this table outlines the number of listed companies, total market capitalization, total value traded, and volume of stocks traded in each GCC stock market for 2001-
2012. The UAE figures are an aggregate of the Dubai and Abu Dhabi stock markets. The market capitalization and value traded are measured in US $ billion units, while
the volume is measured in million stocks.
Source: Global House Research database, KAMCO research GCC equity Market reports (2011, 2012, 2013), World Bank online database: http://data.worldbank.org ,
and countries respective stock market websites; Bahrain Stock Market: http://www.bahrainbourse.net, Oman (Muscat Securities Market); http://www.msm.gov.om/,
Kuwait Stock Exchange (KSE): http://www.kse.com.kw/A/, the Saudi Financial Market (Tadawul): http://www.tadawul.com.sa/, and finally in UAE, (i) Abu Dhabi
Securities Exchange (ADX): http://www.adx.ae/, (ii) Dubai Financial Market (DFM): http://www.dfm.ae/.

35
A visual inspection of Table 2.4 reveals that despite the variation across different years, the
Saudi stock market accounts for almost half of the total GCC market capitalization, and is
greater than the other five GCC stock markets combined in terms of traded value followed by
the KSE. However, the KSE is the largest stock market in the region in terms of the number of
listed stocks across all years, except for Oman in 2002.33
The volume of traded stocks in the
KSE was originally the highest in the GCC, after which the Saudi Stock Market caught up,
suggesting that these stock markets are the most liquid in the GCC region. The numbers of
listed companies in all GCC stocks markets increased in 2005 and 2006, and remained fairly
stable after the GFC of 2008 but, in 2010, some companies were delisted from certain stock
markets, such as in Bahrain, Oman, and the UAE. Most delisted firms were small and young
investment companies that struggled to meet debt obligations after the GFC or companies that
violated financial reporting requirements such as report earnings on time (see Al-Arabiya,
2012).34
The trading activities in the GCC stock markets are low.35
Al-Mutari (2011) suggested
that this may be because: (i) GCC stock markets have a relatively low investors‘ participation
rate, as the number of active investors is less than 3% of the total adult population compared to
more than 20% in developed markets;36
(ii) GCC governments own a significant portion of
many of the listed stocks and tend to hold them for long periods, which essentially reduces
market liquidity; (iii) the role of institutional investors remains thin or absent compared to
developed markets; (iv) despite the stock market liberalization in most GCC countries, foreign
33 Oman and Bahrain are the smallest of the GCC stock markets in terms of market capitalization and value traded. But, in 2007, the Oman (Muscat) stock market experienced remarkable growth in terms of market capitalization, value and volume traded. 34 Hudson (1987) reports that the majority of companies which go to liquidation are small and young companies, he also reports that regions and industries affect companies’ liquidation. 35 The total traded value and volume is thinner in Bahrain, Oman, Qatar, and the two individual UAE stock markets (ADX and DFM). 36 The low participation rate of local investors could be due to the small number of listed stocks or the lack of diversification opportunities across different sectors; for instance, the banking sector overcrowding the market, while stocks of service and industrial companies are scarce (Al-Mutari, 2011).

36
access restrictions hinder foreign direct investment, leading to markets that are dominated by
domestic retail investors, who tend to exhibit less sophisticated investment behavior than
institutional investors (Sturm et al., 2008).
In 2006 there was a significant drop in the market capitalization of the Saudi, Qatar and UAE
stock markets after the burst of the speculative bubble in the GCC markets (Sturm et al., 2008;
Hertog, 2012). Sturm et al. (2008) indicate that the 2006 market correction was not a result of a
real economic crisis and did not have a negative impact on economic activity.37
Saidi (2006)
highlights that higher equity prices have driven investment and corporate borrowing based on
expected returns, buoyant domestic demand and robust cash flows. Kuwait was less affected by
the 2006 crash as it witnessed only a relatively small correction of its stock market (Sturm et
al., 2008). The 2008 GFC, however, hit all GCC stock markets, causing them to lose one-third
or less of their value (Hertog, 2012) as shown in Table 2.4. The total GCC market
capitalization fell from US$ 1132.40 billion in 2007 to US$ 611.20 billion in 2008 (a drop of
62%). Furthermore, a further drop in market capitalization occurred in 2011, affecting most
markets (except Qatar). This coincided with the Arab Spring in the MENA region and the
domestic protests in Kuwait, Bahrain, and Oman. Nevertheless, the 2011 drop was much less
than that of 2008. This negative momentum continued to influence in the KSE in 2012 but to a
lesser extent. The total value of stocks traded also fell during these years from 1606.5 US$
billion in 2006 to 1004.8 US$ billion in 2007 (a 47% reduction) and from 858.5 US$ billion in
2008 to 512.2 and 296.8 US$ billion in 2009 and 2010 (further drops of 52% and 55%)
respectively, although it picked up in 2011 and 2012.
Figure 2.1 plots the performance of the Morgan Stanley Capital International (MSCI) US$
price index for all GCC countries, and was chosen because it is the most common index across
37 Some interviewees in Chapter 5 assert that the few listed stocks (concentrated in certain sectors), low free floats and limited alternative investment vehicles such as bonds had caused the bubble in GCC stock markets in 2005-2006.

37
all six countries, measured in US$.38
Further, Appendix 2.2 compares the performance of the
official KSE and MSCI Kuwait indices visually.
Figure 2.2: Performance of GCC Stock Markets: June 2005- Dec. 2012
Note: this figure plots the performance of the MSCI US$ price index for each of the six GCC states, indexed from
100 points for June 2005- December 2012.39
Source: Weekly data were extracted from the Thomson Routers DataStream
Figure 2.2 shows the correction among GCC markets and the shock that hit all markets in
2006, with less impact on KSE, as reported earlier. The figure also shows the GFC impact in
the region, in 2008, causing the severe slowdown of the financial sector due to the high
leverage of many financial institutions, utility and real-estate companies, especially in Dubai
(Ellaboudy, 2010). Indeed, the range, depth, and damage caused by the GFC was worse than
that caused by the Great Depression of the 1930s (Ellaboudy, 2010). Figure 2.2 illustrates that,
overall, the KSE performed the best of the GCC stock markets from 2005-2012.40
Figure 2.2
shows small reactions associated with political instability after the Egyptian revolution on the
38 The data were only available from June 2005. 39 There are some missing data from the MSCI Saudi price index for the period 29/9/2010-29/6/2012 as the price index remained constant during this period. 40 It is worth noting however that the Qatar MSCI index managed to catch up after the Arab Spring, which could be attributed to Qatar’s successful domestic and regional policy towards this political event (Davidson, 2013).
0
20
40
60
80
100
120
140
160
180
200
Bahrain
Kuwait
Oman
Qatar
S.A
UAE

38
25th
of January 2011, for Kuwait, Saudi Arabia, and the UAE which have significant direct
investments in Egypt‘s telecommunications, real estate and other sectors (Capital Standards
Report, 2011). According to KAMCO research (2012) several key developments occurred in
2012, with the implementation of the regulations of the Capital Markets Law issued by the
Capital Market Authority (CMA)41
in Kuwait, the recovery of the real estate sector in Dubai
and the announcement by the Saudi CMA that allows listings by foreign companies. Moreover,
the government backup of the key economic and financial sectors has supported and enhanced
the performance of stock markets with steady growth in corporate earnings (KAMCO research,
2012).
This section has provided an overview of the GCC economies and their stock markets in light
of the recent financial and political crisis, which presents a contextual background to this
thesis. The next section focuses on Kuwait financial system and particularly on the historical
development of KSE which is the stock market investigated in this thesis.
2.3 The Development of Kuwait Stock Exchange (KSE)
The KSE was the first stock exchange in the GCC region, starting with initial public offering
(IPO) of the National Bank of Kuwait (NBK) in 1952 that became the first shareholding
company (Al-Shamali, 1989). The 1960s witnessed several IPOs of companies in different
economic sectors, and investment demand started to increase, coupled with the substantial
increase in financial revenues after the oil exploration (Al-Yaqout, 2006). During this period,
stocks were traded through real estate brokers and in public cafes and prices were determined
by market forces of each individual location (Al-Shamali, 1989; Al-Yaqout, 2006). This
continued until 1970, when Law No. 32 was issued to regulate the trading of securities of
public shareholding companies, to oversee trading activities and, most importantly, it paved the
41 See Kuwait Capital Market Authority Website: http://www.kuwaitcma.org/.

39
way towards establishing a formal stock market in Kuwait (Al-Yaqout, 2006; Almujamed,
2011; Al-Wasmi, 2011). In February 1972, the first formal stock market in Kuwait was
established, first operating under the Ministry of Commerce and Industry with the supervision
of the Securities Department, later replaced by a market committee with higher authority and
responsibilities (Union of Investment Companies, 2008). By 1982, 40 companies were traded
on the exchange, annual trading volume was about $7 billion and total market capitalization
was approximately $30 billion (Butler and Malaikah, 1992). An unofficial parallel stock
exchange market (an over-the counter market) also evolved in 1972, known as the Almanakh
Market (Butler and Malaikah, 1992). This market began trading stocks in Kuwaiti and other
Gulf-based companies next to the official Kuwaiti exchange to circumvent the regulations
established by the government to govern stock trading (Butler and Malaikah, 1992; Al-Wasmi,
2011; Al-Mutari, 2011). The main difference between the official and unofficial markets was
the use of forward contracts based on post-dated cheques (Butler and Malaikah, 1992). The
absence of a legal framework created bubble in stock prices, inflating them to more than ten
times their face value (Abumustafa, 2007; Almujamed et al., 2013).42
Investors started to
cancel their post-dated cheques before the due date and confidence dissipated among them,
transforming the KSE to became illiquid, and collapse in 1982 (Abumustafa, 2007;
Almujamed, 2011). The Almanakh stock market crisis led to $93 billion in losses; $17 billion
on the official market and $76 billion on the unofficial one (Butler and Malaikah, 1992).43
The
government intervened after this crisis to boost confidence, competence and efficiency in the
KSE; with new regulations related to stock trading control, information disclosure, securities
42 Among the reasons for the Almanakh Market crash, as reported by many academics, are: (i) stock prices that were derived from rumour rather than fundamentals; (ii) a dearth of investment and financial experience and knowledge among investors, (iii) insider trading, and (iv) a fall in market liquidity as large numbers of post-dated cheques were used for settlements (Alshimmiri, 2004; Abumustafa, 2007; Al-Sharrah, 2009). 43 For more details regarding the collapse of the Almanakh stock market, see Al-Shamali (1889), Al-Yaqout (2006), and Al-Sharrah (2009).

40
registrations, capital and credential requirements for brokers, restrictions on margin trading
(Butler and Malaikah, 1992; Abumustafa, 2007; Almujamed, 2011; Al-Mutari, 2011). On the
14th
of August 1983, an Emiri Decree was issued establishing the current KSE as an
independent body overseen by both a market committee and an executive management team
(KSE, 2013).44
The KSE opened its doors to the public and with a new trading system that
operated similarly to that of developed stock markets (Almujamed, 2011).
Trading activities became more stable in the KSE after the Almanakh market crash, and a
circuit breaker was later introduced to protect the market from sharp changes in stock prices
(Al-Yaqout, 2006) as detailed in Appendix 2.3.
Transaction costs in the KSE are small as small brokerage fee is charged, to encourage Kuwaiti
and foreign investors to invest in the market (Almujamed et al., 2013).
The market also grew from the privatization program that began in 1993 when the Kuwait
Investment Authority (KIA) started to sell its shares to the public, reaching 90% across 62
companies (Al-Mutari, 2011). In 2000, foreign investors were allowed to directly purchase,
sell, and own up to 100% of listed companies, with earnings not subject to taxation (Al-Wasmi
2011; Almujamed et al., 2013). In addition, the Central Bank of Kuwait (CBK) liberalized the
banking sector by allowing foreign banks to operate in Kuwait, such as BNP Paribas, HSBC
and the National Bank of Abu Dhabi (Al-Mutari, 2011).
The KSE is amongst the most active and technologically sophisticated stock exchanges in the
region (Abumustafa, 2007). The Kuwait Clearing House was established in 1986, which
banned the use of post-dated cheques and in November 1995, it implemented its first electronic
trading system in October 1998; forwards and futures were introduced in August 2003; online
trading started in November 2003; and options have been traded on the KSE since March 2005
44 See the KSE website at: http://www.kuwaitse.com/KSE/About.aspx.

41
(KSE official website, 2013). In late 2009, the KSE signed a partnership contract with
NASDAQ, to create the ―SMARTS‖ surveillance system and a new ―X-stream‖ trading
system. The former was implemented in May 2010, and the first phase of the latter began in
May 2012 (KSE Index Rulebook, 2012).45
Consequently, in 2012, the CMA reclassified the
KSE sectors to bring them into line with global classification standards, in addition to
launching a new index as a benchmark representing the performance of the market. In
particular, listed companies were reclassified into sectors based on the International
Classification Benchmark (ICB). Prior to May 2012, there had been seven industrial sectors:
banking; investment; insurance; industrial; service; food; and non-Kuwaiti firms. However, the
new sector classification added more sectors and reclassified some companies into: oil and gas,
basic material, industrial, health care, consumer service, telecommunications, banks, insurance,
real estate, financial services, and technology. Moreover, in May 2012, ―KSX15‖ was
launched, in addition to the official KSE index which is a market capitalization weighted index
that tracks the performance of 15 companies in the KSE based on size and liquidity; reviewed
and selected semi-annually (KSE Index Rulebook, 2012). Table 2.5 details the constituents of
the KSX15 index.
45 For more details about the X-stream” trading system, the “SMARTS” surveillance system, and the new “KSX15” index, see the KSE rule book (2012) available at: http://www.kuwaitse.com/Portal/Report/Index%20Rulebook%2009052012.pdf

42
Table 2.5: The Kuwait 15 Index (KSX15) Constituents as of December 2012
No Code Sector Sector
(New)
Liquidity
(K.D
million)
Market
Capital
(K.D
million)
Market
Cap Rank
Liquidity
Rank
Weighted
Market
Cap.
(%)
Weighted
Liquidity
(%)
Weighted to
KSE Total
Market Cap
(%)
Weighted to
KSE Total
Market
Liquidity
(%)
1 NBK Banking Banking 243 4310 1 1 22.06 24.46 15.47 10.21
2 ZAIN Services Telecom. 140 3623 2 2 18.55 14.06 13.01 6.00
3 KFIN* Banking Banking 120 2352 3 3 12.04 12.1 8.44 5.00
4 NMTC Services Telecom. 30 1179 4 24 6.04 2.98 4.23 1.24
5 BOUBYAN* Banking Banking 28 1136 5 26 5.82 2.82 4.08 1.18
6 GBK Banking Banking 51 1132 6 13 5.8 5.08 4.06 2.12
7 ABK Banking Banking 11 953 8 44 4.88 1.12 3.42 0.47
8 CBK Banking Banking 34 878 9 22 4.49 3.46 3.15 1.45
9 BURG Banking Banking 41 834 10 18 4.27 4.17 2.99 1.74
10 MABANEE Real Estate Real
Estate
70 806 11 8 4.13 6.99 2.89 2.92
11 FOOD Food Consumer
Goods
15 683 12 38 3.5 1.52 2.45 0.64
12 AGLTY industrials industrials 70 534 13 9 2.73 6.99 1.92 2.92
13 KPROJ Investment Financial
Services
29 528 14 25 2.7 2.92 1.9 1.22
14 KIB* Banking Banking 44 306 15 16 1.57 4.43 1.1 1.85
15 NIND industrials Financial
services
69 277 17 10 1.42 6.9 0.99 2.88
Total 995 19533 130 259 100 100 70 42.00
Total KSE 2383 27859
Note: this table details the KSX15 constituents as of December 2012, showing the codes of theses 15 companies, their corresponding sector under the previous and new
classifications, the liquidity and market capitalization in K.D million units, the weighted market cap., and weighted liquidity within the index and among the overall KSE
stocks. The exchange rate is 0.2815 K.D per $US at the end of December 2012.46
* Denotes Islamic banks that have a Shariah Supervisory board monitoring their
activities.
Source: KSE website, 2013
46 This exchange rate is based on the http://www.xe.com/currencytables database, last visited on 21/3/2013.

43
An inspection of Table 2.5 reveals that these 15 companies represent 70% and 40% of the
KSE‘s total market capitalization and total liquidity respectively. It shows that the banking
sector dominates this KSX15 index in terms of liquidity and market capitalization. Five of the
banks included in the KSX15 are conventional commercial banks while three are Islamic
banks; one of them, Kuwait International Bank (KIB), converted from a conventional to an
Islamic bank in July 2007.47
The top three companies in the index: NBK,48
Zain,49
and KFH,50
represent more than half of the KSX15 in terms of liquidity, and account for 37% and 21% of
the KSE‘s total market capitalization and total liquidity respectively.
The CBK, established in 1969, plays an essential role in facilitating the monetary transactions
of the KSE and acts as the chief regulatory authority of banks, financial companies (Al-Mutari,
2011) and investment funds. In February 2010, the Kuwaiti Parliament passed Law No. 7/2010
regarding the establishment of the CMA as well as Ministerial Decree No. 38/2011 that
reorganized the CBK‘s supervision of finance companies. As of September 2011, the
supervision of investment companies and both Islamic and conventional investment funds was
transferred from the CBK to the CMA, and the role of the CBK became limited to supervising
the financing activities of investment companies (CBK annual report, 2012). The CMA
introduced new regulations in 2011-2013 to increase transparency, protect the rights of
shareholders and investment fund holders, and enhances market performance and
47 The other conventional bank that converted to an Islamic one on April 2010, but is not part of the KSX15 is Ahli United Bank. 48 The National Bank of Kuwait (NBK) was the first commercial bank in Kuwait and the entire Arabian Gulf region, established in 1952 by prominent Kuwaiti merchant families. It was declared the safest bank in the Middle East (2009-2011). For more details, see the NBK website: http://www.nbk.com/aboutnbk/profile/default_en_gb.aspx. 49 Zain is a pioneering mobile telecommunications company in the Middle East that started in 1983 in Kuwait as the region’s first mobile operator. It provides mobile and data services to 42.7 million active individual and business customers in eight Middle Eastern and North African countries, with a workforce of over 6,000 as of the 31st of December, 2012. For more details, see the Zain website: http://www.zain.com/about-zain/ ). 50 Kuwait Finance House (KFH) was the first Islamic bank in Kuwait, established in 1977. It provides Shariah-compliant products and services, covering banking, investment, trade finance, commercial and real estate financing services. KFH was the only Islamic bank in Kuwait until 2004. For more details, see the KFIN website: http://www.kfh.com/en/about/index.aspx

44
efficiency.The CBK has played a crucial role after the GFC to support the financial and
banking system in the country (CBK annual report, 2011).
The KSE‘s market capitalization has consistently been one of the largest in the Arab markets,
and currently accommodates over 200 companies, totaling over US$ 100 billion in market
value. With a market capitalization to GDP ratio of approximately 100%, the KSE has a stock
market which is deeper than many of its regional peers (KSE, 2013)51
. The KSE enjoyed rapid
growth between 1985 and 2008, until the annual value of stocks traded, increasing from
KD115.7 million to KD35.74 billion (CBK Bulletins, 2008).
The price index of the KSE recorded a new high in 2007; it rose from 1365 in 1995 to 12558 in
2007, but declined by 38% in 2008 as a result of a downward trend among the world‘s stock
markets after the GFC (CBK Bulletins, 2008). Nevertheless, there were continual political and
financial problems through the decades. For example, the Iraqi invasion of Kuwait on the 2nd
of
August 1990 led the market to close for two years (Abumustafa, 2007). In recent years, the
KSE has become more sensitive to global financial events, as on the 11th
of September 2001
and GFC in 2008; reacted to shocks like other developed markets (AlMujamed, 2011).
In addition to the global events, KSE was exposed to local political unrest during 2009-2012
impacting the KSE‘s performance and slowed down economic projects (KAMCO, 2012).
Kuwait has the longest history of political participation in the Middle East and implemented
the most democratic political system among GCC countries (Al-Wasmi, 2011; Sabrie and
Hakala, 2013) thereby, it has faced political challenges.52
The political situation, however,
became more stable following the liberation of Kuwait from the Iraqi invasion of 1990 when
51 See Kuwait Stock Exchange (KSE) website : http://www.kuwaitse.com/KSE/About.aspx 52 In June 1961, the Emir, Abdullah Al-Salim Al-Sabah, promulgated the country’s first constitution which outlined that it is a hereditary Emirate state with a parliamentary system of government, where sovereignty rests with the nations and is the source of power (Sabrie and Hakala, 2013). However, there were struggles between key members of the Sabah ruling family and the Parliament, leading to the suspension of both the constitution and Parliament in 1976 and 1986 (Salem, 2007).

45
Parliament resumed its central role, and the country witnessed several economic reforms
(Salem, 2007). As parliament enjoys considerable freedom and authority, compared to other
GCC countries, in 2006, the opposition aggressively questioned key cabinet members of the
Sabah family, particularly the Prime Minister (Nasser Al-Mohammed Al-Sabah), about their
alleged misuse of state funds and corruption (Salem, 2007; Davidson, 2013; Sabrie and Hakala,
2013). This led to continued political distress until the Emir demanded the dissolution of the
parliament and called for new elections in May 2008 (Sabrie and Hakala, 2013), but the
previous prime minister was reappointed and therefore the political disputes escalated. This is
because, although parliament plays a significant role in legislating and holding the executive
accountable, it does not have the power to formulate the government or name the Prime
Minister. In October 2012, the Emir dissolved this new parliament after only a few months and
called for early elections again in December 2012 but under a new election law. This caused
the opposition and youth activists to lead mass protests to boycott the elections (Sabrie and
Hakala, 2013). Nevertheless, it is believed that KSE will continue to persist despite these
negative political events based on the positive economic growth assisted by robust oil prices,
expected improvement in liquidity, investors‘ confidence of the implementation of CMA
regulations (KAMCO, 2012). Further, this optimistic view is supported by the argument that
following each political dispute and the Emir dissolving parliament, as in 1999, 2006, 2008,
2009, and 2012, new elections are called and the situation becomes more stable, indicating that
KSE copes with these short term political unrests.
Having discussed the investment environment of the GCC countries and of Kuwait in
particular, the final section of this chapter provides an overview of Islamic finance and
investment in the region which is of interest to this thesis.

46
2.4 An Overview of Islamic Finance and Investment Industry in the GCC
The Islamic finance industry is claimed to be one of the fastest growing industries, with a
growth of between 15 to 20% per annum for the past decades (Yaacob and Donglah, 2012).
The amount of Islamic assets under management expanded from US$ 150 billion in the mid-
1990s to US$ 1.14 trillion in 2011, and is expected to cater to a growing Muslim population of
2.5 billion by 2020 (Malaikah, 2012). Islamic finance, in less than a decade, has evolved from
a niche to a mainstream industry in the international financial system, growing not only in
Muslim majority countries like Malaysia, Indonesia, and the GCC but also in other regions,
such as the UK, Australia, France, Luxembourg, Hong Kong and South Korea (Global Islamic
Finance Forum Guide Book (GIFF), 2010). Hence, there are now more than 300 IFIs spread
across more than 75 countries worldwide (Ayub, 2007). For example, the UK is a leading
western country in Islamic finance, with $19bn of reported assets, largely based on HSBC
Amanah, 22 banks (five of which are fully Sharia compliant), 37 Sukuk53
issues raising $20bn
currently listed on the London Stock Exchange, including 10 listed in 2011, and 25 law firms
providing services in Islamic finance (the UK Islamic Finance Secretariat (UKIFS), 2012). The
Islamic finance and investment industry is expected to prosper even post the 2008-2009 GFC,
as there is plenty of room for further growth in the asset management activities and Sukuk
issuance, coupled with generic growth in the IFI (Mirakhor and Zaidi, 2007; Alqahtani, 2012).
53
Sukuk is the plural of the Arabic word ‘Sakk’, meaning “legal instrument, deed, check” and is the Arabic name for Shariah-compliant financial certificates, which are commonly referred to as the Islamic equivalent of bonds (Alqahtani, 2012). In particular, Sukuk are certificates of ownership of the underlying assets that are transferred to a large number of investors; they provide a stable income and are tradable (Tariq, 2004; Mirakhor and Zaidi, 2007). AAOIFI (2010, p.307) defines Sukuk as: “Certificates of equal value representing undivided shares in ownership of tangible assets, usufruct and services or (in the ownership of) the assets of particular projects or special investment activity, however, this is true receipt of the value of Sukuk, the closing of subscription and the employment of funds received for the purpose for which the Sukuk were issued”. The difference between Sukuk and companies’ stocks is that they are certificates of equal redeemable value representing undivided shares in ownership of the tangible assets of particular projects or specific investment activity, usufruct and services (Ayub, 2007). Sukuk are attractive investment instruments for IFIs and funds that cannot invest in conventional securities (Wilson, 2008). See the AAOIFI Shariah standards (2010), Tariq (2004), Mirakhor and Zaidi (2007), Al-Amine (2008), Wilson (2008) and Alqahtani (2012) for more details about the different types of Sukuk.

47
The emergence of Islamic finance and investment can be traced back to 1963 by the pioneering
effort led by Ahmad Elnaggar, which took the form of a savings bank based on profit-sharing
in the Egyptian town of Mit Ghamr , followed by the Nasser Social Bank in 1971 (Iqbal and
Molyneux, 2005). The public sector promotion of Islamic banking began with the Islamic
Development Bank in 1975 (Iqbal and Molyneux, 2005). Table 2.6 documents the evolution of
the Islamic financial market and trends in the industry. It shows that the 1980‘s enjoyed the
largest shift in Islamic finance, as it spread from the Middle East and Gulf region to Malaysia
and the Americans, together with an increased range of services, from Islamic banking to
Takaful insurance, and Islamic investment funds activity.
Table 2.6: Evolution of the Islamic Financial Markets
1970’s 1980’s 1990’s 2000’s
Islamic
Financial
Services
Commercial
Islamic
banks
1) Commercial
Islamic banks; 2)
Takaful54
insurance; 3)
Islamic investment
funds
1) Commercial Islamic
banks; 2) Takaful
insurance; 3) Islamic
investment companies;
4)Islamic investment
funds; 5) Asset
management
companies; 5) Brokers
and dealers
1) Commercial Islamic banks;
2) Takaful insurance; 3)
Islamic investment funds 4)
Asset management
Companies; 5) Brokers and
dealers 6) Islamic Investment
banks; 7) Sukuk; 8)Hedge
funds
9) Private equity and Islamic
and Islamic RETS‘s
Region Gulf and
Middle East
Gulf, Middle East
and Asian Pacific
Gulf, Middle East, and
Asian Pacific
Gulf, Middle East, Asian
Pacific, Europe, Americas,
and Global offshore markets
Source: Global Islamic Finance Forum (GIFF) m Guide Book (2010, p.256)
54 Takaful (social guarantee) is the Shariah compliant insurance alternative to conventional insurance. Literally, it stems “from the Arabic verb kafal, meaning to take care of one’s needs is descriptive of a practice whereby participants in a group agree jointly to guarantee themselves against loss or damage” (Abdul Wahab et al., 2007, p.374). In Malaysia, Section 2 of the Takaful Act 1984 defines Takaful, as cited in Abdul Wahab et al. (2007, p.374), as “a scheme based on brotherhood, solidarity and mutual assistance which provides for mutual financial aid and assistance to the participants in case of need whereby the participants mutually agree to contribute for that purpose”, and Takaful business as a “business of Takaful whose aims and operations do not involve any element which is not approved by the Shariah”. Conventional insurance is forbidden because it mainly involves a substantial Gharar component that affects the outcome of an insurance contract (El-Gamal, 2006; Ayub, 2007; Sultan, 2007).

48
The first fully-fledged Islamic commercial bank introduced to the conventional financial
system in the Middle East was established in Dubai in 1975, namely Dubai Islamic Bank,
followed by KFH in 1977 established in Kuwait, after which Bahrain, Qatar and lastly Saudi
Arabia launched their Islamic banks in 1979, 1982 and 1987 respectively (Wilson, 2009). The
differences between Islamic and conventional banking are outlined in Appendix 2.4. Islamic
banks‘ assets account for 15.5% of the regional banking system‘s assets (KFH research global
Islamic finance directory, 2009). The growth of Islamic banks‘ assets was rapid, growing at an
average of 45%, ranging from 28.3% in Kuwait to 65.8% in Qatar (Hasan and Dridi, 2010).
Table 2.7 outlines the total assets of Islamic banks in the GCC for 2008-2012.

49
Table 2.7: Total Assets of Islamic Banks in the GCC from 2008-2012
Name Country 2012 2011 2010 2009 2008
Mn $ Rank Mn $ Rank Mn $ Rank Mn $ Rank Mn $ Rank
Al-Rajhi Bank K.S.A 71,391.14 1 58,957.18 1 49352.52 1 45584.84 1 44036.26 1
Kuwait Finance House Kuwait 52,284.94 2 48,330.22 2 44720.34 2 39235.16 2 38209.86 2
Dubai Islamic Bank UAE 25,967.81 3 24,667.24 3 24544.52 3 22956.05 3 23153.97 3
Abu Dhabi Islamic Bank UAE 23,326.46 4 20,241.44 4 20492.62 4 17450.07 4 13944.50 4
Qatar Islamic Bank Qatar 20,105.86 5 16,011.20 6 14240.48 5 10788.21 5 9214.31 5
AlBaraka Islamic Bank Bahrain 19,055.13 6 17,154.04 5 1346.56 17 929.89 19 1001.46 17
Masraf Al Rayan Qatar 16,929.32 7 15,183.04 7 9527.52 6 6626.81 8 4606.47 7
Emirates Islamic Bank UAE 10,146.92 8 5,850.04 12 8916.88 7 6886.37 7 7188.84 6
Ahli United Bank Kuwait 9,362.67 9 9,435.78 8 8746.77 8 7855.35 6 N/A
Bank Albilad K.S.A 7,950.59 10 7,403.15 9 5638.16 10 4648.79 10 4285.83 8
Qatar International Bank Qatar 7,845.17 11 6,416.34 11 4993.76 11 4546.54 11 3527.82 11
Ithmaar Bank Bahrain 7,245.02 12 6,899.42 10 6743.57 9 6105.93 9 N/A
Boubyan Bank Kuwait 6,701.84 13 5,572.03 13 4690.88 12 3352.61 14 3045.66 12
Sharjah Islamic Bank UAE 4,987.51 14 4,828.73 14 4538.47 13 4349.87 12 4230.42 9
Kuwait International Bank Kuwait 4,443.21 15 4,015.73 15 4069.36 14 3962.67 13 3924.01 10
Al Salam Bank Bahrain 2,505.92 16 2,457.22 16 2280.24 16 2090.27 16 1474.70 14
Bahrain Islamic Bank Bahrain 2,214.93 17 2,231.78 17 2488.52 15 2425.42 15 2324.40 13
Khaleeji Commercial Bank Bahrain 1,258.41 18 1,190.21 18 1114.95 19 1259.60 18 1236.70 16
ABC Islamic Bank Bahrain 1,066.75 19 1,034.82 19 1208.65 18 1318.40 17 1461.35 15
Total Assets of Islamic Banks 294,790 257,880 219,655 192,373 166,867
Total Assets of Conventional Banks 884,451 787,623 948,356 899,891 874,139
Total Assets of All banks 1,179,240 1,045,502 1,168,010 1,092,264 1,041,005
% of Islamic Banks 25.00% 24.67% 18.81% 17.61% 16.03%
Source: Institute of Banking Studies-Kuwait Report (2011).
Note: this table shows the asset size in million US dollars (Mn $) of the 21 Islamic bank in the GCC and ranks them accordingly for 2008-2012.

50
Table 2.7 reveals that the biggest two Islamic banks, namely Al-Rajhi Bank in Saudi Arabia
and KFH in Kuwait capture, on average, 44% of the total assets of Islamic banks in the whole
GCC.55
Although Bahrain has the highest number of Islamic banks in the GCC, combined, they
represent the smallest asset size among their counterparts for all years. The Islamic banks in
Qatar record the highest growth rate from year to year. Table 2.7 shows that Islamic banks in
the GGC comprise 16% of the total banks in 2008, but this rate growed significantly in spite of
the impact of GFC, until it reached 25% in 2012.56
There is evidence suggesting that Islamic banks have been affected differently from
conventional ones, in terms of the Islamic banks‘ business model (Beck et al., 2013) that
reduced the adverse effect on profitability in 2008 (Hasan and Dridi, 2010). Further,
weaknesses in risk management practices in some Islamic banks led to a greater decline in
profitability in 2009 compared to that of conventional banks (Hasan and Dridi, 2010).
Moreover, Smolo and Mirakhor (2010) indicate that although the GFC had less of an impact on
IFIs, the capitalist financial system is also relevant to the development of IFIs as Trabelsi
(2011, p.23) highlights:
―This financial crisis pushed most developed countries to lower their banking rates and to
implement null-approximating interest rates, a move which replicates the principle adopted by
Islamic banks. Also, it is necessary to include the moral and ethical principles in our
behaviour and in the management of our institutions and to highlight the ill-fate of
speculation.‖
55 Alrajhi and KFH together account for 49%, 44%, 43%, 42%, and 42% of total Islamic banks in the GCC for 2008-2012 respectively. 56 Oman entered the Islamic finance and banking industry late, as it established its two Islamic banks only in 2012; Bank Nazwa established in August, and Alizz Islamic bank in December (see the website of Central Bank of Oman: http://www.cbo-oman.org website).This is because of the lack of support by the Omani government for developing the Islamic finance industry (Wilson, 2009) although it was one of the people’s requirements after the serious protests of 2011 in Oman as a reflection of the Arab Spring (Worrall, 2012). Recently, more conventional banks in Oman have started to offer Islamic windows to offer Shariah-compliant services. For instance, Oman’s largest bank is now licensed to offer Shariah-compliant services in order to benefit from the industry’s growth prospects (see the website of Central Bank of Oman).

51
In contrast, Bourkhis and Nabi (2013) suggest that there is no significant difference between
Islamic and conventional banks in the MENA region in terms of the effect of the GFC. They
attribute this to the divergence from an Islamic business model which would have kept them
sound even during the crisis. However, based on a wider sample of 510 banks across 22
countries ( 88 of which are Islamic), Beck et al. (2013) found that Islamic banks performed
better during the GFC due to their higher capitalization and better asset quality. Similarly,
Karim et al. (2010) found that the crisis does not seem to affect the co-movements of Islamic
and conventional stock indices in Malaysia. Yet, it was advised after the GFC that IFIs reduce
their reliance on debt-based products and move closer to equity-based, risk-sharing instruments
(Smolo and Mirakhor, 2010).
According to the Global Islamic Finance Forum (GIFF) guide book (2010), Islamic banking
represents the bulk of Islamic finance assets (82%), followed by Sukuk (11.7%), Islamic funds
(5.5%) and Takaful (0.7%). Figure 2.3 shows the number of Islamic companies in the GCC,
including Islamic banks, Takaful, and other companies, based on the Global Investment House
(2012).
Figure 2.3: Islamic Companies in the GCC
Note: this figure shows the total number of pure Islamic companies in the GCC, excluding Oman, for
1999-2011. Source: Global investment House (2012)
0
20
40
60
80
100
120
1999 2000 2001 2002 2003 2004 2005 2006 2007 2008 2009 2010 2011
No. of Islamic Comp.

52
Figure 2.3 shows that the number of pure Islamic companies (PH)57
in the GCC, excluding
Oman, grew after 2003 until the GFC of 2008-2009. Kuwait accommodates the majority of PH
companies in the GCC as, according to Al-Muthanna Islamic index,58
launched in March 2009,
there are 57 pure Islamic companies in the KSE. The authorities in Kuwait and Bahrain, among
the GCC governments, have been the most supportive of Islamic finance; Bahrain has become
the major center for Islamic banking and Takaful (Wilson, 2009). However, because Bahrain
has a small, thin stock market, it is unable to accommodate pure Islamic or Shariah-compliant
stocks or Islamic funds. Saudi Arabia has not prevented Islamic banking from playing a
significant role its financial sector; but there has been a reluctance to promote it further
(Wilson, 2009).59
The Kuwaiti government has encouraged Islamic banking, for instance by
contributing 49% of the paid capital of KFH (Al-Wasmi, 2011). After the increase in IFIs in
the late 1990‘s, parliament passed Law No.30 in 2003 that empowered the CBK to oversee IFIs
in Kuwait and KSE receives listing requests mostly from IFIs (Al-Wasmi, 2011). Furthermore,
the activities of most non-financial companies listed on the KSE do not conflict with Shariah
law (Al-Wasmi, 2011). For instance, the Al-Muthanna market report (2012) identifies 129 pure
Islamic companies (PH) and Shariah-compliant companies (MH)60
out of the 199 KSE
companies, across all sectors as showed in Table 2.8.
57 The interviews in Chapter 5 reveals that Global investment House define pure Islamic companies (PH) based on their articles of association, while this thesis defines PH stocks based on: (i) company’s article of association that states clearly that all its transactions are governed by Shariah principles; and (ii) the company has a SSB that oversees its transactions and submits an annual Shariah-compliant report at the end of financial year. See Chapter 5 for more details about the definition of PH in the GCC. 58 The Al-Muthanna Islamic index (MUDX) is a weighted index that tracks the performance of 57 PH listed on the KSE. The index was launched on the 1st of March 2009. (See the Al-Muthanna index http://www.mic.com.kw/MuthannaWeightedIslamicIndex-Methodogy.pdf). 59 Wilson (2009) notes that Saudi Arabia could potentially become the global forerunner of Islamic finance and contributes to the industry worldwide if the Saudi Arabian Monetary Agency (SAMA) and Capital Markets Authority took a more pro-active role. 60 The stocks of Shariah-compliant companies are defined in this thesis as Mixed Halal (MH) stocks that are compliant with certain screening criteria. The interviews analysis showed that Al-Muthanna Index rely on a specialized screening provider that currently use AAOIFI’s 2006 screening criteria (See Chapters 5 and 6).

53
Table 2.8: The Pure Islamic and Shariah-compliant stocks in KSE by sectors
Sector Number of Listed
companies
Pure Islamic and
Shariah-compliant companies
% of Total
Oil and Gas 7 5 71
Basic Material 5 4 80
Industrial 39 37 95
Consumer Goods 7 6 86
Health Care 3 3 100
Consumer Services 17 10 59
Telecom. 3 3 100
Banks 12 5 42
Insurance 9 2 22
Real Estate 38 28 74
Financial Services 55 23 42
Technology 4 3 75
Total 199 129 65
Note: this table shows the numbers and percentages of pure Islamic and Shariah-compliant KSE companies across
all market sectors as of 31/12/2012 (under the new classification introduced in May 2012). Shariah-compliant
(MH) companies are defined based on AAOIFI criteria
Source: Al-Muthanna Market Research (December 2012)
Table 2.8 indicates that pure Islamic and Shariah-compliant companies exist in all sectors of
the KSE, representing 65% of the total number of stocks. Moreover, the Al-Muthanna Market
Report (2012) highlights that Islamic and Shariah-compliant stocks account for 47% (KD 198
million) and 56.5% (KD 422.48) of the total value traded and volume of KSX15 respectively.
Figure 2.3 below reveals that the number of Islamic banks is now equal to that of conventional
ones in Kuwait. Two conventional banks converted to Islamic ones (Kuwait-Real Estate Bank
converted in July 2007 and the Bank of Kuwait and the Middle East in March 2010).61
61 To convert to an Islamic bank, a bank first applies to the Central Bank (CBK) showing its desire to convert totally into an Islamic bank. The bank should provide at least a five-year forecast of its economic feasibility, a study on the clients’ feedback on the bank’s conversion, a study of the legal environment, technical issues related to IT and transaction processing, and the conversion plan to being an Islamic bank and time table. Most importantly, the conversion process should include appointing a SSB that provides continued Shariah supervision and permanent checking of contracts, transactions, and procedures. Moreover, the bank is required to offer training to its staff on the Islamic banking system. Furthermore, all interest-based assets and liabilities should be replaced by Halal ones (see AAOIFI Shariah standard no. (6) for more details about this). When all requirements are fulfilled the CBK approves its conversion to an Islamic bank. This process may take one or two years, for example Kuwait international Bank was the first bank to convert to an Islamic one in Kuwait and it took two years. See Mustafa (2006), AAOIFI (2010) Shariah standard No. 6.

54
Moreover, the number of investment companies and investment funds is more than that of
conventional ones. Most investment funds are equity funds, and most Islamic funds invest in
both PH and MH stocks.
Figure 2.3: Number of Institutions under the Financial System in Kuwait
Source: Central Bank of Kuwait (2013)
In terms of Islamic investment funds globally, the first Islamic investment fund was launched
in the Middle East in the 1970s, since then the Islamic funds industry has spread over 75
countries with an annual growth rate of 15% (GIFF, 2010). According to Eurekahedge
(2011),62
the total number of Islamic investment funds is estimated to be 717, with assets
standing at over US$ 77 billion. Most of the of Islamic funds (70%) are small funds, as the
assets under management are under US$ 100 million, and only less than 10% of Islamic funds
have assets under management of over US$ 500 million (GIFF, 2010) revealing the infancy of
the industry and the potential for growth. Most Islamic investment funds invest in equities
(60%), money market (15%) and trade finance funds account (15%), and mixed asset funds
account for 10% of Islamic funds‘ asset class (KFH research, 2011). According to KFH
62 Eurekahedge is the world's largest alternative investment funds research house; they provide the Islamic Funds database. See http://www.eurekahedge.com/specialfunds/islamicdirectory.asp.

55
research (2011), Islamic funds‘ assets are poised to expand further, moving towards gradually
recovering their pre-GFC state.
The majority of Islamic funds‘ assets are invested in the Middle East and Asia, particularly in
the GCC and Malaysia (Eurekahedge, 2011; KFH research, 2011). Malaysia and Saudi Arabia
are the most popular Islamic funds hubs, accommodating 27% and 22% of Islamic funds,
followed by Kuwait and the UAE, with 12% and 7% respectively (Eurekahedge, 2011).Table
2.9 illustrates the most recent figures for Islamic and conventional funds, including equity
funds in the GCC region.
Table 2.9: Islamic and Conventional Investment Funds in the GCC region
Bahrain Kuwait Oman Qatar Saudi
Arabia UAE
Islamic Equity Funds 1 23 0 0 82 4
Conventional Equity Funds 5 35 9 6 54 38
Other Asset Class Funds 1 55 0 0 104 18
Total Investment Funds 7 113 9 6 240 60
Note: this table shows the number of Islamic and conventional equity funds, other asset class investment funds
that include real estate, money market, bonds, and balanced funds, in each GCC country, and the final row reports
the total number of investment funds as of the March 2013.
Source: extracted from GulfBase.com63
Table 2.9 shows that the vast majority of investment funds in the GCC are clustered in Saudi
Arabia and Kuwait, including funds of equities, real estate, commodities, money market, and
mixed assets funds. Nevertheless, the vast majority, if not all, are equity funds such as those in
Bahrain, Oman, Qatar, and the UAE. Kuwait has the least number of equity funds, but they still
account for more than half of the total investment funds. Saudi Arabia holds the bulk of Islamic
funds in the GCC, as the majority of funds in the country are Islamic investment funds (equity
and non-equity funds), followed by Kuwait.64
63 GulfBase datasets provide financial information, market data, IPOs and investment funds in the GCC region. Most datasets require a subscription to be accessed. The Zaywa, Eurekahedge and Bloomberg databases do not cover all of the GCC investment funds. 64 Oman and Qatar have not yet hosted any Islamic funds, as reported by Gulf Base (http://www.gulfbase.com/). However, they are expected to launch new Islamic funds. For the case of Oman, as a result of the growing

56
The attraction of the GCC and Malaysia regions is attributed to the following factors, as
documented by KHF research (2011, p.7):
―(i) strong economic growth in the Middle East and Asia by high oil and commodity prices;
(ii) developed Islamic capital market frameworks especially in Malaysia; (iii) high awareness
from its Muslim population who continuously seeks for Shariah compliant investments; (iv)
the better understanding of portfolio diversification and the need to invest in ethical based
products among non-Muslim investors‖.
Eurekahedge (2011) adds that these regions hold the largest number of Shariah-compliant
companies compared to elsewhere. In general, the drivers that contribute to the rapid growth of
Islamic investment around the world are somewhat similar, according to Hasan and Dridi
(2010, p5):
―(i) strong demand in many Islamic countries for Shariah-compliant products; (ii) progress in
strengthening the legal and regulatory framework for Islamic finance; (iii) growing demand
from conventional investors, including for diversification purposes; and (iv) the capacity of
the industry to develop a number of financial instruments that meet most of the needs of
corporate and individual investors‖.
Moreover, El-Qorchi (2005, p.1) outlines the following reasons for the diffusion of the Islamic
investment industry:
―[The] Strong demand from a large number of immigrant and nonimmigrant Muslims for
Sharia-compliant financial services and transactions. A second is growing oil wealth, with
demand for suitable investments soaring in the Gulf region. And a third is the competitiveness
of many of the products, attracting Muslim and non-Muslim investors‖.
Further, one of the reasons that has triggered the growth of Islamic investment even for
conventional investors is that it may provide an opportunity to obtain potential benefits from
international portfolio diversification, even after the GFC (Karim et al., 2010; Ghoul, 2012;
Balli et al., 2013). Despite the political unrest in the MENA region, Islamic finance in the GCC
demand triggered by the Arab Spring in the Middle East (Worrall, 2012). Qatar is experiencing a potential economic boom and is targeting becoming a future global hub for Islamic finance (Islamic finance news, 2013). The Qatar Central Bank recently announced that it will offer local banks QAR 1 billion (US$ 274.66 million)-worth of Shariah-compliant notes (Hussain, 2013).

57
has benefitted from the economic and financial stability existing in most countries (the UK
Islamic Finance Secretariat (UKIFS), 2012).
2.5 Summary
This chapter has provided an overview of the GCC and Kuwaiti context most relevant to the
present study. In particular, it presented a background of the investment environment for Halal
and non-Halal stocks in the GCC region with an emphasis on Kuwait.
This chapter reviews the economic, financial, and historical background of the GCC states. In
particular, it presents an overview of the GCC investment environment by exploring their
economic and stock market developments and performance. The final part of the chapter sheds
light on the Islamic finance and investment industry development and diffusion across the
region.
A number of interesting findings emerge from the discussion of these topics. First of all, the
GCC economies experienced rapid growth since the Iraqi war in 2003, with the oil and gas
income being the main driver of growth that triggered the diffusion of Islamic finance and
investment.
Despite the political uncertainty in the region, the GCC states in general were resilient after the
GFC, showing sustainable growth in their economies supported by robust oil prices and the
government backup of key economic sectors. Similarly, despite the fact that Kuwait enjoys the
most democratic political system among the GCC countries, it faced political disputes in 2009
onwards that have affected its economic growth and the KSE‘s performance (including Halal
and non-Halal stocks). Nevertheless, the surge in oil prices and implementation of the CMA
regulations are expected to improve and enhance the investment environment in Kuwait for
Islamic investment funds.

58
The GCC stock market liberalization, in addition to the increasing wealth and liquidity has
enhanced the development and performance of the stock markets in the region. Although the
Saudi stock market is the largest in the region in terms of market capitalization, value and
volume traded, KSE is the first established and largest in terms of the number of listed stocks
and performed the best among the rest of the GCC stock markets.
The chapter suggests that Islamic funds‘ assets are poised to expand further, gradually moving
towards their pre-GFC state with the majority of Islamic funds‘ assets invested in the Middle
East and Asia, particularly in the GCC region and Malaysia. Many factors have contributed to
the prosperity of the Islamic finance industry in the GCC region, including: the growing oil
wealth, increased awareness of Shariah-compliant investments, the economic and financial
stability in most countries, progress in strengthening the legal and regulatory framework, and
the growing demand by conventional and ethical investors. There is potential for growth in the
Islamic funds industry in Qatar and Oman in the future.
Kuwait accommodates the majority of purely Islamic and Shariah-compliant companies in the
GCC, as the government has been the most supportive across all GCC countries although the
number of Islamic funds in Saudi Arabia is greater than in Kuwait due to the higher demand as
a percentage of population. Nevertheless, both countries accommodate the largest two Islamic
banks that capture 44% of the total assets of Islamic banks throughout the whole GCC region.
However, despite this rapid growth of Islamic Investments in the GCC region and the
importance of Saudi Arabia and Kuwait in accommodating the industry, only few studies has
been conducted in Saudi Arabia (Merdad et al., 2010; Bin Mahfouz and Hassan, 2012), while
none in Kuwait. Therefore, this thesis is motivated by examining the performance of Islamic
investments in the GCC in general (chapter5) and in Kuwait in particular (chapters 6-8) as it
could be an ultimate investment environment for Halal equity investments.

59
Chapter 3: A Review of the Literature on Ethical and Islamic
Funds

60
3.1 Introduction
Investment funds play a significant role in equity markets through mobilizing investable funds,
based on investors‘ preference (Reilly and Brown, 2006; Gitman and Joehnk, 2007). Thus,
many investors consider equity investment funds as an ideal investment tool for an ultimate
asset allocation as they are managed by professional fund managers (Elton et al., 2007; Gitman
and Joehnk, 2007). Conventional Investment funds seek to maximize returns without any
restriction on their investable asset universe. However, ethical and faith-based investment
funds have added a new dimension that attempts to integrate ethical, religious, social or
environmental considerations into the asset selection (Schueth, 2003; Sparkes and Cowton,
2004; Cowton, 2004).
Ethical and faith-based screened funds seek to make profits while remaining ethical as well;
otherwise the industry will not be able to grow and prosper, as few investors are prepared to
accept low returns on their investment in order to be in alignment with their beliefs (Solomon,
2007; Hong and Kacperczyk, 2009; Kim and Venkatachalam, 2011). Nevertheless, this chapter
covers the literature that attempts to address the relationship between ―doing good‖ and ―doing
well‖, as being ethical or religious can entail additional costs for such types of screened
investment. In the context of modern portfolio theory, such a restriction may culminate in
ethical or religious investors holding a suboptimal portfolio that adversely affects the return
and risk characteristics (Kurtz, 2005) depending on the degree of strictness of the adopted
screens. Therefore, this chapter reviews the prior studies on the screening and performance of
ethical and Islamic equity investments as a sub-group of faith-based funds.
The rest of this chapter is structured as follows. Section 3.2 provides an overview of modern
portfolio theory and relates it to ethical investment. Section 3.3 presents a brief background to
ethical, faith-based (including Islamic) and socially responsible investment. Section 3.4

61
outlines the screening criteria and performance of ethical and sin investments while Section 3.5
highlight the screening criteria and performance of Islamic or Halal-based investment. Finally,
section 3.6 concludes the chapter.
3.2 An Overview of Modern Portfolio Theory
Modern portfolio theory (MPT) was developed by the pioneering work of Markowitz (1952).
He was the first person to provide a rigorous framework for the return and risk relationship
through designing a mathematical approach to asset selection and portfolio management.
Markowitz (1952) approach is based on mean-variance optimization, where he offered an
explanation of how to reduce risk, variance or standard deviation or volatility, through the
concept of diversification. According to MPT, the variability of portfolio return is attributed to
the portfolio‘s variance; hence diversification is achieved by avoiding securities with high
covariance. Therefore, what is essential in portfolio construction is to consider how the
individual securities are correlated with each other. Consequently, it is crucial to diversify
investments of securities across different industries since they are more likely to have lower
covariance than companies within an industry, especially industries with different economic
characteristics. MPT outlines that including additional low correlated securities within a
portfolio reduces its volatility or risk, but only to a certain level, at which point the portfolio
manager must bear a certain level of risk called systemic or market risk which cannot be
diversified away. This is because the MPT argues that holding all the securities in the market
may diminish the maximum amount of diversifiable risk, the risk of the market itself remains,
as the standard deviation or variance falls very slowly after a certain number of securities are
included.
Moreover, Evans and Archner (1968), raised doubts concerning the economic justification of
increasing portfolios sizes beyond ten securities, while others argue that there is a significant

62
reduction in risk moving from 10 shares to 25 (Poon et al.,1992). Further, Statman (1987)
found that a well-diversified portfolio should include at least 30-40 randomly chosen stocks.
Through the relationship between portfolio return and risk, Markowitz was able to formulate
the ―efficient frontier‖, which is a graphical presentation of the combination of all portfolios of
risky securities that are mean-variance efficient. Tobin (1958) further extended the MPT by
showing that investors can achieve an optimal portfolio through including risk-free securities
with their riskless assets. Hence, an efficient portfolio is one that provides the highest return for
a given level of risk or, in other words, one that provides minimum risk for a given level of
return. Portfolios falling below the efficient frontier fail to represent the optimal level of
diversification which can be obtained by a different allocation of securities.
MPT was the foundation for the original capital assets pricing model developed by Sharpe
(1966), Lintner (1965) and Mossin (1966). Since then, the Capital Asset Pricing Model
(CAPM) has been used in many different applications such as estimating the cost of capital for
companies and evaluating the performance of managed portfolios (Fama and French, 2004).
CAPM seeks to explore the relationship between return and risk based on the concept that any
security‘s required rate of return is equal to the risk-free rate of returns plus a risk premium,
that represents only the risk remaining after diversification. CAPM demonstrates this
relationship graphically through the Security Market Line (SML), where the slope of the line
can change, or the line can shift upward or downward, in response to changes in risk or
required rates of return. It uses the idea of beta which measures risk as the relationship between
a particular security or portfolio‘s movements and the movements of the overall stock market.
CAPM uses a security or portfolio‘s beta to calculate the investor‘s expected returns (see
equation 4.3 in the next chapter). is the slope of the SML that draws the relationship
between the portfolio‘s return and risk as measured by the portfolio‘s systematic risk. The

63
CAPM framework provided the basis for the development of a number of portfolio
performance measures such as Treynor (1965), Sharpe (1966) and Jensen (1968), stemming
from the MPT framework (Fama and French, 2004; Joro and Paul, 2006).These three
traditional performance measures have been extensively employed in the literature to measure
the performance of ethical investments (e.g. Mallin et al.,1995; Sauer,1997; Bello, 2005;
Kreander et al., 2005; Statman, 2005; Chong et al., 2006; Statman, 2006; Lyn and Zychowicz,
2010; Carosella et al., 2012) as well as in Islamic funds‘ performance (e.g. Hakim and
Rashidian, 2004; Hussein and Omran, 2005; Abdullah et al., 2007; Girard and Hassan, 2008;
Merdad et al., 2010; Rahimie, 2010; Hayat and Kraeussl, 2011; Shah et al., 2012; Ashraf,
2013). Treynor (1965), Sharpe (1966) and Jensen (1968)‘s performance measures are
explained in greater detail in the next chapter.
MPT implies that ethical or faith-based funds cannot effectively be diversified, due to the
limited number of available securities that can be included in a portfolio or they favour or
avoid certain industries, hence, will underperform the market and other well-diversified funds
(Bello, 2005; Kurtz, 2005; Lee et al., 2010; Lyn and Chowicz, 2012). This is because the
screening process imposes an additional set of constraints that may vary depending on their
intensity (Lee et al., 2010), and eliminates certain companies, industries, and sectors from
being selected which tend to bear a substantial level of specific risk (Barnett and Solman,
2006).
The majority of studies addresses the performance of ethical and faith-based investments
through the MPT framework (e.g. Bello, 2005; Kurtz, 2005; Rahimie, 2010), while a few
others employ both MPT and stakeholder theory to explain their performance (Barnett and
Salomon, 2006; Renneboog et al., 2008a). Stakeholder theory suggests that maximizing
stakeholder interests may result in higher company productivity and value (Lee et al., 2010).

64
Therefore, companies that are involved in ethical or socially responsible practices are more
likely to attain superior performance in the long run (Barnett and Salomon, 2006). The link
between performance and MPT is addressed again in section 3.4.2 when discussing the
performance of ethical investments.
The next section provides a background of ethical and faith-based investment before discussing
the screening and performance of ethical non-Islamic and Islamic investments in sections 3.4
and 3.5.
3.3 Background to Ethical and Faith-Based Investments
Cowton (1994, p.215) defines ethical investment as:
―The exercise of ethical and social criteria in the selection and management of investment
portfolios, generally consisting of company shares (stocks). This contrasts with standard
depictions of investment decision-making in finance textbooks, which concentrate solely on
financial return in the form of dividends and capital gains, and risk‖
Therefore, ethical investment integrates investors‘ financial objectives with religious values,
social and environmental concerns (Ghoul and Karam, 2007; Solomon, 2007; Lyn and
Zychowicz, 2010; Louche et al., 2012).Yet, Lewis and Mackenzie (2000), Gregory and
Whittaker (2007), Hong and Kacperczyk, (2009), and Kim and Venkatachalam (2011) argue
that some investors in ethical funds are willing to accept lower returns in order to be aligned
with their ethical stance. However, for ethical investment industry to grow the funds will need
to appeal to a wider group of investors (Gregory and Whittaker, 2007).65
Ethical investment includes faith-based investment, SRI, sustainable investment, green
investment and environmental investment. According to Schueth (2003, p.189):
―Social investing, socially responsible investing, social aware investing, ethical investing,
values-based investing, mission-based investing… all describes the same concept. These
terms tend to be used interchangeably within the investment industry to describe an approach
to invest that integrates personal values and societal concerns into the investment decision-
making process‖.
65 The financial performance of ethical funds is reviewed in section 3.5.2.

65
Some authors indicate that they share considerable similarity (O‘Rourke, 2003); while others
argue that they are not equivalent (Torres et al., 2004) as there could be a significant variation
in how they define and screen ethical investment (Hamilton et al., 1993; Roberts et al., 2007).
Renneboog et al. (2008a) agrees with Schueth (2003) that these concepts are more or less the
same, as noted below:
―SRI is an investment process that integrates social, environmental, and ethical considerations
into investment decision making. Unlike conventional types of investments, SRI apply a set
of investment screens to select or exclude assets based on ecological, social, corporate
governance or ethical criteria, and often engages in the local communities and in shareholder
activism to further corporate strategies towards the above aims‖. (p.1723)
Sparkes and Cowton (2004) argue that ‗ethical investment‘ is an older term, used by church
investors in the U.K, U.S, and Australia, but over time this term was replaced by ‗socially
responsible investment‘, abbreviated to SRI. Hence, ethical investment has religious origins
(Sparkes, 2001; Schueth, 2003; Kreander and McPhail, 2004; Statman, 2005; Ghoul and
Karam, 2007; Dion, 2009; Lyn and Zychowicz, 2010; Carosella et al., 2012; Louche et al.,
2012). The religious foundation of ethical investment or SRI has been in existence for
thousands of years, since religions were revealed. For example, ethical guidelines based on
Jewish teachings, date back over 3,500 years (Schwartz et al., 2007) and hence, the principles
of SRI are rooted in Judaism, Christianity and Islam, the three dominant religions around the
world that promote peace and avoid business practices that harm humans and society
(Blowfield and Murray, 2008). Thus, Christian, Jewish, and Islamic funds are classified as
faith-based funds, a sub-category of SRI (Ghoul and Karam, 2007; Louche et al., 2012). Ghoul
and Karam (2007) indicate that that these types of faith-based funds share many overlaps in
their screening criteria. Moreover, Lyn and Zychowicz (2010) report that a new faith-based
index introduced in 2008, called the Dow-Jones Dharma Index, targets the Dharmic

66
religions—Hinduism, Buddhism, Jainism, and Sikhism. It is argued that faith or religious
values should be combined with business activities, organizational issues, work values, and
investment decisions (Ali and Gibbs, 1998: Dion, 2009; Louche et al., 2012). For instance, Lyn
and Zychowicz (2010, p.142) stated that:
―It may be worthwhile for financial advisers not only to understand the goals, risk tolerance,
and investment horizon of their clients, but to determine their clients‘ ethical profile as well-
that is, whether they will consider their faith values in putting together their investment
portfolio.‖
Nevertheless, Mews and Abraham (2007) argue that we should recognize that we all share a
common concern with the ethical foundation of any financial relationship, regardless of
whether we describe the world as Christian, Jewish, Muslim or secular. The modern origins of
SRI emerged initially from religious groups such as the Methodists and Quakers, in the U.S. in
the 17th
century (Louche et al., 2012). The Social Investment Forum report (1999, p.5) outlines
that:
―In the mid-1700s, the founder of Methodism, John Wesley, emphasized the fact that the use
of money was the second most important subject of New Testament teachings. As Quakers
settled North America, they refused to invest in weapons and slavery. For hundreds of years,
many religious investors whose traditions embrace peace and nonviolence have actively
avoided investing in enterprises that profit from weapons and other products designed to kill
fellow human beings‖.
Later, these religious groups imposed more criteria for example to avoid investing in the stocks
of companies that are involved in the production or business of alcohol, tobacco or gambling,
which they call ‗sin‘ stocks (Schueth, 2003; Carosella et al., 2012; Louche et al., 2012).
According to Fabozzi et al. (2008, p.84), ‗Sin‘ is defined in the Random House Unabridged
Dictionary (2nd edition) as ―any act regarded as such a transgression, especially a willful or
deliberate violation of some religious or moral principle‖ p.1784. Fabozzi et al. (2008) argue
that each society has its own definitions of the terms ―responsibility‖, ―morality‖ and

67
―legality‖, and, consequently each defines sin investment differently. For instance, Kumar et al.
(2011) highlight that the Protestant and Catholic churches hold very distinct views on
gambling,66
as a sin industry, and found that ―in regions with higher Catholic–Protestant ratios,
investors exhibit a stronger propensity to hold lottery-type stocks‖(p.671). Hence, different
Christian Churches have also developed their own ethical criteria for their investment
strategies (Dion, 2009). Furthermore, in Arab countries, many consider the traditional Western
banking industry as a sin industry because interest is forbidden by the Qur’an (Fabozzi et al.,
2008). Hong and Kacperczyk (2009) define sin investments as holding stocks in companies in
the tobacco, alcohol and gambling industries, while Fabozzi et al. (2008) define sin stocks
more broadly to include companies engaged in alcohol, adult services, gaming, tobacco,
weapons, and biotech alterations activities.67
In some Arab or Muslim countries, some of these
sin industries discussed in the literature are already illegal. For instance, alcohol, adult services
and the gaming industry are forbidden by law in Kuwait and Saudi Arabia.
Faith-based funds, mainly Christian funds, have been in existence in the U.S. for some time
(Mill, 2006). In 1928, the first US religious investment was launched by the Pioneer Fund
Group that refused to invest in companies involved in alcohol or tobacco (Schwartz et al.,
2007). Furthermore, in the U.K. for instance, the Quakers in 1832 avoided investing in the
armaments sector, while the Methodist Church established a fund in 1960 and correspondingly
the church commissioners of the Church of England imposed ethical screening criteria on their
investments; however both funds were limited to the churches and not open to the public
(Kreander and McPhail, 2004). The first retail ethical fund in the world that was available to
the public was Ansvar Aktiefond Sverige in Sweden, established in 1965 by the insurance
66 Gambling is considered a sin industry in which many ethical and faith based industries avoid investing. 67 Hong and Kacperczyk (2009) excluded stocks in the adult entertainment industry, arguing that there are very few publicly traded companies with heavy operations in this industry. In addition, they excluded stocks in the defence sector because there is some debate about the sin classification of such activity.

68
company Aktie-Ansvar, which still exists today (Kreander and McPhail, 2004). Ethical
investment moved from its religious origins to include various other guidelines informed by
issues such as the political concerns of the Vietnam War, civil and human rights violations, and
environmental concerns. It was argued that the Vietnam War and the political climate of the
1960s marked a turning-point for SRI (Blowfield and Murray, 2008) that began its modern
roots (Schueth, 2003), whereby the anti-Vietnam war movement, and the boycotting of
companies whose activities involved the production of armaments resulted in the emergence of
SRI. Hence, the U.S Pax World Fund was launched in 1971, which responded to the demand of
investors for companies that supported the war to be screened out (Blowfield and Murray,
2008). This fund was thought to be the first ethical fund in the world (Knoll, 2002). The first
U.K. ethical investment fund was not available until 1984, provided by Friends Provident
Stewardship68
(Cowton, 2004) and established by Christian Quakers (Kreander and McPhail,
2004). Then the awareness of ethical investment increased and SRI issues continued to be an
aspect of investment decisions (Mallin, 1995; Schueth, 2003; Solomon, 2007) with moral and
ethical values informing financial and economic objectives. Therefore, ethical investment
nowadays is a common investment style and policy adopted by many institutional investors,
such as mutual funds, pension funds and portfolio managers. Indices providers have also
created indices that individual investors can use to match their investments with their religious
and ethical values (Sparkes, 2001; O‘Rourke, 2003). The increase in the awareness and interest
in ethical investment has led to an increased demand for such investments (Mallin, 1995). SRI
investors may focus on one or a combination of environmental, social and governance issues
(ESG) (Solomon, 2007), while green investing may also be described as sustainable investing
or environmental investing, which usually involves investing in companies that are dedicated
68 Friends Provident is a leading a leading life insurance company that provides and manages ethical funds, which is still operating today, see their website: http://www.friendslife.co.uk/sri/

69
to efforts that promote environmental sustainability (Kurtz, 2005). SRI has been one of the
fastest growing areas of finance over the past few decades (Sparkes, 2001; Cowtown, 2004;
Gregory and Whittaker, 2007; Schwartz et al., 2007). It has have attracted investors in Canada,
Australia, Japan and Europe (The Social Forum Report, 2011), as evidenced by the growth in
the number of ethical SRI funds offered by institutional investors (Solomon, 2007). This
growth has been enhanced by the development of several ethical and SRI indices, such as
KLD‘s Domini 400 social index (DSI), established in 1990, the Citizens Index constructed in
1995, the Dow Jones Sustainability family indices (DJSI), launched in 1999, and the Jantzi
Social Index (JSI), established in 2000 in Canada, all based in the US, together with the
FTSE4Good index, produced in 2001, based in the U.K. (see: Havemann and Webster, 1999;
Knoll, 2002; Sparkes 2002; Blowfield and Murray, 2008; Consolandi et al., 2009). According
to the Forum for Sustainable and Responsible Investment in the US, $80.9 billion was invested
in 375 different investment funds based on environmental, social and governance criteria at the
outset of 2011, representing a 15.9-percent growth in combined assets since the beginning of
2010, when 346 alternative funds managed a combined total of $69.8 billion.69
In the U.K.,
there was approximately £11 billion invested in green and ethical retail funds as at 30th
of June
2012, based on around 80 U.K. domiciled funds (Ethical Investment Research Service (EIRIS),
2012).70
Ethical funds have also grown in Islamic countries, but there are known as Islamic investment
funds, Shariah-compliant investment funds or Halal investment funds. Hence, Islamic
investment funds are faith-based funds and are deemed to be a subset of ethical funds, since the
foundation of their business philosophy is closely tied to religion (Haniffa and Hudaib, 2007).
Therefore, non-Muslim investors may consider Islamic investing as a close substitute for SRI
69 See the Annual Sustainability and Financial Report of Forum for Sustainable and Responsible Investment in the US (2011). Downloaded from their website: http://ussif.org 70 See Ethical Investment Research Service (EIRIS) official website: http://www.eiris.org/news/statistics.html

70
(Hayat and Kraeussl, 2011). Islamic funds follow the Islamic investment principles under the
regulations of Shariah law that designates investments in certain sectors as either Halal or
haram. The assets under the management of Islamic funds have recorded a rapid growth rate of
20% in recent years (KFH research,71
2011). Table 3.1 highlights some of the differences
between conventional, ethical, and Islamic investment funds as reported by Rahimie (2010).
71 KFH Research Ltd is the world’s first Islamic investment research arm to be established by an Islamic Bank. A direct subsidiary of Kuwait Finance House, KFH Research was established in 2007. Based in Malaysia, KFH Research plays a crucial role in linking the Gulf Cooperation Council (GCC) countries with the rest of Asia and other emerging Islamic financial markets. See http://www.kfhresearch.com/.

71
Table 3.1: Comparison between Conventional, Ethical, and Islamic Equity investment funds Key Areas Conventional Investment Funds Ethical Investment Funds Islamic Investment Funds
Main purpose of investment The investment seeks to maximize
financial return only.
The investment seeks financial return while
pursuing ethical motives.
The investment seeks financial return
while conforming to Shariah law.
Investment policy Investment policy does not make any
specific reference to socially-oriented
concern.
Investment policy is guided by a
clearly stated ethically-oriented or socially
responsible investment policy.
Investment policy is guided by the
Shariah principles.
Securities selection process Securities selection is made solely
based on the characteristics of the
securities that suit the objectives of
the investment but without reference to
any specific socially-oriented
considerations.
Ethical criteria is clearly identified
which will served as the filtering
mechanism in securities selection
process or when deciding whether to
invest or to avoid a particular asset or
stock.
Shariah guidelines are used as the
screening mechanism in securities
selection process to ensure only
Halal securities are selected whilst non-
Halal securities are avoided.
Asset universe Unlimited. All securities can be
selected or admitted into the
conventional portfolio.
Limited. Only securities that fulfill the
pre-determined ethical criteria will be
selected (negative or positive).
Limited. Only the Shariah compliant
securities are allowed for
Investment (usually negative screens).
Investment support services Only requires investment research
support services to search for
undervalued securities and monitor
the investment performance.
Requires the following services:
1. Ethical board to screen, monitor and
make decision on securities
admissibility or withdrawal.
2. Research team to search for
potential securities and monitor
fund‘s performance.
Requires the following services:
1. Shariah advisory board to screen,
monitor and make decision on
securities admissibility or
withdrawal. May also requires
Shariah officer to supervise and
monitor Shariah-compliancy.
2. Research team to search for
potential securities and monitor
fund‘s performance.
Shareholders’ activism Shareholders/investors do not play
active role in advising company to
act ethically or socially responsibly.
Shareholders/investors play active role
in ensuring company‘s activities
remain within ethical boundaries.
Shareholders/investors do not always play
active role in advising company
to act within Shariah principles.
Income Purification No income purification. No income purification. Income derived from non-Halal sources
should be deducted and paid out to charity.
Required to pay Zakat to needy.
Source: Rahimie (2010)

72
Table 3.1 shows that Islamic funds incorporate ethical and religious considerations into their
investment decisions, as reflected by their screening criteria. Hence, their asset universe is
limited compared to that of conventional funds that can invest in any security in the stock
market. Ethical funds may impose negative or positive screens or a combination of the two
(Blowfield and Murray, 2008; Lyn and Zychowicz, 2010), while most Islamic funds mainly
use negative screens (see Chapter 5). Negative screening means excluding securities that are
inconsistent with their ethical or religious guidelines, while positive screening directs
investments to securities that are socially responsible to society (O‘ Rourke, 2002; Knoll, 2002;
Forte and Miglietta, 2007; Lee et al., 2010). SRI puts more weight on environmental, human
rights, and corporate practices than Islamic funds (Forte and Miglietta, 2007).72
Some SRI
funds engage with investee companies to encourage them to adopt more socially responsible
practices, termed shareholder advocacy, and establish an active dialogue with investee
companies (O‘Rourke, 2003; Schwartz et al., 2007), whereas only a few Islamic funds do so.
Islamic funds are required to ‗cleanse‘ any impure earnings generated from non-Halal activity,
such as interest bearing revenues, by donating them to charity (Elgari, 2002; Ayub, 2007;
Hassan and Lewis, 2007; Usmani, 2010) because it is assumed that the vast majority of listed
investee companies involve a sin element in their activities, such as non-operating interest
revenues.73
In addition, Islamic funds are also required to pay Zakat 74
to the needy as part of
their social responsibility to society.
Islamic funds usually follow a sector exclusion screening strategy (Forte and Miglietta, 2007)75
rather than a best-in-class strategy that is adopted by some funds and index providers such as
72 This is one of the critiques of Islamic funds, as they should address such issues (see: Hassan, 2005; Kamla, 2009). 73 The purification of Islamic funds’ earnings is discussed in greater detail in Chapter 6. 74 Some Islamic funds might pay the Zakat on behalf of their investors, while others only calculate and declare the amount of Zakat that the investors themselves should pay. 75 Screening and ethical strategies are discussed in the following section.

73
DJSI. For example, the DJSI does not avoid firms in the gambling, alcohol and tobacco sectors
but includes the best companies in each industry, although they are ‗sin‘ stocks (Statman,
2005; EUROSIF, 2006).
Moreover, Islamic funds apply financial screens to examine the Shariah compliance of
securities related to interest bearing debt, interest bearing investments, non-Halal income and
liquidity; these issues may not necessarily be a concern for SRI-focused ethical investors. For
instance, Forte and Migletta ( 2007) compared three ethical FTSE European indices76
with one
Islamic index (FTSE Islamic Europe) and found that the latter had no financial sectors
represented (including banks, insurance and financial services), while the other three indices
were strongly represented by financials (16-18% in banks, 9-11% in insurances). This is
because financial companies in the west are not compliant with Shariah. However, IFIs assets
are growing and expected to reach USD 4 trillion in 2020 while the Muslim population is
expected to grow from its current 1.5 billion to 2.5 billion (KFH research global Islamic
finance directory, 2009).
The next two sections investigate the screening and performance of the non-Islamic ethical
investment funds then the screening and performance of Islamic investment funds.
3.4 Non-Islamic Ethical Equity Investments
3.4.1 Screening Criteria
Screening is defined as the process of selecting securities of companies to be part of the
investment fund based on a series of criteria (O‘Rourke, 2003; Schueth, 2003). The most
common screening criteria used by SRI ethical investments are negative and positive
screening, best-in-class and engagement strategies (Sparkes, 2001; O‘Rourke, 2003; Sparkes
76 These three ethical indices are: DJ Sustainability Europe, DJ Sustainability Europe ex AGTF and FTSE4 Good Europe.

74
and Cowton, 2004; Statman, 2005; Ghoul and Karam, 2007; Solomon, 2007). This section
elaborates on the different ethical investment strategies applied by different ethical funds and
presents some examples of screens followed by certain faith-based funds as sub-groups of
ethical funds. Table 3.2 identifies the most commonly adopted ethical investment strategies.
Table 3.2: Common Ethical Equity Investment Screens Adopted by SRI Funds
Style Description
Ethical ‘negative’ screening Avoiding companies on ethical, moral or religious grounds
(e.g. alcohol, gambling, tobacco).
Environmental/ social ‘negative’
screening
Avoiding companies for involvement in environmentally or
socially damaging Screening sectors or practices (e.g fossil
fuels).
‘Positive’ screening Active inclusion of companies because of environmental or
social benefits.
Community and social investing Allocation of capital directly to enterprises that explicitly
provide social returns.
Best-in-class Active inclusion of companies that lead their sectors in
environmental or Social performance.
Sustainability themes
Active selection of companies on the basis of investment
opportunities driven by sustainability factors, such as
renewable energy.
Constructive engagement Dialogue between investors and company management to
encourage more environmental, social and governance
practices. It is more related to institutional investors.
Shareholder activism
Use of shareholder rights to pressurize companies to change
environmental, social or governance practices.
Source: the European Sustainable Investment Forum (EUROSIF, 2006), and the Forum for Sustainable and
Responsible Investment (US SIF, 2008).
Some faith-based funds may use positive screens but most of them use negative screens (Lyn
and Zychowicz, 2010). Particularly, more than 80% of SRI funds employ negative screens as
part of their portfolio creation process (Social Investment Forum, 2005; Lee et al., 2010).
Schueth (2003, p.190) argues that: ―screening decisions are never black and white, always
gray‖. This may explain why there is for example, best-in-class screening strategy. However,
some investors believe that this works against SRI because they are unconvinced that there are
clear dividing lines between perfectly pure and less pure companies; perfectly socially
responsible or irresponsible (Statman, 2005; Statman, 2006). Table 3.3 focuses on the
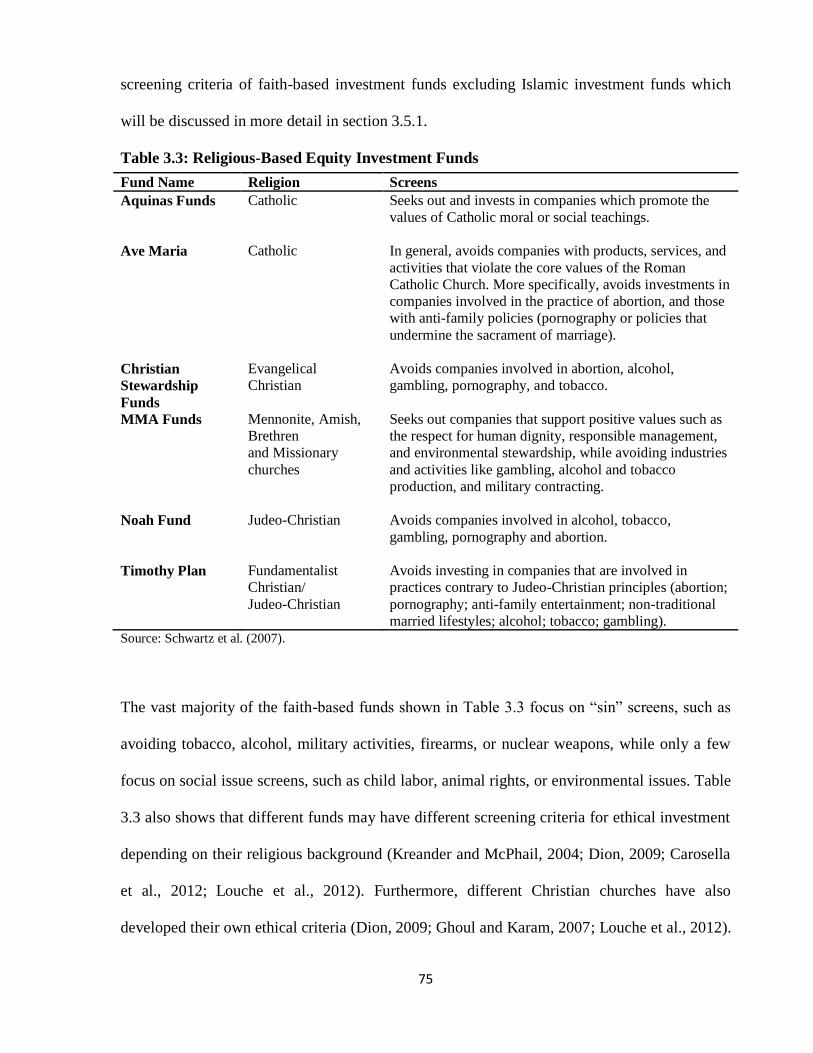
75
screening criteria of faith-based investment funds excluding Islamic investment funds which
will be discussed in more detail in section 3.5.1.
Table 3.3: Religious-Based Equity Investment Funds
Fund Name Religion Screens
Aquinas Funds
Catholic Seeks out and invests in companies which promote the
values of Catholic moral or social teachings.
Ave Maria
Catholic In general, avoids companies with products, services, and
activities that violate the core values of the Roman
Catholic Church. More specifically, avoids investments in
companies involved in the practice of abortion, and those
with anti-family policies (pornography or policies that
undermine the sacrament of marriage).
Christian
Stewardship
Funds
Evangelical
Christian
Avoids companies involved in abortion, alcohol,
gambling, pornography, and tobacco.
MMA Funds Mennonite, Amish,
Brethren
and Missionary
churches
Seeks out companies that support positive values such as
the respect for human dignity, responsible management,
and environmental stewardship, while avoiding industries
and activities like gambling, alcohol and tobacco
production, and military contracting.
Noah Fund Judeo-Christian Avoids companies involved in alcohol, tobacco,
gambling, pornography and abortion.
Timothy Plan Fundamentalist
Christian/
Judeo-Christian
Avoids investing in companies that are involved in
practices contrary to Judeo-Christian principles (abortion;
pornography; anti-family entertainment; non-traditional
married lifestyles; alcohol; tobacco; gambling).
Source: Schwartz et al. (2007).
The vast majority of the faith-based funds shown in Table 3.3 focus on ―sin‖ screens, such as
avoiding tobacco, alcohol, military activities, firearms, or nuclear weapons, while only a few
focus on social issue screens, such as child labor, animal rights, or environmental issues. Table
3.3 also shows that different funds may have different screening criteria for ethical investment
depending on their religious background (Kreander and McPhail, 2004; Dion, 2009; Carosella
et al., 2012; Louche et al., 2012). Furthermore, different Christian churches have also
developed their own ethical criteria (Dion, 2009; Ghoul and Karam, 2007; Louche et al., 2012).

76
Statman (2005) affirms that Evangelical Christians are more likely than Catholics or the
members of mainline Protestant denominations to exclude firms involved with adult
entertainment, gambling, alcohol production, abortion products, and equal family benefits for
homosexual employees, whereas Catholics and mainline Protestants are more concerned about
firms‘ environmental profiles. Furthermore, SRI and religious fund providers may change or
modify their screening criteria. For example, although tobacco is the top screen among SRI
funds, gambling was the second-most common screen in 1999 that fell to fifth in 2003
(Statman, 2005).
3.4.2 The Performance
This section investigates ethical investment‘s performance. This rapid worldwide growth of
SRI has inspired academics and practitioners to research SRI performance (Ortas et al., 2012).
There is a significant body of literature that compares the performance of ‗ethical‘ and ‗non
ethical‘ investments. Empirical investigations attempted to examine whether the ethical or
social screening would affect portfolio diversification and hence portfolio performance, as
implied by MPT (Lee et al., 2010). This is because MPT suggests that employing criteria in the
decision making other than return, risk, and diversification will limit the amount of potentially
lucrative investments as the screening process enforces an additional set of constraints on a
wealth-maximizing investor (Bello, 2005; Kurtz, 2005). Nevertheless, the literature does not
always suggest that SRI funds or ‗ethical‘ companies underperform financially (Luther et al.,
1992; Luther and Matatko 1994; Bal and Leger, 1996; Gregory et al., 1997; Kurtz, 1997;
Sauer, 1997; Statman, 2000; Kreander et al., 2002; Hamiltion et al., 1993; Mill, 2006;
Kreander et al., 2005; Statman, 2006; Schröder, 2007; Bauer et al., 2007; Renneboog et al.,
2008b; Statman and Glushkov, 2009; Hirschberger et al., 2011; Louche et al., 2012). Whereas
some studies find evidence for the significant underperformance of SRI funds (Cortez et al.,

77
2009; Geczy et al., 2005; Lee et al., 2010), fewer studies detect a significant outperformance
such as Mallin et al. (1995). The existing studies do not unequivocally demonstrate but rather
hint that SRI investors are willing to accept suboptimal financial performance in order to
remain compliant with their ethical or social values (Renneboog et al., 2008a; Hong and
Kacperczyk, 2009; Kim and Venkatachalam, 2011). Sparkes (1995) highlighted that only 35%
of SRI investors would continue to invest in SRI funds if the anticipated financial return from
these fell below that of non-SRI funds, which is consistent with Sparkes (2001). Kurtz (2005,
p.134) affirmed that:
―It is also bound up with how you, as a fiduciary, think markets operate. If you believe
portfolio performance is driven primarily by quantitative factors, and you are comfortable
optimizing your portfolios to a benchmark, typical social screens will probably not be too
burdensome. As long as the screens are not too restrictive, the factor exposures can be
adjusted as required using modern quantitative portfolio management tools. But if you think a
good investment strategy should concentrate on a relatively small group of carefully
researched stocks, you may find social screens have unwelcome impact on that portfolio. Or,
if you are a strong believer in modern portfolio theory, you may find the prospective
diversification costs unacceptable‖.
This quote implies that, if the screens are too restrictive, SRI would be burdensome. This is
because, by definition, SRI funds might be required to eliminate profitable investments due to
their screening practices (Lee et al., 2010). Furthermore, screening may encompass the
exclusion of not merely certain companies, but whole industries, sectors and even economic
sectors, from the portfolios of SRI funds (Barnett and Salomon, 2006).Therefore, the more
screens applied, the more the restrictive and smaller is the investment universe and a limited
potential for diversification (Hussein and Omran, 2005). However, the reduced selection of
companies could be offset by the benefits gained from investing in companies that have a
strong corporate social responsibility, are more effectively managed and hence offer greater
performance (Lee et al., 2010). The analysis on the financial performance of ethical equity
investments has been approached in different ways. Some studies compare the risk-adjusted

78
returns of ethical or SRI indices with the conventional market equity indices (Saure, 1997;
Arms, 1999; Statman, 2006; Schröder, 2007; Consolandi et al., 2009; Statman and Glushkov,
2009; Huimin et al., 2010; Carosella et al., 2012), while others investigate the risk-adjusted
returns of specially constructed equity ethical and non-ethical indices or portfolios of company
stocks (Diltz, 1995; Havemann and Webster, 1999; Derwall et al., 2005). The other stand of
literature examines the risk-adjusted performance of retail equity SRI funds, which represents
the vast majority of empirical work (Luther et al., 1992; Hamilton et al., 1993; Luther and
Matatko, 1994; Mallin et al., 1995; Gregory et al., 1997; Statman, 2000; Bauer et al., 2005;
Kreander et al., 2005; Barnett and Salomon, 2006; Bauer et al., 2007; Girard et al., 2007;
Hirschberger et al., 2011). Studies on ethical indices or specially constructed portfolios can
focus on the impact of ethical screening on investment to examine solely the performance of
the underling ‗ethical‘ securities. For instance, Statman (2005, p.10) affirms that:
―These studies [actual retail SRI] teach us little about the relative returns of stocks of socially
responsible companies since expenses create gaps between the returns of stocks and the
returns of mutual funds that contain these stocks, and these gaps vary from fund to fund. We
can learn more about the relationship between the returns of stocks of socially responsible
companies and the returns of stocks of conventional companies by comparing indexes of
stocks of socially responsible companies to indexes of stocks of conventional companies‖.
Therefore, studies on SRI indices or specially created portfolios are not affected by other
factors that may affect the impact of screening on performance (Sauer, 1997). Such factors are
attributed to the fund manager‘s skills regarding asset allocation, security and sector selection
and the timing ability of trading, in addition to factors related to transaction costs and
managers‘ fees (Sauer, 1997; Arms, 1999; Statman, 2005; Geczy et al., 2005; Schröder, 2007).
In addition, unlike studies on ethical funds, studies on indices or portfolios do not necessarily
use multi-factor models, such as the Fama-French (1993) model or the four-factor model of
Carhart (1997), because the indices do not follow specific investment styles or timing ability,
but rather it is a passive investment strategy according to their pre-determined screening

79
criteria. Moreover, Schröder (2007) adds two other reasons for only using the single-factor
model (to estimate the Jensen alpha and beta) rather than multifactor models: (i) the indices are
only adjusted infrequently, in most cases only once or twice a year; and (ii) almost all of the
ethical indices are closely related to a single conventional benchmark index. Studies that
construct their own hypothetical portfolios also argue that they are less biased due to the pre-
determined investment objectives or specific investment philosophies of funds and indices.
This may vary from fund to fund and index to index, thereby making comparison inaccurate.
Most of these studies largely involve funds in the U.K. and U.S. retail markets. A summary of
the important studies on ethical and SRI funds and indices is provided in Appendix 3.1.
The picture that emerges from previous studies suggests that the findings are mixed as noted
earlier, but most of the studies find that the differences between ethical and non-ethical
investments are marginal and statistically insignificant. Fewer studies found that ethical
investments were able to outperform their counterparts (Derwall et al., 2005). This is in line
with the principles of MPT that predicts a negative financial performance for ethical equity
investments as ethical and social screens restrain the diversification possibilities and, therefore,
lead investors to engage in less favorable investments. However, Barnett and Salomon (2006)
and Renneboog et al. (2008b) found that there was a non-linear inverse relationship between
the number of social screens used by a fund and its financial performance. They argued that
SRI funds with low levels of screening offer similar investment opportunities to conventional
funds, since fewer companies are eliminated. However, as the number of screens increases,
more companies are eliminated and the portfolio, therefore, becomes less diversified and
experiences decreased risk-adjusted returns (Girard et al., 2007; Ortas et al., 2012).
In contrast, Lee et al. (2010) found that screening intensity does not have an impact on funds‘
raw returns and total risk (unsystematic risk, measured by standard deviation) but found

80
evidence of a positive relationship between the number of screens and a portfolio‘s β. Hence,
Lee et al. (2010) recommend that SRI investors should consider funds that do not screen too
intensively; otherwise, they would expose their investments to systematic risk. However, Sauer
(1997) finds that the additional socially responsible screening associated with SRI do not
necessarily result in higher volatility and reduced returns. Sauer (1997) argue that the screening
process results in companies that enjoy a stronger financial position and more profits than
companies that are excluded, as environmentally responsive companies are less likely to
encounter environmental lawsuits. Similarly, SRI funds that are screened for product quality
and customer satisfaction are less likely to be subjected to product liability suits and costly
settlements but can establish strong firm loyalty and, thus, higher product sales (Arms, 1999).
Furthermore, some studies argue that the better a firm‘s social performance, the more
effectively it can attract resources (Waddock and Graves, 1997; Ortas et al., 2012). Therefore,
social responsibility may serve as a source of competitive advantage for companies. Further, as
the level of investors‘ awareness increase, in terms of social responsible issues, more pressure
will be put on companies that are not responding to such issues to change (Sauer, 1997). In
addition, the reputation for social responsibility produces a financial benefit and protects firms
from stock declines during crisis (Schnietz and Epstein, 2005). This contributes to the growing
evidence of the positive relationship between corporate social practices and financial
performance. In contrast, others argue that expenditure on social betterment may increase a
firm‘s costs, hence putting it at an economic disadvantage in a competitive market (Barnett and
Salomon, 2006) which would detract from a firm‘s financial performance. Further concerns
include lack of diversification associated with the limited investment universe, additional
screening and monitoring costs, increase in volatility and lower returns (Sauer, 1997). Thus,
firms need to balance a tradeoff between profit maximization and social responsibility because

81
they cannot maximize their value if they ignore the interests of their various stakeholders
(Jensen, 2001). However, most studies on the financial performance of SRI do not take into
account the fact that investors may gain additional utility by investing according to their values
(Beal et al., 2005; Hirschberger et al., 2011). Thus, there must be a holistic definition of utility
beyond the concept of the financial return from ethical funds (Beal et al., 2005). Beal et al.
(2005) argued that there are three motivations for ethical investment, namely: (i) financial
returns; (ii) non-wealth returns; and (iii) social change. Hence, faith or ethical investments
provide certain investors a flow of pleasure, satisfaction and social status, which could mean
more to them than financial returns (Hamilton et al., 1993; Jensen, 2001; Statman, 2005; Beal
et al., 2005). Furthermore, ethical screening creates potential investment opportunities that
positively contribute to social and economic welfare (Lewis and Cullis, 1990; Hussein and
Omran, 2005). Moreover, the increased awareness of SRI among investors puts pressure on
companies to comply with ethical, social, and environmental concerns (Sauer, 1997).
Environmental catastrophes tend to increase the interest in and awareness of the importance of
SRI issues (Renneboog et al., 2008b), such as the banking crisis, the BP oil spill in the Gulf of
Mexico, and the flooding in Pakistan. Lewis and Cullis (1990) argue that the rise of consumer
activism and higher consciousness of SRI has enhanced investors‘ preferences which, in turn,
has inspired a demand for ethical investment. If this demand for SRI companies increases, then
so will their stock market price. Luther et al. (1992, p.57) highlighted this fact as follows:
―...investment demand for shares in institutions with such products as ‗natural cosmetics‘ or
positive employment policies may be stimulated. From the purely financial view, growth in
such investor sentiment may be expected to produce gains in shares with a ‗positive‘ ethical
rating and losses on others‖.
Furthermore, Ortas et al. (2012, p.592) highlighted that their results opposed MPT during a
bearish market, as ethical companies were doing as well as the conventional index, for the
following reasons:

82
―The companies belonging to the BCSI [ethical index] seem to get financial benefits due to
the following issues: their commitment to a rational use of natural resources and
environmental preservation, their commitment to CSR principles, their commitment to high
levels of transparency about corporate governance issues, and their reduced exposure to
insider ownership. Thus they can access long-term sources of financing while maintaining
their activism in corporate social investment processes and their outperformance in ethics
management and other social issues. All of these considerations bring these companies in the
BCSI the opportunity to benefit from enhanced business opportunities that could improve
their performance. This is due to investors‘ perception that these well-governed companies are
less risky and are able to achieve a better financial performance in the mid- to long term‖.
Moreover, the contradictory results in the literature could be due to the different data, the
economic market conditions during which the studies were undertaken, and or the performance
measurement adopted. Few studies have addressed the performance of ethical investments
across different market conditions (Consolandi et al., 2009; Huimin et al., 2010; Ortas et al.,
2012). However, Ortas et al. (2012) suggest that it would be interesting to investigate whether
the risk-adjusted returns of ethical investment is affected by different market cycles. Schnietz
and Epstein (2005) found that socially responsible companies are less exposed to the declines
associated with this financial distress, even when controlling for possible trade and industry
effects. However, after the GFC in 2008, some studies on SRI found a change in their
performance pattern. For instance, Ortas et al. (2012) found that the risk and return
performance of the ethical index showed a regime change from the third quarter of 2008,
which accords to the worldwide stock market crashes due to the GFC. The SRI indices have
exhibited higher risk and lower return levels compared to the conventional indices. They
interpreted their finding by arguing that firms in SRI indices were more sensitive to economic
fluctuations and changes in the market cycle than those included in the conventional indices.
With regard to the portfolio performance, the valuation methods used in the literature are the
traditional Jensen-alpha, Sharpe and the Treynor ratios as noted earlier. Some studies employ
one or more of these portfolio performance measures. Statman (2000) uses a modified Sharpe
ratio based on Statman (1987) and Modigliani and Modigliani (1997) as a measure of risk,

83
called ―excess standard-deviation-adjusted return‖. Furthermore, Carosella (2012) used, in
addition to the three traditional measures (Jensen alpha, Sharpe ratio, Treynor ratio), the
reward to semi variability ratio that measures the downside risk of a stock when it is below a
target return. Hence, any return at or above that target is not included in the calculation.
Moreover, some researchers employed a combination of the traditional measures, derived from
the single-factor-model based on CAPM, while other multifactor models, such as the Fama and
French (1993), or Carhart (1997) model, such as Bauer et al. (2005) and Scholtens (2005).
However, as mentioned earlier, different methods may lead to conflicting findings and, hence,
extra caution should be exercised when employing more than one methodology. For instance,
Scholtens (2005) found that the Dutch SRI funds outperform conventional ones, using a single
factor CAPM, but that the opposite was true when using the Carhart‘s (1997) multifactor-factor
model. The primary purpose of studies that utilize multifactor models is to investigate the
investment style of ethical funds (Bauer et al., 2005; Scholtens, 2005). However, this thesis is
interested in examining the performance of the Halal portfolios per se rather than their
investment style such as small cap vs. large cap or growth vs. value (see Fama and French,
1993; Carhart, 1997).
Another approach that is prevalent in the ethical investment literature is a matched pair
analysis, suggested by Mallin et al. (1995) to overcome the concern reported by Luther et al.
(1992) and Luther and Matatko (1994) that ethical fund investments are biased towards smaller
market capitalization companies. Luther and Matatko (1994) suggested using a small cap.
stocks benchmark in addition to the conventional stock market index to address this bias when
measuring the performance of ethical investments. However, finding a proper benchmark is not
always easy (Kreander et al., 2005). Therefore, Mallin et al. (1995) followed by others (see
Gregory et al., 1997; Statman, 2000; and Kreander et al., 2005) directly compare the

84
performance of matched ‗ethical‘ and ‗non-ethical‘ investment funds based on similar
characteristics, such as fund objectives, fund size and age.
The next section investigates the other side of ethical or faith based investments, looking at the
performance of sin investments to see whether they behave differently.
3.4.3 Performance of Sin Stocks
There is evidence to suggest that ‗sin‘ stocks earn higher risk-adjusted returns (Fabozzi et al.
2008; Hong and Kacpercyzk, 2009; Liston and Soydemir, 2010), and consequently their
exclusion may directly lead to the underperformance of an ethical portfolio (Statman and
Glushkov, 2009; Ooi and Lajbcygier, 2013).
Some studies find that sin stocks are more volatile (Goodall, 1994; Chen and Bin, 2001) and
underperform the market index (Chen and Bin, 2001; Salaber, 2007). Goodall (1994) suggests
that gaming stocks in the U.S tend to be more volatile than the market throughout his twenty
year sample period (1973-1992). Chen and Bin (2001) found that, between 1993 and 1997,
gaming stocks, on average, yielded a lower return (alpha) and greater systematic risk (beta) in
the US stock market. Salaber (2007) examined the returns of sin portfolios (including
companies involved in tobacco, alcohol and gaming) for the period 1926-2005 in the U.S
market and found that tobacco and alcohol stocks recorded higher returns during recessions
than expansions; the return on gaming stocks does not vary with the business cycle, but sin
stocks in general showed inferior performance compared to non-sin ones. Fabozzi et al. (2008)
found that the sin portfolio of 267 companies in 21 countries over a 37-year sample period
(1970-2007) across six industries (alcohol, adult services, gaming, tobacco, weapons, and

85
biotech) outperformed77
common benchmarks. The lowest annual return earned by sin stocks
was 6.55% in Taiwan and the highest was 27.46% in the US. Fabozzi et al. (2008, pp.92-93)
mention several possible reasons for the superior performance of sin stocks, as follows:
―First, an economic gain might accrue from not conforming to social standards, as it costs
firms both implicitly and explicitly to uphold such standards. The evidence is also consistent
with the position that a sin stock is initially undervalued due to the negative affect of the
average investor, although previous evidence shows that sin stocks are not underpriced
(Salaber [2007]).Ironically, these industries are the hardest to start, most closely monitored,
and most severely disciplined by social opinion, but unlike other monopoly businesses, they
are the least regulated in terms of pricing. Thus, the positive risk-adjusted returns we find also
support the argument that the sin industries which have survived have earned positive
monopolistic returns‖.
Consequently, Fabozzi et al. (2008) argue that, because companies in the sin industries enjoy
monopolistic power, they manage to persist against all odds, and should be compensated with
an excess premium. Furthermore, Kim and Venkatachalam (2011) attributed the superior
performance of sin stocks to the high quality of the financial reporting to attract a wider
investment and analyst base, which is a result of the greater regulatory scrutiny to which they
are exposed due to the nature of the products they sell; for instance, these companies receive
close scrutiny by lawyers, politicians, and public opinion (Hong and Kacperczyk, 2009). Hong
and Kacperczyk (2009) focused on U.S sin stocks involved in alcohol, tobacco or gaming and
found that they are relatively undervalued and have higher risk-adjusted returns. They argued
that such outperformance could be due to the higher expected returns because of the increased
product market litigation risk for these companies. In spite of that, Hong and Kacperczyk
(2009) and Liston and Soydemir (2010) provided evidence that the sin portfolio outperforms
the faith-based portfolio (Ave Maria Fund) relative to the market. They reveal that faith-based
and sin betas tended to move in opposite directions during most of their sample period (2001-
77 Fabozzi et al. (2008) measured performance based on excess returns and risk-adjusted excess returns computed with the standard procedure utilizing the CAPM.

86
2007). Finally, Durand et al. (2013) compared the performance of sin stocks (alcohol, tobacco,
and gaming industries)78
with non-sin stocks (except financials) for 1990-2009 in seven
Pacific-Basin stock markets.79
They establish that sin stocks generate negative risk-adjusted
returns in all markets. Interestingly, Durand et al. (2013) revealed that, in Australia and New
Zealand, the countries which are culturally closest to the US, shareholders are less likely to
hold sin stocks, while in Japan and South Korea, they are more likely to do so. This finding
was justified by the cultural basis of individualism and collectivism. Durand et al. (2013)
argued that more individualistic investors might shy away from sin stocks, as they believe that
they can influence the world and take responsibility for their actions.
Having discussed the screening and performance of the ethical (non-Islamic faith-based), SRI,
and sin investments, the next sections elaborate on the screening and performance of Islamic
(Halal) investments, as a subset of the faith-based investment.
3.5 Islamic Investments
3.5.1 Screening
The literature divides the Shariah guidelines for identifying Halal equity investments into two
types of screen: (i) qualitative (sector or business) screens; and (ii) quantitative (financial)
screens (see: Wilson, 2004; Siddiqui, 2007; Khatkhatay and Nisar, 2007; Derigs and Marzban,
2008; Abdul Rahman, 2010; Ho et al., 2012; Pok, 2012). Most Islamic funds apply these
criteria as negative screens. In Malaysia however, Islamic funds use a certain type of positive
screening as the SAC requires that the core activities of the investee company should have
importance and maslahah (general benefit or interest or advantage) to Muslim society, to the
78 They followed Hong and Kacperczyk (2009) in identifying sin stocks using the FTSE/Dow Jones Industry Classification Benchmark obtained from Thomson DataStream. 79 The Pacific-Basin markets are Australia, India, Japan, South Korea, Malaysia, New Zealand and Singapore.

87
country and ummah (nation) (SAC, 2007, Al-Mubarak and Osmani, 2010). This is as
highlighted by Wilson (2004) who asserts that investing in companies that encourage trade
with Muslim countries could be considered a positive screen for promoting economic
cooperation among the Muslim world. This is because it ―enables Muslim capital to be
harnessed within Islamic world, increasing brotherhood and solidarity and reducing reliance on
Riba-based debt finance‖ (Wilson, 2005, p.213).80
Yet, the practice of Islamic investment
screening not mirrored full positive social and ethical screening, and has been criticized for
focusing on negative rather than positive screens (Siddiqui, 2007). Hence, Islamic equity
investment funds should become more involved in positive screening and shareholder activism
like SRI funds, as this helps them to accomplish Maqasid al-Shariah as reported in Chapter
1(also see Sano, 2000; Ziqaba, 2010; Yaacob and Donglah, 2012). Marzban and Asutay (2012,
pp.146-165) suggested that:
― The Shari’ah screening process, not only at the institutional level but also in its overall
evaluation, should follow a comprehensive screening process by ethical and social factors
whereby the aspirations of Islamic moral economy can be fulfilled and the narrow ‗form‘
oriented screening process can be substantiated by a ‗substance‘ oriented process‖.
Nevertheless, it is argued that positive screening is more complicated than negative screening,
as it requires the extensive analysis of different complex issues such as pollution and
workplace practices (Kamal, 2001), which takes time, given the low level of companies‘
disclosure especially in emerging markets (Salter, 1998; Al Mutawaa, 2010).
80 Other examples of positive screening are investing in companies whose activities are environmentally friendly as the Qur’an stats that humans are trustees on this earth and must safeguard the environment (Kamla et al., 2006), investing in companies that are more involved in profit and loss sharing financing rather debt-based financing even if the latter are Shariah-compliant because the former is more beneficial to the economy (Al-Suwailem, 2009), investing in companies that provide Qard Hassan (interest-free loan) and charity to individuals who need them, investing in companies that positively contribute to the welfare of society, investing in companies that have clear polices on payments of wages and bonuses and provide equal opportunities as Islam promotes morality, justice and brotherhood (Maali et al., 2006).

88
The following two sub-sections elaborate on the qualitative and quantitative screening criteria
applied by Islamic funds.
3.5.1.1 Qualitative Screening
The first level of screening for Shariah compliant stocks is qualitative (or sector compliant)
screening that ensures that the business of the company is Halal and does not contradict
Shariah (Kamal, 2001; Siddiqui, 2007; Khatkhatay and Nisar, 2007; Derigs and Marzban,
2008; Abdul Rahman et al., 2010; Ho et al., 2012; Pok, 2012; Marzban and Asutay, 2012).
Islamic funds usually define sector compliance based on the core business of the company; for
example, a hotel group or airline is acceptable but a brewery is not (Wilson, 2004). Therefore,
any company that is involved in riba transactions or in any of these former unethical or Haram
activities as their core business (e.g. manufacturing or distributing) is screened out from the
Halal-based universe. Companies that are not primary engaged in such Haram activities but
whose business comprises a material proportion of these activities are also eliminated (Wilson,
2004) (see Chapter 1).
Little research has been conducted on the Shariah-compliant investment screening methods
adopted by Islamic funds and indices (Khatkhatay and Nisar, 2007; Derigs and Marzban, 2008;
Abul Rahman et al., 2010; Pok, 2012; Ho et al., 2012). Khatkhatay and Nisar (2007) compared
the Shariah-compliant screening criteria of the Dow Jones Islamic Market Index (DJIM) in the
U.S, the Securities and Exchange Commission (SEC) in Malaysia, and the Meezan Islamic
fund in Pakistan. Interestingly, they suggested that mixed companies should be considered
unacceptable, even if their Haram activities are comparatively minor. This critical modification
of the screening practices is also supported by Al-Tunaji (2009) and other scholars, who
believe that mixed stocks should be banned.

89
Derigs and Marzban (2008) analyzed the impact of applying wider alternative Shariah screens
for Islamic funds and indices on a sample of S&P 500 index constituents. They concluded that
the asset universe differs significantly in terms of size as well as constituents. However, their
analysis revealed that only minor differences exist with respect to the qualitative sector
screens, similar finding reported by Pok (2012). Table 3.4 compares the qualitative screens for
several providers and users.
Table 3.4: Qualitative Shariah Screens
DJIM FTSE S&P MSCI HSBC Amiri DIB Azzad Meezan
Alcoholic Beverages X Y X Y Y Y Y X Y
Biotechnology
(Genetic & Foetus)
Y
Broadcasting &
Entertainment
X Y X Y Y Y Y X Y
Conventional
financial services
X Y X Y Y Y Y X Y
Gambling X Y X Y Y Y Y X Y
Hotels X Y X Y Y Y X
Insurance X Y X Y Y Y Y X Y
Meat Production X
Media Agencies* X X Y X Y
Pork-related products X Y X Y Y Y Y X Y
Restaurants & Bars X Y X Y Y Y Y X Y
Tobacco X Y X Y Y Y Y X Y
Trading of Gold &
Silver
X
Weapons & Defence X Y Y Y Y Y X
Note: This table shows the qualitative screens of the particulars screening providers and users. The first four
columns are Islamic index providers, namely: the Dow Jones Islamic Index Market index (DJIM) established in
1999, the Financial Times Shariah Index (FTSE) established in 1998, the Standard & Poor‘s Islamic Index
launched in 2006, the Morgan Stanley Capital International Islamic Index (MSCI) established in 2007. The
second two are banks, and the last three columns are fund managers.
X denotes core business
Y denotes any involvement
* Except newspapers
Source: Derigs and Marzban (2008)
Table 3.4 shows the qualitative screens of various screening providers and users, as surveyed
by Derigs and Marzban (2008). They noted that some screening providers (DJIM, S&P Islamic
indices, and Azzad Islamic funds) eliminate companies with any involvement in Haram

90
business whereas the other group [FTSE, MSCI, indices and HSBC, Amiri,81
the Dubai Islamic
bank (DIB), and Meezan Islamic funds] allows the inclusion of companies whose core business
is Halal but that receive a negligible portion of their revenue from Haram activities. Hence,
they indicated that this would reduce the Halal asset universe significantly, as industries such
as airlines, hotels and wholesalers, who all sell alcohol, would be considered non-compliant. It
is worth noting that this does not mean that DJIM, S&P and Azzad Islamic funds eliminate all
mixed companies, because they use financial screens to control for interest-bearing debt and
Haram earnings.
Both Ho et al. (2012), and Pok (2012) compared the Shariah-compliant screening criteria
adopted in Malaysia with the world‘s leading index providers. For instance, Ho et al. (2012),
compared the Shariah screens in Malaysia, for index providers (DJIM, FTSE, MSCI, and
S&P), a Shariah service provider (Shariah Capital),82
two fund managers (Azzad and Amiri)
and three banks (Saudi Arabia National Commercial Bank (NCB),83
DIB and HSBC).
Nevertheless, Ho et al. (2012), did not apply these different screens to a sample of securities to
measure their impact on the Halal assets and portfolio construction, as in prior studies, but
rather compared the users‘ qualitative screens and explored the different thresholds applied in
their financial screens. Ho et al. (2012) pointed out that some of these users are more specific
in their listing of their non-compliant business activities while others are more lenient. Similar
to Derigs and Marzban (2008), they affirmed that DJIM and Azzad apply stringent Shariah-
compliant qualitative screening, as they exclude companies who are involved in any Shariah
non-compliant businesses. However, this does not indicate that they only invest in pure stocks
81 Amiri Capital is a Shariah service provider and funds manager (see: http://www.amiricapital.com/index.php ). 82 Shariah Capital is a U.S.-based company that creates and customizes Shariah compliant financial products and platforms and provides selective Shariah consulting and advisory services (see: http://www.Shariahcap.com/about.php). 83 NCB is a conventional commercial bank that opened an Islamic window in which is provided an Islamic equity investment fund that is governed by an SSB.

91
as that use financial screening criteria. This is a defensive measure, as screening the businesses
of companies requires the inspection of the company‘s annual report and accounts to obtain
information about the company‘s operations. Hence, Ho et al. (2012) suggested either rejecting
companies engaged in any non-Halal business, as recommended by Khatkhatay and Nisar
(2007) or imposing further parameters for the screening of these companies. Moreover, Pok
(2012) found that Malaysia is a lot more liberal than that of the world‘s leading index
providers.
Despite the fact that AAOIFI is a regulatory body for the Islamic finance and investment
industry, the literature does not cover the AAOIFI screens that are widely adopted in GCC
states and many other countries. These financial screens of AAOIFI and other screening
providers will be discussed in the next section.
3.5.1.2 Quantitative Screening
In order to ensure that the Haram element is minimal in any mixed investee company‘s stock,
many SSBs of Islamic funds and index providers have arrived at a maximum allowable
threshold level, as reflected in various quantitative or financial screening criteria (Khatkhatay
and Nisar, 2007; Derigs and Marzban, 2008; Abul Rahman et al., 2010; Ho et al., 2012; Pok,
2012; Marzban and Asuty, 2012). Such financial screening thresholds eliminate the stocks of
companies that make gross violations, while they attempt to offer investors a reasonably wide
choice of Shariah-compliant stocks (Khatkhatay and Nisar, 2007). These Shariah-compliant
screens are unique to Islamic investment funds, compared to ethical and SRI funds. These
financial screening criteria are based on Ijtihad (Wilson, 2004; Derigs and Marzban, 2008) or
Qiyas rather than the primary sources of Shariah, the Qur’an or Sunnah. Hence, some Shariah
scholars criticize these financial screens, arguing that they allow a significant portion of riba
that is strictly prohibited in Shariah and calling for a reduction in the financial screening

92
thresholds (Al-Tunaji, 2009). However, as discussed in the previous section, some opponents
of financial screening disallow any thresholds for non-Halal earnings or activities and require
instead a pure investee company (Al-Nashmi, 1998; Al-Salaami, 1998; Al-Qurdi, 2001). The
majority of Islamic funds, indices and users still apply financial screens. In 2004, AAOIFI
issued its Shariah screening criteria for securities‘ investments (No.21),84
and then later in
2006 it revised its financial screening criteria. Table 3.5 compares the Shariah financial screens
of various Islamic indices and AAOIFI in both 2004 and 2006. It could be argued that AAOIFI
was seeking to increase Islamic investors‘ Halal asset universe by this change in the screening
criteria. See Chapter 6, where these screens are applied to individual investee companies in
order to measure their Shariah-compliance with the criteria to examine the impact of this
change on the Halal asset universe and the creation of Halal investment portfolios.
84 See AAOIFI Shariah standards (2010, pp.294-308).

93
Table 3.5: Financial Shariah Screens
DJIM
(1999)
FTSE
(1998)
S&P
(2006)
MSCI
(2007)
AAOIFI
(2004)
AAOIFI
(2006)
Liquidity screens:
Accounts Receivables + Cash / Total Assets 50%
Accounts Receivables / Total Assets 70% 49%
Accounts Receivables / Market Capitalization 33% 49%
Interest Screens:
Interest Income / Total Revenue 5%
Cash and interest bearing investments /
Total Assets
33% 33% 30%
Cash and interest bearing investments /
Market Capitalization
33% 33% 30%
Interest-bearing debt / Total Assets 30%
Interest-bearing debt / Market
Capitalization
30%
Debt Screens:
Total Debt / Total Assets 33% 33%
Total Debt / Market Capitalization 33% 33%
Non-Halal screens:
Non-Halal Income (other than interest) /
Total Revenue
5% 5%
Non-Halal Income + Interest Income /
Total Revenue
5% 5%
Note: This table shows the Shariah-compliant quantitative (financial) screens and their thresholds for the four widely used Islamic indices, namely; the Dow
Jones Islamic Index Market index (DJIM) established in 1999, the Financial Times Shariah Index (FTSE) established in 1998, the Standard & Poor‘s Islamic
Index launched in 2006, the Morgan Stanley Capital International Islamic Index (MSCI) established in 2007 and the financial screens of Accounting and
Auditing Organization for Islamic Financial Institutions (AAOIFI) in 2004 and 2006.

94
Table 3.5 reveals that some screening providers use total assets as a ratio denominator for
the different financial screens [DJIM, S&P, and AAOIFI (2004)], while others use market
capitalization instead [FTSE, MSCI, and AAOIFI (2006)]. Derigs and Marzban (2008)
indicate that using market capitalization to assess the real worth of the company has several
advantages, such as being more reliable, as it is determined by the market and also, by
using a trailing average, any seasonality effects can be eliminated. In addition, it enables
Shariah screening to be conducted on a continuous basis since it is not dependent on
financial reports. Furthermore, any dissimilarities arising from applying different
accounting principles, such as FIFO or LIFO for inventory evaluation, are not a problem.
On the other hand, those who use total assets argue that accounting standards are more
reliable because they are free from market influence and speculation. Khatkhatay and Nisar
(2007) argue that the use of market capitalization is inappropriate and should be replaced
by other relevant balance sheet items, preferably total assets. Derigs and Marzban (2008)
and Ho et al. (2012) pointed out that DIB resolved this issue by using both measurements
(total assets and market capitalization) as the denominator for the ratios but then follow the
one that provides a larger Halal universe. Ho et al. (2012) noted that NBC in Saudi Arabia
uses both denominators for the interest-bearing debt screen. Marzban and Asutay (2012)
found that different denominators may offer different advantages across different time
spans and regions. For instance, Marzban and Asutay (2012) concluded that asset-based
screens resulted in a much larger asset universe in Japan while market capitalization screens
yielded a larger asset universe in the US, based on a sample of the top 200 capitalization
companies in each country.
Another significant difference that emerges from Table 3.5 is the range of thresholds.
Although these screens are based on Itihad, some scholars attempt to give them some
Shariah rationale in order to refer them back to certain texts in the Hadith (see Al-
Quradaqi, 2002; Al-Shubali, 2005; Derigs and Marzban, 2008; AAOIFI, 2010). Most

95
providers use the third threshold (30-33%) for the interest-bearing debt or debt screens.85
AAOIFI only applies interest-bearing screens because it is common in Muslim countries to
take out non-interest bearing loans, such as Sukuk,86
while the four Islamic indices screen
based on total debt, as they are the global indices that are mostly used in non-Muslim
countries, where debt is assumed to be non-Halal.
AAOIFI only allows 5% for interest income and other non-Halal income combined, while
the FTSE index allows 5% for each. Thus, AAOIFI is more conservative. The 5% threshold
has no foundation in the Qur’an or Sunnah (Derigs and Marzban, 2008) but may reflect
materiality. Nevertheless, any non-Halal income less that 5% should be donated to charity,
as noted previously because if it is more than this threshold, it renders the whole investment
to be non-Halal.
The range in the liquidity screens is wide (33-70%), as this ratio is the most strongly
debated among Shariah scholars. This is based on the assumption that the portion of illiquid
assets must outweigh that of the liquid ones. Thus, if the latter are larger than 50% of the
market capitalization value (or total assets), investment in such a company is permitted.87
Otherwise, if the majority of the assets are in liquid form, some scholars argue that they
cannot be traded except at par value, as it represent money to which Suruf (money
exchange) rules should apply or that is considered riba (See: Al-Quradaqi, 2003; AAOIFI,
2010, Usmani, 2010). Nevertheless, AAOIFI‘s 2006 screens dropped this criteria and SAC
(2007) in Malaysia does not apply any liquidity screens either.
Interestingly, Abdul Rahman et al. (2010) applied DJIM financial criteria, particularly the
liquidity and leverage screens, to a sample of listed companies in the Kuala Lumpur Stock
Exchange Shariah Index (KLSESI) in 2006. They found that only 17 % of the KLSESI
85 This is based on a Hadith as translated by Derigs and Marzban (2008, p.292): “The Prophet advised Abu Bakr [one of his closest companions] not to donate more than one-third of his wealth, and commented that ‘One third is too much’”. 86 Sukuk are similar to conventional bonds but are asset backed and Shariah-compliant. 87 This is based on the figh principle: “The majority deserves to be treated as the whole thing”.

96
companies are highly liquid, with a liquidity ratio of more than 50%. They indicated that
44% of the KLSESI companies depend heavily on debt. They, however, failed to identify
whether these debts are Shariah compliant or not, assuming that DJIM uses total debt. This
means that the debt screens fails 44% of KLSESI companies that are deemed to be Halal.
This explains why Malaysia does not use debt screens and is considered liberal by some
scholars. Therefore, many recommended developing a harmonized screening framework for
Islamic investment (Khatkhatay and Nisar, 2007; Derigs and Marzban, 2008; Abdul
Rahman et al., 2010; Ho et al., 2012), but this should also take into consideration the
different existing Shariah views (Derigs and Marzban, 2008) and the country context.
Although the accounting standards established by AAOIFI are based on capitalistic
accounting, they can still be used as a starting point from which to create an improved set
of disclosure criteria that can be used by Islamic institutions (Harahap, 2003; Maali et al.,
2006) as highlighted by Maali et al. (2006, p273):
―Islamic businesses should disclose all information necessary to advise the Umma (Islamic
community) about their operations, even if such information would work against the firm itself.
The concept of disclosure is thus related to the concept of accountability: In an Islamic context,
the Umma has the right to know how organizations that are part of the Umma affect its well-
being‖.
Nevertheless, Islamic funds may still face challenges when seeking to screen companies to
comply with the AAOIFI accounting standards. Khatkhatay and Nisar (2007) suggested
that it might be difficult to obtain sufficiently detailed information about a company‘s
activities and its subsidiaries to conduct Shariah compliance screening. This is in line with
Wilson (2004, p.37), who asserted that:
―Screening requires a considerable amount of information that can only be ascertained by
scrutinizing the company‘s annual reports and accounts‖.
Thus, he further continues that ―skills are also need to know what figures to use to calculate
ratios that are important from Islamic perspective‖. However, many firms in emerging
markets make low level or incomplete financial disclosure on a quarterly and annual basis

97
(Salter, 1998; Al Mutawaa, 2010; Cognizant Report, 201288
). For instance, many
companies fail to differentiate between cash and cash equivalents (e.g., money market
instruments, Treasury bills that can be readily converted into liquid cash) in their financial
reports (Cognizant Report, 2012). In addition, some companies fail to report their interest
income or other Haram items as a separate item on their financial statements. It is also
common even in Muslim countries to fail to differentiate between interest-bearing debts
and total debt. These issues raise many concerns and challenges for the Shariah screening
providers and regulatory bodies. Hence, extra caution is required when applying the
financial screens, such as inspecting all detailed disclosures, notes and Shariah reports if
available and sometimes approaching the investee companies in order to clarify certain
issues. Unlike prior studies which do not rely on the manual inspection of companies‘
annual reports; either ready-screened lists or the dataset platforms offered by different
providers such as Bloomberg, Thomson Routers, and Ideal Ratings,89
this thesis screens
each company‘s annual report manually (see Chapters 4 and 6).
3.5.2 The performance
Despite the rapid growth of the Islamic equity investment industry, the empirical evidence
on the performance of such investments is relatively scarce. However, more studies have
emerged during the last few years (Merdad et al., 2010; Hassan et al., 2010; Rahimie, 2010;
Alam and Rajjaque, 2010; Hayat and Kraeussl, 2011; Hoepner et al., 2011; Mansor and
Bhatti, 2011; BinMahfouz and Hassan, 2012; Shah et al., 2012; Lobe et al., 2012;
Walkshäusl and Lobe, 2012). Appendix 3.2 provides a summary of the key features of the
previous studies that have investigated the performance of Islamic investments. The
88 Cognizant is a global business and technology services consulting company that provide services related to corporate government, ethics and corporate social responsibility (see: http://www.cognizant.com/). 89 Ideal Ratings is a recent Shariah screening, fund and index management services provider. They are the most specialized in Shariah-compliant equity screening (see: http://www.idealratings.com/). Derigs and Marzban (2008) used their data sets.

98
literature on Islamic investments‘ performance covers: Islamic indices, Islamic funds, and
Islamic-based portfolios constructed by researchers.
Appendix 3.2 reveals that the literature does not provide any clear evidence on the
performance of Islamic investment funds, as it is mixed and inconclusive, not only across
different studies but also within the same study under different market conditions (bull,
bear, GFC). For instance, Abdullah et al. (2007), Merdad et al. (2010), and Hayat and
Kraussal (2011), find that Islamic funds underperformed conventional funds in the full
sample and bullish periods, and outperformed them in the GFC and bearish periods (Ashraf,
2013). This implies that Islamic funds can be used as a hedging instrument during certain
economic conditions. However, Albaity and Ahmad (2008), Hassan et al. (2010), Mansor
and Bhatti (2011), and BinMahfouz and Hassan (2012) did not find any significant
difference between the return performance of Shariah-compliant and non-compliant
investments.
The most common performance measures used in the literature are the three traditional
portfolio evaluation methods (Jensen alpha derived from the CAPM, Sharpe, Treynor).
Although, concerns have been raised regarding the use of interest-based instrument (e.g. T-
bills) as a proxy for a risk-free rate for calculating the risk-adjusted performance of Islamic
portfolios (Abderrezak, 2008; Salim, 2008; Rahimie, 2010), only Rahimie (2010) employed
a Shariah-compliant alternative (Mudarabah investment account rate)90
to the conventional
one, finding that the performance of the Shariah-compliant portfolio improved accordingly.
Unlike other ethical funds studies, Islamic funds studies have not employed the matched
pair approach to control for the impact of size, sector, age or geographical location, apart
from Abderrezak (2008)91
and BinMahfouz and Hassan (2012). Nevertheless, BinMahfouz
90 Mudarabah is a form of partnership in which one partner finances the project (rub al-mal) usually the customer, while the other party (Mudarib), usually the IFI, manages it. The Mudarib would be entitled to certain amount of profit at a pre-determined rate as a reward for their contribution in managing the fund. See Hassan and Lewis (2007). 91 Abderrezak (2008) is an unpublished master’s dissertation.

99
and Hassan (2012) matched the Islamic and conventional funds based on their geographical
investment focus. This is in spite of the bias towards smaller market capitalization
companies reported by many studies (Hussein and Omran, 2005; Abderrezak, 2008; Girard
and Hassan, 2008; Hassan et al., 2010; Rahimie, 2010; Hoepner, et al., 2011) and the
sensitivity related to using inappropriate benchmarks.
The substantive literature examines the performance of Islamic investments using
worldwide indices or funds in developed countries, while fewer studies explore their
performance in Muslim countries (Abdullah et al., 2007; Albaity and Ahmad, 2008; Hassan
et al., 2010; Rahimie, 2010; Hoepner et al., 2011; Merdad et al., 2010; BinMahfouz and
Hassan, 2012; Ashraf, 2013). Most studies on Muslim countries are conducted in Malaysia;
only three studies examine Islamic funds in Saudi Arabia, and one included the GCC
countries (Hoepner et al., 2011). However, no studies have been conducted on Kuwait,
which is the third largest Islamic funds market in the world after Malaysia and Saudi Arabia
as noted in Chapter 2. Therefore, this thesis will contribute significantly to the existing
literature on the performance of Islamic and conventional investments.
Studies have found that Islamic investments are better in their domestic markets rather than
the global ones (Hayat and Kraeussl, 2011). In particular, they are better in Muslim
countries (Hoepner et al., 2011; Walkshäusl and Lobe, 2012) as more Shariah-compliant
stocks are available across different sectors, especially financials.
Few studies have examined the impact of using different screening criteria on portfolio
performance (Derigs and Marzban, 2009; Lobe et al., 2012). None of the previous studies
have rebalanced their portfolios over time, by assuming that the Shariah-compliant status of
securities is unchanged (Lobe et al., 2012) or because they carried out the analysis at a
certain point of time, such as Derigs and Marzban (2009) who chose 17 September 2007 on
which to screen their sample asset universe. This assumption is not accurate in reality, as a

100
stock‘s (mostly MH and MS) Shariah-compliant status may vary over time based on its
compliance with screening criteria (see Chapters 5 and 6).
One of the significant gaps in the literature is the exploration of the performance of pure
Halal stocks, or even a definition of them, as these entire prior studies, even those
conducted in Muslim countries, fail to distinguish between mixed and pure Halal securities.
Therefore, they do not differentiate between Islamic funds or indices that include both PH
and MH securities and Islamic funds that only invest in pure stocks which exist in the GCC
stock markets. In addition, unlike the studies related to ethical investments, the Islamic
investments literature fails to explore the performance of ‗sin‘ investments from a Shariah
perspective. Sin investments could be those securities that are incompliant with either the
qualitative screens (Sin stocks) or with the different financial screening criteria (MS) (see
Chapters 5 and 6). This thesis, however, seeks to address these gaps in the Islamic
investment literature.
3.6 Summary
This chapter has investigated the relevant literature on the screening and performance of
ethical and Islamic-based investments as a subset of ethical and faith-based funds.
A number of key findings have emerged from this chapter. First, the various prior studies
on the performance of ethical and Islamic investments do not provide clear evidence as to
whether restricting the asset universe leads to inferior portfolio performance as suggested
by MPT. Second, despite the growth of the Islamic funds industry, few empirical studies
have emerged on the screening and performance of Islamic investments. As databases have
become more comprehensive and available, more academic studies have been published
during recent years and are expected to grow further in the future. Nevertheless, the
literature does not define or measure the performance of pure Halal companies that are
targeted by many religious-based investors, at least in GCC region. Moreover, the
performance of ‗sin‘ stocks from a Shariah perspective is also not explored yet. Fourth,

101
investing in Muslim countries, especially the GCC countries, may enhance the risk-adjusted
performance of Halal-based investments as they would benefit from the availability of
Halal stocks especially in the financial sector. Fifth, the different ethical and Shariah
screens may result in discrepancies in asset universe size, asset allocation across sectors and
return and risk characteristics. Sixth, as a result of the ethical and Shariah-based screens,
empirical evidence indicates that such portfolios are biased toward the companies‘ size and
sector. This is expected to affect the sensitivity of research findings to the benchmark index
used to evaluate the performance of ethical and Islamic funds. Thus, many studies on
ethical funds‘ performance employ the matched pair approach to overcome the benchmark
problem, while only one published study on Islamic funds follows a matched pair approach
but in a narrow manner. Seventh, empirical evidence documents that it is not only lack of
diversification caused by screens that negatively affect the performance of ethical and
Islamic funds, but also the fund manager‘s stock selection and market timing skills that
affect their ability to beat the market consistently. Therefore, it is important to create
hypothetical portfolios to control for this when measuring the impact of screening criteria
on performance. Eighth, there is some evidence indicating that traditional portfolio
evaluation measures that use interest-based instruments in their calculation are biased
against Islamic portfolios. Hence, there is a need to incorporate Shariah alternatives,
stimulated by the growth of Islamic finance and investment industry. Finally, prior studies
use data of Islamic funds or indices, or when creating Shariah-compliant portfolios rely on
ready-screened lists or the dataset platforms offered by Shariah screening providers. In
addition, none of these studies update portfolios‘ assets and rebalance them over the sample
period. This thesis, therefore, builds on the literature reviewed in this chapter and fills the
gaps in the Islamic investment literature in the empirical chapters 5-8. The following
chapter outlines the research methodology and methods.

102
Chapter 4: Research Methodology and Methods

103
4.1 Introduction
Chapter 1 discussed the research problems and outlined the main objectives of this study.
Chapter 2 describes the investment environment of the Halal and non-Halal stocks in the
GCC region with an emphasis on Kuwait, and a background of the Islamic funds in the
GCC and Kuwait is elaborated in the chapter. Chapter 3 reviews in detail the main literature
and the theoretical framework driving this study. These three chapters provide a sold
background for the methodological assumptions and the research methods that will be
adopted for this study. Therefore, the objective of this chapter is to determine the nature of
social science research, the assumptions grounding the views about society, the research
paradigm used and, finally, the methods utilized for the data collection and analysis.
The chapter begins with section 4.2 and a discussion of various philosophical assumptions
underpinning the four research paradigms outlined by Burrell and Morgan (1979). Section
4.3 identifies and justifies the research paradigm and methodology chosen for this current
study based on the research objectives. Section 4.4 outlines the qualitative and quantitative
research methods selected for this study, namely: (i) semi-structured interviews with a
number of key stakeholders in the Islamic funds industry in the gulf cooperation countries
(GCC); (ii) content analysis; and (iii) an analysis of the performance of Halal and non-
Halal equity portfolios of companies listed on the KSE, while section 4.5 concludes the
chapter.
4.2 Philosophical Assumptions and Research Methodology
Collis and Hussey (2009) argue that there is no consensus in the literature about how
research is defined. Nevertheless, from the many definitions provided, there is a general
agreement that research is ―(i) a process of inquiry and investigation, (ii) systematic and
methodological, and (iii) increases knowledge‖ (Collis and Hussey (2009, p.3). The most
comprehensive and poignant definition of research is cited in Webster‘s Dictionary of
English Language (1961):

104
―A studious inquiry or examination, especially a critical and exhaustive investigation or
experimentation having for its aim the discovery of new facts and their correct
interpretation, the revision of accepted conclusions, theories, or laws in the light of newly
discovered facts or the practical application of such conclusion, theories, or laws‖
(p.1930)
According to this definition of research, the main elements are the discovery of new facts
through analysis, interpretations and the practical application of the conclusions. Saunders
et al. (2009, p.5) define research as ―something that people undertake in order to find out
things in a systematic way, thereby increasing their knowledge [about the phenomenon
under study]‖. However, most authors in the area of research methodology believe that
researchers also bring their own perspectives of the world to their research that is under
investigation (Sayer, 1992; Punch, 2001; Creswell, 2009; Jonker and Pennink, 2010). Collis
and Hussey (2009) argue that research means different things to different people. This is
because researchers approach their subject via explicit or implicit assumptions about the
nature of the social world and the way to investigate it (Burrell and Morgan, 1979; Chua,
1986; Sayer, 1992). These philosophical assumptions influence the practice of research,
hence leading the process of collecting data, investigation, analysis and interpretation of the
findings (Ryan et al., 2002; Creswell, 2009). Burrell and Morgan (1979) built a
philosophical framework for social science research based on two principal dimensions: (i)
assumptions about the nature of science in terms of the subjective-objective aspect; and (ii)
assumptions about the nature of society in terms of the regulation-radical change
dimension.
4.2.1 Assumptions about the Nature of Social Science
Burrell and Morgan (1979) identified four separate assumptions related to the nature of
social science that determine researchers‘ investigation and the way in which they view the
world, namely: (i) ontology; (ii) epistemology; (iii) human nature; and (iv) methodology.
Each of these four elements represents two philosophical positions in terms of the

105
subjective-objective dimension. Figure 4.1 presents the schematic diagram of Burrell and
Morgan (1979) that illustrates these four assumptions from the subjective-objective
dimension.
Figure 4.1: Assumptions about the Nature of Social Science
The Subjective-Objective Dimension
The Subjectivist
Approach to Social
Science
The Objectivist
Approach to Social
Science
Nominalism
Ontology Realism
Anti-Positivism
Epistemology Positivism
Voluntarism
Human Nature Determinism
Ideographic
Methodology Nomothetic
Note: this figure shows Burrell and Morgan‘s (1979) scheme for analyzing assumptions about the
nature of social science research from the subjective-objective dimension.
Source: Burrell and Morgan (1979, p. 3).
Figure 4.1 shows that Burrell and Morgan (1979) established that the assumptions about the
nature of social science vary according to the subjective or objective approach adopted
while the ontological and epistemological standpoints shape the researcher‘s view of human
nature that, in turn, will inform the choice of methodology to be used in the research
undertaken. The ontological assumption is related to how the researcher views reality and
the nature of being, and whether reality exists by itself, independently of individuals, or if it
is a product of individuals‘ consciousness (Burrell and Morgan, 1979; Chua, 1986; Sayer,
1992; Creswell, 1998; Ryan et al., 2002; Saunders et al., 2012). Thus, according to Burrell
and Morgan (1979), the subjectivist approach is known as ‗nominalist‘, perceiving the
social world as not real and assuming that reality is a result of human imagination and

106
individual consciousness (Morgan and Smircich, 1980; Laughlin, 1995). This indicates that
different individuals may arrive at different conclusions about the same phenomenon. In
contrast, the objectivist approach, described as ‗realist‘, assumes that the external world is
structured, composed of hard, tangible facts, regardless of how they are labeled or
perceived by individuals, and hence reality is waiting to be discovered. This suggests that
different individuals will arrive at the same conclusion about the studied phenomenon.
Ontological assumptions are related to epistemological assumptions, which are concerned
with the nature of knowledge (Chua, 1986; Ryan et al., 2002; Creswell, 1998). Burrell and
Morgan (1979) indicate that epistemology addresses the question of ―how one might begin
to understand the world and communicate this as knowledge to fellow human beings‖ (p.
1). Crotty (1998, p.3) describes epistemology as ―the theory of knowledge embedded in the
theoretical perspective and thereby in the methodology‖. Figure 4.1 shows that subjective
researches follow the ‗anti-positivist‘ approach, believing that knowledge about the social
world is soft, subjective and intuitive, and can only be understood and obtained by
individuals‘ involvement and personal experience (Hopper and Powell, 1985; Crotty,
1998). On the other hand, ‗positivist‘ researchers ―seek to explain and predict what happens
in the social world by searching for regularities and causal relationships between its
constituent elements‖ (Burrell and Morgan, 1979, p.5).
The third research assumption about the nature of social science, presented in Figure 4.1, is
the human nature assumption that is concerned with the association between human beings
and their environment (Burrell and Morgan, 1979). The assumptions about human nature
are influenced by the prior ontological and epistemological assumptions. Burrell and
Morgan (1979) outlined two extreme positions to explain human nature: determinism; and
voluntarism. Following the subjective approach, ‗voluntarists‘ assume that human beings
are autonomous and free-willed, and act voluntarily in creating the social world whereas,
from the objectivist standpoint, ‗determinists‘ view individuals and their activities as being
107
determined by the situation or environment in which they are located (Burrell and Morgan,
1979). Between these two extreme positions, Burrell and Morgan (1979) also argued that it
is likely to ―adopt an intermediate standpoint which allows for the influence of both
situational and voluntary factors in accounting for activities of human beings‖ (p. 6).
The outlined sets of assumptions related to ontology, epistemology, and human nature have
direct implications for the research methodology adopted (Burrell and Morgan, 1979;
Hopper and Powell, 1985; Chua, 1986; Laughlin, 1995; Collis and Hussey, 2009).
Therefore, as asserted by Ryan et al. (2002), ―the selection of an appropriate research
methodology cannot be done in isolation of a consideration of the ontological and
epistemological assumptions which underpin the research in the question‖ (p. 35). Leedy
(1993) describe methodology as ―an operational framework that within which the facts are
placed so that their meaning may be seen more clearly‖ (p.121). Crotty (1998) defines
methodology in a more comprehensive way as ―the strategy, plan of action, process or
design lying behind the choice and use of particular methods and linking the choice and use
of methods to the desired outcomes‖ (p.3). Hence, the research methodology and research
method are distinctive from each other. A methodology is an approach to the process of
conducting research within the context of a particular paradigm, while a method is a
technique for collecting and/or analyzing data (Cuba and Cocking, 1997; Collis and
Hussey, 2009). Equally, Jonker and Pennink (2010) describe a methodology as a domain or
map, whereas a method refers to a set of steps needed to travel between two places on the
map. The methodological assumptions lead and justify the methods which are the
techniques used in the research (Leedy, 1993; Creswell, 1998; Ryan et al., 2002; Collis and
Hussey, 2009). Figure 4.1 shows that the subjectivist approach employs the ideographic
methodology, believing that the social world can only be understood by ―getting inside
situations and involving oneself in the everyday flow of life‖ and focuses on ―obtaining
first-hand knowledge of the subject under investigation‖ (Burrell and Morgan, 1979 p.6),

108
using qualitative methods to acquire knowledge, such as interviews and case studies (Ryan
et al., 2002). Alternatively, following the objective approach, Burrell and Morgan, (1979
p6-7) affirm that a ‗nomothetic‘ methodology:
―focuse[s] upon process of testing hypothesis in accordance with the canons of scientific
rigour. It is preoccupied with the construction of scientific tests and the use of quantitative
techniques for the analysis of data. Surveys, questioners, personality tests and
standardized research instruments of all kinds are prominent among the tools which
comprise nomothetic methodology‖.
Similarly, Cuba and Cocking (1997, p92) argue that quantitative methods ―are useful
when the goal of the study is to represent some phenomenon numerically.‖ while they
highlighted that ―qualitative methods are best suited to answering questions about
social organization and process.‖ (p.93).
4.2.2 Assumptions about the Nature of Society
The second principal dimension introduced by Burrell and Morgan‘s (1979) framework
is related to the assumptions about the nature of society which is being investigated.
They suggested two distinct views regarding the structure of social society. One is
‗regulation sociology‘ and the other is ‗radical change sociology‘, and the difference
between these two approaches is highlighted in Table 4.1.
Table 4.1: The Regulation-Radical Change Dimension
The Sociology of Regulation is Concerned
with:
The Sociology of Radical Change is
Concerned with:
(a) The status quo (a) Radical change
(b) Social order (b) Structural conflict
(c) Consensus (c) Modes of domination
(d) Social integration and cohesion (d) Contradiction
(e) Solidarity (e) Emancipation
(f) Need satisfaction (f) Deprivation
(g) Actuality (g) Potentiality Source: Burrell and Morgan (1979, p. 18)
The first approach provides an explanation of the elements of social science that
regulate human activities and maintain social order. Burrell and Moran (1979) outlined
that:

109
―A sociology which is essentially concerned with the need for regulation in human affairs;
the basic questions which it asks tend to focus upon the need to understand why society is
maintained as an entity. It attempts to explain why society tends to hold together rather
than fall apart.‖ (p.17)
The sociology of radical change, by contrast, refers to sociology which is essentially
concerned with finding explanations for structural conflict and contradiction, emancipation,
and modes of domination, potentiality leading to radical change (Burrell and Morgan,
1979). Table 4.2 highlights the differences between the two positions of the regulation-
radical change dimensions as offered by Burrell and Morgan (1979).
4.2.3 Research Paradigms
Kuhn (1962) was the first to introduce the concept of research paradigms, or worldviews as
described by Creswell (1998, 2009). Kuhn (1962) stated that ―paradigms are universally
recognized scientific achievements that for a time provided model problems and solutions
to community of practitioners‖ (Kuhn, 1962, p. x). In addition, Kuhn (1970)92
outlines that
the term ‗paradigm‘ is used in two different senses, first ― it stands for the entire
constellation of beliefs, values, techniques, and so on shared by the members of a given
community‖ (p. 175). Second, ―it denotes one sort of element in that constellation, the
concrete puzzle-solutions which, employed as models or examples, can replace explicit
rules as a basis for the solution of the remaining puzzles of normal science.‖(p.175). Kuhn‘s
definition, implicitly indicated that there is more than one paradigm providing a set of
beliefs to understand and solve research problems. Correspondingly, but in more detail,
Bryman (2008) defines the term paradigm as being used ―to describe a cluster of beliefs and
dictates that for scientists in a particular discipline influence what should be studied, how
research should be done, and how results should be interpreted‖ (pp.696-697). Furthermore,
Collis and Hussey (2009) offer a more specific definition of a research paradigm as
92 This is a second edition of Kuhn’s (1962) book, where he added a postscript from pages 174-210.

110
follows: ―the process of scientific practice based on peoples‘ philosophies and assumptions
about the world and the nature of knowledge‖ (p.55). They indicate that these paradigms
―offer a framework comprising an accepted set of theories, methods and ways of defining
data‖ (p. 47) and is a way of examining the social phenomena from which a particular
understanding of these phenomena can be gained and an explanation attempted (Morgan
and Smirch, 1980; Saunders et al., 2012). Thus, such research paradigms ―provide a tool for
establishing where you are, where you have been and where it is possible to go in the
future‖ (Burrell and Morgan, 1979 p.24).
By combining the assumptions about the nature of science in terms of the subjective-
objective dimension (Figure 4.1) and the assumptions about nature of society in terms of
the regulation-radical change dimension (Table 4.1), Burrell and Morgan (1979) developed
four distinct research paradigms that underlie all social research. These four mutually
exclusive paradigms are: (i) the functionalist, interpretive, radical humanist and radical
structuralist as presented in Figure 4.2.
Figure 4.2: Four Paradigms underlying Social Research
The Sociology of Radical Change
Subjective
Radical
Humanist
Radical
Structuralist
Objective
Interpretive
Functionalist
The Sociology of Regulation
Note: this figure shows Burrell and Morgan‘s (1979) four paradigms for the analysis of social
research. The subjective-objective dimension is shown on the horizontal axis and the sociology of
regulation- radical change is shown on the vertical axis. Source: Burrell and Morgan (1979, p. 22)

111
Each research paradigm shown in Figure 4.2 represents a scientific practice based on the
research philosophies and assumptions that guide researchers‘ inquiries (Creswell, 1998;
Johnson and Duberley, 2000; Collis and Hussey, 2009). The functionalist paradigm located
in the bottom-right quadrant of Figure 4.2 combines an objectivist view of the social world
with a concern for the sociology of regulation (Johnson and Duberley, 2000; Ryan et al.,
2002). Researchers located in this paradigm follow a realist ontology, a positivist
epistemology, a deterministic model of human nature, and a nomothetic methodology.
Furthermore, the sociology of regulation perspective is adopted, as the functionalist
paradigm seeks to ―provide explanations of status quo, social order, consensus, social
integration, solidarity, need satisfaction, and actuality‖ (Burrell and Morgan, 1979, p. 26).
Thus, functionalists view research as concrete real-world relations holding regularities and
causal relationships that are amenable to scientific explanation and prediction (Johnson and
Duberley, 2000; Ryan et al., 2002). This paradigm tends to be dominant in much of the
accounting and finance research since the 1970s (Burton, 2007), for instance: Al-
Abdulqader (2003), McClusky (2005), Middelton (2006), Tijjani (2008), Xu (2010), Khan
(2011), Al-Mujamed (2011), and Khan (2012).
The interpretive paradigm located in the bottom-left quadrant of Figure 4.2 is similar to the
functionalist paradigm in its assumptions about the sociology of regulation; however, it
differs from the functionalist paradigm as it approaches its subject from a subjectivist
standpoint, adopting a nominalist ontology, an anti-positivist epistemology, a voluntarist
model of human nature, and an ideographic methodology, viewing the social world from
the perspective of the actors involved in it (Saunders et al., 2012). The interpretive
paradigm is interested in understanding the world without necessarily changing it (Burrell
and Morgan, 1979).
The radical humanist paradigm, located in the top-left quadrant of Figure 4.2, is built upon
the subjective dimension and sociology of radical change. Hence, this paradigm shares

112
subjective assumptions about social science with the interpretive paradigm. Thus, it views
the world from the position of nominalist ontology, an anti-positivist epistemology, a
voluntarist view of human nature, and an ideographic methodology but, as the radical
humanist is located within the sociology of radical change, it stresses radical change, modes
of domination, emancipation, deprivation, and potentiality (Burrell and Morgan, 1979). The
radical humanist paradigm has the opposite assumptions concerning the nature of social
science and society from the functionalist one. Saunders et al. (2012) assert that the radical
humanist paradigm assumes a critical perspective on organizational life.
Finally, the radical structuralist paradigm, located in the top-right quadrant in Figure 4.2, is
characterised by assumptions about the sociology of radical change from an objectivist
standpoint. Therefore, the radical structuralist paradigm ―is committed to radical change,
emancipation, potentiality, structural conflict, modes of domination, contradiction, and
deprivation‖ (Burrell and Morgan, 1979, p. 34). But, as this paradigm follows the objective
dimension similar to the functionalist paradigm, it tends to adopt a realist ontology, a
positivist epistemology, a deterministic view of human nature, and a nomothetic
methodology.
Indeed, Burrell and Morgan‘s (1979) framework has underpinned much accounting and
finance research (Hopper and Powell, 1985; Chua, 1986; Laughlin, 1995; Holland, 2001;
Ryan et al., 2002; Saunders et al., 2012). Nevertheless, the widespread use of Burrell and
Morgan‘s (1979) paradigms has not been without criticism (Hopper and Powell, 1985;
Chua, 1986; Boland, 1989; Laughlin; 1995; Deetz, 1996; Tashakkori and Teddlie, 1998;
Modell, 2010). Deetz (1996) argued that Burrell and Morgan‘s paradigms have obscured
the crucial differences in research orientations which may lead to poorly formed
discussions about research findings. The main criticism of Burrell and Morgan (1979)
framework is due to the paradigms being mutually exclusive and the constraints that this
imposes on researchers (Chua, 1986). Burrell and Morgan (1979) indicate that ―one cannot

113
operate in more than one paradigm at any given point in time, since in accepting the
assumptions of one, we defy the assumptions of all the others‖ (p. 25). Chua (1986)
described the mutually exclusive feature of Burrell and Morgan‘s paradigms as
―unsatisfactory dichotomies‖ (p. 626), arguing that their assumptions do not form mutually
exclusive dichotomous paradigms. She suggested an alternative framework based on three
sets of beliefs: (i) beliefs about knowledge; (ii) beliefs about the physical and social reality;
and (iii) the relationship between theory and practice (Chua, 1986). Hopper and Powell
(1985) and Chua (1986), therefore, merged the radical humanist and radical structuralist
paradigms into one, critical paradigm, because they believed that researchers could adopt
more than one paradigm at a time and could adopt an intermediate standpoint (see also:
Jick, 1979; Hopper and Powell, 1985; Chua, 1986; Boland, 1989; Laughlin, 1995; Punch,
2001; Modell, 2010; Loo and Lowe, 2011). Indeed, Jick (1979) argued that the cross
paradigm approach was beneficial if it worked best in addressing the research problem. In
addition, Boland (1989) criticised the separation between the subjective and objective
dimensions when setting assumptions about the nature of social science. Thus, instead of
starting with ontological and epistemological assumptions, many authors start off with the
research question and what they are trying to find out in order to define their research
framework (Jick, 1979; Leedy, 1993; Tashakkori and Teddlie, 1998; Punch, 2001; Bryman,
2006; Loo and Lowe, 2011). This approach follows a pragmatic paradigm that advocates
employing ―whatever philosophical and/or methodological approach works for the
particular research problem under study‖ (Tashakkori and Teddlie, 1998, p. 5). Pragmatists
focus on the research problem and use all available methods to understand it (Puchn, 2001;
Rocco et al., 2003). Burton (2007) asserts that ―qualitative research methods have played an
important role in investigations of issues that do not fall under any common understanding
of the behaviour notion‖ (p.8). Hence, many authors favour mixing quantitative and

114
qualitative methods to achieve the benefit of triangulation93
and enable them better to
understand the social reality and contribute towards validating the research findings (Jick,
1979; Eisenhart, 1989; Smith, 1991; Rocco et al., 2003; Modell, 2005, 2010; Loo and
Lowe, 2011). Eisenhart (1989) asserted that ‗triangulation made possible by multiple data
collection methods provides stronger substantiation of constructs and hypotheses‖ and ―the
combination of data types can be highly synergistic‖ (p.538). This is because, he argued,
―overlapping data analysis with data collection not only gives the researcher a head start in
analysis but, more importantly, allows researchers to take advantage of flexible data
collection‖ (p.539). Triangulation evolved to comprise using multiple data collection and
analysis methods, and multiple data sources (Denzin, 1978; Jick, 1979) in order to
overcome the intrinsic bias that emerges from adopting single-methods, single-observer,
and single theory studies (Eisenhart, 1989). As stated by Smith (1991, p.482):
―We must use all available data weapons of attack, face our problems realistically and not
retreat to the land of fashionable sterility, learn to sweat over our data with an admixture
of judgment and intuitive rumination, and accept the usefulness of particular data even
when the level of analysis available for them is markedly below that available for other
data in the empirical area.‖
In contrast to Burrell and Morgan (1979), who believed that quantitative and qualitative
methods stem from different ontological and epistemological assumptions, it is argued that
mixed methods could be used in the same research or across paradigms (Collis and Hussey,
2009). For example, although quantitative studies in the field of finance are located in the
functionalist paradigm, this does not mean that qualitative methods are restricted to the
interpretive paradigm or cannot be located in the functionalist paradigm (Burton, 2007;
Collis and Hussey, 2009; Modell, 2010). Mixed methods are widely discussed and used in
the social sciences (Denzin, 1978; Jick, 1979; Eisenhart, 1989; Smith, 1991; Leedy, 1993;
Laughlin; 1995; Deetz, 1996; Tashakkori and Teddlie, 1998; Rocco et al., 2003; Creswell,
93 Triangulation is defined by Denzin (1978) as "the combination of methodologies in the study of the same phenomenon" (p.291).

115
2009; Modell, 2010; Grafton et al., 2011).94
In particular, qualitative methods are employed
in several finance studies, such as Mallin (1995), Helliar et al., (2000), Holland (2001),
Kreander (2002), Al-Abdulqader (2003), McClusky (2005), Middelton (2006), Burton
(2007), Tijjani (2008), Xu (2010), Khan (2011), Al-Mujamed (2011). The next section
outlines the philosophical assumptions underpinning the current research and section 4.4
then discusses the research methods in this thesis.
4.3 The Research Objectives and Philosophical Assumptions Underpinning the
Present Study
As outlined in Chapter 1, the primary purpose of this study is to increase our knowledge
and understanding of the issues associated with the creation and performance assessment of
the Halal and non-Halal portfolios of securities listed on the KSE in order to investigate
whether Islamic funds, and religious and ethically driven investors bear any financial
penalty in order to comply with their values. This study examines the impact of using
different screening methods on the creation and hence performance of Halal portfolios.
Furthermore, the thesis explores the impact of making the screening ‗tighter‘ and ‗stricter‘
on the choice of securities in Halal portfolios, to investigate whether it is possible to move
towards pure Halal investments without compromising performance. Finally, this thesis
seeks to discover whether the Shariah-compliant classification of stocks, firm size, sector
or global financial crisis (GFC) period affect performance. Therefore, if there is no
significant penalty for PH investments, having ‗stricter‘ Shariah-compliant portfolio, and
the Shariah classification of stocks does not affect performance, then there is a valid reason
for Shariah scholars to justify banning investment in MH stocks based on current screens
(see Chapters 1 and 5).
In light of the above mentioned research objectives and the discussion in section 4.2
regarding Burrell and Morgan‘s (1979) framework, the current investigation does not seek
94 See Grafton et al. (2011) and Malina et al., (2011) for more details about the the opportunities, challenges advantages, and disadvantages of mixed methods research.

116
to change the status quo, as it is interested in studying the impact, rather than trying to
change, the current situation regarding Halal investments. Hence, the radical humanist and
radical structuralist paradigms are eliminated as they are located within the sociology of
radical change. Johnson and Duberley (2000) affirm that ―by accepting the assumptions that
underpin the sociology of regulation, that assumption that constitutes the sociology of
radical change is denied and vice versa‖ (p. 79). However, the research may provide some
insights that could have policy implications for changing the current practice of Islamic
funds management, but such implications are as a result of the research rather than a
targeted objective. Therefore, by denying the underlying assumptions of the radical
humanist and radical structuralist paradigms, the researcher accepts the assumptions of the
functionalist and the interpretive paradigms. In addition, the researcher assumes that there
is a concrete reality; knowledge is gained through the study of tangible ‗real‘ information,
as accounting and stock prices data are real hard data. Further, listed securities are real,
hard, factual investments for investors who are social human beings; hence, the realist
ontology and a positivist epistemology are followed.
Islamic investment principles are derived from the Qur’an and Sunnah which are available
in hard copy, and are read by millions of people. This presents an objectivist ontology and
epistemology standpoint followed by Muslims, and as the sources of Shariah that regulates
all matters related to the lives of Muslims, including economic and investment issues
(Chapra, 2000; Al-Qaradawi, 2005; Kamil, 2011). Therefore, these religious and ethical
guidelines are assumed to be deterministic as humans that are Muslims are not completely
free-willed and independent to do as they like. Further, Islamic funds (and Islamic
companies) are governed and guided by Shariah principles in setting up their investment
decisions; hence, they appoint Shariah scholars to SSBs (Delorenzo, 2007; Karim, 2001).
SSBs play a vital role in this context in clarifying and explaining the guidelines, and work
with investment decision makers in Islamic funds or investment companies to ensure

117
adherence to Shariah guidelines (Delorenzo, 2007). Similarly, Muslim investors should
follow such Shariah guidelines and are not free to invest in any stock in the market, and
avoid investing in ‗sin‘ stocks, as defined by Shariah. In addition, Muslim investors are not
allowed to short sell stocks because, in Shariah, the commodity must be owned by the
seller at the time of sale (Usmani, 2005). Nevertheless, at the same time, Shariah does not
reject the subjectivist ontology and epistemology standpoint, because there is also evidence
in the Qur’an that everything we perceive as being real is as a result of our own experiences
(Kamil, 2011). For instance, Allah noted in the Qur’an, as translated by Assad (2008,
p.383):
―And God has brought you forth from your mothers‘ wombs knowing nothing - but He
has endowed you with hearing, and sight, and minds, so that you might have cause to be
grateful‖ (16:79).
Thus, this verse shows that humans come into the world without any knowledge but, over
time, they acquire knowledge from experience through the sense of hearing, seeing and
feeling. Kamil (2011) argues that:
―Islam [is] between the two extremes of both objectivist-subjectivist epistemology, and
realist-subjectivist ontology. It is worth noting that Muslims use the epistemology of
Allah to know His ontology. The main source of knowledge is the Qur’an and the Sunnah
through which we get to acquire the knowledge of Allah (epistemology) which will in
turn, lead us to know His existence (ontology) as the sole Creator via His Creation‖
(p.72).
This highlights the importance of legal reasoning or providing Shariah rulings on issues
that are not categorically mentioned in the Qur’an and the Sunnah text, called the Ijtihad
(see Chapter 1) because the Quar’an and Sunnah texts are limited and cannot cover all and
the daily issues unlimited (Al-Qaradawi, 2005; Bakar, 2008).95
Therefore, the Shariah
jurists developed an elaborate methodology within Shariah jurisprudence or Fiqh, which
refers to the science of Islamic law extracted from detailed Islamic sources and the process
of gaining knowledge of Islam through jurisprudence (Fiqh Encyclopedia, 1995, vol. 32,
95 See Chapter 3 for more details.

118
p.193). Hence, four schools of thought emerged in the early history of Islam, as discussed
in the chapter 1. Furthermore, Delorenzo (2007) highliths that the dynamic of ijtihad
inherent to fiqh helps Shariah scholrs to build upon the theoretical constructs. Indeed, the
main guidelines for Islamic investment are mentioned in the Qur’an and Sunnah (see
Chapter1). However, there are other Shariah issues related to investing in the stock market
that are not covered by either the Qur’an or Sunnah, such as: investing in mixed
companies96
; how to define the non-compliant screening threshold level if such mixed
investment is perceived to be Halal; how to purify non-compliant earnings; and the use of
interest-based instruments (T-bonds) in measuring the performance of Halal portfolios.
Despite this, the current thesis does not examine these Shariah issues in depth, but accept
them and investigates their impact on the performance of Halal portfolios in Kuwait.
Therefore, in order to undertake this research and achieve its aims, this thesis adopts the
realist ontology, a positivistic epistemology, a deterministic view of human nature, and a
nomothetic methodology. Hence, it is rooted in the functionalist paradigm of Burrell and
Morgan‘s (1979) matrix. Moreover, modern portfolio theory seems to be appropriate for the
research objectives and the functionalist paradigm as this theory accepts the status quo and
the objectivist approach for understanding the assumptions about the nature of social
science and provides a framework for understanding and evaluating the return and risk
characteristics of both Halal and non-Halal portfolios.
Unlike the mainstream literature that studies the performance of Islamic funds using readily
available data, as reviewed in the previous chapter, this study creates its own Halal and
non-Halal portfolios based on different screening criteria that are currently used in the
Islamic funds industry in the GCC, and in Kuwait in particular. It then examines the impact
of using different screening criteria on the performance of Halal portfolios and the
96 Mixed companies are those whose core activities are permitted by Shariah, but there are other activities that may contain a small extent of prohibited elements (AAOIFI Shariah standard, 2004, 2006; Al-Shubali, 2005).

119
reduction in the screening tolerance thresholds in order to come closer to ‗sin‘ free
investments. In order to meet these above objectives, the research is divided into six strands
of empirical work that are arranged in chronological order as shown in Figure 4.3.
Figure 4.3: The Chronological Order the Empirical Work
Note: This figure shows the steps and methods followed by the researcher in a chronological order
to achieve the research objectives.

120
Figure 4.3 outlines the sequence of the empirical work with the methods used to achieve the
research objectives as follows. First, due to the dearth of literature on this relatively new
discussed issues, information was gathered via a series of interviews with 58 key figures in
the Islamic investment funds industry in the GCC, particularly Kuwait (Chapter 5). These
interviews took place over the period January to March 2011. They were essential to pilot,
define the scope, and design the quantitative empirical work. This is accordingly to Borg
and Gall (1986) who highlighted that qualitative methods such as interviews are suitable for
studying new phenomena and generating hypotheses which is applicable to the current
study.The second piece of empirical work (Chapter 6) involves a content analysis to collect
the necessary data, based on the feedback obtained from the interviews, to create 19
hypothetical portfolios based on different screening strategies. Specifically, a content
analysis of the annual reports of companies listed on KSE and the companies‘ websites is
used to collect the data required for the Shariah screening; this is then used to create the
different hypothetical portfolios. The process of collecting and preparing the data to
conduct the screening consumed two months from December 2011 to January 2012 and the
screening process and creating the portfolios took another three months from February to
April 2012.The third part of the study (Chapter 7) undertakes portfolio performance
evaluation measures to determine the return and risk characteristics of the portfolios created
portfolios in Chapter 6 to examine whether their performance is significantly different
between the Halal and non-Halal portfolios. Chapter 7 also examines the impact of using
an appropriate Shariah-compliant alternative to the risk-free rate when measuring the risk-
adjusted performance of Halal portfolios. To measures portfolios performance, the chapter
uses statistical tests and risk-adjusted performance measures, namely Treynor ratio
(Treynor, 1965), the Sharpe ratio (Sharpe, 1966) and the Jensen-alpha (Jensen, 1968). The
final empirical chapter in this study (Chapter 8), involves: (i) a matched pair approach to
the portfolio creation to control for the size and sector of securities (creates additional 10

121
hypothetical portfolios); and (ii) a general linear model (GLM), fitted to the data to
investigate the sources of variation in the return of Halal and non-Halal stocks in Kuwait,
particularly to examine whether the Shariah classification of stocks, firm size, sector, and
GFC period affect performance. Chapter 8 also uses Sharpe, Treynor ratios and Jensen‘s
alpha to measure the matched pair portfolios.
The next section elaborates on the qualitative and quantitative research methods used in this
study.
4.4 Research Methods
Although a mixed-methods approach is adopted, this thesis is primarily located in the
functionalist paradigm, as is most finance research (Chua, 1986; Burton, 2007; Saunders et
al., 2012; Modell, 2010). The functionalist assumptions underpin the quantitative methods
that are used in conducting the empirical work. The use of semi-structured interviews is less
functionalist oriented, adding an interpretative dimension to the analysis when evaluating
the participants‘ views of the issues that arose during the interviews.97
Hence, as affirmed
by Bryman (2008), ―The research interview is a prominent data-collection strategy in both
quantitative and qualitative research‖ (p.193), and the vast majority of the questions were
objective about what the interviewees‘ knew and how, why they did things and hence falls
within the functionalist paradigm. For instance, the interviewees were asked about their
practices regarding Islamic funds screening criteria and process, the types of Halal equity
investments they included, the need to include mixed Halal stocks in Islamic funds, the
sources of information they used for screening, Islamic funds‘ performance measures they
employed, and other practical issues related to the performance of Halal investment, such
as Shariah-compliant alternatives for calculating the performance of Halal portfolios.98
97 Such as asking the participants about aspects they undertake themselves such as their motives to invest in or offer Islamic funds, the need to include mixed Halal stocks, and Shariah alternatives for the risk-free rate. 98 This strategy of using semi-structured interviews within the functionalist paradigm was followed by many researchers in the field of accounting and finance, such as Al-Abdulqader (2003), McCluskey (2005), Middleton (2006), Tijjani (2008), Khan (2011), AlMujamed (2011), and Khan (2012).

122
Although many authors have justified using different paradigms at the same time, as
discussed in the previous section, this thesis find Burrell and Morgan‘s (1979) assumptions
regarding the nature of society and the social sciences useful in underpinning the
philosophical assumptions, but since it uses both qualitative and quantitative methods, the
researcher does not adopt extreme standpoints on the ontological and epistemological
assumptions. Adopting a mixed method approach adds a triangulation element that is useful
for the research, as the findings of one research method can confirm or contradict the
results of another (Denzin, 1978; Jick, 1979; Leedy, 1993), as discussed above.
Having highlighted the philosophical assumptions of the current study in the previous
section, this section details the qualitative and quantitative research methods. In particular,
the main methods used include semi-structured interviews, content analysis, portfolio
construction, statistical analysis, portfolio traditional performance measures, matched pair
approach, and a General Linear Model (GLM). The following sub-sections describe each
method, while more details, especially the quantitative methods, are provided in the related
empirical chapters.
4.4.1 Semi-Structured Interviews
Denzin and Lincoln (2003) describe qualitative research broadly as ―qualitative researchers
study things in their natural settings, attempting to make sense of, or interpret, phenomena
in terms of the meanings people bring to them‖ (p.5).
There are several ways to obtain qualitative data, including interviews, focus groups,
ethnography, observation, and case studies (Borg and Gall, 1986; Denzin and Lincoln,
2003; Bryman, 2008; Berg, 2007).99
Interviews are one of the most beneficial methods of
data collection, as they help to generate rich insights into the interviewees‘ experiences,
99 Berg (2007, p.1) defines Ethnography as “the art and science of describing a group or culture”, while focus groups is a type of interview that involves more than one interviewee in the discussion to allow the researcher to explore many views at once, and measure the extent of agreement about topics among the interviewees (Bryman, 2008). See Bryman (2008, pp391-392) for details on the critique of qualitative research methods.

123
values, attitudes and feelings (Borg and Gall, 1986; Punch, 2001; May, 2011).Collis and
Hussey (2009, p.144) define interviews as ―a method for collecting primary data in which a
sample of interviewees are asked questions to find out what they think, do or feel‖. Primary
data refers to sources of information gathered first hand by the researcher for the specific
interest of the study, while secondary data refers to information collected from sources that
already exist (Sekaran, 2003). Interviews are usually conducted through face-to-face
interaction; however, telephone, email and video conferencing methods are also used
(Sekaran, 2003; Denzin and Lincoln, 2003; Collis and Hussey, 2009). Interviews can be
structured, semi-structured or unstructured (Denzin and Lincoln, 2003; Sekaran, 2003;
May, 2011). Structured interviews are commonly used in surveys and opinion polls to
facilitate the quantitative analysis of the responses; hence, the tone of this type of interview
is not conversational but rather consists of questions requiring particular responses
(Saunders et al., 2012). In this type of interview, the interviewer asks each question and
then records the response based on a standardized schedule; hence, it does not allow any
modification of, or flexibility within, the questions asked (Sekaran, 2003; Saunders et al.,
2012). On the other hand, unstructured interviews are non-standardized, open-ended, do not
require a predetermined list of questions; and provide the interviewee with an opportunity
to talk freely about events and beliefs related to the research topic in more depth (Punch,
2001; Denzin and Lincoln, 2003; Saunders et al., 2012). This type of interview is valuable
when a researcher seeks to understand complex behaviour or elicit the details of an
individual‘s life history (Punch, 2001; Denzin and Lincoln, 2003). The disadvantages of
unstructured interviews are that they can be time consuming; it is difficult to control the
range of topics and is hard to analyze the data (Collis and Hussey, 2009). Semi-structured
interviews are located between these two types of interview, and are described by Bryman
and Bell (2007) as follows:
―The researcher has a list of questions on fairly specific topics to be covered, often
referred to as an interview guide, but the interviewee has a great deal of leeway in how to

124
reply. Questions may not follow on exactly in the way outlined on the schedule. Questions
that are not included in the guide may be asked as the interviewer picks up on things said
by interviewees. But, by and large, all of the questions will be asked and a similar
wording will be used from interviewee to interviewee‖ (p. 474).
Semi-structured interviews were chosen for this research since the main objective in
conducting interviews was to help define the scope of the empirical work to create and
evaluate Halal-based portfolios. In addition, it was also hoped that they might provide some
insights into practical Shariah issues underpinning Halal investment in GCC counties in
general and in Kuwait in particular. Hence, semi-structured interviews were preferred over
structured ones or a questionnaire survey because they could provide the interviewer with
an opportunity to be flexible and adaptable, as he could alter the questions and vary them
immediately (Borg and Gall, 1986). Moreover, semi-structured interviews consist of closed
and open-ended questions, therefore eliciting reflective discussion rather than specific
answers to structured questions (Punch, 2001; May, 2011). In addition, oral responses
provide much more information than written ones, and they also allow follow-up questions
or elaboration on certain responses made during the interview (Borg and Gall, 1986). Thus,
semi-structured interviews were more suitable than unstructured ones for obtaining the
required data, gaining sufficient insights into the particular topics under investigation, and
ensuring that all of the questions were covered within the time constraints (Borg and Gall,
1986; Collis and Hussey, 2009). Furthermore, interviews help to reduce the potential errors
arising from misunderstandings or confusion, as they allows the interviewer to repeat,
rephrase or clarify any interview question to ensure that the interviewees fully understand it
(Bryman, 2008), which is a significant advantage of interviews over other data gathering
methods, such as questionnaires. However, interviews are time consuming and expensive to
conduct and analyze, and it may be difficult to gain access to the appropriate interviewees
(Collis and Hussey, 2009). Nevertheless, semi-structured interviews offer the best available
method for collecting in-depth, focused information about the topics under investigation

125
(May, 2011; Saunders et al., 2012). Therefore, the first empirical work in this research
(Chapter 5) involved undertaking semi-structured interviews with 58 key stakeholders in
the Islamic funds industry in the GCC, mainly Kuwait. The researcher had no difficulty in
arranging a large number of interviews, compared to other studies that use semi-structured
interviews100
, since the researcher works in the industry and had easy access to participants.
This adds to the significance of this study, as it contributes to the lack of comprehensive
investigation with this wide range of practitioners in the field of the Islamic funds industry.
Being at the forefront of the Islamic fund industry is highly valuable for a thorough
understanding of the examined issues, where some of them are investigated for the first
time, contributing to our knowledge.
Many of the interviews were arranged prior to the research field trip to Kuwait. The
interviews were conducted between January and March 2011. Fifty one of them were face-
to-face interviews, conducted in Kuwait, while seven involved conference calls with
interviewees in Egypt, Saudi Arabia, Bahrain, Qatar, and UAE. See Table 5.1 in the
following chapter that summarizes the background details of the interviewees.
The interviewed stakeholders are categorized into three main groups, namely: (i) fund
managers (FM); (ii) Shariah Scholars (SS), including SSB members and Shariah auditors;
and (iii) others, comprising investors, index providers, and regulators.
The majority of interviewees have a higher education (either a Master‘s or PhD degree).
For instance, 20 of the interviewees (34.4%) had a PhD degree, most of whom were in the
SS group, and 26 (44.8%) had a Master‘s degree. The bulk of the interviews were
conducted in Kuwait city, where most Kuwaiti corporate and financial activities are
located.
The interview process began with the selection of available key figures in the Islamic funds
industry in Kuwait and from few countries in the region. FMs interviewees represented
100 The similar study had only interviewed 7 Islamic fund managers.

126
85% of the Islamic equity fund managers in Kuwait (22 out of 26) including fund managers
of all (100%) six pure Islamic equity funds offered by the largest Islamic and conventional
investment companies in Kuwait. In addition, the interviewees cover all five Islamic index
providers in Kuwait and the largest Islamic index and screening provider in the Middle
East. They also cover all (100%) four Shariah list providers in Kuwait, including the two
largest Shariah consulting companies in Kuwait, thus capturing 100% of the Islamic indices
and list providers. Additionally, interviews were conducted with the twelve most active
Shariah scholars in the GCC, who are also Shariah board members across the globe. Three
of these are ranked among the top ten scholars in the world; these top ten scholars hold 450
out of the 1141 SSB positions available, representing 40% of the Islamic finance industry
worldwide (Zawya report, 2011). These twelve Shariah board members are also members
of the Higher Consultant Committee for the Application of Shariah law in Kuwait
(HCCAS), the AAOIFI in Bahrain, the S&P global Islamic index, the Islamic Development
Bank in Saudi Arabia, and the International Islamic fiqh Academy. Overall, they represent
the bulk of the Shariah scholars‘ population in both Kuwait and the GCC. The same applies
to the ten Shariah auditors working in six Islamic institutions in Kuwait, and the other four
Shariah auditors spread over the UAE, Qatar, Bahrain, and Saudi Arabia. Furthermore,
interviews were conducted with representatives of three regulatory bodies in Kuwait, the
CBK, the KSE, and the CMA. Thus, the interviewees represent nearly all of the institutions,
Shariah scholars involved in the Halal investment industry in Kuwait and, hence, to some
extent, the findings of these interviews are generalizable, and fit with the functionalist
paradigm of this research.
To prepare for the interviews, a set of questions were written in English and then translated
into Arabic after consulting with three academics from Kuwait University, to stimulate
discussion and ensure that the interview process would collect all of the information
required. A mixture of both closed and open ended questions were used; however,

127
following a functionalist model, the majority of the questions were close ended, requiring
short answers in order to explore the research questions and increase the comparability of
responses, thus allowing statistical summarization. Nevertheless, the open ended nature of
some of the interview questions grants some flexibility in the responses and between the
different participant groups. The interview questions were established based on the
available literature,101
modern portfolio theory, and from the prior discussions with few
practitioners in the Islamic funds industry before conducting the interviews in January
2011.
The question guide targeted all participant groups, but a few alterations were made to
certain questions, to suit each group, although the majority of questions were common for
all three stakeholders groups (see Appendix 5.1 for the interview questions). In brief, the
participants were asked specific questions revolving around the following issues: (i) the
growth of Islamic funds, the motivation to offer or invest in Islamic funds; (ii) the concept
and definition of Halal investment; (iii) the screening criteria and process, and the sources
of information used for screening; (iv) factors contributing to the performance of Islamic
funds; (v) the performance evaluation of Halal portfolios; and (vi) the need to establish a
new Halal alternative for risk-adjusted measurements and to include mixed Halal
investments.
Prior to conducting the interviews, the participants were told the purpose of the interview
and given a briefing on the overall research objectives without attempting to influence their
views. The invitation official letter from the University of Dundee was also provided before
each interview began (see Appendix 4.1).As Arabic is the formal language of business, the
interviews were conducted in Arabic, apart from three (FM10, FM14, and Other2), which
101 The researcher relied more on the Shariah jurisprudence literature in Arabic, as the literature on the performance of Islamic funds did not distinguish between Islamic funds that invest in pure Halal stocks (PH) and those that invest in mixed Halal stocks (MH) stocks.

128
were conducted in English, as the participants were non-Arab speakers.102
Each interview
session lasted 45-90 minutes, and all interviews were recorded with the permission of the
interviewee before being transcribed.103
In particular, in order to analyze the large number
of interviews, the original data were transcribed into written format which was then
categorized and coded for analysis to identify and explore the themes, patterns and
relationships. Excel spreadsheets were used to facilitate the analysis.104
The next chapter
discusses the findings of the interviews is detail, while the next sections discuss the
quantitative research methods used in this study.
4.4.2 Content Analysis
After obtaining information from the semi-structured interviews regarding the Shariah-
compliance screening criteria used in Kuwait, the screening process, and the sources of
information to perform it, a simple form of content analysis was used to gather data that
was then used to apply the screens to create the Halal portfolios.105
This is because, unlike
prior research on Islamic funds, the second empirical task in this thesis (Chapter 6) screens
each company in the KSE and creates different Halal and non-Halal portfolios that are used
for the purpose of this study. Only Derigs and Marzban (2008) conducted Shariah
screening using a special software package, however, this study uses manually collected
data which is arguably more accurate than software packages which may not capture all
non-Halal disclosures, as revealed in the interview analysis in Chapter 5. Content analysis
has already been used by Maali et al. (2006), Haniffa and Hudaib (2007), Aribi and Gao
(2010), Paino et al., (2011), Zubairu et al. (2011), Abbasi et al. (2012), Ameer et al. (2012),
102 FM10 and FM14 are from the US and Other 2 (index provider) is from India. 103 The researcher lost 11 recorded interviews from the tape recorder (iPhone) before they were transcribed; however, 8 of them were repeated. Hence, later notes were taken during each interview as a backup to the recorded tapes. 104 The process of transcribing, summarizing, and analyzing the 58 interviews took 4 months (from April-July 2011) before the findings could be written up (Chapter 5). 105 It is worth noting that content analysis is a method that may be used either qualitatively or quantitatively (Elo and Kyngas, 2007; Krippendorff, 2013), although others such as Bryman (2008) argue that it is firmly rooted in the quantitative research strategy.

129
and El Mosaid and Botti (2012) to measure the disclosure of ethical identity, Shariah, and
the social responsibilities of IFIs. However, this study uses content analysis to extract
information from companies‘ annual reports related to the Shariah screening criteria items
that will help in facilitating the screening of listed companies on the KSE.
Krippendorff (2013, p.24) states that ―content analysis is a research technique for making
replicable and valid inferences from texts (or other meaningful matter) to the contexts of
their use‖. Thus, is also known as a method of analyzing documents and texts (Weber,
1990; Neuendorf, 2002), hence, can be used for many purposes (Weber, 1990). Thus,
Researchers must judge what variations are most appropriate for their particular
investigation (Weber 1990), which makes the analysis process most challenging and
interesting (Elo and Kyngas, 2007). Elo and Kyngas (2007) outline that ―one challenge of
content analysis is the fact that it is very flexible and there is no simple, ‗right‘ way of
doing it (p.113).
Therefore, this study performs a simple form of content analysis of every section of each
company‘s annual report (e.g. financial statements, notes to accounts, directors‘ report,
chairman‘s report, auditor‘s report, and any sections related to Shariah reporting), the
annual Shariah report if available, articles of association for newly listed companies,
newspaper articles, company websites and the KSE website.
The content of the companies‘ annual reports was analyzed in relation to the screening
items discussed in Chapter 6. Thus, a checklist of these screening items was created as a
guide for extracting information about these screened items, discussed earlier. The sample
companies in this empirical study were all listed companies of the KSE, covering all sectors
including both financial and non-financial firms, namely: banking, investment, insurance,
real estate, industrial, service, food, and the non-Kuwaiti sector. The annual reports from

130
the period 31/12/2005-31/12/2010 were examined.106
The data were obtained from the hard
copies of annual reports collected by hand as such data were unavailable in electronic
format from any source. Since detailed financial statements for KSE-listed companies are
only published annually, the screening process is based on the six annual financial
statements published by each of the sample companies for 2005-2010. The gathered data
were transferred to Excel spreadsheets to facilitate the application of the screening.
Having collected the data, the next step was to use the data to apply different AAOIFI
screening criteria to assess each company in terms of their Shariah-compliance level and
classify them to either: PH, Sin, MH, or MS stocks as elaborated in Chapter 6 (see Figure
6.1). These were then used to create different value-weighted portfolios. The screening at
the end of each calendar year was used to create the portfolios for the following year. For
example, data from the companies‘ annual reports as of 31/12/2005 were used to construct
portfolios for 2006. This process was repeated for each year, and each portfolio was
rebalanced annually. The process of collecting and preparing the data to conduct the
screening took place during the second field trip to Kuwait, from December 2011 to
January 2012 and the screening process and creating the portfolios took another three
months from February to April 2012. The reliability of the content analysis was verified
through a test-retest method to assess the stability107
of the results over time (Hassan and
Marston, 2010; Krippendorff, 2013). Thus, the content analysis and screening process was
repeated three times in different time periods. Furthermore, the final screening results were
also compared with the available screened lists produced by three screening providers in
106 The non-Kuwaiti sector, however, was later excluded from the sample because the prices of companies listed in this sector were not available in DataStream to measure their performance. 107 Krippendorff (2013, p.270) describes stability as “the degree to which a process is unchanged over time. It is measured as the extent to which a measuring or coding procedure yields the same results on repeated trials.”

131
Kuwait (AL-Aman, Al-Raya and Mashora, and Al-Muthana).108
The next sections
summarize the quantitative methods used in this study.
4.4.3 The Quantitative Methods
The purpose of the quantitative methods chapters are to analyze the return and risk
characteristics of the created Halal portfolios and examine whether they are significantly
different from non-Halal portfolios. In particular, the quantitative analysis includes: (i)
descriptive statistics of each portfolio‘s risk and raw return characteristics; (ii) the mean
difference of the portfolios‘ returns; (iii) correlation analysis; (iv) the portfolio‘s risk-
adjusted performance evaluations based on traditional risk-adjusted valuation
measurements using the risk-free rate; and then with a Shariah-compliant alternative, (v)
the matched pair approach, and (vi) the GLM. The following section will only elaborate on
the risk-adjusted performance measures as they will be used in both Chapters 7 and 8 while
the other quantitative methods are detailed in the related empirical chapters.
4.4.3.1 The Risk-Adjusted Performance Measures
This section shows the portfolios‘ performance evaluations measures considering both risk
and return, using the three widely used portfolio risk-adjusted performance measures;
namely, the Treynor ratio (Treynor, 1965), the Sharpe ratio (Sharpe, 1966) and the Jensen-
alpha (Jensen, 1968). These three risk-adjusted traditional measures were selected because
they are well established and have been used in many prior studies of funds‘ performance,
including ethical and social responsible funds‘ performance (Luther et al., 1992; Mallin et
al.,1995; Bal and Leger, 1996; Sauer,1997; Bello, 2005; Kreander et al., 2005; Chong et
al., 2006; Statman, 2006; Schröder, 2007; Lyn and Zychowicz, 2010; Carosella et al., 2012)
as well as in Islamic funds‘ performance (Hakim and Rashidian, 2004; Hussein, 2004;
108 The Kuwait screened companies lists were available for only certain sample years provided by Al-aman (using AAOIFI 2004), Al-Raya & Mashora (using AAOIFI 2006), and Al-Muthana (for pure Halal companies). It is worth noting that Al-Raya & Mashora changed to AAOIFI 2004 after the GFC, as revealed by the interviews.

132
Hussein and Omran, 2005; Abdullah et al., 2007; Elfakhani et al., 2007; Abderrezak, 2008;
Girard and Hassan, 2008; Albaity and Ahmad, 2008; Alam and Rajjaque, 2010; Rahimie,,
2010; Merdad et al., 2010; Hayat and Kraeussl, 2011; Shah et al., 2012; Walkshäusl and
Lobe, 2012). Hence, by using the same performance measures, the results of this research
can be compared with the findings of similar previous research in a more meaningful
manner. The remainder of this section presents the traditional risk-adjusted portfolios
measures, starting with the Sharpe measure.
The traditional Sharpe performance ratio measures the portfolio‘s equity risk-adjusted
premium per unit of total risk, which estimates the ratio of average return to the standard
deviation of the portfolio return, as shown in equation 4.1:
[4.1]
where is the average weekly return gained by portfolio i, the weekly return of a risk-
free rate asset and the standard deviation of the weekly returns of portfolio i. In this
study, the CBK‘s one year T-bond, derived from its official website, was used as a proxy
for the risk free rate. In addition, the one year Murabahah return rate is also used as a
Shariah-compliant proxy for the interest-based risk free rate.109
The Murabahah rate was
chosen because it was the one that was most frequently recommended by the interviewees.
Data on the Murabahah rate were downloaded from the Thomson Reuters Knowledge
database. However, since data on the Murabahah rate were available only since September
2009, the Shariah-compliant performance ratio is only calculated for the bearish period
(2010-2011). The denominator of the Sharpe ratio is the standard deviation of the portfolio
return that measures how widely the returns are dispersed from the mean returns,
calculated based on the following equation 4.2:
109 Appendix 7.12 plots the performance of the T-bond rate (Conventional risk-free rate) and the Murabahah rate.

133
√ ∑
[4.2]
Where is the number of observations calculated over the full and sub sample periods, is
the return on the portfolio and the is the mean return on the portfolio.
The lower the standard deviation, the higher the ratio or the excess return to variability, the
higher the Sharpe ratio, and the better the portfolio‘s performance. The Sharpe measure is
the most relevant for investors for whom the portfolio constitutes a substantial part of their
overall assets (Reilly and Brown, 2006). It is also argued that the Sharpe ratio provides a
more satisfactory and better statistical measure than that of Treynor (Jobson and Korkie,
1981). The Sharpe ratio is not dependent on the assumptions of the CAPM compared to the
Treynor and Jensen-alpha performance measures that rely on the CAPM regression, as
shown in the following equation 4.3:
[4.3]
where is the expected return on the portfolios i, is the expected return on the market
benchmark, and is the return on a risk-free asset (which in this study is CBK‘s one year
T-bond and the one year Murabahah return rate is also used as a Shariah-compliant proxy
for the interest-based risk free rate), and , is the slope of the SML that draws the
relationship between the portfolio‘s return and risk as measured by the portfolio‘s
systematic risk.110
Both Treynor and Jensen-alpha use βi, which is sensitive to the choice of market
benchmark. Consequently, different market benchmarks will result in different portfolio
alphas and betas and hence different rankings for the same portfolios. However, the Sharpe
ratio has been criticized for concentrating on total risk, measured by the standard deviation,
instead of the market risk or systematic risk, measured by the beta. Portfolio theory
110
The beta can also be estimated by the following equation:
where cov represents the covariance that exists between the return on the asset and that on the market and
is the variance of the market returns.

134
suggests that the unique risk of a security should be diversified away in a large portfolio
and only the remaining, undiversified risk should be priced by the market. Hence, the
Treynor (1965) performance measure overcomes this shortcoming, as it uses the market
risk or beta of the portfolio as the denominator rather than the standard deviation that is
used in the Sharpe ratio and measures a portfolio‘s equity risk premium per unit of
systematic risk, as in equation 4.4:
[4.4]
Where is the average weekly returns gained by portfolio i, is the weekly return of a
risk-free rate asset, and is portfolio i systematic risk, estimated according to equation 4.3
above. A higher Treynor ratio is better than a lower one, implying a better performance.
The Treynor ratio is more appropriate for investors who wish to know what the increment
in the expected return due to security selection will be, after the systematic risks have been
equalized (Treynor, 1965).
Therefore, by using both the Sharpe and Treynor measures, the systematic and
unsystematic risks are incorporated in the portfolios‘ performance evaluation. Hence, a
portfolio with a superior Treynor ratio may have a lower Sharpe ratio. This is because the
portfolio may have considerable non-market risk that is not considered by the Treynor ratio.
Thus, the ranking of the portfolios based on these measures may vary. Nevertheless,
various studies have found that there is a high correlation between them (Mallin et al.,
1995; Bal and Leger, 1996; Kreander, 2005). However, neither of the two measures
indicates by how much (in terms of percentage return) a portfolio has out- or
underperformed the market. Consequently, the other common traditional performance
measure that addresses this is the Jensen-alpha (1968) based on the CAPM regression, as
estimated in equation 4.5 as follows:
[4.5]

135
The term is the alpha of portfolio i, that indicates that the difference in the return of the
portfolio compared to the expected return from the SML, is the beta of portfolio i, which
is the slope of the SML that draws the relationship between the portfolio‘s return and risk
as measured by the portfolio‘s systematic risk, and is a random error term. According to
Treynor (1965), the Jensen measure is more appropriate for assessing a group of portfolios
against a market benchmark. It evaluates whether a portfolio has out- or underperformed a
market portfolio by testing whether the constant in equation 4.8 is significantly different
from zero. Hence, the constant term in the equation can be used to measure a portfolio‘s
performance, as a portfolio manager who possesses better stock selection skills will be able
to select undervalued securities, and therefore would be able to generate returns that are
consistently higher than those predicted by the beta (Jensen, 1968). Thus, if the Jensen alpha
is positive, then the portfolio is outperforming; it is underperforming if the Jensen alpha is
negative. The higher the Jensen alpha, the better the performance.
4.5 Summary
This chapter has outlined the research methodology and methods employed in the present
thesis. In particular, the research‘s philosophical assumptions and the paradigm
underpinning the study were detailed in the light of Burrell and Morgan‘s (1979)
framework. As the research is a combination of a realist ontology, a positivist
epistemology, a deterministic standpoint on human nature and a nomothetic methodology,
the functionalist paradigm was adopted. The chapter justified the use of mixed methods for
the data collection and analysis within the functionalist paradigm (Burton, 2007; Collis and
Hussey, 2009; Modell, 2010). The data and methods employed are presented and discussed.
The semi-structured interviews, content analysis for conducting the screening, statistical
test, portfolio performance measures, matched pairings, and the GLM were highlighted.
The next four chapters will discuss the empirical stands of the research in greater detail,
using the methods outlined in this chapter.

136
Chapter 5: Practitioners’ Perspectives of Halal Investments

137
5.1 Introduction
As established in the previous chapter, the first research method employed in this study is
semi-structured interviews. This chapter reports the findings of interviews with 58
stakeholders from a wide variety of groups in the Islamic investment funds industry in
Kuwait and the GCC countries. The literature review in Chapter 3 revealed that most
previous studies on Islamic investment use quantitative techniques to understand their
return and risk behavior. This research, however, adds to the extant body of knowledge by
also exploring the practical issues surrounding the Halal equity investments industry via
qualitative techniques. This is due to the fact that there is a scarcity of data and literature
about Shariah-compliant screening in Kuwait and GCC, and the difficulty in quantifying
some of the Shariah issues related to the Halal investment industry. The interviews are
used to examine the relatively ‗new‘ phenomena and insights of Islamic funds practices in
emerging markets (see Borg and Gall, 1986). The chapter investigates interviewees‘
perceptions regarding the concept of Halal investments, the motivations and drivers for the
industry‘s growth, and Shariah issues underpinning Islamic funds‘ practices related to
screening, asset allocation, performance evaluation, and benchmarking. The outcome from
the analysis is intended to provide the basis for the quantitative analysis discussed in the
proceeding quantitative empirical chapters.
The organization of the remainder of this paper is as follows. Section 5.2 provides
background information about the interviews and sample method. Sections 5.3-5.7 discuss
interviewees‘ responses to the questions shown in Appendix 5.1. More specifically, section
5.3 examines the growth of Islamic funds, section 5.4 examines the concept and definition
of Halal investments and section 5.5 discusses the screening criteria and process. Section
5.6 investigates the factors that contribute to the performance of Islamic funds. Section 5.7
explores the portfolio performance evaluation and the need to establish new alternative
risk-adjusted measures and finally section 5.8 concludes.

138
5.2 Sample and Research Method
The 58 semi-structured interviews took place over the period January to March 2011 and
were based mainly in Kuwait city in the state of Kuwait. Kuwait city was selected because
it is the capital and commercial city where all financial institutions are located, including
the central bank, Stock Exchange, investment fund companies and Shariah consulting
companies. The interviews were conducted face-to-face, although six phone interviews out
of the 58 were conducted in other GCC countries, namely in Saudi Arabia, Qatar, Bahrain
and UAE. One interviewee was from the largest Islamic index provider in the Middle East,
based in Egypt but whose head office is in the USA. Working in the industry and
maintaining good relationships facilitated the conduction of the interviews.
The broad themes were highlighted at the beginning of each interview and interviewees
were asked to talk freely about the issues to establish a relaxed atmosphere and build trust
(see Borg and Gall, 1986). Interviews were recorded with the permission of the
interviewees and were then transcribed in Arabic, relevant parts also being translated into
English. Since the number of interviews was large, Excel templates were used to
summarize and analyze interviewees‘ responses.
Table 5.1 provides background information about the fund managers (FM), Shariah
Supervisory board members (SSB) and Shariah auditors, and (Others) that includes
investors, index providers, and regulators. The interviewees were assigned codes so that
their identity would remain anonymous.

139
Table 5.1: Interviewees’ Summary Details No. Interviewee Gender Qualification Invest in GCC Organization Location No. Interviewee Gender Qualification Position Organization Location
1 FM1 Male Master Yes Con. Inv. Comp. Kuwait 24 SS1 Male PhD SSB AAOIFI Kuwait
2 FM2 Male Bachelor No Con. Inv. Comp. Kuwait 25 SS2 Male PhD SSB Kuwait University Kuwait
3 FM3 Male Master Yes Con. Inv. Comp. Kuwait 26 SS3 Male PhD SSB Kuwait University Kuwait
4 FM4 Male Master Yes Con. Inv. Comp. Kuwait 27 SS4 Male PhD SSB Kuwait University Kuwait
5 FM5 Male Master Yes Con. Inv. Comp. Kuwait 28 SS5 Male PhD SSB Kuwait University Kuwait
6 FM6 Male Master Yes Con. Inv. Comp. Kuwait 29 SS6 Male PhD SSB Kuwait University Kuwait
7 FM7 Male Master Yes Islamic. Inv. Co. Kuwait 30 SS7 Male PhD SSB Kuwait University Kuwait
8 FM8 Male Master Yes Islamic. Inv. Co. Kuwait 31 SS8 Male PhD SSB Shariah Consulting
Co.
Kuwait
9 FM9 Male Bachelor No Islamic. Inv. Co. Kuwait 32 SS9 Male PhD SSB HCCAS* Kuwait
10 FM10 Male Master No Islamic. Inv. Co. Kuwait 33 SS10 Male PhD SSB Shariah Consulting
Co.
Kuwait
11 FM11 Male Master No Islamic. Inv. Co. Kuwait 34 SS11 Male PhD SSB Islamic Development
Bank
K.S.A
12 FM12 Male Master No Islamic. Inv. Co. Kuwait 35 SS12 Male PhD SSB HCCAS* Kuwait
13 FM13 Male Master Yes Islamic. Inv. Co. Kuwait 36 SS13 Male Master S.A Islamic Inv. Co Kuwait
14 FM14 Male PhD No Islamic. Inv. Co. Kuwait 37 SS14 Male Bachelor S.A Shariah Consulting
Co.
Kuwait
15 FM15 Male Master No Consulting Co. Kuwait 38 SS15 Male Master S.A Shariah Consulting
Co.
Kuwait
16 FM16 Male Master Yes Islamic. Inv. Co. Kuwait 39 SS16 Male Master S.A Islamic Bank Kuwait
17 FM17 Male Master No Consulting Co. Egypt 40 SS17 Male PhD S.A Islamic Bank Kuwait
18 FM18 Male Bachelor No Institutional Inv. Kuwait 41 SS18 Male Bachelor S.A Shariah Consulting Co.
Kuwait
19 FM19 Male Master No Institutional Inv. Kuwait 42 SS19 Male Master S.A Islamic Inv. Co. Bahrain
20 FM20 Male Bachelor Yes Institutional Inv. Kuwait 43 SS20 Male PhD S.A Islamic Inv. Co. Qatar
21 FM21 Male Master Yes Institutional Inv. Kuwait 44 SS21 Male Bachelor S.A Islamic Bank UAE
22 FM22 Male Bachelor No Institutional Inv. Kuwait 45 SS22 Male Master S.A Islamic Inv. Co. KSA
23 FM23 Male PhD No Institutional Inv. K.S.A 46 Other1 Male Master Index
Provider
Islamic Inv. Co Kuwait
47 Other2 Male Master Index
Provider
Islamic Inv. Co Kuwait
48 Other3 Female Master Index
Provider
Islamic Inv. Co Kuwait
49 Other4 Female Master Index Provider
Conventional Inv. Co. Kuwait
50 Other5 Male PhD Index
Provider
Consulting Co Egypt
51 Other6 Male PhD Investor Kuwait University Kuwait
52 Other7 Male Master Investor Islamic Inv. Co Kuwait
53 Other8 Male PhD Investor Kuwait University Kuwait
54 Other9 Male Bachelor Investor Ministry of Education Kuwait
55 Other10 Male Bachelor Investor Ministry of Islamic
Studies
Kuwait
56 Other11 Male Bachelor Regulator KCB Kuwait
57 Other12 Male PhD Regulator CMA Kuwait
58 Other13 Female Bachelor Regulator KSE Kuwait
Note: This table displays summary background information about the interviewees. The interviewees were assigned codes in order that their identities remain anonymous; these codes are reported in the
interviewee column. The codes used express the category of the participant. FM represents fund manager or an institutional investor. SS is used to describe Shariah Supervisory baod member (SSB) or
Shariah Auditors, while Other is used to describe Index providers, investors, and regulators. An * HCCAS is the abbreviation of Higher Consultant Committee for Application of Shariah law in Kuwait.

140
An inspection of Table 5.1 reveals that only 3 interviewees were females, because most fund
managers, investors, and Shariah scholars are men; however, more women are getting involved
in the industry as noted by some of the interviewees. The vast majority of interviewees had a
higher education (either Masters or PhD degrees) and are located in Kuwait. Although the
findings of the interviews cannot usually be generalized, the interviews of this study reflect a
high proportion of the Islamic equity industry population in Kuwait, and thus the findings can,
to some extent, be generalized. For instance, the fund managers interviewed represent 85% of
the Islamic equity fund managers in Kuwait (22 out of 26) including all (100%) of the six pure
Islamic equity funds offered by the largest Islamic and conventional investment companies in
Kuwait. In addition, the interviews cover all five Islamic index providers in Kuwait and the
largest Islamic index and screening provider in the Middle East. The interviews also cover all
(100%) four Shariah list providers in Kuwait, including the largest two Shariah consulting
companies in Kuwait. This captures 100% of Islamic indices and list providers. Furthermore,
interviews were conducted with the twelve most active Shariah scholars in the GCC who are
also Shariah board members across the globe.111
Three of them are ranked among the top ten
scholars in the world; these top ten scholars hold 450 out of 1141 SSB positions and represent
40% of the Islamic finance industry worldwide (Zawya report, 2011). These twelve Shariah
board members are also members in the Higher Consultant Committee for Application of
Shariah law in Kuwait (HCCAS)112
, the AAOIFI in Bahrain, the S&P global Islamic index, the
Islamic development bank in Saudi Arabia, and the international Islamic fiqh academy. Indeed
they represent the bulk of the Shariah scholars‘ population in Kuwait and the GCC. The same
applies to the ten Shariah auditors working in six Islamic institutions in Kuwait, and the other
111 Although Table 5.1 shows that the SSB members are Professors in the Shariah collage at Kuwait University, they are SSB members in many Islamic funds on a part time basis. 112 A government organization established in 1991, as its responsibility is to prepare the circumstances in Kuwait to complete the application of Shariah law, where the study the governing laws and regulations and propose adjustments to assure their compliance with Shariah. See: http://www.sharea.gov.kw/

141
four Shariah auditors are in UAE, Qatar, Bahrain, and Saudi Arabia. Furthermore, interviews
were conducted with representatives from the three regulatory bodies in Kuwait, the CBK,
KSE, and the CMA113
which started to operate in March 2011. Therefore the interviews reflect
nearly all the institutions involved in Halal investing in Kuwait and to some extent these
findings are generalizable.
5.3 Growth of Islamic funds in the GCC
All the participants agreed that the Islamic equity fund industry had witnessed a remarkable
increase, after the boom of GCC stock markets in 2004. There was a growing interest and
awareness in the field of Islamic investment funds by professionals, academics and investors
including conventional investment companies and conventional banks. Twenty-three of the
interviewees, mainly SSB and regulators, saw the growth in Halal stocks concentrated mainly
in Islamic or so-called pure Halal stocks (PH) while the other 35 interviewees observed the
growth in both PH and Shariah-compliant or so-called Mixed Halal stocks (MH). Both types
of stocks will be defined in the next section. Many interviewees indicated that investee
companies attempt to meet Shariah screening criteria to make their stocks verified as Halal
stocks which are of Islamic fund managers and religious-driven investors‘ interest. According
to the interviewees, the core factors, driving the growth of the Islamic investment funds
industry and Halal stocks in the GCC financial markets are as follows: (i) investment demand
from Muslim and non-Muslim investors for Halal stocks;(ii) an increase in the level of
awareness of the Shariah compliant products and services; (iii) excess liquidity in the GCC
economies and available with investors ; (iv) the profitability and competitiveness of Islamic
funds and investee companies compared to their conventional counterparts; and (v) simplicity
113The authority’s responsibilities include regulating Stock market activities, supervise public and private subscriptions, and regulate and oversee acquisitions and mergers.

142
of products to be understood by conventional and global investors. Table 5.2 reports all the
factors according to the number of times they were mentioned by the participants.
Table 5.2: Growth Drivers of the Halal Equity Investment in the GCC
FM SS Other Total
Demand 23 21 13 57
Increase in awareness level 14 17 12 43
liquidity in the GCC 18 9 8 35
Profitable and competitive alternative 3 9 3 15
Simplicity of products understood by global investors 1 5 2 8
Progress in regulatory framework 0 3 0 3
Growth in Muslim population 0 2 1 3
Note: This table represents the overall interviewees‘ views on the factors that contributed to the growth of the
Halal equity investments funds industry according to the number of times they were mentioned by the
participants.
In addition to the factors summarized in Table 5.2, FM 22 noted that:
―The removal of Saddam Husain‘s regime has helped improve the investment
environment in GCC markets and in Kuwait particularly, creating more investment
opportunities. Since this event the number of listed companies at the Kuwait Stock Market
has increased, most of which are Islamic companies.‖
The most important growth factor of the industry is the strong demand for Halal investments
from both local investors in the GCC countries and big international investors such as Citibank
and HSBC. As a response to this growing demand, the supply side has increased with the
number of financial services institutions offering Islamic investment funds including
conventional financial institutions. A number of interviewees asserted that the demand had
caused many conventional financial institutions around the world, and within the GCC
countries, to convert to IFIs either totally or partially by providing Islamic windows.
The strong demand on Halal investment has enhanced the level of the awareness of Shariah-
compliant products and services, and Shariah scholars are now more involved in the industry.

143
However, six interviewees (FM 8, FM 9, Other 3, FM 21, SS1, and SS6) argued that there was
still a lack of awareness of the Halal investment industry and, like any other new concept or
product introduced for the first time, it had to go through a natural process to be well
understood and become popular.
This strong demand and awareness by fund managers and investors has created profitable
opportunities for Islamic investment funds to challenge and compete with conventional funds,
especially during the market boom in 2004 and 2005 when a large number of IFIs listed in
KSE. Many interviewees agreed that during that period Islamic investment funds and Halal
investee companies has been competing successfully compared to their conventional
counterparts. The interviewees‘ inputs regarding the factors that contributed to the growth of
the Halal equity investment in the GCC are very similar to that found in the literature (El-
Qorchi, 2005; Al-Jbsheh et al., 2007; Hasan and Dridi, 2010; Rahimie, 2010; Kpodar, 2010;
Ali and Syed, 2010). However, as noted by the vast majority of interviewees this demand
slowed down during the GFC in 2008 and during the recession period afterwards.
5.3.1 Motivations to Invest and offer Halal investments
This section sheds light on the intentions behind the investment decisions made by those who
invest in Islamic funds and Halal stocks (PH and MH) and those who have established and
manage Islamic funds; the research participants were asked about their motivation to invest or
offer such investments outlined in the following two sections.
5.3.1.1 Investors’ Motivations
Interviewees named four factors that motivated investors to invest in Halal equity investments:
(i) religious values (53%); (ii) profit (36%); (iii) diversification (8%); and (iv) ethical values
(3%), with religious and profit motives being the two main factors. This result is consistent

144
with results in Malaysia (Rahimie, 2010; Louche et al., 2012). According to many
interviewees, earning only Halal money is itself a religious obligation in accordance with the
prophet who said:
―Verily Allah is pure and he accepts only what is pure and indeed Allah has given those
orders to the believers, which he has given to the Messengers. He has said, ‗ O Messenger,
eat from the pure foods and work righteous‘.‖
Then the Prophet mentioned a man who undergoes a lengthy journey in a state that he is
disheveled and dusty .He spreads his hands towards the sky (calling), ― O my lord, O my
lord‖, however his food is Haram; So how will his call be answered!‖ [reported by Ahmad
2/328,Muslim 2/703]
The second most important motivation was profit maximization, as Other 5 pointed out:
―Of course investors seek a Shariah-compliant investment focus that it is Islamic but they
also are keen on the returns.‖
This finding is also consistent with Henry and Wilson (2004) and Rahimie (2010) who
documented that Islamic investment funds satisfy the religious requirements for Muslim
investors, and at the same time pursue a value maximizing approach.
Hardly any interviewees mentioned explicitly ethical motives (3%) as a reason for their
investment in Islamic funds; some of them implicitly thought that ethical values were part of
religious values. This might be interpreted that most of the interviewees did not distinguish
between religious and ethical values, as in Islam ethics are incorporated in religion (Al-Jazaeri,
1995; Zaidan, 1999). Indeed, SS4 asserted that:
―Since Shariah is based on Allah‘s law, the acceptance of what is legal and what is ethical
is different from other cultures that base their laws on human philosophy. Shariah
determines what is ethical and what is not. For instance, if something is legal, it will not be
permissible if it is unethical from a Shariah perspective. In addition, Shariah attempts to
maintain a balance between this life and the hereafter, so we are encouraged to work and
earn Halal income to sustain ourselves and families and also to support the poor, needy
and the whole community to get rewarded by Allah in the hereafter.‖
Other 5 also pointed out that:

145
―Instead of focusing on the labeling we have to focus on expanding market reach through
providing ethical and cross-religious products that would turn Islamic Finance to a
mainstream industry. So one of the recommendations is to focus on ethical principles
rather than technical requirements which will result in achieving cross-religious acceptance
as well as socially responsible requirements. This will result in a broader acceptance of
Islamic Finance products that can also be considered Abrahamic Finance products.‖
5.3.1.2 Fund Managers Motivations
By looking at the supply side, the interviewees were asked why both Islamic and conventional
financial institutions offer Islamic investment funds. The interviewees noted that profit
maximization and economic motivations were driving the offering of Islamic investment funds
(68%) while religious values came last and counted only for 7% of the interviewees‘ responses,
contrary to the demand side where religion was the most important reason to invest.
The vast majority of fund managers (71%), both from IFIs and from conventional ones, did not
feel concerned about stating that profit maximization was a reason for offering Islamic equity
funds. Only three FMs (FM7, FM8, and FM9), all of whom worked in IFIs, mentioned religion
as one of the reasons to offer Islamic funds. This is supported by SS2, SS12, and SS14. For
instance, SS14 asserted that:
―If Islamic funds are offered by Islamic companies then it is expected that religious values
along with economic values motivate their offerings, since Islamic companies have to
satisfy their clients‘ needs who are mainly motivated by religion believing that Islamic
funds are an alternative investment model to conventional funds. However, when Islamic
funds are offered by conventional managers then it is recognized as a profitable
opportunity merely to explore a new market share that was not served before.‖
This outcome is consistent with Imam and Kpodar (2010) and Rahimie (2010). Hence, the
interviewees considered religious and economic motives as to why investors chose Islamic
investment funds, whilst they considered only economic motives as to why Islamic funds are
offered by financial institutions. This emphasizes the gap between the demand and supply of
Halal equity investments. This challenges Islamic fund companies to distinguish themselves

146
from their conventional counterparties on religious, ethical and social grounds. This finding is
in accordance with Kuran (2004), El-Gamal (2006), Kamla (2009) and Rahimie (2010).
According to nine interviewees,114
this gap has to be reduced; otherwise, Islamic funds might
be exposed to reputational risks and lose customers confidence. For example, SS5 emphasized
that:
―When Islamic companies were first established they did not name themselves as ‗Islamic‘
because they did not want to hurt the name Islam or to be tainted by any failure, since they
believed that losing confidence in their religious values would be very harmful for their
shareholders, customers and the future of the industry. However, they were closer to their
religious values than the Islamic companies nowadays. Thus an appropriate mechanism
must be created to ensure compliance with not only Shariah principles in transactions but
also with main purpose of Shariah, ethical and social values.‖
5.4 The Concept of Halal Investments
In order to establish levels of understanding of Islamic funds screening criteria, it is crucial
first to identify the concept and classification of Halal investments in the stock markets,
particularly that of the Shariah Scholars as they are responsible for defining such criteria.
Therefore, the interviewees were asked about the concept and classification of Halal stocks.
In terms of Halal stocks, (i) Islamic stocks (IS) or pure Halal stocks (PH) and (ii) Shariah-
compliant stocks (SCS) 115
or mixed Halal stocks (MH), are often used to describe similar
things in the Islamic equity investment industry. This section examines the understanding of
these terms and whether they mean different things to different stakeholders.
The interviewees were first asked to classify and define the term ―Halal stocks‖. Although the
word Halal means lawful or permissible in Shariah law and is opposite to the word Haram that
means unlawful or prohibited, there are different interpretations of a Halal equity investment
and the Shariah classification of stocks. As noted by some interviewees, under Shariah only
114 Those interviewees are FM 20, Other7, Other10, SS1, SS5, SS8, SS13, SS15, and SS16. 115
Shariah-compliant stocks are stocks that are compliant with Shariah screening criteria (discussed later in the next section).

147
Allah has the authority to legislate what is Haram and what is Halal and human beings,
regardless of their religious position including the prophet, are not allowed to do so (see: Al-
Qaradawi, 2005). Nevertheless, the interviewees indicated that investing in the stock market is
a contemporary practice that is not directly covered in the holy Qur’an or the Hadith (see Al-
Shubali, 2005). Hence, the vast majority of interviewees in Kuwait classified Halal stocks into
(i) Islamic stocks (IS) and (ii) Shariah-compliant stocks (SCS). Some interviewees described
Halal stocks as (i) PH stocks and (ii) MH stocks to clearly differentiate between mixed Halal
stocks (MH) from mixed sin (MS) stocks that are not permissible. Thus, MH and SCS denote
the same thing, but interviewees from Saudi Arabia, Qatar, and Bahrain call them MH while
those in UAE and most of the interviewees in Kuwait describe them as SCS.
More strictly, 8 interviewees classified Halal stocks to be only PH, not mixed with any Haram
proportion, even when the Haram proportion was minimal. This strict definition of Halal
equity investment is only adopted by a minority of Islamic funds in the GCC. Yet many
interviewees indicated that a growing number of individual investors also consider only PH as
Halal stocks.
These classifications of Halal stocks are close to the fiqh literature such as Al Manea (1998),
Al-Quradaqi (2002), Al-Shubali (2005), Al-Khalel (2005), however, they don not breakdown
the non-Halal stocks to sin and MS while this thesis does.116
The classification of Halal stocks that will be used throughout this chapter and the whole thesis
will be the two investment classifications of PH and MH (and not IS and SCS). Although, this
classification is not used widely in Kuwait, it has been chosen to be consistent with other GCC
countries and is more precise from a Shariah perceptive, as deemed by some SS, and was
116 Only the fiqh literature classify stocks to three groups, PH, sin, mixed stocks as outlined in Chapter 1, indicating that MH and MS are reported under mixed stocks depending or their compliance with certain Shariah financial screening criteria.

148
understandable to most of the interviewees. For instance, IP3 rejected calling any company an
―Islamic‖ company and stated:
―I refuse to call them Islamic companies or Islamic products just because they do not
contradict Shariah. For example if chocolate does not contain in its ingredients any
alcohol, will that make it Islamic chocolate? Certainly not! If you call it a Halal chocolate
that means it is permissible for Muslims and anyone else to consume it, the same logic
applies to equity investments, similarly to the food industry as we have for example Halal
meat or chicken. Muslim and non-Muslim investors can invest in such stocks or products.‖
This differentiation of PH and MH is not used in literature (for example Siddiqui, 2007;
Khatkhatay and Nisar, 2007; Derigs and Marzban, 2008; Derigs and Marzban, 2009; Abdul
Rahman et al., 2010; Ho et al., 2012; Marzban and Asutay, 2012) where the two Halal
investment groups are always combined and called Shariah-compliant stocks or Shariah
approved stocks and the investment funds that invest in them are usually called Islamic funds.
However, the classification to PH and MH is preferable because one of the main objectives of
this thesis is to examine the performance of the two groups separately and will be a major
contribution to bridge the gap in the literature. Thus, some fund managers in the GCC have: (i)
Islamic funds that invest only in PH stocks; and (ii) Islamic funds that invest in both MH and
PH stocks. In addition, strict religious-based investors will never include MH stocks in their
portfolios, while other religious investors diversify their portfolios across PH and MH stocks.
Conventional funds and investors invest in all stocks in the market regardless them being Halal
or not.
Furthermore, unlike the relevant literature, the interviewees explicitly classified the non-Halal
or Haram (sin) stocks into two groups to ‗sin‘ and ‗mixed sin‘ (MS), while others called them
all sin stocks. This thesis will use both terms ‗sin‘ and ‗MS‘ to differentiate between non-Halal
equity investment groups. This is because it is important to separately examine the screening
and performance of companies that operate in sin industries and those that only fail to meet the

149
Shariah financial screening criteria as elaborated later in this Chapter. The definitions of all
types of (Halal and non-Halal) stocks are elaborated in following sections.
5.4.1 Definition of Pure Halal and Mixed Halal Stocks
The interviewees were asked to define each type of stocks that they perceived as Halal as
demonstrated in Table 5.2.
Table 5.2: Definition of PH Stock
FM SS Other Total
Shariah-Compliant Article of Association and SSB 19 16 9 44
Shariah-compliant Article of Association and not Sure of SSB 4 2 2 8
Shariah-Compliant Article of Association only 0 1 1 2
Other definitions 2 2 2 6
Note: this table presents the interviewees‘ definition of PH stocks.
Table 5.2 shows that the vast majority of the participants (44 or 76%) required a pure Halal
stock (PH) to satisfy two conditions: (i) the company has an article of association that states
clearly that all its transactions are governed by Shariah principles, or that the company‘s
activities do not contradict Shariah provisions; and (ii) the company has a SSB that oversees its
transactions and submits an annual Shariah-compliant report at the end of financial year.
According to these 44 interviewees, PH stocks cover not only IFIs like Islamic banks, Islamic
investment companies, and Islamic insurance companies but also non-financial investee
companies such as manufacturing firms if they meet the above two conditions.
A minority of the participants (8 or 14%) defined PH stocks exclusively by having a Shariah-
compliant article of association but were not sure whether those companies should have a SSB
monitoring their activities or not, especially for non-financial companies. Many of these
interviewees were fund managers and Others.117
117 Five Fund Managers: FM5; FM7; FM14; FM15; and FM19, an investor (Other 8), and a regulator (Other 13).

150
In Kuwait, Qatar, Bahrain, and UAE, Shariah-compliant articles of association prevents
companies from operating in sin activities by law, even when they do not have a SSB, and if
they violate their articles of association, regulatory bodies can penalize them. Therefore, the
article of association is a safeguard over companies adhering to Shariah principles. However,
the interviewees admitted that there was a regulatory gap in the Islamic investments industry,
where the central bank only oversaw investee IFIs and investment funds. No regulatory body
oversees whether Islamic companies in non-financial sectors meet Shariah guidelines. Some
interviewees noted that CMA in Kuwait will address this gap. Nonetheless, the interviewees
assumed that such companies remained Islamic in accordance with their articles of
associations.
When the interviewees were asked if they accepted the claim that a company was Islamic or
whether they investigated further, most of them (43 or 74%) took it as a fact without further
investigation. Nevertheless, three interviewees (FM23, SS11, and SS22) did not trust these
claims and investigated further. These three interviewees, who were in Saudi Arabia, stated
that there was a bigger regulatory gap in their country regarding the Islamic finance industry
compared to other GCC countries. For instance, they noted that only Islamic banks and Takaful
companies could be described as PH stocks, as only they were required to appoint SSBs.
Furthermore, in Saudi Arabia, unlike other GCC countries, there are no companies with
Islamic articles of association that are overseen by a regulatory body such as the central bank
or the CMA. This was also confirmed by nine interviewees (FM16, Other1, FM22, Other7,
SS1, SS2, SS7, SS12, and SS13). Thus, in Saudi Arabia, nothing stops a company, apart from
Islamic banks and Takaful companies (that have SSBs), from borrowing interest based debt or
earning interest based revenues. Interviewees from Saudi Arabia118
viewed this as a significant
118Interviewees: Inst. Inv.6; SS11; and SA10.

151
drawback, where investors have to keep an eye on their stocks as these might move from being
PH to MH or even to non-Halal stock from one period to another. In Kuwait, it is very rare for
a company to convert from PH to MH or to a non-Halal stock since they are governed by their
Islamic articles of association. However, a MH could become a non-Halal stock if a fund
manager‘s pre-determined financial screening criteria was breached.119
In addition, nine of the
interviewees said that they had to check if there was an active Shariah board governing the
operations of the investee companies and ensuring it was compliant in the case of non-financial
companies. However, Other5 said that:
―You still have to check their financials, especially for Islamic banks converted from
conventional banking. But if their Shariah board is governing its operations and approves
it as compliant it should be a positive indication.‖
In addition, some SSs called for an active Shariah auditing system to support SSBs in Islamic
funds and investee IFIs, for example SS5 asserted that:
―Not only Shariah supervisory boards are required but also regular independent Shariah
auditors and a clear Shariah auditing system is needed to ensure the effectiveness of
Shariah supervision.‖
Other4, who had worked for the first Islamic index provider in the GCC region since 1999,
said that:
―We do not take the existence of the Shariah supervisory board in consideration when
screening the universe to be included in our pure GCC Islamic Index. We only base our
decisions on their Articles of Association; if the company claims that it will follow
Shariah law or will not contradict Shariah law, we accept that without going beyond it.‖
At the other extreme, SS3, SS6, and Other 10 had a strict definition of PH stocks; an investee
company that has a strict SSB which not allow them invest in any MH stocks and considered
119This point will be addressed later in the screening criteria section.

152
them as sin stocks. This view is consistent with strict classification of Halal stocks outlined in
the previous section.
Further, Interviewees FM17, Other5 and SS22 defined PH stocks as those companies that had
no interest-bearing debt, interest-bearing investments or any non-Halal income. SS8 and SS11,
however, held the strictest definition of PH stocks, for instance SS8 defined a PH stock as of:
―…a company that focuses on Islamic morals and social values, not on profit maximization,
offering a sustainable and ethical alternative away from not only interest based instruments
but also from mimicking existing conventional financing instruments, such as organized
Tawarruq120, in order to provide effective solutions and added value to the economy.
Because if interest is only substituted by Tawarruq or other weak Shariah backed
instruments that are based on debt, not on profit and loss sharing instruments, it would
represent a change just in name rather than in substance‖.
Some argued that what are described as PH or ‗Islamic‘ by many, do not follow the true
Islamic finance model. This is supported by Al-Shalhoob (2007) and Al-Suwailem (2009)
who indicated that Tawarruq for instance should not be used in IFIs because it creates debts
far larger than the cash received, similar to interest-based instruments, and it shifts the
economy from an asset market towards a debt market, and the underlying equilibrating
mechanisms are no longer linked to the real market. Most interviewees, especially SSs
admitted that investee IFIs should promote Islamic ethical norms and values to achieve the
economic objectives as prescribed by Shariah rather than being solely profit driven. This
finding is consistent with the literature; for example, Dusuki(2007), and the International
Council of Fiqh Academy (ICFA), as the ICFA recommends that121
IFIs should avoid all
dubious and prohibited financial techniques in order to ensure general Shariah
objectives(Maqasid al-Shariah) are achieved (see Ziqaba, 2010; Rosly, 2010).
120 Organised Tawarruq is a contract in which the seller, a financial institution, arranges a transaction by selling a commodity to the client for deferred payment. The institution then sells the commodity, as an agent on behalf of the client to a third party, in the market and then credits the price to the account of the client (Al-Suwailem, 2009). 121 In their meeting: 26 – 30 April 2009 in their resolution 179.

153
However, a number of interviewees122
argued that PH stocks with the narrow perspective of
SS8 and SS11 rarely existed in the market, arguing that many corporate practices have deviated
from the general social and moral objectives as affirmed by Kurran (2004), El-Gamal (2006),
and Kamla (2009).
All 58 interviewees agreed that investing in companies that operated in ‗sin‘ industries as their
core businesses, such as conventional financial services that are based on interest, or
companies that operate in alcohol, tobacco, gaming (gambling), pork, pornography, and
weapons businesses, was strictly prohibited. This is consistent with Al quradaqi (2002), Al
Manea (1998), Al-Shubali (2005) and Sultan (2007). However, there was a middle ground of
the two extremes of pure Halal stocks (PH) and sin stocks. These are what were described by
the interviewees as mixed stocks which could be mixed Halal (MH) or mixed sin (MS) stocks
depending on the size of the sin element not related to their main operations. Examples of MH
companies are those that operate in industries such as energy, technology, telecommunications,
transportation, oil and gas, food, and real estate (Al-Shubali, 2005).
All the interviewees believed that Shariah-compliant stock screening providers used slightly
different criteria to screen the sin element for MH stocks. The interviewees indicated that, if a
company failed to meet certain screening criteria then it would be considered as MS and not a
MH anymore. Accordingly, some investee companies may be Shariah-compliant (MH) at a
certain time period but non-Shariah compliant (MS) in another time period due to the violation
of the pre-determined Shariah screening criteria. For instance, having interest bearing debt of
less than 30%, if breached, requires the stock to be removed from an Islamic fund‘s investment
portfolio.123
This is because, as many interviewees noted, MH companies do not usually have
articles of association that restrict them to following Shariah in their non-operational financing
122
Those interviewees are: FM15, Inst.Inv.1, Individ.Inv.5, SS5, SS8, SS11, SS13, SS16, and SS18. 123The Shariah screening criteria is addressed in the next section.

154
or operational activities. For example, MH companies can have conventional loans to finance
their operations, or invest their surpluses in interest bearing accounts or have deposits in
conventional banks.
Overall, two thirds of the interviewees, most of whom were FMs, accepted that Islamic funds
could invest in MH stocks, while the other third, most of whom were SSs, believed that MH
stocks should not be permissible in Islamic funds‘ portfolios, believing that companies had to
be pure Halal (PH) investments and not mixed or involved in any non-Halal activity at all.
This debate is reflected in the design of the subsequent empirical chapters and is part of the
contribution of this thesis, and is further explored as reported in the next section.
5.4.2 The inclusion of Mixed Halal Stocks
This section examines whether there is a need to include MH stocks in Islamic funds‘
portfolios and impacts on the diversification of Islamic funds; excluding MH stocks yields a
restricted and smaller investment universe, which could have an adverse impact on their
performance as suggested by MPT (see Chapter 3). This thesis contributes to knowledge as this
not been addressed before in the literature and is examined further in Chapters 6-8 and may
provide evidence to Shariah scholars and regulators to revise the previous fatwa issued by
some Shariah scholars regarding the permissibility of MH stocks. Table 5.3 summarizes the
respondents‘ perspectives toward this crucial question.
Table 5.3: The Need to Include MH Stocks in Islamic Portfolios
Is there a Need to include MH stocks: FM SS Other Total
Yes 16 5 4 25
No 3 11 3 17
Not Sure 4 5 7 16
Total 23 21 14 58
Note: This table summarizes all the interviewee groups‘ responses on whether it is necessary to include MH
stocks in Islamic funds‘ portfolios.

155
Table 5.3 reveals divergent views regarding this issue. Twenty five out of 58 interviewees
(43%) agreed that there is still a need to include MH stocks. The FMs were the group most
likely to agree to include MH stocks from Islamic funds, as they have an interest in including
them, as indicated by FM10:
―Fund managers are not eager to talk to Shariah supervisory board members about this
topic, because the more stocks they can play with the better for them, so why make their
life miserable?!‖
FMs and Index providers in the Other group argued that if they were restricted to invest in PH
only, their portfolios would be exposed to concentration risks since most PH stocks are
currently financial companies, hence this would not allow a well-diversified portfolios across
all sectors. For example, Other 3 indicated that:
―This an embarrassing question because I personally prefer pure Halal stocks, however, we
have to offer Islamic funds that also invest in mixed Halal stocks as we have a wide range
of customers including: government; institutional; and individual investors, who prefer
mixed Halal stocks. As we think that limiting ourselves to pure Halal stocks is not
sufficient to create a well-diversified and optimal risk-adjusted return portfolios, because
we are a leading Islamic company that launched the first Islamic Fund and first Islamic
index in Kuwait and our Shariah supervisory board has the same members as the Islamic
Dow Jones.‖
Therefore, a number of interviewees, especially FMs, investors, and Index providers believed
that banning MH stocks totally in Kuwaiti Islamic funds‘ portfolios would not be a good
resolution, especially after the GFC when financial companies were the most affected by the
crisis. As a result, some interviewees, including some SSs, declared that investing in MH
stocks was a necessity, referring to the old fatwa that allowed MH stocks under the Shariah
Jurisprudence ‗the law of necessity‘ or the concept of ‗Umumbalwa’, which refers to
unfavorable widespread situations affecting most people and are difficult to avoid (SAC, 2007)
(see Chapter 1). Moreover, these interviewees argued that Islam had encouraged Muslims to

156
invest their wealth, engage in business and share in economic prosperity, as stated in the
Qur’an:
"And when the prayer is finished, then may you disperse through the land, and seek the
bounty of Allah (through trade, business and lawful professions) and celebrate the praises
of Allah so that you may prosper" [62:10].
For example, SS11 stated that:
―According to Islam, capital has a role to play in the economy. Hence it should not be
hoarded but rather circulated to allow people to benefit from it. And investing in the stock
market is a venue to achieve that, especially in operational industries that benefit the
economy. In addition, small investors do not have any other opportunities other than the
stock market. However, if all investors invest exclusively in pure Halal stocks, as they are
a minority in the market, then their prices will be inflated beyond their actual value causing
a bubble in the market and eventually leading the market to collapse and possibly a
recession in the economy. Thus, investing in mixed Halal stocks is necessary to maintain a
balance in the market.‖
Furthermore, SS20 added to that:
―Investment in stocks is a contemporary issue that did not exist in the early years of Islam,
and has not been stated directly in the primary sources of Shariah and is not like a regular
partnership relationship but rather a special form of partnership. Thus, it requires a new
Ijtihad from Shariah scholars to control the sin element and purify and close a wide door
of Halal investment that is mixed with a small amount of non-Halal.‖
These two quotes are in accordance with the literature (see for example: Al Manea, 1998; Al
quradaqi, 2002; Usmani, 2010). Practically, the Shariah Advisory council (SAC, 2007) in
Malaysia, the SSB of Al-Rajhi Islamic Bank (2001) in Saudi Arabia, and most of the SSBs of
Islamic index providers and Islamic funds follow the same logic as noted by the interviewees.
On the other hand, 17 of the interviewees, notably SSs and individual investors had the
opposite view as they argued that those who allowed MH stocks should do so as an exceptional
case, not as a norm. This was because when the fatwa was released, PH stocks were very rare
as only a few Islamic banks and Islamic investment companies were listed on GCC stock
markets, leading Shariah scholars to agree on a minimum level of compliance to allow Muslim
investors to invest in the stock market (see Quradaqi, 2002; Al-Shubalia, 2005; Al-Tunaji,

157
2009). Furthermore, some SSs indicated that a fatwa was different from Shariah law, in the
way that a fatwa refers to how the rules of Shariah are to be applied from the point of view of
the jurists, which can change from time to time as circumstances surrounding them change.
Thus, many interviewees, including some FMs and investors, asserted that Shariah scholars
should revisit this fatwa. For example, FM 20 said that:
―Unfortunately, Shariah supervisory board members did not have enough commitment to
take the initiative to revisit this fatwa as they sit on multiple boards and are very busy
doing that. However, things have developed and changed and thus this fatwa allowing
mixed Halal stocks is 10-15 years old now, thus Shariah supervisory board members
should not wait until they are asked to respond to it!‖
Among these 17 interviewees that were against investing in MH stocks, some argued that
investing in MH stocks had been strictly prohibited from the beginning and that the law of
necessity was not applicable as SS16 noted:
―I do not believe that there is a necessity to include mixed Halal stocks because fund
managers and investors seek to maximize their wealth only, not anything else! Hence, if
there was a strict prohibition from the beginning, then we could have seen these companies
converting to Islamic companies, like many conventional banks in the GCC that converted
to fully fledge Islamic banks. Because if we want to build a real Islamic economy, we have
to sacrifice some profits in the short run, as in the long run the investment environment
will improve and awareness will increase.‖
Other SSs supported this, such as SS4 who pointed out:
―Investors are shareholders or owners in the company, therefore if they know about any sin
element in the company such as riba, but still decide to continue investing in their stock,
then this means that they have implicitly approved the existence of that sin element, hence
they would be held responsible and share the sin with them. And riba is one of the major
sins in Islam. In addition, investing in the stock market is not a necessity that makes
forbidden things, such as riba, permissible. Necessities should be evaluated carefully and
in a proper manner‖

158
This view is consistent with the Standing Committee for Scholarly Research and fatwa in
Saudi Arabia, the SSB of Kuwait Finance House, the SSB of Dubai Islamic Bank, and the SSB
of Sudan Islamic Bank (Al-Shubali, 2005; and Al-Khalel, 2005).
Between these two extreme views, 16 interviewees were not sure if MH stocks were necessary
to be included in Halal equity portfolios anymore. Some of them were SSs and acknowledged
that they did not have sufficient detailed information to make such a decision or fatwa. For
instance, SS13 stated that:
―Although pure Halal stocks and Islamic financial companies particularly has experienced
a tremendous increase and growth, this fatwa has never been examined any more neither
by practitioners nor by academics, and unfortunately we do not have active research
centers that play this role, since it is not an easy task to make a fatwa that requires detailed
information, especially after the global financial crisis.‖
Furthermore, SS8 agreed with the above statement as he confirmed that:
―All products have an expiry date except fatwas! And this is wrong, why do we not always
revisit previous fatwas and update them in the light of new reliable information.
Fortunately, your PhD thesis‘ results will do the job for us, as to answer the question
whether there is a need to include mixed stocks in Halal portfolios or not, because the old
fatwa is out of date now! We need people that understand Shariah and technical financial
issues to study the case, in order to establish a new fatwa regarding this issue‖
Other 6, however, was in a middle standpoint, saying that:
―I personally do not invest in mixed Halal stocks since they are questionable from a
Shariah point of view, and also I believe that pure Halal stocks are sufficient for a well-
diversified portfolio in the GCC stock markets but could be slightly difficult if limited to
Kuwait only if you manage large Islamic funds, because most pure Halal stocks in Kuwait
are financial companies and few companies work in industrial sectors such as
petrochemicals or services. Therefore, combining all GCC pure Halal stocks will create a
reasonable universe. But meanwhile, this mixed Halal stocks fatwa certainly deserves
revisiting toward Islamizing those companies gradually.‖
Although Other5 agreed that MH stocks were still needed for a well-diversified portfolio
nowadays, he suggested that:

159
―Mixed Halal stocks should still be eligible but we should over time put more and more
constraints on them, reducing the screening thresholds, handling companies in Islamic
countries like the GCC states differently from global countries and so on.‖
The last two quotes and other interviewees‘ feedback suggest that more constraints should be
placed progressively as a compromise to investing in MH stocks. As noted by some
interviewees, this could be achieved by reducing the screening thresholds by 30% or 50% and
keep revisiting and reducing them through time, until a time comes when Islamic funds and
investors can find enough PH stocks sufficient for a well-diversified PH portfolio. This
suggestion is examined in the following empirical chapters, to investigate the impact of
reducing the screening criteria of MH stocks on the performance of Halal portfolios and
portfolio diversification. The next section elaborates on the screening criteria currently adopted
by Islamic funds.
5.5 The Shariah Screening Criteria Adopted By Islamic Funds
This section analyses the research participants‘ views on the screening criteria that are used to
screen Islamic equity funds and discusses other technical issues related to the screening
process. This section is relevant to the following empirical chapters, where the prevailing
screening methodology is adopted for the analysis. Almost all participants agreed that there are
two levels of screening: (i) qualitative screening, called industrial or sector compliance; and (ii)
quantitative screening, or financial compliance.
5.5.1 The Qualitative and Quantitative Screening Process
Table 5.5 reports the interviewees‘ responses regarding the definition of each screening level,
categorized in different groups, by the times there were mentioned.

160
Table 5.5: Definition of Screening
Panel A: Qualitative Screening/ sector compliance
Number of Times mentioned by interviewees
FM SS Others Tot. Tot. %
1. Core Business should be Halal, and sin
element should be minimal.
18 15 6 39 67
2. All business and operations should be
Halal
5 8 6 19 33
Total 23 23 12 58 100
Panel B: The Financial Screening Criteria
Number of Times mentioned by interviewees
FM SS Others Tot. Tot. %
A. Debt Screens:
1. Debt / Market Cap.<30% 5 9 1 15 15
2. Debt/Total Assets <30% 2 11 1 14 14
3. Debt/ Total Assets <33% 3 0 3 6 5
B. Liquidity Screens
1. Interest-bearing cash and short-term
investments
/ Total Assets <30%
2 4 2 8 8
2. Interest-bearing cash and short-term
investments / Market Cap. <30%
1 4 1 6 6
C. Interest Revenue and Sin Revenues / Total
revenue < 5%
9 19 5 33 33
D. Not sure, only invest in PH Stocks 4 1 2 7 12
Total 36 48 17 101 100
Note: This table summarizes the participant views on the screening criteria used by Islamic funds. Panel A reports the
sector compliance definition and panel B reports the financial compliant definition responses by the times there were
mentioned by the research participant groups (FM=Funds managers, SS=Shariah supervisors, and Others = investors,
index providers, and regulators).Tot., % = the total number of times and percentage each variable was mentioned.
Market Cap. =Market Capitalization. Interviews may have mentioned several criteria.
Table 5.5 Panel A reveals that interviewees identified the sector-compliant level to filter out
any company that is directly involved in any prohibited or ‗sin‘ industries such as alcoholic
beverages, pork products, gambling and casinos, media companies distributing pornography
material, hotels serving alcohol or operating casinos, and interest-based financial institutions.
Stocks in such companies were classified as ‗sin‘ and are excluded from Islamic funds‘ asset
universe straightaway without investigating any financial information; all interviewees,
including FMs, affirmed that investing in such industries is strictly prohibited in Shariah.
Interviewees noted that some sin industries are legal in the GCC states such as conventional

161
financial services (i.e. conventional banks and insurances), while other sin industries are illegal
in Kuwait and Saudi Arabia only such as hotels serving alcohol or operating casinos. The vast
majority of interviewees pointed out that, if a company passed this filter, two questions had to
be asked of stocks in the sector compliance screening level: (i) whether the company stated
clearly that it followed Shariah law in all its activities via its annual report or articles of
association for new listed companies; and (ii) explore if the investee company had an active
SSB overseeing all its activities. If the stocks of a company passed both screening filters, then
the stock of the company is described as PH stock. Almost all interviewees accepted a
company‘s claim that it is ‗Islamic‘ or a PH stock based on the fulfillment of these two screens,
without applying any financial screens or investigating their financial statements further. For
example, FM20 stated that:
―I feel comfortable when the investee company has a Shariah supervisory board, because
they are responsible and accountable for all the Shariah requirements in the company, thus
investors do not have to be concerned about any of these issues. Hence, if any Shariah
violation is detected, as they have to take actions to solve any Shariah issue and this
therefore would not affect their Shariah classification from being a pure stock to be non-
Halal, so I still can keep it in my portfolio.‖
Yet, a few FMs and other interviewees were doubtful of the existence of SSBs in the non-
financial sector, as non-financial companies were not overseen by a central bank or any other
regulatory body to ensure the existence and efficiency of the SSB. Furthermore, three
interviewees suggested that financial screens were necessary for PH stocks too, not from a
Shariah perspective but from an investment and economic perspective, for instance, FM10
argued that:
―Financial screens should be applied on Islamic companies because, unfortunately, the
majority of Islamic financial companies are heavily leveraged, indeed not through interest-
bearing debts but rather Halal-based debts and facilities. This is because leveraged
companies are risky investments especially during economic downturns and tightened

162
liquidity. As we saw in the recent global financial crisis many Islamic companies were
financially distressed and faced bankruptcy challenges.‖
However, most interviewees argued that Islamic funds‘ screening should only be Shariah-
based screens that evaluated whether a company was a Halal or non-Halal investment and
should not go beyond this objective by evaluating the risk and return tradeoff of the investment
itself since this was an investment decision not a Shariah issue. Some interviewees, however,
thought that Shariah screening should also cover the economic impact of such investments
since Shariah is comprehensive.
Further, if companies failed to pass the sector compliance screening and were filtered out from
the PH stocks, this meant that they were a mixed stock that could be either a MH or MS stock
(see section 5.4.2). Therefore, the universe is filtered again by using financial screens based on
three financial criteria: (i) debt screens; (ii) liquidity screens; and (iii) interest revenues and
other non-Halal revenues screens from non-operational activities. These financial screens have
defined thresholds as determined by SSBs to quantify the tolerable non-Halal element that
could be mixed with the Halal majority. Thus, the interviewees agreed that these financial
screens could determine the extent to which potential investee companies are involved in non-
Halal activities in order to decide whether to invest in them. This finding corroborates the
literature such as Wilson (2004), Khatkhatay and Nisar (2007), Derigs and Marzban (2008),
Abdul Rahmanet.al (2010), Ho et al. (2012), Marzban and Asutay (2012). The interviewees
revealed that the financial screens used did not vary significantly, which is inconsistent with
Derigs and Marzban (2008) who found that Shariah screening criteria used by different Islamic
funds and indices were significantly different creating large differences in the Halal asset
universe. This could be due to the fact that the SSBs of GCC Islamic funds have the almost the

163
same group of Shariah scholars (see Zawya report, 2011) and further these countries share
similar investment environments, economic, political, and social systems.
One third of the interviewees noted that the sector-compliance screen should be used to filter
out companies with any involvement in sin activities, whereas two thirds of the interviewees
accepted including the stocks of companies whose core business was Halal but received a
small proportion of revenues from non-operational sin activities; financial screening criteria
should then be applied to these mixed stocks.
Table 5.5 Panel B reveals the financial ratios that are often used for screening MH stocks. First,
the most noted screening criteria was interest-based income and other non-Halal income;
interest revenue plus any other non-Halal revenue divided by the total revenue should be less
than 5% (mentioned by 33% of interviewees). Second were interest debt screens; (i) the ratio
of total debt to total assets should be less than 30%; and (ii) the ratio of total debt to market
capitalization should be less than 30%. They were mentioned by 14% and 15% of the
interviewees, respectively. Third were liquidity screens. Very few interviewees mentioned the
two financial ratios that could be used to measure the proportion of non-liquid assets of
investee companies: (i) interest-bearing cash and short-term investments as less than 30 % of
the total assets of a company; and (ii) interest-bearing cash and short-term investments of less
than 30 % of the market capitalization of the company. They were mentioned by only 8% and
6% of the interviewees, respectively. The interviewees noted that the categorization of mixed
stocks to MH and MS can change over time, depending on their compliance with the financial
screening criteria, which could change based on the level of sin component in their activities.
Thus, this screening process and Shariah audits are conducted on a regular basis to ensure that
Islamic funds‘ investments are in compliance with the established Shariah criteria and
guidelines. Three quarters of the interviewees indicated that there were carried out quarterly,

164
while 15% of them said that it was conducted semi-annually and 9% thought it was conducted
annually. Many interviewees noted that Islamic funds or investors who invest in MH stocks
should purify their earnings and pay out these amounts to charity as they are not Halal
(elaborated in section 5.6.2).
The differences in responses to the financial screening criteria reflect the different screening
criteria used by index providers around the world, such as Dow Jones Islamic Market Index
(DJIMI), FTSE Global Islamic Index Series, S&P 500, MSCI (Morgan Stanley Capital
International) and AAOIFI. However, the interviews revealed that AAOIFI‘s financial
screening criteria are the most widely adopted by Islamic funds in the GCC; hence this study
applies AAOIFI‘s financial screening criteria in the following Chapters. One major difference
in the financial screens is that one use market capitalization and the other uses total assets as
the dominator in the financial ratios. AAOIFI changed its financial screening criteria number
21 in 2006 to use market capitalization instead of total assets. Fifty-one percent of the
participants noted that total assets is a more appropriate and reliable measure as it is based on
well-known international accounting standards and 37% of them said that total assets was
independent of external market influences and speculation. On the other hand, 72% of the
participants said that total assets could be inconsistent depending on the accounting principles
used, for example, revenue recognition and asset valuations. Overall, the participants seemed
to be more pessimistic about the use of market capitalization and 37% of them noted that the
recent GFC had resulted in many companies‘ stock prices being below par value, so the ratios
increased dramatically and the interviewees decided not to use them anymore. Further, 36% of
the interviewees indicated that the market capitalization of a company was severely affected by
speculation and was more volatile compared to total assets, while 17% interviewees said that
using market capitalization yielded different results for companies listed in different markets.

165
On the other hand, 44% of the participants argued that market capitalization enabled
continuous Shariah screening, independent from financial statements that are only produced
every quarter, or detailed audited financial reports published annually. In addition, market
capitalization values can be calculated daily, and 40% of them asserted that this reflected the
real worth of a company as determined by the market. These findings are similar to that of
Derigs and Marzban (2008). It appears that the use of total assets is preferable to some extent
(37% of the interviewees) compared to market capitalization; this could be due to the impact of
the GFC that affected GCC stock market values negatively. Hence, many Islamic funds and
indices in the GCC and globally currently use total assets instead of market capitalization, as
noted by many of the interviewees. For instance FM10 stated that:
―We have not changed our methodology since the beginning as we thought that total assets
is more reliable and realistic, while the majority of the list producers were using market
cap. before the financial crisis because stock prices were inflated and this strategy
appeared to be more liberal as it gave them a bigger Halal universe to invest in, but due to
the crisis many investee companies were traded below their par value. Hence, Islamic
funds were getting fewer companies to invest in, so they moved towards total assets.‖
However 13% said that using market capitalization was preferable. To overcome the problems
of each method, 15% suggested using market capitalization only for service and technology
companies because they were not tangible-asset backed industries. Further, 10% of the
interviewees suggested using both total assets and market capitalization for financial screening
ratios if a company fails on one measure, it would have a chance on the other measure (based
on the lowest requirement). However, this strategy was criticized by some SSs who asserted
that they had to be consistent and stick to one methodology and not change from time to time,
although some of these SSs had given permission to screening providers to move from using
market capitalization to total assets after the dramatic drop in the market prices in 2008. In
addition, a few SSs pointed out that these financial screens are Ijtihad that should be flexible

166
and subject to change if necessary. Interviewee SS1 for instance, explained this standpoint as
follows:
―The Shariah scholars‘ behaviour should tend to aim at removing the hardship caused to
investors.Thus, if we accept investing in mixed Halal stocks then the use of any divisor is
not a big deal from a Shariah perspective, therefore we can use market capitalization for
service and technology sectors or total assets for industrial sectors‖
This is also consistent with the strategy undertaken by Dubai Islamic Bank that uses both
measures as divisors for its screening ratios (Derigs and Marzban, 2008). Therefore, for the
purpose of this study, AAOIFI‘s (2004) and (2006) screening criteria are used in the following
chapters. With the exception of the use of total assets and market capitalization, there is a little
variety of the financial screening thresholds. This finding is not in agreement with Derigs and
Marzban (2008) and Abdul Rahman et al. (2010) and could be due to the fact that they
compared screening criteria across different countries (Islamic Indices in USA, UK, and
Pakistan), while this research was conducted mainly in Kuwait and other GCC countries that
share similar investment environments, economic, political, and social systems. Indeed, almost
all SSs and the other interviewees agreed that the financial screening criteria should be re-
evaluated, and that companies in Islamic countries should be different from western countries.
It was mainly the SSs group that knew the rationale of such financial screening ratios; for
instance, the SSs indicated that if the assets of a company were highly liquid it would be not
permissible to invest as riba would occur.124
A significant minority of interviewees (26%)
including FMs, investors, and regulators were not aware of the rationale whatsoever of the
screening criteria. This is because almost all FMs and investors depended either on a publicly
124 According to jurisprudence principles, money cannot be sold for money as exchange should be for exact value in cash otherwise it would be riba (Usmani, 2002; AAIFIO Shariah standards, Alquradaqi, 2004; Alquradaqi, 2005). There is a consensus among Shariah scholars regarding this rule, however applying it in the case of trading stocks remains debatable (Abdul Rahman, 2010). This screening ratio is mostly used in Pakistan and India as they follow the Hanafi jurisprudence school.

167
available list or on one provided by the Islamic funds‘ SSB; hence, they were not engaged in
any screening process. Seven percent of the interviewees were not aware of such criteria
because they only invested in PH stocks. The majority (61%) said that such financial screens
are a respectable Ijtihad conducted by Shariah scholars. For instance, interviewee SS11
highlighted that:
―No one dare to say that receiving or giving riba is Halal, the screening criteria are Ijtihad
to limit riba and other impermissible activities, not to make it legitimate. For example,
does constricting smoking rooms in public places make smoking permissible in Shariah or
in law?! Certainly not! It is only to limit the harm of smoking in society and the
environment and to control it as much as possible. The same concept applies to investing
in mixed companies.‖
Nevertheless, 13% criticized the above argument determining financial ratios, indicating that
there was no evidence from the Qur’an or the Hadith to back this Ijtihad which they deemed as
weak and not convincing. For example, interviewee SS16 said that:
―Indeed Ijtihad is a secondary source of Shariah and gives the fiqh flexibility; however it
should be based on strong evidence based on divine guidance and other secondary sources
where I do not think so it is the case here. I might have accepted it 15 years ago as it was a
necessity at that time and we are required to apply the Shariah law gradually, but it should
not be accepted anymore as the number of Islamic stocks has increased dramatically in
most GCC stock markets, thus using those financial ratios is not justified anymore.‖
From this quote, it seems that not all practitioners in the industry are convinced of investing in
MH stocks or the Shariah rationale underpinning financial screening. In fact, some voices are
calling for intervention to control such investments; consistent with Rahimie (2010), different
responses between different stakeholders suggest that there is a gap between FMs, investors,
and regulators who know little about Shariah issues while SSs know little about the technical
issues but know lot about Shariah.

168
5.5.2 Positive Screening
The above qualitative and quantitative screening criteria are considered as negative screening
criteria in the literature, and during the interviews there was hardly mention of the use of
positive screening criteria such as those applied by socially responsible investment funds.
When positive criteria were explained, the majority (65%) replied that they did not use such
criteria, but a third of them asserted that Islamic fund managers should include them in the
screening process since Shariah promotes these issues and it is part of the Shariah objectives.
For example, interviewee SS8 highlighted that:
―Social justice, economic development and environmental ethics are core values and part
of Shariah‘s broad objectives. Thus, fund managers should factor this in their investment
decisions and priority should be given to invest in companies that are engaged in
promoting such values in society and avoid investing in companies that damage the natural
environment for instance.‖
Interviewee Other7 clarified that:
―Islamic fund managers need to reflect more social, ethical and environmental issues in
their investment strategy in order to make a positive social and economic contribution to
the societies that they operate in, where at the end of the day, they would boost their image
and reputation.‖
This finding is consistent with that of Kamla et al. (2006), Maali et al. (2006), Dusuki (2007),
Hasan (2009), Visser (2009), Kasim et al. (2009), and Marzban and Asuty (2012), as they
highlight the importance of such values in the practices of Islamic funds, but most of them
report that there is a gap between the theory and practice of such funds.
Therefore, when the interviewees were asked what prevented investors and FMs from
employing positive screening criteria, 42% of them noted that the number of total listed
companies (including Halal and non-Halal stocks) in GCC stock markets was limited
compared to developed stock markets such as the USA or UK stock markets and that there
were not enough to be able to have more investment constraints that would affect a portfolio‘s

169
diversification adversely. Thirty-nine percent of the interviewees attributed this to the low level
of awareness among investors regarding the importance of such criteria and 19% of the
interviewees argued that negative screening was straightforward compared to positive
screening that requires more complex investigations because of the poor level of disclosure in
annual financial reports and other publicly available information. For instance, FM17 reported
that:
―We do not use positive screening because there is no corporate governance reporting
codes and even where there is in some GCC countries the disclosure level in companies‘
annual reports is very weak and not designed for Islamic companies. Therefore how can
we claim use positive screening while we struggle to find the required information to judge
that!? However, government authorities should play a role in that, as this will also promote
ethical investors across the world.‖
This supports Saidi (2006) who asserts that improving corporate governance standards will
help improving transparency and disclosure, tighten listing requirements, and restore investor
confident.
5.5.3 Harmonization Screening Criteria
Although 71% of the participants thought that Islamic funds and Islamic Indices used similar
screening criteria, they were asked if there was a need to harmonize Shariah screening criteria
to produce just one unique list of Shariah-compliant stocks for all Islamic funds and for
individual investors in the market. The majority agreed to such harmonizing of screening
criteria. For example, interviewee FM14 highlighted that:
―At some point of time, it will be healthier and beneficial to harmonize the various
screening criteria because you do not want to have unfair competition where you are
arbitraging Shariah rules, secondly it is inexpensive in terms of cost and effort in
duplicating the screening process and finally it would not confuse individual investors‖
Furthermore, interviewee SS9 added the following to support the above argument:
―Shariah encourages unity among Muslim nations and harmonizing the screening criteria
across Muslim countries and globally would accelerate and strengthen investment and

170
economic cooperation among Muslim communities and this will also attract foreign
investors to invest in our countries as it will not create confusion for them‖
This outcome seems to be consistent with other studies such as Karim (2001), El-Hawary et al.
(2006), Derigs and Marzban (2008), Abdul Rahman et al. (2010), Ghoul (2012), and Marzban
and Asuty (2012). However, 26% of the interviewees argued that there were valid reasons why
diverse screening criteria were used. For instance interviewee Other12, a regulator in CBK,
noted that:
―Harmonization is difficult and Islam is diversified in the sense that we have four different
respectable schools of thoughts, where this should enhance the creativity and competition
between different Halal service providers and funds. Furthermore, it allows for more
flexibility to adjust for specific conditions faced by some countries or industries in
different environments. And even if we, as a central bank, intervene to harmonize the
screening criteria in Kuwait, we cannot do so in other countries such as Malaysia, Pakistan
or Sudan. Therefore, we would rather let people and the market decides.‖
Different schools of thoughts did not seem to have much role to play in defining screening
criteria as they are based on contemporary ijtihad or fatwa that did not exist before. However,
many interviewees noted that Islamic funds‘ SSBs came from the different schools of thoughts
including Shia. Some SSs outlined that harmonizing Shariah standards in general may
contradict the fundamental premise of Ijtihad that provides Shariah a dynamic ability to be
applied in different circumstances over time.
Some interviewees, including SSs and FMs disagreed with the idea of harmonizing the
screening criteria simply because they thought that Islamic indexes and list providers did this
screening service already as a marketing strategy which was well known in the market to
promote such services. Therefore if there was one unique list in the market, such opportunities
would be lost. Furthermore, 26% of the interviewees refuted the idea of harmonization because
they argued that harmonizing accounting information should come first and it was more
important and challenging than harmonizing the screening criteria. They pointed out that the

171
annual financial disclosure practices of Islamic companies within the same country and among
other GCC countries were inconsistent and incomparable in some cases. For example the
degree of details provided, the terminology used, the explanatory notes and accounting policies
used were different. Most interviewees pointed out that PH and MH investee companies‘
annual reports were similar to conventional annual reports, and they were not regulated or
prepared for Halal seeking investors.125
For instance, interviewee SS16 reported that:
―When we screen the annual and financial reports, it is our job for example to find out
whether the item debt in the balance sheet refers to an interest based debt or a Halal based
debt! Hence, there is a need for accounting information and terminology to be regulated in
order to enhance the credibility and comparability of the annual reports and the screening
process for Halal seeking investors, why not follow central banks that have adopted
AAOIFI‘s Islamic accounting standards for Islamic companies?‖
Seven interviewees126
acknowledged that AAOIFI was an appropriate body for harmonizing
financial and accounting reporting, for Islamic financial companies, in order to harmonize the
financial reporting for at least all PH companies. Many interviewees believed that AAOIFI
carried significant weight in Muslim countries, especially in the Middle East, enabling it to
create a harmonized framework to encourage Islamic investments in the region. This
harmonization would improve the usefulness of accounting information for those who prepare
Halal screened lists and Halal seeking investors. This study attempts to empirically examines
whether there is a need to harmonize the screening criteria by studying the impact of using
different AAOIFI‘ financial screening criteria 2004 and 2006 on the Halal asset universe and
the impact on portfolios‘ performance. Thus, if the results indicate that there are significant
differences on portfolio returns between using these different criteria, then harmonizing the
criteria may be needed.
125
Halal seeking investors are those who screen themselves their own universe without depending on any screened lists. 126
Interviewees FM21, SS1, SS2, SS3, SS6, SS16, and Other6.

172
5.5.4 The Source of Information Used in Screening
According to the interviewees, there are lists of PH and MH stocks available in the market.
These lists are issued every quarter as mentioned by 94% of the interviewees. Shariah
consulting companies and Islamic investment companies have research departments that carry
out such Shariah screening services and publish such lists. Three list providers in Kuwait,
namely Al-Rayah and Mashura, Al-Madar, and AL-Aman were mentioned respectively by
48%, 14%, and 5% of the interviewees. The interviewees noted only two private list providers
in Saudi Arabia, one in Qatar, none in Bahrain, and one official list provider in the two stock
markets in U.A.E (in Dubai and Abu Dhabi financial markets). Thirty four of the interviewees
depended either on a list approved by their own SSBs (18%) or did not use any Shariah lists at
all and only invested in PH stocks already well known to them (16%).
The interviewees were asked about the sources of information employed when evaluating
investee companies from a Shariah perceptive to classify them in to PH, MH, MS and Sin.
About 27% of the interviewees only examined the Articles of association to confirm if they had
a SSB and looked at their annual report to see the names of the SSB members as well as their
Shariah report, but not the financial statements. However, 38% of the interviewees, who
invested in MH stocks, indicated that they used the financial statements and attached notes.
One quarter of the interviewees noted that list providers used financial reports and also
obtained information directly from the investee companies themselves, in some cases by
speaking directly to them because they believed that published available information was not
sufficient to be able to decide if certain stocks were Halal or not. The interviewees agreed that
the financial reports with their notes were the most important source of information for
evaluating MH stocks, while the Articles of association and the existence of SSBs was the
most important source of information for evaluating PH stocks. Sixty-one percent of the

173
interviewees felt that the level of disclosure in the annual reports was sufficient or at least
sufficient to some extent to determine Halal investments; however, 34% of them highlighted
that the level of disclosure was low because the annual reports and financial statements were
not prepared for Halal seeking investors as they are based on western accounting standards.
Other 3 argued that:
―We as an Islamic investment company and an Islamic Index and list provider, maintain
good relationships with most investee companies to facilitate any information required for
screening but this consumes time and effort. Thus, it is essential that the regulatory bodies
intervene in this regard compelling all listed companies to report certain accounting items
to facilitate Shariah screening. I expect companies would respond positively because many
investee companies are interested in being targeted by Islamic funds and investors as they
think that this will raise their stock price in the market.‖
Further, some interviewees called for a comprehensive Islamic accounting and auditing
framework and disclosure system that underpinned Islamic values. For instance, interviewee
SS13 noted that:
―Islamic companies in different countries use disclosure systems that are based on the
western capitalistic accounting standards. Indeed, such disclosure systems do not reveal
full compliance with Shariah. Therefore, it is hard to claim that such a company is 100%
purely Islamic. Hence, there is a need to develop accounting standards and a disclosure
system [framework] based on Islamic values, in order to cater for the unique characteristics
of Islamic companies‘ products (e.g. Musharakah, Mudarabah, Murabahah) and social
values (e.g. Zakat) or at least Islamic companies should offer additional disclosure that
address these Shariah concerns. However, since Mixed companies are not governed by
Shariah, they are not obliged to disclose such additional information which again is
challenging for Shariah list providers‖127
This view is consistent with that of Karim (2001), Lewis (2001), Harahap (2003), Kamla et
al.(2006), Maali et al.(2006), Haniffa and Hudaib(2007), Kamla (2009), Yaacob and Donglah
(2012), Kasim and Sanusi (2013), and Sarea and Hanefah (2013). Some interviewees argued
that AAOIFI Islamic accounting standards offer a good model to be adopted, which is
inconsistent with Kamla (2009) who criticized AAOIFI‘s role by imitating western capitalistic
127 Musharakah (partnership) is a partnership contract in which both parties contribute capital and may form a joint Management, while a Mudarabah is a partnership contract in which one partner contributes capital and the other partner invests time and effort (see Mirakhor and Zaidi, 2007).

174
driven accounting bodies. Kamla (2009) indicates that AAOIFI‘s accounting standards draw on
the most dominant accounting and auditing practices, with emphasis on technical issues related
to interest prohibition and Zakat calculation rather than holistic Islamic and social values.
Lewis (2001), El-Gamal (2006), and Kamla (2009) argue that Islamic accounting standards
should be based first on Islamic values and teachings and then consider western accounting
standards. However, the interviewees pointed out that such an approach is difficult to be
implemented due to western influences on business and culture in Islamic countries (see also
Maali et al., 2006). The interviewees revealed that regulators are not interested in playing an
active role in this regard. For example, Other 12 (a KCB officer) provided the following
argument:
―I have to confess that the Islamic fund industry in Kuwait is self-regulated; we left it in
the hands of the Shariah boards who are qualified and trustworthy people, because we are
not experts in this field and there was a sudden rapid growth in this industry and we had to
respond to the strong demand. Thus, the market itself is capable of producing sound and
qualified individual and institutional Shariah experts, because our intervention could
deprive the market from good brains, and limit the flexibility and innovation of the
industry if we have one unique Shariah authority here at the central bank.‖
On the other hand, many interviewees blamed the regulatory authorities for being ineffective
and passive, compared to their role towards conventional counterparties. The interviewees
affirmed that in Kuwait, Qatar and Saudi Arabia, the Islamic fund industry is self-regulated
with no central Shariah authority at the central bank or any other regulatory body.
Nevertheless, in Bahrain and UAE there is Shariah authority as a reference. The interviewees
noted that the CMA in Kuwait has started to fill this gap by constructing a regulatory Shariah
governance system for the Islamic finance industry. For instance, interviewee Other11 stated
that:
―… The good news is that the awareness in the regulatory level of the importance to
develop better regulations for the Islamic finance and investment industry has improved.
For example, the newly emerged regulatory body in Kuwait, the Capital Market Authority,
has established recently a fully independent central Shariah Council that will work on a

175
full time basis to address all these issues you have just presented and is expected to publish
detailed codes in this regard"
After discussing the screening criteria adopted by Islamic funds in the GCC and the source of
information used to conduct that screening, the next section moves to investigate the factors
that affect the performance of Islamic funds.
5.6 Factors Affecting the Performance of Islamic Funds
The interviewees mentioned several factors that influence the performance of Islamic funds.
Fifty-five of the interviewees mentioned: (i) the fund managers‘ investment skills in terms of
asset allocation and stock selection; (ii) the economic cycle, including the GFC; and (iii) the
impact of the Shariah classification to PH, MH, MS and Sin stocks, which was mentioned by
38%. All these factors were reported by Rahimie (2010).128
In addition, only a few
interviewees (5%) mentioned the need for earnings purification of MH stocks as a factor
affecting Halal portfolios. Sections 5.6.1 and 5.6.2 elaborate on these factors. The impact of
such factors on Islamic funds‘ performance is examined quantitatively in Chapter 8.
5.6.1 Asset allocation of PH and MH stocks
The most important fund managers‘ skills mentioned by the interviewees are stock selection
and asset allocation across different sectors. It is argued in the literature that the stricter the
adherence to screening requirements, the more restrictions there are on stock selection and less
diversification is expected (see Chapter 3). Therefore, interviewees were asked about their
perceptions regarding Islamic funds‘ investment allocation and selection in case of PH
investment alone or both PH and MH investments; however; only the response of FMs is
128 Rahimie (2010), however, classified stocks in terms of Shariah-compliance to two groups: either to Shariah compliant stocks or non-Shariah compliant stocks while this study classifies stocks to four groups; PH, MH, MS, and Sin.

176
detailed in Table 5.4 as they are those who set a fund‘s allocation strategy and make the
investment decisions.
Table 5.4: Fund Managers’ Asset Allocation of Halal-Based Stocks across Different
Sectors
PH portfolio PH and MH Portfolio
B. Inv. Ins. R.E Ind. Ser. F. B. Inv. Ins. R.E Ind. Ser. F.
FM 1 * * * * * * *
FM 2 * * *
FM 3 * * *
FM 4 * * * *
FM 5 * * * * * * *
FM 6 * * * * * * *
FM 7 * * * * * * * * * * *
FM 8 * * * * * * * * * *
FM 9 * * * * * * * * *
FM 10 * * * * * * * * * * *
FM 11 * * * * * *
FM 12 * * * * * *
FM 13 * * * * * * * * * *
FM 14 * * * * * * *
FM 15 * * * * * *
FM 16 * * * * * * *
FM 17 * * * * * * *
FM 18 * * * * * * *
FM 19 * * * * * * * *
FM 20 * * * * * * * *
FM 21 * * * * * * * * * *
FM 22 * * * * * * *
FM 23 * * * * * * * * *
Total 17 11 3 12 5 3 0 21 15 11 18 22 22 10
Note: This table shows which sector the interviewed fund managers allocate their Halal stocks: B=banking, Inv. =
investment, Ins. = insurance, R.E= real estate, Ind. = industrial, Ser. =services, and F= food. The last row provides
the total of each column. The shaded rows indicate that the fund manager does not manage that type of portfolio.
Table 5.4 shows that Islamic fund managers who invest only in PH stocks are concentrated in
the stocks of Islamic banks, investment and real estate companies. This is because the majority
of PH stocks operate in such industries, and few in other non-financial sectors. For instance,
these Islamic fund managers could not find any PH stocks in the food sector.129
Those who
129 PH are not found in the food industry because these companies have interest bearing debts, thus they are classified as MH or MS depending on their compliance with the financial screening criteria, not because they sell

177
were allowed to invest in both PH and MH stocks were more diversified across financial and
non-financial sectors. Some interviewees, especially FMs, argued that it is hard to find 7-10
strong PH stocks, especially after the GFC. However, individual investors, SSs and regulators
believed that investors were able to pick up fundamentally good PH stocks from different
sectors and obtain reasonable returns. This could be due to the fact that FMs manage large
capitalized portfolios and need to allocate across a wider range of stocks to avoid concentration
in certain sectors. Thirty-two percent of the interviewees indicated that they only needed 10-15
stocks to diversify away the systematic risk of their portfolios whereas, 14% said that they
needed 15-20 stocks, 12% mentioned 20-30 stocks. All of the SSs did not know how many
stocks were required to diversify the market risk away, indicating that they are not involved in
the technical aspects of fund management. This may suggest that there is a separation between
Shariah experts and FMs as noted earlier. Furthermore, all the research participants agreed that
there were diversification benefits by investing in more than one GCC stock market to enhance
the performance of Islamic funds, especially those that only invested in PH stocks. This is
similar to the findings of Balli et al. (2013) who find that portfolios (conventional) diversified
across GCC stock markets perform better than those within local markets. The participants
believed that it would be a diversification advantage if Halal portfolios were constructed across
the GCC markets; they mentioned (i) Kuwait stock market (35%), (ii) Saudi Stock Market
(27%), (iii) Qatar Stock Market (22%), and (v) UAE (11%). In addition, the vast majority of
interviewees also confirmed that there were diversification benefits for global ethical investors
to invest in Halal equity stocks since they could be added to ethical equity portfolios.
In order to examine the impact of the screening classification of Halal stocks on portfolio‘s
diversification and performance, the research participants were asked whether there was a
or produce non-Halal food. They would be classified as Sin stocks if it related to their core business (see chapter 6).

178
penalty or cost for investing in only PH compared to investing in both PH and MH stocks. It
was surprising that only 13% of the research participants agreed that being limited to PH had a
significant negative impact on portfolio performance, 48% said that there was no significant
cost, and surprisingly 39% believed that PH-only portfolios could outperform PH-and-MH
portfolios as well as the general market index in some periods of the year but underperform in
other periods. This finding adds to the existing literature, which only examines the
performance of portfolios which contain a mix of PH and MH.130
However, the interviewees
were optimistic about the performance of Islamic funds when they included MH stocks; the
vast majority (86%) of them commented that there was no significant negative impact of
including MH stocks on performance although 14% indicated that such Islamic funds could
also underperform the market index and conventional funds in certain periods.131
Nevertheless,
the participants‘ input was not too different from the literature which examines the
performance of Islamic funds, and Islamic indices132
against their conventional counterparties
or similar Islamic funds or indices (for example Hakim and Rashidian, 2004; Elfakhani et al.,
2007; Abdullah et al., 2007; and Hoepner et al., 2011; BinMahfous and Hassan, 2012; Asharaf,
2013).This section can be summarized by the following quote from FM11 who stated that:
―Although we are limited to a smaller asset universe compared to conventional fund
managers, we are able to find a sufficient number of leading, large cap. and fundamentally
strong mixed Halal stocks to diversify the market risks away, as our Halal portfolio
outperformed the market index and our targeted Islamic index in most of the periods
including the financial crisis period.‖
130
Chapters 7 and 8 will examine this research question using quantitative methods over different sample periods to fill this gap. 131
This outcome will also be examined in the next empirical chapter and compared with the performance of PH portfolios. 132 The term Islamic equity funds and Islamic equity is used in the literature refer to what is described in this thesis as Mixed halal equity portfolios or what is also called Shariah-compliant equity portfolios, which includes PH too, but not PH stocks only.

179
Regarding stock selection, interviewees noted that Islamic fund managers use: (i) fundamental
analysis with news and recommendations (mentioned by 31%); (ii) fundamental analysis
exclusively (24%); (iii) both fundamental analysis and technical analysis (17%). This finding is
consistent with conventional studies on emerging markets such as Al-Abdulqader et al. (2007),
Tijjani, et al.(2009), Al-Mujmed (2011) that conclude that fundamental analysis is the most
widely adopted approach to a stock‘s valuation, For instance, FM 11 who used technical
analysis in KSE highlighted that:
―I have been using technical analysis for the last 10 years; however I cannot depend on it
exclusively, but rather use it with the market news and other possible information, because
certain news and signals could result in different reactions in the market that could spoil all
your technical analysis approach. This approach helps me understand the behaviour and
psychology of both investors and speculators in the stock market and anticipate the coming
movement in the market. For example, I liquidated our portfolios in 9/7/2008 and achieved
27% returns in a few days before the whole market collapsed, however I faced strong
resistance by the CEO, but because I had the power to make that decision, I made it, since
all the indications were worrying, and I knew that there was a crisis coming as I monitor
the US markets and when the market crashed a few days later, the CEO and management
appreciated my decision.‖
This also shows the impact of different market conditions, such as the GFC that led the whole
market to crash.133
In addition, some fund managers highlighted the importance of the
experience and the track record of the board of directors and management of investee
companies as well as the performance of the overall sector which could impact on their stock
performance. For example Interviewee FM1noted that:
―We trust fundamental analysis more than technical analysis. For that, we first start with
industry analysis across all sectors in the market, because the performance of different
industries varies, as well as some industries are more sensitive to the change in the overall
market index or economic downturns. This is why we diversify our Islamic local funds
across different sectors but we also created sector based funds across different GCC and
MENA countries. Second, we examine the business model of the company, major owners,
its management reputation and experience, and past 3 to 5 years performance.‖
133
Islamic fund managers’ timing ability, however, is not assessed in this study because it does not use Islamic funds data, the current study create different portfolios based on the different screening criteria as elaborated in Chapter 6 and their performance is discussed in Chapters 7 and 8.

180
Nevertheless, other fund managers and investors argued that there were other factors that
affected the stock performance, such as insider trading. Although they admitted that insider
trading is generally not lawful, they excused such practice by saying that it had a cultural
background that pushed FMs and some investors to employ such sources of information,
arguing that Kuwait was a socially intensive culture where, with informal relationships and
contacts, FMs can get access to information before it is released to the market. For instance
Interviewee FM15 declared that:
―Unfortunately, we do not have strict legislations in Kuwait punishing insiders to refrain
from trading on confidential information, compared to Saudi Arabia. For instance, the
same Kuwaiti CEO who was working for the largest telecommunication company in
Kuwait was never punished for revealing insider information during his social informal
meetings; however he was strictly penalized for the same practice in Saudi Arabia where
he is currently working.‖
This finding is no different from that of Al-Mujmed (2011) about the Kuwaiti stock market
which shows that insider trading is a wide spread practice affecting stock price movements.
Furthermore, some interviewees believed that rumors had a significant impact on stock prices.
Interviewee FM16 touched upon this issue and stated that:
―The common saying states: ‗Buy the stock based on rumors and sell it when the news is
confirmed‘. They mean positive rumors about the company that lead to an increase in its
stock price. This is for several reasons; first the investment awareness level is generally not
mature enough among investors, as many of them could not analyze or deeply understand
companies‘ financial statements. Second, we are not an efficient market and do not have a
large number of companies compared to developed markets. Third, we are a speculative
market, where most investors seek short term returns and run away.‖
The media is another source of information that affects stock prices. For example, FM12
asserted that:
―I always start my investment day, first thing in the morning, by scanning all newspapers
and consider the first impression, if the political and economic news are negative; this will
have a negative reaction on my physiology and investment behaviour for the whole day
and vice versa. Because media is an important vehicle through which information is widely
spread to all market participants such as investors, analysts, managers, and regulators.
Hence, such information and news will indeed have a direct or indirect impact in forming
their decisions.‖

181
Moreover, some interviewees noted that many investee companies invested in each other.
Thus, many of them were correlated and tied together, because they held significant
ownerships or informal and social relationships or because many of them are owned by
merchant families. This facilitates the flow of information and recommendations between
them, regarding takeovers, dividends and profit announcements, or other important news that
affects the stock price. Therefore, many interviewees argued that there were many variations in
stock prices that could not be explained, emphasizing the need to apply corporate governance
in KSE, as CMA in Saudi Arabia. Many interviewees thought that Kuwaiti Islamic funds were
more mature than in other markets. Indeed, a few regulators affirmed that that the new Kuwaiti
CMA legislations would address the previous practical issues. Many interviewees argued that
the performance of the KSE market had been negatively affected by the GFC, the political
crisis caused by the Arab spring that started at the end of 2010, local political disputes
especially from 2009-2011and instability in Kuwait between the parliament and previous the
prime minster (see Chapters 2 and 8). Thirty-nine percent of the interviewees indicated that the
GFC affected the performance of all firms in GCC stock markets; 26% argued that Islamic
companies (PH) were affected more than non- Islamic ones, while 35% thought that
conventional companies were affected more. Interviewee SS11 affirmed that:
―The global financial crisis caused many companies in the GCC stocks markets to
default, as many companies in the GCC were tied with US and European banks and
financial institutions that were severely affected by the crisis. The Dubai debt crisis had
huge impact on the GCC region, I guess Islamic companies were affected more because
many Islamic investment companies invested there and were involved in more long term
debt. Furthermore, the dramatic political change in the Arab spring countries that started
in Tunisia, Egypt, and Libya, Yemen had a huge impact on all GCC stock markets. These
economic and political factors made the recovery after the global crisis difficult and
slow.‖

182
Therefore, political events, economic market cycles, a financial crisis or worldwide recessions
are systematic risks that affect the performance of both Islamic funds and conventional
funds.134
The other factor that a few interviewees thought might affect Islamic funds‘ performance was
earnings purification which is discussed next.
5.6.2 The Purification of Islamic Funds
The vast majority of interviewees agreed that fund managers and investors should ‗purify‘ or
‗cleanse‘ their MH stocks‘ earnings from non-Halal sources, in order to be Shariah-compliant
earnings.
Interviewees noted that the concept of ‗purification‘ was applicable when the non-Halal
revenues of a stock was 5% or less of the total revenues or total income; if the non-Halal
revenues exceeded the 5%, then the stock was considered to be non-Halal and should be
filtered out and removed from the portfolio if it was part of it, even though it was compatible
before that as noted earlier. These findings are supported by the literature (See: Elgari, 2002;
Ayube, 2007; Girard and Hassan, 2008; Derigs and Marzban, 2008; Usmani, 2010).
FMs asserted that the SSBs did not allow them to use purified amounts for tax or Zakat but
rather they to be given away to given for charitable purposes. Interviewees stated that the non-
Halal earnings purification of funds was calculated annually when the audited financial
information of the investee companies became available and the purification amount was
134
Chapters 7 and 8 capture the impact of different market conditions on the performance of different Shariah classified stocks by dividing the sample period to the full sample period (2006-2011) and three sub periods; bullish period before the GFC (2006-2007), the GFC (2008-2009), and the bearish period (2010-2011) to capture the Arab spring regional crisis and the Kuwait local political instability. Chapter 8 for instance, introduces a dummy variable to examine the impact of the GFC. In addition Chapter 8 introduces dummies for each sector in the market, and firm’s size, to study their impact on different Halal and non-Halal investee companies.

183
deducted prior to the Islamic funds‘ profit distributions. The interviewees highlighted that the
purification process was conducted on a stock by stock basis.135
5.7 Portfolio Performance Evaluation
The interviewees revealed that in GCC countries Islamic fund managers used non risk-adjusted
measures to evaluate their investment funds‘ performance such as raw returns or net asset
values (mentioned by 63% of the interviewees). In addition, some interviewees also mentioned
the Sharpe and Treynor measures (14%), Jensen‘s alpha (5%), the Information ratio (5%) and
the Mean-Variance optimization model (5%). However, some interviewees criticized FMs
investment decision making for being naïve and not using MPT. For example, Other 7 (an
individual investor) argued that:
―I prefer investing through my own equity portfolio, because Islamic funds do not really
add value to my investments, as they usually do not provide superior returns above the
market index, but charge my fees for that?! I believe that fund managers generally in
Kuwait and GCC, do not follow professional and sophisticated portfolio risk-adjusted
analysis models, unlike other fund managers in developed markets, as most of them simply
follow insider information, general market trends and apply few financial ratios on certain
stocks. I blame the regulators that do not require high qualifications or standards to employ
fund managers.‖
The interviewees demonstrated that fund managers in the GCC do not use sophisticated
investment techniques, but argued that simple measures were more applicable. Some
interviewees noted that FMs use only one performance measure, while others mentioned using
multiple measures. The only group of interviewees who were not aware of Islamic funds‘
performance measurements was SSs, and the majority of them believed that Islamic fund
managers used raw returns. Indeed, many SSs were not familiar with the difference between
risk- adjusted and non-risk-adjusted performance measures. Most of the SSs justified their lack
of knowledge in such issues by declaring that these issues were not directly related to Shariah,
135
Since few interviewees believed that income purification affected stocks performance and because many Islamic funds only declare the amount of non-Halal purification that needs to be paid out from earnings, this study does not adjust for such purification in later chapters.

184
but were financial and investment decisions. However, when risk-adjusted returns were
explained to some of the SSs, and that interest was a component of their calculation, many of
them were unhappy that fund managers were using such performance evaluation techniques.
A number of interviewees, including SSs themselves, highlighted that SSs should have
sufficient financial knowledge, or at least have a financial expert on the SSB, to effectively
monitor funds. For instance SS12 reported that:
―Disappointingly many Shariah board members and Shariah auditors are not involved in
the financial details, as they believe that they do not contradict Shariah guidelines,
however this is essentially because many of them lack strong financial, accounting and
economic backgrounds. Thus, I suggest training them on such disciplines or including
members with other than those specialized in Shariah, who are experts in such disciplines
to bridge this gap.‖
This reveals the need to promote the Shariah audit function in IFIs and funds, as supported by
Kasim et al. (2009), Yaacob and Donglah (2012), who also indicated that few are expertise in
the industry that have both Shariah and accounting qualifications. Hence, Shariah auditors
should be trained in accounting with a specialized certification in Shariah (Yaacob and
Donglah, 2012; Kasim and Sanusi (2013).
The majority of FMs who used conventional performance measures argued that Islamic equity
funds were similar to conventional equity funds, except that their universe was more restricted
as defined by their SSB. Therefore, they argued that it was rational for them to use the same
conventional models and many explained why most empirical studies on Islamic funds use
conventional portfolio measures without even considering this as a limitation in their work,
such as Hussein and Omran (2005), Abdullah et al. (2007), Elfakhani et al. (2007), Abderrezak
(2008), Girard and Hassan (2008), Derigs and Marzban (2009), Merdad et al. (2010) and
Hoepner et al. (2011). Contrary to most studies, Rahimie (2010) uses the Mudarabah
investment account return rate as an alternative proxy of the risk-free rate in the Sharpe and
Treynor ratios to evaluate his Halal approved stocks in the Malaysian stock market. This has

185
not yet been addressed either in academic research or in the professional literature and this
thesis fills this gap and examines whether there is a Shariah-compliant alternative to interest-
based benchmarks, particularly the risk-free rate. This would then reflect the objectives of
Islamic fund studies and hence this contributes to our knowledge.
Hence, all the interviewees were asked whether there was a need to construct new alternative
performance measures that aligned with Islamic investment principles. Twenty-one percent of
the interviewees said there was a need to construct alternative performance measurements for
Islamic funds, and 20% said that they were not comfortable with using current conventional
models as they felt that they were not consistent with Islamic investment principles. Forty-one
percent of the interviewees, however, declared that there was no need to develop new
performance models to measure Islamic funds or Halal portfolios, most of these were FMs
who had, in practice, never used Shariah oriented risk-adjusted performance measures. Indeed,
only a few FMs had even thought about this.
The interviewees provided several reasons justifying why they thought that there was no need
to develop a new alternative to interest-based performance measures as follows. First, 34% of
them believed that it was only a benchmark, arguing that Islamic funds do not invest in interest
rate securities and the risk-free interest rate was a proxy derived from the market to measure
risk and return, compared to sellers of products who based prices on supply and demand.
Interviewee SS6 illustrated this argument by saying that:
―Consider two friends X and Y, where X is a non-Muslim who sells Alcohol, and Y is a
Muslim who decides to start his own Halal business of soft drinks because the Alcohol
business is non-Halal in Shariah. But Y wants to earn as much profits as his friend X, so
he decided to charge his customers the same price as X who sells Alcohol. Thus, Y has
determined the profit of his soft drinks business using the same rate of return that is used
by X for his Haram Alcohol business as a benchmark .We cannot say to Y that his profits
are non-Halal simply because he uses the price of Alcohol as a reference in the return
calculations. The same logic applies for pricing and measuring the performance of Islamic
funds, using such a reference does not render their returns non-Halal because the number
itself does not mean that they are dealing with interest if it is used as a benchmark only.

186
However, it is still preferable to have an independent benchmark for the Islamic finance
industry.‖
This is consistent with that of Usmani (2010) and the AAOIFI standard (2004). Subsequently,
they argued that if they used something other than what was popular in the market, this might
lead Islamic funds to have inaccurate evaluations as it would not reflect reality against the
market competition. Second, 29% of the interviewees thought that the risk-free rate was the
only available option to measure risk and return in a suitable and economically wise manner.
For instance, interviewee FM6 demonstrated that:
―For any investment, the required rate of return depends on two components, the risk-free
rate of return earned on government short term bills such as LIBOR or T-bills that are
interest based, and the second is a risk premium determined on the riskiness of that
investment compared to other available opportunities. Therefore, moving away from
LIBOR or T-bills is difficult, even with our Islamic investments, because there is a
correlation between interest rates and returns on investments and Islamic funds have to be
affected since they operate within the same conventional financial system.‖
This view accords with Chong and Liu (2009), Zainol and Kassim (2010), and with Cevik and
Charap (2011) who highlighted a significant correlation between the Islamic and conventional
financial system, whereby changes in interest rates put pressure on Islamic deposit rates to
change due to competition.
Third, 13% of the interviewees noted that an alternative model was not needed because Islamic
funds currently used raw returns that are believed to be sufficient. Interviewee Other1
supported the above argument as he stated that:
―The risk profile for the GCC states should be seen differently, as they are not a pure
capitalist financial system, because the governments support the banking system and hold
large portfolios of funds in the stock market, most of which are conventional, and they
own shares of the big listed companies in the market. In addition, GCC states do not have
active bond or money markets. Finally the GCC economies rely heavily on petroleum
exports. Therefore, these factors make the use of raw returns reasonable for evaluating
Islamic and conventional investment funds.‖

187
On the other hand, twenty one percent of the interviewees criticized the use of these interest-
based measures when evaluating Islamic funds, affirming that there was a need to develop a
Shariah-compliant alternative for risk-adjusted performance methods that replaced the interest
based component in them. These interviewees supported their views by noting the need to have
a unique identity for the Halal finance industry (mentioned by 42% of the interviewees). For
instance, interviewee SS5 asserted that:
―The Islamic funds industry has to have a unique identity that distinguishes it from
mainstream conventional funds. Thus, developing an alternative evaluation performance
model that avoids the interest-based benchmark will demonstrate the ideal and independent
image of the Islamic financial system and would be a step forward for a pure Islamic
capital market among Muslim countries. Therefore, creating an Islamic alternative would
be a breakthrough in the industry. However, this requires collaborative efforts between
academics and practitioners from the central banks and Islamic financial companies, and I
expect that your thesis could contribute to this.‖
Some reasons for the absence of such Shariah-compliant alternatives were provided, but
interestingly, interviewee FM14 raised the following point:
―In order to have a viable Islamic alternative to the interest rate, you have to have a pure
Islamic capital market, that is not dominated by the conventional system. However, it
would be very difficult within a dual financial system to use Islamic and conventional rates
efficiently because many investors would arbitrage or force the new one to converge.‖
Further, using conventional models that incorporate risk-free rate is against the idea of Islamic
investment, and acknowledges the interest-based financial system (mentioned by 30%).
Interviewee SS12 highlighted that:
―Since the conventional models are designed for conventional investment funds that are
based on an interest based financial system, they fail to consider the constraints imposed
by the Islamic funds. Therefore, including the risk-free rate in computing estimated returns
should not be justified for Islamic funds as they are likely to be biased against them. The
conventional system relies on debt and risk transfer, while in an Islamic financial system,
returns should not be predetermined or guaranteed and instead of direct money transfer
from parties who have surplus to parties who need them based on interest, Islamic finance
requires a sharing of risk and return between parties in the economy.‖

188
This standpoint is similar to that in Kuran (2004); El-Gamal (2007); Kamla (2009). In addition,
as the Islamic investment funds industry had grown rapidly (mentioned by 18% of the
interviewees). Hence, it is now a time to develop a measure, as interviewee SS21 asserted that:
―Islamic investment funds have grown not only in GCC states but also in the world and
have competed effectively with the market leaders. Thus, the time has come to have a
reliable and well-designed Shariah compliant model that works independently from the
existing interest based ones. I know it is not easy to construct one but it is not impossible
either and someone has to take the initiative.‖
A few of the interviewees pointed out that if an alternative evaluation strategy was independent
from interest rates, this would mitigate any exposure to interest rate. As noted by Kader and
Leong (2009), using interest based benchmarks could expose Islamic investment products (i.e.
Islamic funds) to interest rate risks even though they are themselves interest free.
Forty-four percent of the interviewees, most of whom were FMs, did not know what could be a
Shariah-compliant alternative for the risk-free rate. Therefore, only a few suggestions were
made by the interviewees as an alternative to the interest based ones, such as gold, something
similar to the old Islamic golden currency, the Islamic banks investment deposit rate, the
Murabahah return rate, a profitability index based on Murabahah or Musharakah rate of
returns, Islamic Mudarabah investment accounts, government Sukuk or leasing Sukuk (because
they are the least risky type of Sukuk), the inflation rate, the Zakat rate that is fixed to 2.5%, or
the inflation rate plus zakat rate. Some interviewees, however, thought that gold was not
suitable as a proxy for the risk-free rate arguing that it was currently a risky and speculative
asset.136
136
This study extends the risk-adjusted performance evaluation analysis by using a Halal alternative risk-free rate asset, Murabahah return rate in calculating the Jensen alpha, Sharpe and Treynor performance measures in Chapter 7. This is to overcome the limitation in the vast majority of Islamic funds literature which use conventional risk-free rates (see also: Rahimie, 2010; Kantakji and Omar, 2010; Selim, 2008; Mirakhor,1996). The Murabahah instrument was chosen as a proxy for the Shariah-compliant risk-free rate because it is the least risky Shariah-compliant asset and is commonly used by most IFIs (El-Gamal, 2006).

189
Finally, the interviewees were asked about the Indexes that Islamic funds use to benchmark
against. The majority of interviewees believed that there were very few Islamic index providers
and most of them were local to each GCC country and were only used in house such that they
were not available to the public. For example, FM12 asserted that:
―There are few Islamic indices available in the market, but these are mostly used in house.
So, it is difficult sometimes for investors to get access to them, in order to track them. But
even if you get access to them, some investors will get confused to decide which to follow.
Hence, there is a real need for the stock market to adopt an existing Islamic index or create
and launch a new Pure Islamic index and another Shariah compliant index, as this would
standardize the benchmark for all Islamic funds in the market, in order to have a valid
comparison because the performance of Islamic funds is sensitive to the chosen index.
Finally, these two indices‘ methodology should be based on professional characteristics
and disclosed criteria.‖
Two interviewees (Other11 and Other13) pointed out that constructing an Islamic benchmark
index was a potential project for the CMA in Kuwait and use a Halal-based equity index such
as AL-Aman Islamic index or Global Islamic index that are more related to PH investments.
Nevertheless, most interviewees noted that using the KSE index was preferable because it was
widely accepted. This is similar to the findings of Bauer et al. (2005) and Cortez et al. (2009)
who suggest that conventional benchmarks are better able to explain SRI fund returns than SRI
benchmarks.
5.8 Summary
This chapter analyses and reports the findings obtained from 58 interviewees who are key
participants in the Islamic funds industry in Kuwait and other GCC countries and provides
primary data from industry practitioners about issues related to Shariah screening and
performance as a basise and design for the following chapters.
A number of key findings emerged from these interviews. First, the Islamic investment
industry has grown rapidly in the last decade especially after the boom of GCC stock markets
in 2004 onwards. This growth could be attributed to a number of reasons, including: (i)

190
demand from Muslim and non-Muslim investors;(ii) increase in the level of awareness of the
Shariah-compliant products and services; (iii) the profitability and competitiveness of Islamic
funds; (iv) excess liquidity in the GCC economies; and (v) improvement in the regulatory
framework for Islamic finance. Second, the interviews revealed a gap between the supply and
demand motivations for Islamic investment; investors are concerned about religious and
economic motives while fund managers are concerned with profits. This challenges Islamic
funds to distinguish themselves from their conventional counterparts on the basis of religious
and ethical values. Third, all the interviewees distinguished PH stocks from MH stocks; most
interviewees distinguished between sin and MS stocks, this differentiation has not been
considered in the prior literature and contributes to our knowledge. However, by excluding MH
stocks restricts the Halal investment universe which possibly reduces the diversification
benefits and hence hinders Islamic funds‘ performance (as examined in the following
chapters). Fourth, some interviewees suggested imposing ―tighter‖ criteria for classifying MH
stocks as some interviewees seriously questioned the Shariah-compliance of MH stocks,
arguing that the current financial screening criteria do not have a strong Shariah-based
rationale underpinning them and that the fatwa that they are based on should be updated.
Indeed, the vast majority of interviewees agreed that the financial screening criteria needed to
be re-evaluated toward being more Shariah-compliant and companies in Islamic countries
should be different from western countries. Yet, many interviewees doubted that any changes
to the financial screening criteria would occur due to the influence of the GFC. Fifth, the
financial screening thresholds used are similar compared to the findings of Derigs and Marzban
(2008) and Abdul Rahman et al. (2010) who found big differences between screening criteria
used by different Islamic funds.This could be because the SSBs of GCC Islamic funds have the
same group of Shariah scholars and, further, these countries share similar investment

191
environments, economic, political, and social systems. The majority of the interviewees
asserted the importance of harmonizing Shariah screening criteria to produce one unique
investment list for all individual investors and Islamic funds. Sixth, the current screening
process involves substantial cost and time since accounting information is not prepared for
Shariah screening purposes, as indicated by some interviewees and accounting standards based
on Islamic values should be developed to cater for the unique characteristics of Halal
investments. Seventh, the interviewees agreed that the financial reports with their notes were
the most important source of information for evaluating MH stocks, while the Articles of
association and the existence of SSBs was the most important source of information for
evaluating PH stocks. Some interviewees however, asserted that the level of disclosure in
companies‘ annual reports was low and were not prepared for Halal seeking investors.
Eighth, the factors that affect the performance of Islamic funds are similar to those that affect
conventional funds; fund managers‘ skills in stock and sector selection and timing, and general
market conditions, in addition to the Shariah classification of stocks to PH, MH, MS, and Sin.
Ninth, Islamic funds that invest in PH stocks are concentrated more in the financial sectors
while those that invest in both PH and MH stocks are more diversified across financial and
non-financial sectors. Tenth, there is a knowledge gap between fund managers, SSs, and
regulators, which needs to be bridged to overcome the challenges facing the industry. Eleventh,
Islamic fund managers (and conventional fund managers) in the GCC do not use any
sophisticated performance measures, and only a few of them use the traditional Sharpe,
Treynor and Jensen alpha measures arguing that simple measures are more applicable. Finally,
some interviewees supported the idea of constructing alternative risk-adjusted performance
measurements that replace the interest based component in them.

192
The next chapter analyzes the impact of using different Shariah screening criteria on the
classification of the Halal and non-Halal stocks and creating different equity portfolios from
KSE. It also investigates the impact of changes to the screening criteria adopted by the
AAOIFI (Shariah standard number 21) on the MH asset universe. The Shariah classification of
stocks in Chapter 6 will then be used for the quantitative analyses in Chapters 7 and 8.

193
Chapter 6: The Impact of Different Halal-based Screenings on
Investment Portfolios

194
6.1 Introduction
This chapter analyses the impact of applying different Shariah screening criteria to a Halal
asset universe and the creation of different Halal equity portfolios: pure Halal (PH) and mixed
Halal (MH) and non-Halal equity portfolios of either ―Sin‖ or Mixed ―Sin‖ (MS). The chapter
also examines the impact of changes to the screening criteria adopted by the AAOIFI (Shariah
standard number 21) on the asset universe. The screening process is carried out during the
period from the end of 2005 until the end of 2010; this time frame covers various economic
market conditions and spans the years before and after the recent GFC. This allows us to
examine the effect of the crisis on portfolios of equities listed on the KSE. The focus of this
chapter is to create different portfolios based on various Shariah screening criteria that will be
tested in the following two empirical chapters of the thesis. This chapter also investigates
whether a reduction of 50% in the financial screening thresholds that are applied to MH
equities has an impact on the asset universe and portfolios created; such an investigation will
help to explore whether MH investments (MH) improve the performance of Halal portfolios.
Therefore, unlike prior research, this chapter uses content analysis of each company‘s annual
report to collect the data required to conduct the Shariah screening; the process is performed
manually and repeated annually to ensure accuracy. This chapter builds upon the interview
chapter findings. Furthermore, the results of this chapter will form the basis of the next chapter,
as the performance of the different portfolios identified in the current analysis will be
empirically compared and tested.
The remainder of this chapter is organized as follows: section 6.2 presents the screening
process; section 6.3 outlines the data collection methods used, section 6.4 describes the
screening results, while section 6.5 presents the findings when the financial screening

195
thresholds are halved; section 6.6 outlines the portfolio construction results followed; and
section 6.7 concludes.
6.2 Screening criteria and process
The detailed data required for Shariah screening were collected during a 6-year period from
31/12/2005 to 31/12/2010; this information included the different financial and non-financial
(qualitative) screening criteria that are used by Islamic fund managers in Kuwait and GCC
countries as discussed in the interview chapter. The population used in this analysis was
comprised of listed companies on the KSE, covering all sectors including both financial and
non-financial companies; namely, firms from the banking, investment, insurance, real estate,
industrial, services, food, and non-Kuwaiti sectors. However, the non-Kuwaiti sector was
excluded due to the non-availability of the data during the sample period. Figure 6.1
summarizes the portfolio creation process.

196
Figure 6.1: The Portfolio Creation Process
Note: This flow chart describes the screening process to classify stocks of investee companies to Halal and non-Halal stocks
based on AAOIFI (2004 and 2006) financial screens and the proposed halved screening thresholds.

197
Analysis of Figure 6.1 indicates that the first screen used in this thesis is a qualitative or sector
compliant one which asks whether the core business of the company is Halal (compliant), to
filter out companies that operate in or are engaged in any of the ―sin‖ industries as identified
under Islamic law, such as: interest based financial services (conventional banks, financing and
investment); conventional insurance companies; adult entertainment; and hotels or resorts
which generate a sizeable proportion of their returns from serving alcohol. Shares in such
companies are classified as sin stocks and pooled in the sin portfolio, without looking at any of
their financial data as there was a consensus among all the Shariah scholars and Islamic fund
managers interviewed in Chapter 5 that investment in these types of securities is strictly
prohibited. If companies pass this first screen, two further filters are applied: (i) does the
company state clearly in its annual report137
that it follows Shariah law in all its activities; and
(ii) does it have an active SSB overseeing all its operations and contracts. If the answer is yes
to both screens, then the stock of this company is classified as a Pure Halal (PH) stock.
However, if the result is no to either of these two screens, then the company could comprise of
both Halal and sin elements in its activities; thus it is classified as mixed company, which
could be classified as mixed Halal (MH) or mixed sin (MS) as seen later in the following
screening level. Shares in a majority of KSE firms are mixed stocks. Examples of such stocks
are: Zain, a mobile telecommunications company that is listed in the service sector; and Kuwait
Pipes Industries & Oil Services, a manufacturing company listed in the Industrial sector that
produces pipes and pressure vessels and provides a wide range of technical and engineering
services. Neither company indicates that they follow Shariah law, and they do not have an
SSB, but their core business is Halal; in addition, they have some interest-based debt in their
capital structure and receive non-operating interest revenue. However, not all mixed stocks are
137 This could be mentioned in its articles of association if it is a newly listed company.

198
Shariah compliant (Halal); some are Halal, while others are non-Halal mixed sin (MS). This
categorization can change over time, depending on the level of the sin component in their
activities, and depending also on the screening criteria used. Thus, a further level of screening
is imposed to determine the size of the sin element in these stocks and financial screening is
used for this purpose (Hakim and Rashidian, 2004; Khatkhatay and Nisar, 2007; Derigs and
Marzban, 2008; Abul Rahman et al., 2010; Ho et al., 2012; Marzban and Asuty, 2012).138
There are a range of Shariah compliant financial screening methods followed by fund
managers as well as indexes providers, namely Dow Jones Islamic Market Index (DJIMI),
FTSE Global Islamic Index Series, S&P 500, MSCI (Morgan Stanley Capital International)
and AAOIFI. The method selected for use in the current study is derived from AAOIFI‘s
Shariah standards; this was chosen because it is the most widely used in Kuwait and GCC
according to interviewee feedback (see Chapter 5). AAOIFI‘s financial screening criteria were
changed in 2006, when the market capitalization was used instead of total assets as a
denominator in its financial tolerance ratios. Some index screening providers and fund
managers in the GCC have adopted the recent change, while others have retained the old
criteria, based on total assets, believing them to be more stable. Both versions are examined in
the empirical analysis for the current chapter, in order to examine the impact of screening
criteria changes adopted by AAOIFI on the asset universe available for investment and the
performance of different portfolios. The first version of the financial screening criteria stated in
138
One difference between PH and MH stocks is purification. The interview analysis in Chapter 5 reveals that Islamic fund managers purify the impure income received from dividends of mixed halal investee companies corresponding to the proportion of interest or other sin income and this is paid out to charity. Some Shariah scholar’s view that purification is required even in the case of capital gains, because the market price of the share may reflect an element of the sin income as reported in the previous chapter ( also see: Elgari, 2002; Ayub, 2007; Hassan and Lewis, 2007; Usmani, 2010). On the other hand, dividends received from PH stocks do not need any purification, as they are already pure (as revealed from Chapter 5). Divided purification is not considered in this study, because in practice many SSBs allow Islamic fund managers to inform investors of the amount investors need to pay out themselves to purify their investments; hence such purification is not conducted by the fund managers themselves on behalf of investors.

199
AAOIFI standard number 21 (2004)139
states that, to be included in a Shariah compliant
portfolio, a stock‘s company must have a ratio of:
1. Interest revenue and un-Halal (sin) revenues to total revenues of less than 5%;
2. Interest bearing debt to total assets of less than 30%‘ and
3. Interest bearing investments and cash to total assets of less than 30%.
The revised standard (AAOIFI, 2006)140
changed the criteria such that a company could only
be included in a Sharia-compliant portfolio if it had a ratio of:
1. Interest revenue and un-Halal (sin) revenues to total revenues of less than 5%;
2. Interest bearing debt to market capitalisation of less than 30%; and
3. Interest bearing investments and cash to market capitalisation of less than 30%.
6.3 Data Collection
Unlike previous research on screening, the data in this study were gathered directly from hard
copies of companies‘ financial and annual reports to ensure accuracy as indicated by Wilson
(2004, p.37) who emphasized that:
―Screening requires a considerable amount of information that can only be ascertained by
scrutinizing the company‘s annual reports and accounts‖.
Companies‘ annual reports were obtained from the research department of the KSE; such data
were unavailable in electronic format from any source. Thus, the first time consuming task
involved an analysis of the annual reports for all the listed companies by hand. The findings
from this analysis were then entered into Excel spreadsheets - one for each year. Based on the
screening process described in Figure 6.1, together with the analysis of the annual reports, the
listed stocks were classified into four different portfolio groups: PH, MH, MS, and Sin. Since
detailed financial statements for KSE-listed companies are only published on a yearly basis,
139These financial screening criteria are similar to MSCI and FTSE which use Total Assets as a denominator. 140These financial screening criteria are similar to S&P and DJ which use Market Capitalization as a denominator.

200
the screening process is based on the six annual financial statements published by each of the
sample companies for the years 2005-2010.141
The screening at the end of each year was then
used to create portfolios for the following year. For example, data from companies‘ annual
reports as of 31/12/2005 were used to construct the different portfolios for 2006. This process
was repeated each year, so that each portfolio was rebalanced annually over the sample period.
The process of collecting and preparing the data to conduct the screening consumed two
months and the screening process took another two months.
Information for the qualitative screening was also gathered from the annual reports of Kuwait
listed firms; the articles of association for new listed companies, newspaper articles, company
websites and the KSE website; in addition, the annual Shariah report (if applicable) attached
with company‘s annual report was reviewed. This review was designed to investigate if all of
the company‘s transactions were fully Shariah compliant or whether the core business of the
company was Halal with some sin elements among its activities. In a number of cases, the
researcher contacted a company directly if a Shariah report was not published or to clarify
some details about items that appeared in the annual reports such as the nature of any debt or
interest income.142
The next stage in this process required financial screens to be applied; the
data for these screens were collected solely from each company‘s financial statements. Items
such as details about cash, interest berating debt, and total assets were collected from the
balance sheets, while items such as: interest revenue, other-sin revenues and total revenues
141
In practice, some Shariah screening providers in Kuwait issue a list quarterly and hence Islamic fund managers need to rebalance their portfolios accordingly. However, these Shariah screening providers either use an external provider specialized in such services and automated advanced screening software (i.e. Ideal Ratings) or allocate full-time employees to accomplish this process. 142
Few companies in the industrial and service sectors were found to have interest income and debt in their annual reports, although they had a SSB. They justified this verbally by saying that they had converted to an Islamic company and their SSB had allowed it to clean their financials from interest-based debt and interest revenues in a few months gradually after the conversion date.

201
were ascertained from the income statements.143
All of the companies prepared their financial
statements under the International Financial Reporting Standards (IFRS). However, due to the
low level of disclosure about disaggregated information, it was unclear whether or not certain
items were Halal (e.g. other income, cash in banks, debt, other investments, investment in
securities, and other liabilities); borrowings for example could be Murabahah debt which is
Halal or just conventional interest bearing debt that is sin. To obtain more detailed
information, the notes to the financial statements were examined.144
This process was
consistent with the analysis undertaken by the vast majority of interviewees interviewed in
Chapter 5; these interviewees suggested that the whole annual report and financial statements
as well as the notes must be investigated to determine the Shariah-compliance of companies. In
addition, the inadequate level of disclosure for assessing Sharia-compliance found in the
annual reports was in line with the views expressed by 34% of the interviewees in Chapter 5;
these interviewees indicated that annual reports and financial statements are insufficiently
detailed for Halal-orientated investors as they are based on Western standards which do not
report on Shariah-compliant issues; indeed, some of them called for the establishment of an
Islamic accounting and auditing framework underpinned by Shariah law, in conjunction with
AAOIFI. This finding is in agreement with that suggested by Karim (2001), Harahap (2003),
Maali et al.(2006), Haniffa and Hudaib(2007), Khatkhatay and Nisar (2007), Yaacob and
Donglah (2012), Kasim and Sanusi (2013), and Sarea and Hanefah (2013). In addition, it is
also consistent with studies that found low level or incomplete financial disclosure of firms in
emerging markets (Salter, 1998; Al-Mutawaa, 2010; Cognizant Report, 2012).
143
There were no items mentioned in the financial reports like sin revenues or sin investments to describe Shariah non-compliant items, however a Shariah background is required to determine such related items, such as: revenues generated from sale of non-permissible products such as pork, alcohol, tobacco or investing in sin stocks, conventional bonds, and financial derivatives. 144
For each individual company for every single year, annual reports and notes range from 30 to 90 pages long.

202
6.4 Screening Results
Table 6.1 reports the results obtained by applying financial screens to the group of mixed
companies as at the end of 2005 as an example of the screening process output. These one-year
financial-screening results relate to firms in non-financial sectors of the KSE (real estate,
industrial, services, and food) as at the end of 2005.This is because none of the constituents for
the mixed companies group were drawn from the financial sectors (banking, investments and
insurance); companies in the financial sectors are either PH or Sin as their core business is
financial intermediation or insurance that has to be in one of these two categories.

203
Table 6.1: Results for Financial Screening as at 31/12/ 2005
Company name Sector
Based on AAOIFI 2004 financial screens
Screening
Result
portfolio
Based on AAOIFI 2006 financial screens
Screening
Result
portfolio
Criteria (1) Criteria (2) Criteria (3) Criteria (1) Criteria (2) Criteria (3)
Interest Rev.
+Other Sin
Rev./ Total Rev
Interest
Bearing
Liab./T.A
Cash + Interest
Bearing
Investments/T.A
Interest Rev.
+Other Sin
Rev./ Total Rev
Interest
Bearing
Liab./M.C
Cash + Interest
Bearing
Investments/M.C
KUWAIT R.E Real Estate 0.004 0.118 0.053 MH 0000 0000 0000 MH
UNITED R.E Real Estate 0.000 0.398 0.034 MS 0000 54.0 0000 MS
NATIONAL REAL
ESTATE Real Estate 0.022 0.213 0.002 MH 0000 0000 0000 MH
SALHIAH Real Estate 0.007 0.476 0.012 MS 0000 54.. 0000 MS
TAMDEEN Real Estate 0.000 0.289 0.000 MH 0000 5400 0000 MS
AJIAL Real Estate 0.161 0.005 0.244 MS 5400 0000 54.0 MS
AL-MASSALEH Real Estate 0.080 0.217 0.009 MS 5450 54.0 0000 MS
ARAB R.E Real Estate 0.000 0.314 0.006 MS 0000 0000 0000 MH
UNION R.E Real Estate 0.001 0.047 0.002 MH 0000 0000 0000 MH
MABANEE Real Estate 0.000 0.283 0.028 MH 0000 0000 0000 MH
INJAZZAT Real Estate 0.000 0.253 0.036 MH 0000 0000 0000 MH
SANAM Real Estate 0.001 0.000 0.029 MH 0000 0000 0000 MH
AQAR Real Estate 0.149 0.000 0.042 MS 5400 0000 0000 MS
AL-MAZAYA Real Estate 0.010 0.016 0.063 MH 0000 0000 0000 MH
AL-THEMAR INT. Real Estate 0.000 0.000 0.001 MH 0000 0000 0000 MH
TAAMEER R.E Real Estate 0.066 0.106 0.116 MS 5450 0000 0000 MS
NATIONAL
INDUSTRIES GROUP Industrial 0.000 0.343 0.008 MS 0000 54.0 0000 MS
KUWAIT PIPES
INDUSTRIES Industrial 0.000 0.396 0.002 MS 0000 54.0 0000 MS
KUWAIT CEMENT Industrial 0.000 0.159 0.026 MH 0000 0000 0000 MH
REFRIGERATION INDUSTRIES
Industrial 0.006 0.002 0.018 MH 0000 0000 0000 MH
GULF CABLE Industrial 0.011 0.107 0.025 MH 0000 0000 0000 MH
HEAVY ENGINEERIN. Industrial 0.001 0.113 0.030 MH 0000 0000 0000 MH
CONTRACTING &
MARINE SERVICES Industrial 0.004 0.310 0.160 MS 0000 54.0 0000 MS
PORTLAND CEMENT
COMPANY Industrial 0.001 0.029 0.118 MH 0000 0000 0000 MH
SHUAIBA
INDUSTRIAL Industrial 0.005 0.192 0.007 MH 0000 0000 0000 MH
METAL &
RECYCLING Industrial 0.000 0.056 0.016 MH 0000 0000 0000 MH
KUWAIT FOUNDRY Industrial 0.001 0.039 0.027 MH 0000 0000 0000 MH

204
ACICO INDUSTRIES Industrial 0.000 0.367 0.006 MS 0000 54.0 0000 MS
UNITED INDUSTRIES Industrial 0.004 0.301 0.226 MS 0000 54.0 0000 MS
BOUBYAN
PETROCHEMICALS Industrial 0.002 0.268 0.066 MH 0000 0000 0000 MH
GULF GLASS
MANUFACTURING Industrial 0.000 0.416 0.072 MS 0000 0000 0000 MH
HILAL CEMENT Industrial 0.000 0.408 0.062 MS 0000 0000 0000 MH
ALKOUT
INDUSTRIAL Industrial 0.000 0.191 0.058 MH 0000 0000 0000 MH
KUWAIT PACKING
MATERIALS Industrial 0.000 0.036 0.211 MH 0000 0000 0000 MH
KUWAIT BUILDING
MATERIALS Industrial 0.013 0.000 0.025 MH 0000 0000 0000 MH
NATIONAL
INDUSTRIES Industrial 0.000 0.000 0.016 MH 0000 0000 0000 MH
EQUIPMENT Industrial 0.001 0.011 0.107 MH 0000 0000 0000 MH
MENA HOLDING Industrial 0.000 0.076 0.015 MH 0000 0000 0000 MH
AGILITY PUBLIC WAREHOUSING
Services 0.000 0.241 0.193 MH 0000 0000 0000 MH
KUWAIT COMMERCIAL
Services 0.000 0.384 0.017 MS 0000 54.. 0000 MS
MOBILE TEL. Services 0.015 0.214 0.143 MH 0000 0000 0000 MH
AL SAFAT ENERGY Services 0.002 0.141 0.024 MH 0000 0000 0000 MH
INDEPENDENT
PETROLEUM GROUP Services 0.000 0.289 0.098 MH 0000 54.0 0000 MS
NATIONAL
CLEANING Services 0.000 0.176 0.085 MH 0000 0000 0000 MH
SULTAN CENTER Services 0.000 0.192 0.023 MH 0000 0000 0000 MH
AL-ARABI GROUP Services 0.019 0.474 0.024 MS 0000 54.. 0000 MS
CITY GROUP Services 0.000 0.049 0.059 MH 0000 0000 0000 MH
NATIONAL MOBILE
TEL. Services 0.007 0.272 0.063 MH 0000 0000 0000 MH
KUWAIT & GULF
LINK TRANSPORT Services 0.000 0.344 0.034 MS 0000 54.0 0000 MS
AUTOMATED
SYSTEMS Services 0.007 0.000 0.408 MS 0000 0000 0000 MH
NATIONAL
PETROLEUM Services 0.000 0.114 0.072 MH 0000 0000 0000 MH
KUWAIT CO. FOR
PROCESS PLANT Services 0.002 0.254 0.148 MH 0000 54.0 0000 MS
KUWAIT SLAUGHTER
HOUSE Services 0.000 0.000 0.169 MH 0000 0000 0000 MH
HITS TELECOM Services 0.000 0.000 0.000 MH 0000 0000 0000 MH

205
HUMAN SOFT Services 0.000 0.067 0.132 MH 0000 0000 0000 MH
PRIVATIZATION Services 0.031 0.000 0.010 MH 0000 0000 0000 MH
NAFAIS HOLDING Services 0.000 0.000 0.109 MH 0000 0000 0000 MH
NATIONAL
SLAUGHTER HOUSE Services 0.024 0.000 0.143 MH 0000 0000 0000 MH
SAFWAN TRADING Services 0.003 0.000 0.072 MH 0000 0000 0000 MH
GULF FRANCHISING Services 0.007 0.015 0.028 MH 0000 0000 0000 MH
NATIONAL RANGES Services 0.000 0.000 0.196 MH 0000 0000 0000 MH
BURGAN CO. Services 0.000 0.346 0.001 MS 0000 0000 0000 MH
LIVESTOCK
TRANSPORT Food 0.009 0.000 0.187 MH 0000 0000 0000 MH
DANAH ALSAFAT
FOODSTUFF Food 0.001 0.278 0.191 MH 0000 0000 0000 MH
KUWAIT UNITED
POULTRY Food 0.000 0.000 0.003 MH 0000 0000 0000 MH
KUWAIT FOOD
(AMERICANA) Food 0.000 0.110 0.100 MH 0000 0000 0000 MH
UNITED FOODSTUFF Food 0.000 0.109 0.084 MH 0000 0000 0000 MH
Note: Table 6.1 reports the results from the application of financial screening in 5 sectors (real estate, industrial, services, and food) as at 31/12/2005 using the two AAOIFI
screening standards (2004) and (2006), where AAOIFI‘s criteria (2004) use total assets as denominator in its criteria (2) and (3) and AAOIFI‘s (2006) criteria use market
capitalization in criteria (2) and (3).Values in Bold indicate the criteria failed (MS). Total number of MH= 48 and MS=19 under AAOIFI (2004) criteria, and total number of
MH=50 and MS= 17 under AAOIFI (2006) criteria.

206
An analysis of Table 6.1 reveals that the most common reason why firms in the ―mixed
companies‖ group fail to comply with the second screening level is that their ratio of interest
bearing liabilities to either total assets or market capitalization is greater than 30% and not
based on the other two criteria. This is consistent with Abdul Rahman et al. (2010) and many
of the interviewed fund managers and index providers‘ feedback in Chapter 5. Since stocks of
mixed companies do not comply fully with Shariah law by their articles of association and do
not have an SSB, there is nothing to prevent them from financing their activities through
interest-based debt as they seek the cheapest way of raising funds as indicated by some
interviewees. Nonetheless, a sizeable number of mixed companies satisfied this screening
threshold voluntarily by not exceeding the 30% limit during most of the sample period.
Furthermore, some of them reported Halal debts such as Murabahah in their financial
statements. A number of the interviewees in Chapter 5 explained why some mixed companies
might satisfy two of the three screening criteria; they suggested that such companies might
want to be targeted by Islamic funds and Halal-seeking investors. In general, however,
relatively high levels of interest-based leverage was the main reason why many mixed
companies were filtered out from the Halal stocks universe and instead included in the MS
group. Since Kuwait is a Muslim majority country, many sin activities such as alcohol, pork,
gambling and pornography are forbidden by law. Thus mixed companies are not expected to
have high proportion of sin revenues or investments. An inspection of the Criteria (1) column
in Table 6.1 would confirm this prior expectation.
Table 6.1 indicates that different financial screening criteria produce different results when
classifying stocks in MH or MS portfolios. Indeed, the switch to using market capitalization as
the denominator in the ratio for the second and third criteria reduces the number of MS stocks
from 19 to 17. However, this aggregate analysis marks a number of changes which occurred

207
when the AAOIFI (2006) screening criteria were employed. In five instances, the market
capitalization data were smaller than the total asset figures such that the move from AAOIFI
(2004) to AAOIFI (2006) criteria caused the limit in either the second or third criteria to be
breached (Tamdeen Real Estate, Ajial, Al-Massaleh, Independent Petroleum Group, Kuwait
Co. for Process Plant and construction).145
In another five cases, the opposite occurs; the
change in the denominator measure means that criteria which had previously been violated are
now satisfied; in the case of: Arab Real Estate, Gulf Glass Manufacturing, Hilala Cement,
Automated Systems and Burgan Co. for Well Drilling. The market capitalizations were much
higher than the total asset figures such that ratios declined when the former values were
employed. Table 6.2 summarizes the impact of using the different financial screens on the
stocks of mixed companies during the overall sample period.
Table 6.2: An Analysis of Mixed Halal (MH) and Mixed Sin (MS) Stocks by Year
Based on AAOIFI 2004 screens Total Based on AAOIFI 2006 screens No. of extra MH
under 2006
screens MH MS MH MS
End of 2005 48 19 67 50 17 2
End of 2006 44 30 74 47 27 3
End of 2007 46 35 81 51 30 5
End of 2008 50 37 87 37 50 -13
End of 2009 52 36 88 38 50 -14
End of 2010 67 27 94 57 37 -10
Total 307 184 491 280 211 -27
Note: This table shows the financial screening impact of using the AAOIFI‘s (2004) and (2006) financial
screening criteria on the mixed. The total column is the total number of MH and MS but excludes PH and Sin
stocks. MH=mixed Halal, MS= mixed sin. The last column subtracts the number of MH stocks based on
AAOIFI‘s (2006) criteria from the number of MH stocks based on AAOIFI‘s (2004) criteria for each year, last
row totals all columns.
A visual inspection of Table 6.2 shows that the findings in Table 6.1 for 2005 are only
generalizable across half of the year. For example, AAOIFI‘s (2004) financial screening
criteria which use total assets as a denominator in the criteria ratios produce a more stable MH
145
For instance, Tamdeen, a real estate company, complied with AAIOIF’s (2004) screens, but failed to do so with AAIOIFI’s (2006) screens because its Interest bearing liabilities/Market capitalization was 51.3% which exceeded the limit set of 30%; thus, this firm was classified as an MS company based on AAOIFI's 2006 screens but as an MH stock under AAOIFI's 2004 screens.

208
asset classification compared with their counterpart (2006) based on market capitalization. This
is especially true during the GFC periods of 2008 and 2009 where the market capitalization of
all listed companies dropped severely leading to higher interest-bearing debt to market
capitalization ratios and interest bearing investment and cash to market capitalization ratios;
the crisis results in a sizeable number of MH equities being re-categorised as MS stocks. Table
6.2 shows that the number of MH stocks drops from 51 in 2007 to 37 in 2008 when the
financial screening ratios employ market capitalization rather than total assets as the
denominator value; in fact, the number of MH stocks actually rises from 46 in 2007 to 50 in
2008 when total asset data are used. Hence, Islamic fund managers who used market
capitalization values when screening for mixed stocks were penalized by having 13 (14) fewer
shares to invest during 2008/2009 relative to those who screened on the basis of total assets
instead, and 14 stocks in 2009. This finding contradicts AAOIFI‘s intention that the change in
its standards would expand the MH asset universe for Islamic fund managers as noted by some
of the interviewees in chapter 5. Obviously, such collapse in equity values, that resulted in a
reduction in the MH asset universe, was probably unanticipated by AAOIFI when the standard
was updated in 2006. In fact, the last column of Table 6.2 indicates that before the financial
crisis period (2005-2007) AAOIFI‘s (2006) screening criteria produced additional MH stocks
but from 2008 onwards, this situation changed. The results from Table 6.2 are consistent to
some extent with the findings of Derigs and Marzban (2008) who noted that screening
guidelines that use market capitalization over total assets offer greater freedom to Islamic fund
managers, as their sample period (2003-2007) did not cover the GFC. Although the numbers of
stocks dropped from the available investment universe post 2007 because of the new AAOIFI
standards is less than 10% of the total, losing even one company from the available set of MH
stocks could have significant implications for Islamic fund managers if the omitted stock

209
relates to a leading company which has significant weight in the market index (such as Zain,
Agility, or National mobile telecommunication). Table 6.3 highlights the final screening results
of the Shariah classification of mixed companies as either MH or MS based on their
compliance with AAOIFI‘s (2006) financial screening criteria over the six year sample
period.146
The companies in Table 6.3 are ranked according to their market value from large to
small and their percentages of the capitalization of all listed stocks as well as their percentage
out of the total mixed stocks are provided. This is because not only the number of Halal
investee companies that maters Islamic funds but also their market value.
Table 6.3: The Final Screening Results for Mixed Companies over the 2005-2010 Period,
Based on AAOIFI (2006) Screens, Ranked According to their Market Value in Million
(K.D)
Company Code Sector MV % of
Total
% of
Mixed
Compliant With AAOIFI 2006 Screening Criteria
2005 2006 2007 2008 2009 2010
ZAIN Services 5377 16.24 33.83 MH MH MH MH MS MH
AGLTY Services 1014 3.06 6.38 MH MH MH MH MS MH
NMTC Services 999 3.02 6.28 MH MH MH MH MH MH
NIND Industrial 949 2.87 5.97 MS MS MS MS MS MS
FOOD Food 624 1.89 3.93 MH MH MH MH MH MH
KCEM Industrial 465 1.41 2.93 MH MH MH MH MH MH
CABLE Industrial 381 1.15 2.39 MH MS MH MS MS MH
MABANEE Real Estate 368 1.11 2.32 MH MH MH MS MH MH
BPCC Industrial 334 1.01 2.10 MH MH MH MS MS MS
NRE Real Estate 281 0.85 1.77 MH MH MS MS MS MS
ALQURAIN Industrial 278 0.84 1.75 MS MS MH MH
ALNAWADI Services 225 0.68 1.41 MS
SULTAN Services 189 0.57 1.19 MH MS MS MS MS MS
SRE Real Estate 145 0.44 0.91 MS MS MS MS MS MS
MAZAYA Real Estate 139 0.42 0.87 MH MH MH MS MS MS
NICBM Industrial 134 0.41 0.85 MH MH MH MH MH MH
TAM Real Estate 129 0.39 0.81 MS MS MS MS MS MH
IKARUS Industrial 121 0.37 0.76 MS MS MS
THEMAR Real Estate 118 0.36 0.74 MH MS MS MS MS MS
CGC Services 117 0.35 0.74 MH MH MS MS MH
KRE Real Estate 115 0.35 0.72 MH MH MH MS MS MH
146
Appendix 6.1 shows the final screening results of the Shariah classification of mixed companies to MH and MS based on their compliance with AAOIFI’s (2004) financial screens over the six year sample period (Similar to Table 6.3).

210
ABAR Services 114 0.35 0.72 MH MH MH MH MH MS
OULAFUEL Services 114 0.34 0.72 MH MH MH MH MH
KFOUC Industrial 111 0.34 0.70 MH MH MH MH MH MH
URC Real Estate 104 0.31 0.65 MS MS MS MS MS MS
FIRSTDUBAI Real Estate 98 0.30 0.62 MH MH MS MS
KGL Services 98 0.30 0.62 MS MS MS MS MS MS
SOOR Services 93 0.28 0.59 MH MH MH
ACICO Industrial 89 0.27 0.56 MS MS MS MS MS MS
CITYGROUP Services 88 0.27 0.55 MH MH MS MS MH MH
PCEM Industrial 87 0.26 0.55 MH MH MH MH MS MH
MENA* Industrial 87 0.26 0.55 MH MH PH PH PH PH
KPPC Services 81 0.24 0.51 MH MS MS MS MS MS
MARIN Industrial 74 0.22 0.46 MS MH MS MS MS MS
PIPE Industrial 73 0.22 0.46 MS MS MS MS MS MS
INJAZZAT Real Estate 72 0.22 0.46 MH MS MS MS MS MS
CATTL Food 71 0.22 0.45 MH MH MH MS MS MH
NAFAIS Services 70 0.21 0.44 MH MH MH MH MH MH
REMAL Real Estate 69 0.21 0.44 MS
ARGAN Real Estate 69 0.21 0.44 MH MH MH MS
ATC Services 67 0.20 0.42 MH MH MS MH
IPG Services 65 0.20 0.41 MS MS MS MS MS MH
LOGISTICS Services 65 0.20 0.41 MS MH
MAYADEEN Services 64 0.19 0.40 MH MS MS MS MS MS
SHIP Industrial 63 0.19 0.40 MH MH MH MS MS MH
SHOP Services 56 0.17 0.35 MS MH MS MS MS MS
JAZEERA Services 56 0.17 0.35 MH MS MS MS
UIC Industrial 56 0.17 0.35 MS MS MS MS MS MS
HITSTELEC Services 53 0.16 0.33 MH MH MH MH MH MH
DANAH Food 49 0.15 0.31 MH MH MH MH MH MH
ARABREC Real Estate 48 0.15 0.30 MH MS MS MS MS MS
AREEC Real Estate 46 0.14 0.29 MS MS MS MS MS MS
ALKOUT Industrial 44 0.13 0.28 MH MH MH MS MH MH
KNA Services 44 0.13 0.27 MH MH MS
SENERGY Services 43 0.13 0.27 MH MH MH MH MH MH
YIACO Services 40 0.12 0.25 MH MS MS MH
KOUTFOOD Food 37 0.11 0.23 MH MS MS MH
KBT Real Estate 36 0.11 0.23 MS MS MS
BIIHC Industrial 32 0.10 0.20 MH
MTCC Services 31 0.09 0.20 MS MS MS MS MS
JEERANH Services 31 0.09 0.20 MH MH MS MS MS
UREC Real Estate 31 0.09 0.20 MH MH MH MH MH MH
MASSALEH Real Estate 31 0.09 0.19 MS MS MS MS MS MS
SAFTEC Services 30 0.09 0.19 MS MS MS MS MS
REFRI Industrial 30 0.09 0.19 MH MH MH MH MH MH

211
UPAC Services 29 0.09 0.18 MS MH MH MS MH
MRC Industrial 29 0.09 0.18 MH MH MH MS MS MS
HUMANSOFT Services 27 0.08 0.17 MH MH MH MH MH MH
FUTURE Services 27 0.08 0.17 MH MH MH MH
AQAR Real Estate 26 0.08 0.17 MS MS MS MS MS MH
AGHC Services 26 0.08 0.16 MS MS MS MS MS MS
GGMC Industrial 25 0.07 0.16 MH MH MH MS MH MH
KPAK Industrial 25 0.07 0.15 MH MH MH MH MH MH
TAAMEER Real Estate 24 0.07 0.15 MS MS MH MS MS MS
ALMUDON Real Estate 24 0.07 0.15 MH MH
EQUIPMENT Industrial 23 0.07 0.14 MH MH MH MH MH MH
HCC Industrial 22 0.07 0.14 MH MH MH MH MH MH
CLEANING Services 22 0.07 0.14 MH MH MH MH MH MH
ALRAI Services 22 0.06 0.14 MS
SANAM Real Estate 19 0.06 0.12 MH MS MS MH MH MH
NAPESCO Services 18 0.05 0.11 MH MH MH MH MH MH
SAFWAN* Services 18 0.05 0.11 MH MH PH PH PH PH
HAYATCOMM Services 17 0.05 0.11 MH MS MH MH
POULT Food 16 0.05 0.10 MH MH MH MS MS MH
GFC Services 16 0.05 0.10 MH MH MH MH MH MH
KCPC Services 16 0.05 0.10 MS MS MS MS MS MH
ASC Services 16 0.05 0.10 MH MH MH MS MS MS
MARAKEZ Real Estate 14 0.04 0.09 MH
PAPER Industrial 13 0.04 0.08 MH MS MH MH MH MH
FUTUREKID Services 13 0.04 0.08 MS MH MH
UFIG Food 13 0.04 0.08 MH MH MH MH MH MH
KSH Services 10 0.03 0.07 MH MH MH MH MH MH
PAPCO Services 10 0.03 0.06 MH MH MH MH MH
GYPSUM Industrial 8 0.03 0.05 MH MS MH MH MH
KBMMC Industrial 8 0.02 0.05 MH MH MH MH MH MH
NSH Services 6 0.02 0.04 MH MH MS MS MS MH
Note: This table shows the final results of financial screening results of all mixed companies based on their
compliance with AAOIFI‘s (2006) criteria across all the sample period, ordered according to their average market
value (MV) as of the average of all 6 years, from large to small, MV in millions K.D. The tables also illustrate the
corresponding sector, percent out of the total market value of all stocks, percent out of the market value of mixed
stocks including mixed Halal (MH) and mixed sin (MS). Empty cells indicate that the company was not listed then.
*Indicates the two companies that converted from mixed stocks to pure Halal (PH) stocks during the sample period
in 2007.
In addition to the impact of the financial screening criteria, the screening analysis in Table 6.3
reveals that different mixed companies appear to change their Shariah classification from MH
to MS investments or vice versa due to a number of events that affected the Shariah status of
the companies. These events are as reported by Derigs and Marzban (2008) are: (i) changes in

212
the business activities of the companies through mergers or acquisitions; (ii) adding a new line
of business or divesting the company of sin activity segments; (iii) becoming more leveraged
through the issue of interest bearing debt; or (iv) earning more interest income or other sin
income from non-operating sources. Such events can have an impact on the Shariah-
compliance status of a company, forcing Islamic fund managers to change the composition of
their portfolios. For instance, Islamic fund managers may have to liquidate investments that are
re-categorized as MS stocks, even if such a sale gives rise to a financial loss. For example, if
fund managers had both Zain and Agility in their portfolios, these stocks had to be sold in 2009
as they no longer complied with AAOIFI‘s (2006) criteria; this might have had a severe impact
on the portfolio as they account for 16.24% and 3.06% of the total sample of stocks
respectively or 33.83% and 6.38% of the total pool of mixed companies respectively. In
contrast, MS stocks may become MH or PH and fall within the investment universe of Islamic
fund managers; for example, Qurain Petrochemical Industries was an MS stock when it was
listed in 2007 but was re-categorized as an MH security in 2009 and 2010. Fortunately, the 5
largest mixed stock companies in the market, which account for 26% of all sample stocks and
53% of mixed companies, were complied with AAOIFI‘s (2006) criteria over the whole time
period, apart from year 2009. This will have minimized any transaction costs associated with
portfolio re-balancing over the period. Nevertheless, the costs for Islamic fund managers will
be higher than for their non-Islamic counterparts. This is because they are required to screen
and monitor their asset universe and hence, re-balance their portfolios periodically since they
are not allowed to keep non-compliant stocks147
(as revealed from Chapter 5).
Because the Shariah-compliant equity investment process is dynamic in nature, screening has
to be undertaken frequently because new financial information becomes available and
147
Islamic funds should sell stocks that turn to be non-compliant with their screens (MS) if it breaks even, but they can keep it for certain time period if it market price is less that its cost, as reported by interviewees in Chapter5.

213
corporate activities change over time. The interviewed Islamic fund managers and SSB
members in Chapter 5 indicated that, in practice, Islamic funds usually screen their investments
on a quarterly or semiannual basis; only a few of them screen annually, and rebalance their
funds accordingly. Dynamic screening process impacts the Shariah-compliance status of many
mixed stocks (see Table 6.3). Since dynamic screening is not an easy process, many Islamic
funds in the GCC outsource this task to specialized institutions that charge fees for such a
service.148
For the purpose of this study, however, the screening process is conducted annually
and the Shariah-compliance status of each stock is updated at the end of the financial year
using the published financial statement, as demonstrated in Table in 6.3. Portfolios are revised
and rebalanced at each year‘s end according to whether or not they satisfy both the activity and
financial screens. Table 6.4 monitors the movements of mixed stocks from one Shariah class to
the other (i.e., from MH to MS or vice versa), using both AAOIFI‘s (2004) and AAOIFI‘s
(2006) financial standards to see the impact of those on Islamic funds.
148
Such as: Shariah consulting companies or index and screening providers. A well-known example of this is: Ideal Ratings institution, that carryout the Shariah screening, purification, fund and index management services identify and manage Shariah compliant equities, funds and Sukuk in 12 countries (see: http://www.idealratings.com/)

214
Table 6.4 Changes in Mixed Stocks’ Shariah Classification over the Sample Period
Panel A: Based on AAOIFI (2004) Financial Screens
Sector Screening based on AAOIFI 2004 Financial screening criteria
2006 vs. 2005 2007 vs. 2006 2008 vs. 2007 2009 vs. 2008 2010 vs. 2009 Total
MH MS MH MS MH MS MH MS MH MS MH MS
Real Estate 2 4 1 4 1 1 0 2 4 0 8 11
Industrial 1 2 2 1 3 6 5 2 3 0 14 11
Services 2 6 2 5 5 1 3 3 6 1 18 16
Food 0 0 0 1 1 2 1 0 1 1 3 4
Total 5 12 5 11 10 10 9 7 14 2 43 42
Panel B: Based on AAOIFI (2006) Financial Screens
Sector Screening based on AAOIFI 2006 Financial screening criteria
2006 vs. 2005 2007 vs. 2006 2008 vs. 2007 2009 vs. 2008 2010 vs. 2009 Total
MH MS MH MS MH MS MH MS MH MS MH MS
Real Estate 0 4 1 1 1 4 1 1 3 1 6 11
Industrial 1 2 2 2 1 6 3 1 3 0 10 11
Services 1 3 1 3 0 6 2 4 10 2 14 18
Food 0 0 0 0 0 3 0 0 3 0 3 3
Total 2 9 4 6 2 19 6 6 19 3 33 43
Note: this Table summarizes the Shariah classification change of mixed stocks from MH to MS and vice versa
using AAOIFI‘s (2004) financial screens in panel A and AAOIFI‘s (2006) financial screens in panel B. Each
year is compared with the previous one. The last two columns provide the total results of the MH and MS for
each sector. The Table controls for new listed companies, as only if an existing stocks change status from being
Shariah-compliant based such criteria it is reported in MH column, while if it becomes not compliant with such
criteria it is reported in the MS column, indicating that it is ejected from the MH stocks universe and is not a
possible investment anymore in that particular period.
Table 6.4 highlights that stocks that were classified as MH based on AAOIFI‘s (2004) criteria
were less affected by the GFC and remained relatively more stable in their categorizations;
they did not convert to the MS group compared to stocks that were classified as MH based on
changed 2006 criteria. Although the stocks of 19 companies‘ grouping changed from MH to
MS stocks in 2008 with AAOIFI‘s (2006) criteria, many of them were re-categorized as MH
stocks again after the crisis in 2009-2010. A visual inspection of Table 6.4 reveals that the food
sector was the most stable using both financial screening standards, as few companies changed
from MH to MS stcoks and vice versa while the service sector was the most volatile in terms of

215
changing Shariah status.149
Overall, Table 6.4 suggests that AAOIFI (2006) provide, to some
extent, a less volatile asset universe compared to AAOIFI‘s (2004) criteria. Islamic fund
managers have to consider this in mind, as volatility could adversely affect their decision
making, since it may require them to liquidate their investments and change position which
could increase transaction costs and reduce their divarication.
In this study, changes in sector (qualitative) screening do not usually affect the Shariah status
of companies, causing them to move from being Halal to non-Halal (Sin), apart from the
stocks of two conventional banks: Kuwait International Bank and Ahli United Bank. They
changed from Sin (based on activity) to PH stocks in July 2007 and April 2010 respectively, as
they became ―Islamic‖ banks. One reason for this change may have been that IFIs were
profitable entities in Kuwait before the financial crisis period, attracting many institutions to
enter the sector, according to several of those interviewed in Chapter 5. In addition, the two
banks in this study that changed from sin to PH were suffering financial distress at the time
when they converted; thus they may have viewed this as a profitable opportunity to restructure
their entire business model and enter a new market which they had not competed in before. In
addition to the banks, another two companies switched permanently from MH to PH stocks:
Mena Holding, which is listed in the Industrial sector; and Safwan trading & contracting,
which is listed in the Service sector.150
The results of the screening process using both
qualitative (sector compliance) and quantitative (financial compliance) Shariah screening
criteria during the whole sample period is reported in Table 6.5 panels A to F, year by year,
after removing the non-Kuwaiti sector and companies with missing data from the beginning of
the screened period.
149
The number of listed mixed companies in each sector varies over different years. For example, in 2010 there were 22 companies in real estate, 26, 42, and 6 in industrial, service, and food respectively. 150 However, the status of such companies is not updated until the end of each financial year when the next screening takes place.

216
Table 6.5, Panel A: Screening results as at the end of December 2005
Sector Sector compliance Financial Compliance
(1)Based on AAOIFI 2004 financial screens Total (2)Based on AAOIFI 2006 financial screens
PH Stocks Sin Stocks MH stocks MS Stocks MH stocks MS Stocks
No. % No. % No. % No. % No. % No. %
Banking 1 0.13 7 0.88 0 0.00 0 0.00 8 0 0.00 0 0.00
Investment 17 0.46 20 0.54 0 0.00 0 0.00 37 0 0.00 0 0.00
Insurance 2 0.29 5 0.71 0 0.00 0 0.00 7 0 0.00 0 0.00
Real Estate 7 0.29 1 0.04 9 0.38 7 0.29 24 9 0.38 7 0.29
Industrial 0 0.00 0 0.00 15 0.68 7 0.32 22 17 0.77 5 0.23
Services 4 0.13 4 0.13 19 0.59 5 0.16 32 19 0.59 5 0.16
Food 0 0.00 0 0.00 5 1.00 0 0.00 5 5 1.00 0 0.00
Total no. 31 0.23 37 0.27 48 0.36 19 0.14 135 50 0.37 17 0.13
Market Value 6928 0.20 14676 0.42 10721 0.31 2531 0.07 34856 10728 0.31 2524 0.07
Table 6.5, Panel B: Screening results at the end of December 2006
Sector Sector compliance Financial Compliance
(1)Based on AAOIFI 2004 financial screens Total (2)Based on AAOIFI 2006 financial screens
PH Stocks Sin Stocks MH stocks MS Stocks MH stocks MS Stocks
No. % No. % No. % No. % No. % No. %
Banking 2 0.22 7 0.78 0 0.00 0 0.00 9 0 0.00 0 0.00
Investment 18 0.44 23 0.56 0 0.00 0 0.00 41 0 0.00 0 0.00
Insurance 2 0.29 5 0.71 0 0.00 0 0.00 7 0 0.00 0 0.00
Real Estate 8 0.32 1 0.04 7 0.28 9 0.36 25 5 0.20 11 0.44
Industrial 1 0.04 0 0.00 14 0.58 9 0.38 24 17 0.71 6 0.25
Services 7 0.17 4 0.10 18 0.44 12 0.29 41 20 0.49 10 0.24
Food 0 0.00 0 0.00 5 1.00 0 0.00 5 5 1.00 0 0.00
Total 38 0.25 40 0.26 44 0.29 30 0.20 152 47 0.31 27 0.18
Market Value 9693 0.21 17376 0.38 14209 0.31 4851 0.11 46129 14703 0.32 4358 0.09

217
Table 6.5, Panel C: Screening results at the end of December 2007
Sector Sector compliance Financial Compliance
(1)Based on AAOIFI 2004 financial screens Total (2)Based on AAOIFI 2006 financial screens
PH Stocks Sin Stocks MH stocks MS Stocks MH stocks MS Stocks
No. % No. % No. % No. % No. % No. %
Banking 3 0.33 6 0.67 0 0.00 0 0.00 9 0 0.00 0 0.00
Investment 19 0.45 23 0.55 0 0.00 0 0.00 42 0 0.00 0 0.00
Insurance 2 0.29 5 0.71 0 0.00 0 0.00 7 0 0.00 0 0.00
Real Estate 10 0.34 1 0.03 7 0.24 11 0.38 29 7 0.24 11 0.38
Industrial 3 0.12 0 0.00 14 0.54 9 0.35 26 16 0.62 7 0.27
Services 11 0.22 4 0.08 20 0.41 14 0.29 49 22 0.45 12 0.24
Food 0 0.00 0 0.00 5 0.83 1 0.17 6 6 1.00 0 0.00
Total no. 48 0.29 39 0.23 46 0.27 35 0.21 168 51 0.30 30 0.18
Market Value 12031 0.24 18008 0.36 14599 0.29 4860 0.10 49498 14843 0.30 4618 0.09
Table 6.5, Panel D: Screening results at the end of December 2008
Sector Sector compliance Financial Compliance
(1)Based on AAOIFI 2004 financial screens Total (2)Based on AAOIFI 2006 financial screens
PH Stocks Sin Stocks MH stocks MS Stocks MH stocks MS Stocks
No. % No. % No. % No. % No. % No. %
Banking 3 0.33 6 0.67 0 0.00 0 0.00 9 0 0.00 0 0.00
Investment 19 0.45 23 0.55 0 0.00 0 0.00 42 0 0.00 0 0.00
Insurance 2 0.29 5 0.71 0 0.00 0 0.00 7 0 0.00 0 0.00
Real Estate 10 0.33 1 0.03 8 0.27 11 0.37 30 4 0.13 15 0.50
Industrial 3 0.11 0 0.00 12 0.44 12 0.44 27 11 0.41 13 0.48
Services 11 0.21 4 0.08 26 0.49 12 0.23 53 19 0.36 19 0.36
Food 0 0.00 0 0.00 4 0.67 2 0.33 6 3 0.50 3 0.50
Total 48 0.28 39 0.22 50 0.29 37 0.21 174 37 0.21 50 0.29
Market Value 6045 0.21 10230 0.36 8529 0.30 3624 0.13 28428 8373 0.29 3779 0.13

218
Table 6.5, Panel E: Screening results at the end of December 2009
Sector Sector compliance Financial Compliance
(1)Based on AAOIFI 2004 financial screens Total (2)Based on AAOIFI 2006 financial screens
PH Stocks Sin Stocks MH stocks MS Stocks MH stocks MS Stocks
No. % No. % No. % No. % No. % No. %
Banking 3 0.33 6 0.67 0 0.00 0 0.00 9 0 0.00 0 0.00
Investment 19 0.45 23 0.55 0 0.00 0 0.00 42 0 0.00 0 0.00
Insurance 2 0.29 5 0.71 0 0.00 0 0.00 7 0 0.00 0 0.00
Real Estate 11 0.35 1 0.03 7 0.23 12 0.39 31 4 0.13 15 0.48
Industrial 3 0.11 0 0.00 15 0.56 9 0.33 27 13 0.48 11 0.41
Services 11 0.20 4 0.07 27 0.50 12 0.22 54 18 0.33 21 0.39
Food 0 0.00 0 0.00 5 0.83 1 0.17 6 3 0.50 3 0.50
Total no. 49 0.28 39 0.22 54 0.31 34 0.19 176 38 0.22 50 0.28
Market Value 5871 0.20 10892 0.36 4266 0.14 8876 0.30 29905 3710 0.12 9482 0.32
Table 6.5, Panel F: Screening results at the end of December 2010
Sector Sector compliance Financial Compliance
(1)Based on AAOIFI 2004 financial screens Total (2)Based on AAOIFI 2006 financial screens
PH Stocks Sin Stocks MH stocks MS Stocks MH stocks MS Stocks
No. % No. % No. % No. % No. % No. %
Banking 4 0.44 5 0.56 0 0.00 0 0.00 9 0 0.00 0 0.00
Investment 19 0.45 23 0.55 0 0.00 0 0.00 42 0 0.00 0 0.00
Insurance 2 0.29 5 0.71 0 0.00 0 0.00 7 0 0.00 0 0.00
Real Estate 13 0.36 1 0.03 9 0.25 13 0.36 36 8 0.22 14 0.39
Industrial 3 0.11 0 0.00 19 0.68 6 0.21 28 17 0.61 8 0.29
Services 11 0.20 4 0.07 34 0.61 7 0.13 56 26 0.46 15 0.27
Food 0 0.00 0 0.00 5 0.83 1 0.17 6 6 1.00 0 0.00
Total 52 0.28 38 0.21 67 0.36 27 0.15 184 57 0.31 37 0.20
Market Value 6594 0.22 10826 0.37 9607 0.33 2470 0.08 29498 9962 0.34 2116 0.07
Note: This table reports the results of the screening process using both qualitative (sector) and quantitative (financial) Shariah screening criteria during the whole
sample period. Each panel represents the screening results at that year. All sample stocks are classified according to their compliance with the sector and financial

219
screening, reported across seven sectors. Pure Halal stocks (PH) are those that are compliant with sector or activity criteria, while Sin stocks are not compliant
with such criteria. Mixed Halal (MH) are stocks that are compliant with the financial screening criteria and Mixed Sin (MS) are not compliant with such criteria.
The financial compliance is divided into two parts based on AAOIFI 2004 and 2006 financial screening criteria. The (%) ratio column represents the percent of
the total listed stocks in that sector, so PH and Sin combined together with MH and MS based on AAOIFI 2004 financial criteria add up to 100% or PH and Sin
with MH and MS based on AAOIFI 2006 financial criteria also add up to 100%. The last two rows shows the number and ratio of total listed stocks and market
value in millions K.D for each column, so similarly PH and Sin combined together with MH and MS based on AAOIFI 2004 financial criteria add up to 100% or
PH and Sin with MH and MS based on AAOIFI 2006 financial criteria also add up to 100%.

220
Table 6.5 summarizes the overall results of the screening analysis using both qualitative (sector
compliance) and quantitative (financial compliance) Shariah screening criteria for each of the
years in the sample period. It also demonstrates the impact of using different financial
screening guidelines on the definition of the MH based on AAOIFI‘s 2004 and 2006
guidelines. Table 6.5 shows that MH stocks only exist in the non-financial sectors such as real
estate, industrial, service and food. Companies that operate in the financial sectors such as:
banks, investment, and insurance firms have to be entirely pure Halal or sin as the core
operational business of such companies is financial intermediation or insurance, based either
on Shariah principles or conventional interest-based methods or Gharar151
; there is no in-
between situation involving a mixture of the two. Sin in this context is based on activity only;
as such stocks are screened out at the first screening level, not based on their failure to comply
with financial screening criteria. Hence, the vast majority of PH and sin stocks are
concentrated in the financial sector. Panel A of Table 6.5 shows, at the end of 2005, 65% of PH
and 86% of sin stocks are clustered in the financial sector. Most PH stocks are also found in the
financial sector; the main reason for this concentration is because the sector screening criteria
require companies to have both Shariah-compliant articles of association and an SSB; and
these two conditions mostly apply to companies that operate in the financial sector, where the
CBK ensures that compliance occurs. However, a number of interviewees in Chapter 5
highlighted other sectors such as the industrial, services, and food industries that are also
thought to contain Halal businesses; these interviewees saw no need for an SSB to monitor the
companies‘ activities, since most were assumed to be Halal. However, in the current analysis,
151
Gharar as described in the literature review chapter, as high ambiguity and excessive risk (Ayub, 2007).
Shariah scholars prohibit conventional insurance because they believe that it is exploitative and unjust. Since the insured pays premium to insurer for something with no guarantee of benefit from it, as he may or may not need to receive compensation from the insurance. In addition, the premiums paid to the insurance company are invested in interest based financial instruments and from those funds, compensation is provided to the insured in case of contingencies. The Shariah-compliant alternative is the Islamic insurance (Takaful) provided by Takaful companies that was explained in the literature review chapter.

221
they fail to comply with these criteria by not having an SSB and are not classified as PH stocks
in agreement with the majority of interviewees. Thus, such companies are rather classified as
MH if they comply with the financial screening criteria or MS if they fail to comply with such
criteria. This means that Islamic funds and investors, who invest only in PH stocks, may face a
restrictive asset allocation strategy and be unable to exploit any diversification potential over
those who invest in both PH and MH stocks, because of the limited range of securities
available for investment.
Panel A of Table 6.5 shows that of the eight listed banks at the end of 2005, only one is
categorized as a PH stock while the other seven are allocated to the sin stock grouping. In
addition, out of 37 investment companies 17 are deemed to be PH stocks and 20 Sin stocks.
However, the number of PH stocks is not constant; it increases over time. For instance, in
Panel F of Table 6.5, the number of banks in the PH group has increased to 4 out of 9 by the
end of 2010. In addition, out of the 42 listed investment companies in 2010, 19 are categorized
as PH, while 23 are labeled as Sin. However, despite this growth in the number of PH stocks,
they are still a minority; for example, in 2010, the 52 stocks which are deemed to be PH
represent only 22% of the total market value of all equities available. By contrast, the 38 sin
stocks in 2010 represent 37% of the capitalization of the total market. A similar pattern exists
for all the years; Sin stocks are fewer in number but greater in market value terms compared to
PH stocks; this is mainly due to the fact that the sin stock category includes the biggest banks,
whereas the PH group contains smaller companies; an exception to this generalization is
Kuwait Finance House (KFH), an Islamic bank that represents about 9% of the total market
capitalization of the KSE. Despite this exception, Sin stocks typically consist of larger
companies such as the Kuwait National Bank (NBK), a conventional commercial bank which
accounts for about 16% of the total value of the market. This finding is consistent with the

222
comments expressed by the interviewees. One conclusion to emerge from these results is that
the qualitative screening employed to classify stocks into PH or Sin categories may expose
Islamic funds that only invest in PH stocks and not in MH stocks, to liquidity risk; their
investments will be concentrated in small-capitalized equities. In addition, they will be
overweight in financial companies which could lower their diversification potential and
increase their risk. This conclusion is similar to the findings reported by studies of ethical
funds such as Luther and Matatko (1994), Sparkes (1995), Gregory et al. (1997), Wilson
(1997) and Scholtens (2005); these studies have documented that ethical funds have a higher
proportion of their wealth invested in the equities of smaller companies that their ―non-ethical‖
counterparts. They attribute this phenomenon to the fact that large-capitalized companies are
usually diversified firms with a wide range of business interests and a geographically diverse
set of activities carried on through their subsidiaries or associate companies which may be
involved in sin or non-ethical activities; thus, they tend to be excluded from Islamic funds and
ethical funds. Nevertheless, the exclusion of such stocks may deprive Islamic funds, which
invest only in PH stocks, from profitable investment opportunities because larger companies
often have stronger fundamentals and sustainable earnings streams; in addition, their
bankruptcy risk is typically lower (Hudson, 1987). This may affect the risk and return of PH
portfolios relative to their counterparts that invest in both PH and MH securities. The latter
typically selects investments from a wider range of fundamentally stronger, blue chip stocks.
The actual risk and return behaviour of PH, Sin, MH and MS portfolios are examined in
Chapter 7 and 8 later in this thesis. The following section presents the impact of portfolio
construction when the financial screening thresholds are halved.

223
6.5 Halving the Financial Screening Criteria
The previous section of this chapter applied financial screening criteria that were proposed in
Shariah Standard no.21 by AAOIFI (2004) and AAOIFI (2006); this standard is used by the
vast majority of Islamic funds in the GCC region, according to the interviewees in Chapter 5.
However, many of these interviewees highlighted that such financial screening criteria do not
have a strong grounding in Islamic law or a rigorous, Shariah-based rationale underpinning
them. Indeed, the first fatwa, which was followed by AAOIFI (2004) outlining the screening
criteria to control the sin element of the companies in which Islamic funds could invest was
seen as an exception fatwa during that period of time as very few PH securities existed. Many
interviewees, especially the Shariah scholars commented that investing in MH should not be
the main activity for Islamic funds; Islamic funds that invest mainly in MH stocks were
thought to be committing sin transactions with their investments. For this reason, many of the
scholars noted that this was an outdated fatwa and needed to be revisited based on independent
empirical and technical evidence. However, many interviewees, fund managers and
institutional investors in particular, were not sure whether it was the right time to disallow
investments in MH stocks or even reduce the financial screening thresholds, due to the impact
of the financial crisis on market capitalization values. Thus, the current section of the chapter
addresses this issue by screening mixed companies based on a halving of the thresholds for the
financial screening criteria proposed by AAOIFI (2004) and (2006) as described in Figure 6.1.
It investigates the impact on the investment universe of imposing ―tighter‖ criteria for
identifying stocks as MH rather than MS; as such, the analysis in this section of the chapter can
be seen as a form of sensitivity analysis which examines how sensitive the security
categorizations are to a reduction in the screening thresholds employed. The new criteria
examined in this section are as follows:

224
1. A ratio of interest revenue and un-Halal (sin) revenues to total revenues which is less
than 2.5%;
2. A ratio of interest bearing debt to total assets or market capitalization which is less than
15%; and
3. A ratio of interest bearing investments and cash to total assets or market capitalization
which is less than 15%
These screens are tested using total assets (AAOIFI, 2004) and market capitalization (AAOIFI,
2006) as the divisor in the first two criteria; both screening methods estimate criteria 1 in the
same way. In contrast with the analysis in Section 6.3, the thresholds in the current section are
halved from 5% to 2.5% for the first criteria and from 30% to 15% for the second and third
criteria.152
Table 6.6 summarizes the impact of using the new, lower thresholds of the different financial
screens on the stocks of mixed companies during the overall sample period.
152 The next two chapters measures the returns of the re-created portfolios based on the halved financial screening thresholds to examine whether there is a significant performance penalty incurred relative to portfolios screened on the basis of the original financial screening criteria. PH and sin stocks are unaffected by this halving of the thresholds for the financial screening criteria because, as illustrated in Figure 6.1, financial screening is the second level of screening applied to mixed companies.

225
Table 6.6: Mixed Halal (MH) and Mixed Sin (MS) Stocks by Year after and Before
Halving the Financial Screening Thresholds
Panel A: MH and MS Based on the Halved Financial Screens Thresholds
Based on AAOIFI 2004 screens
(Halved)
Total Based on AAOIFI 2006 screens
(Halved)
No. of extra
MH under
2006 screens MH MS MH MS
End of 2005 27 40 67 43 24 16
End of 2006 24 50 74 31 43 7
End of 2007 20 61 81 20 61 0
End of 2008 31 56 87 24 63 -7
End of 2009 18 70 88 17 71 -1
End of 2010 34 60 94 29 65 -5
Total 154 337 491 164 327 10
Panel B: MH and MS Based on the Original Financial Screens Thresholds
Based on AAOIFI
2004 screens
Total Based on AAOIFI
2006 screens
No. of extra
MH under
2006 screens MH MS MH MS
End of 2005 48 19 67 50 17 2
End of 2006 44 30 74 47 27 3
End of 2007 46 35 81 51 30 5
End of 2008 50 37 87 37 50 -13
End of 2009 52 36 88 38 50 -14
End of 2010 67 27 94 57 37 -10
Total 307 184 491 280 211 -27
Note: This table shows the financial screening impact of using the new halved thresholds of AAOIFI‘s 2004
and 2006 financial screening criteria on the mixed stocks during the overall sample period in panel A. Panel
B, is Table 6.2, inserted for the sake of comparison. The total stocks column represents mixed stocks (MH
and MS) but excludes PH and Sin stocks. The last column in panel A subtracts the number of MH stocks
based on halved AAOIFI‘s (2006) criteria from the number of MH stocks based on halved AAOIFI‘s (2004)
criteria for each year, while the last column in panel B subtracts the number of MH stocks based original
AAOIFI‘s (2006) criteria from the number of MH stocks based on original AAOIFI‘s (2004) criteria for
each year. The last row totals all columns.MH=mixed Halal, MS= mixed sin.
Table 6.6 indicates that Islamic funds would lose a substantial number of their Halal assets if
applying the halved financial screens thresholds, for example the total number of MH stocks
would have dropped sharply from 307 to only 154 under the AAOIFI‘s (2004) screens or
dropped from 280 to 164 under AAOIFI‘S (2006) screens. The impact varies over different
years; the worst year for Islamic funds would have been 2009 (after the GFC) under the
AAOIFI‘s (2004) screens and 2007 under AAOIFI‘s (2006) screens because they already lost
many of MH stocks after the crisis using the original screens.

226
Furthermore, Table 6.6 shows that for the lower thresholds, AAOIFI‘s (2006) criteria produced
10 MH stocks more in total compared to that of AAOIFI‘s (2004) as shown in the last column
of panel (A). This is the opposite result from panel (B) where AAOIFI‘s (2006) criteria
reduced MH stocks by 27 in total. The main reason for this difference is that the halved
thresholds for AAOIFI‘s (2006) criteria did very well in classifying MH stocks during 2005;
however, this superior classificatory ability did not persist, as the difference started to dissipate
almost immediately such that by 2007 the findings for the halved thresholds for AAOIFI‘s
2006 criteria were the same as the results with the original thresholds. The results of Table 6.6
confirm that the GFC had a sizeable impact on the AAOIFI‘s (2006) screenings for Islamic
fund managers; whether the original criteria examined in the previous section or the halved
criteria in the current section. The massive drop in market capitalization values after the GFC
makes AAOIFI‘s (2004) criteria a better option for screening mixed stocks. The findings also
highlight that the GFC caused a dramatic decline not only in companies‘ market capitalization
values but also in their total asset figures, suggesting that some companies responded to the
crisis by selling off assets or writing down values on the statement of the financial position
(balance sheet) as noted by some interviewees. This write-down option may have been
facilitated by the adoption of IFRS and more specifically, by the introduction of IFRS 7 in
2008 as highlighted by some interviewees.153
Table 6.7 reports the results of the financial screening analysis for every individual mixed
stock company based on their market value and their compliance with the new, halved
thresholds applied to AAOIFI‘s (2006) criteria over the six year period studied. This table is
similar to Table 6.3 except that the thresholds for the financial screening criteria are half of
what they were in Section 6.3.
153 Some interviewees indicated that the book value of many companies’ assets were overvalued compared to the market value especially after the GFC and writing down their values was important.

227
Table 6.7: The Final Screening Results for Mixed Companies over the 2005-2010 Period,
Based on the Halved AAOIFI (2006) Screens Thresholds, Ranked According to their
Market Value in Million (K.D)
Company Code Sector MV % of
Total
% of
Mixed
Mixed Stocks Based on AAOIFI 2006 Screening Criteria
(Halved)
2005 2006 2007 2008 2009 2010
ZAIN Services 5377 16.24 33.83 MH MH MH MH MS MH
AGLTY Services 1014 3.06 6.38 MH MS MH MH MS MS
NMTC Services 999 3.02 6.28 MS MS MS MH MS MH
NIND Industrial 949 2.87 5.97 MS MS MS MS MS MS
FOOD Food 624 1.89 3.93 MH MS MH MH MS MH
KCEM Industrial 465 1.41 2.93 MH MH MH MS MS MS
CABLE Industrial 381 1.15 2.39 MH MS MH MS MS MS
MABANEE Real Estate 368 1.11 2.32 MH MS MS MS MS MS
BPCC Industrial 334 1.01 2.10 MS MS MS MS MS MS
NRE Real Estate 281 0.85 1.77 MH MS MS MS MS MS
ALQURAIN Industrial 278 0.84 1.75 MS MS MH MS
ALNAWADI Services 225 0.68 1.41 MS
SULTAN Services 189 0.57 1.19 MH MS MS MS MS MS
SRE Real Estate 145 0.44 0.91 MS MS MS MS MS MS
MAZAYA Real Estate 139 0.42 0.87 MH MH MS MS MS MS
NICBM Industrial 134 0.41 0.85 MH MH MH MH MH MH
TAM Real Estate 129 0.39 0.81 MS MS MS MS MS MS
IKARUS Industrial 121 0.37 0.76 MS MS MS
THEMAR Real Estate 118 0.36 0.74 MH MS MS MS MS MS
CGC Services 117 0.35 0.74 MH MS MS MS MH
KRE Real Estate 115 0.35 0.72 MH MS MS MS MS MH
ABAR Services 114 0.35 0.72 MH MH MH MH MS MS
OULAFUEL Services 114 0.34 0.72 MH MS MH MH MH
KFOUC Industrial 111 0.34 0.70 MH MH MH MH MH MH
URC Real Estate 104 0.31 0.65 MS MS MS MS MS MS
FIRSTDUBAI Real Estate 98 0.30 0.62 MS MH MS MS
KGL Services 98 0.30 0.62 MS MS MS MS MS MS
SOOR Services 93 0.28 0.59 MH MH MH
ACICO Industrial 89 0.27 0.56 MS MS MS MS MS MS
CITYGROUP Services 88 0.27 0.55 MH MH MS MS MS MS
PCEM Industrial 87 0.26 0.55 MH MH MS MS MS MH
MENAHOLD Industrial 87 0.26 0.55 MH MH PH PH PH PH
KPPC Services 81 0.24 0.51 MS MS MS MS MS MS
MARIN Industrial 74 0.22 0.46 MS MS MS MS MS MS
PIPE Industrial 73 0.22 0.46 MS MS MS MS MS MS
INJAZZAT Real Estate 72 0.22 0.46 MS MS MS MS MS MS
CATTL Food 71 0.22 0.45 MH MH MS MS MS MS
NAFAIS Services 70 0.21 0.44 MH MH MS MH MH MH
REMAL Real Estate 69 0.21 0.44 MS

228
ARGAN Real Estate 69 0.21 0.44 MS MS MH MS
ATC Services 67 0.20 0.42 MS MS MS MH
IPG Services 65 0.20 0.41 MS MS MS MS MS MS
LOGISTICS Services 65 0.20 0.41 MS MS
MAYADEEN Services 64 0.19 0.40 MH MS MS MS MS MS
SHIP Industrial 63 0.19 0.40 MH MS MS MS MS MS
SHOP Services 56 0.17 0.35 MS MS MS MS MS MS
JAZEERA Services 56 0.17 0.35 MH MS MS MS
UIC Industrial 56 0.17 0.35 MS MS MS MS MS MS
HITSTELEC Services 53 0.16 0.33 MH MH MS MH MH MH
DANAH Food 49 0.15 0.31 MH MS MS MH MS MH
ARABREC Real Estate 48 0.15 0.30 MS MS MS MS MS MS
AREEC Real Estate 46 0.14 0.29 MS MS MS MS MS MS
ALKOUT Industrial 44 0.13 0.28 MH MH MH MS MS MS
KNA Services 44 0.13 0.27 MS MS MS
SENERGY Services 43 0.13 0.27 MH MH MH MH MH MH
YIACO Services 40 0.12 0.25 MH MS MS MH
KOUTFOOD Food 37 0.11 0.23 MH MS MS MH
KBT Real Estate 36 0.11 0.23 MS MS MS
BIIHC Industrial 32 0.10 0.20 MH
MTCC Services 31 0.09 0.20 MS MS MS MS MS
JEERANH Services 31 0.09 0.20 MH MH MS MS MS
UREC Real Estate 31 0.09 0.20 MH MH MS MH MH MH
MASSALEH Real Estate 31 0.09 0.19 MS MS MS MS MS MS
SAFTEC Services 30 0.09 0.19 MS MS MS MS MS
REFRI Industrial 30 0.09 0.19 MH MH MH MH MS MS
UPAC Services 29 0.09 0.18 MS MS MS MS MS
MRC Industrial 29 0.09 0.18 MH MH MS MS MS MS
HUMANSOFT Services 27 0.08 0.17 MH MS MS MH MH MS
FUTURE Services 27 0.08 0.17 MS MS MS MS
AQAR Real Estate 26 0.08 0.17 MS MS MS MS MS MS
AGHC Services 26 0.08 0.16 MS MS MS MS MS MS
GGMC Industrial 25 0.07 0.16 MS MS MS MS MS MH
KPAK Industrial 25 0.07 0.15 MH MH MH MS MH MH
TAAMEER Real Estate 24 0.07 0.15 MS MS MS MS MS MS
ALMUDON Real Estate 24 0.07 0.15 MH MH
EQUIPMENT Industrial 23 0.07 0.14 MH MH MS MS MS MS
HCC Industrial 22 0.07 0.14 MS MS MS MS MS MS
CLEANING Services 22 0.07 0.14 MH MS MS MS MS MS
ALRAI Services 22 0.06 0.14 MS
SANAM Real Estate 19 0.06 0.12 MH MS MS MS MH MH
NAPESCO Services 18 0.05 0.11 MH MH MH MH MS MH
SAFWAN Services 18 0.05 0.11 MH MH PH PH PH PH
HAYATCOMM Services 17 0.05 0.11 MH MS MS MH

229
POULT Food 16 0.05 0.10 MH MH MS MS MS MH
GFC Services 16 0.05 0.10 MH MH MH MH MH MS
KCPC Services 16 0.05 0.10 MS MS MS MS MS MS
ASC Services 16 0.05 0.10 MH MH MS MS MS MS
MARAKEZ Real Estate 14 0.04 0.09 MH
PAPER Industrial 13 0.04 0.08 MS MS MS MH MS MS
FUTUREKID Services 13 0.04 0.08 MS MS MS
UFIG Food 13 0.04 0.08 MH MS MS MH MH MH
KSH Services 10 0.03 0.07 MH MH MH MH MH MH
PAPCO Services 10 0.03 0.06 MH MS MH MS MH
GYPSUM Industrial 8 0.03 0.05 MS MS MS MS MS
KBMMC Industrial 8 0.02 0.05 MH MH MH MH MH MS
NSH Services 6 0.02 0.04 MH MH MS MS MS MS
Note: This Table shows the final financial screening results of all mixed companies after halving the thresholds of
AAOIFI‘s (2006) financial screens. Companies are ordered according to their average market value (MV) as of the full
sample period, from large to small stocks, MV in millions K.D. The Table demonstrates the corresponding sector,
percent out of the total sample stocks, percent out of the total mixed stock including mixed Halal (MH) and mixed sin
(MS). Empty cells indicate that the company was not listed then, while bold cells denote when it is different from Table
6.3. *Indicates the two companies that converted from mixed stocks to pure Halal (PH) stocks during the sample period
in 2007.
Table 6.7 shows that Islamic funds or investors who wish to select Halal-compliant stocks lose
the chance to invest in the larger market capitalization stocks compared to Table 6.3. The new,
lower financial screening thresholds appear to exclude many of the MH stocks that were
included when the looser limits were applied. However, Islamic fund managers can still invest
in Zain, the largest mixed company, whose weight accounts for 16% of the total market
capitalization and 34% of the capitalization of mixed companies; it still remains as an MH
stock, apart from 2010, when it dropped out of this categorization in both Table 6.3 and 6.7.
However, apart from this exception, fewer large-sized companies are included in the MH
category for most of the years screened; this result applies to the whole sample as well as to the
different sectors when the findings from the stricter limits are compared to the results from the
use of the original AAOIFI screening criteria; for example, Agility, National Mobile
Telecommunication (NMTC), Kuwait Food (FOOD), Kuwait Cement (KCEM), Gulf Cable
and Electrical Industries(CABLE), Mabanee Real Estate (MABANEE), and Boubyan

230
Petrochemicals (BPCC) are no longer no longer avalible for Islamic funds because of the lower
thresholds. These companies together account for 15.5% of all companies and 32% of the
mixed companies. This means that Islamic funds which invest in both PH and MH stocks may
be prevented from investing in these companies if the Shariah scholar‘s wishes in Chapter 5
are adopted. This may affect the performance of such Halal-orientated portfolios. This issue
will be examined in the following two chapters.154
Table 6.8, panels A-D summarizes the Shariah classification change of mixed stocks from MH
to MS and vice versa before and after the halved thresholds of AAOIFI‘s 2004 and 2006
financial screening in sectors. It is worth noting that panels A and C are the same in Table 6.4,
but reported again in this table for the sake of comparison.
154
Islamic funds which do not invest in MH stocks will not be affected by this halving of the thresholds methodology since they have already decided to avoid purchasing the MH equities.

231
Table 6.8: Changes in Mixed Stocks’ Shariah Classification over the Sample Period
Before and After Halving the Financial Screening Thresholds
Panel A
Sector
Screening based on AAOIFI 2004 Financial screening criteria
2006 vs. 2005 2007 vs. 2006 2008 vs. 2007 2009 vs. 2008 2010 vs. 2009 Total
MH MS MH MS MH MS MH MS MH MS MH MS
Real Estate 2 4 1 4 1 1 0 2 4 0 8 11
Industrial 1 2 2 1 3 6 5 2 3 0 14 11
Services 2 6 2 5 5 1 3 3 6 1 18 16
Food 0 0 0 1 1 2 1 0 1 1 3 4
Total 5 12 5 11 10 10 9 7 14 2 43 42
Panel B
Sector
Screening based on AAOIFI 2004 Financial screening criteria (Halved)
2006 vs. 2005 2007 vs. 2006 2008 vs. 2007 2009 vs. 2008 2010 vs. 2009 Total
MH MS MH MS MH MS MH MS MH MS MH MS
Real Estate 0 3 1 2 3 1 2 2 2 1 8 9
Industrial 0 2 4 3 7 5 3 6 3 4 17 20
Services 4 3 3 7 8 4 1 9 11 1 27 24
Food 0 2 0 1 3 1 0 2 3 0 6 6
Total 4 10 8 13 21 11 6 19 19 6 58 59
Panel C
Sector
Screening based on AAOIFI 2006 Financial screening criteria
2006 vs. 2005 2007 vs. 2006 2008 vs. 2007 2009 vs. 2008 2010 vs. 2009 Total
MH MS MH MS MH MS MH MS MH MS MH MS
Real Estate 0 4 1 1 1 4 1 1 3 1 6 11
Industrial 1 2 2 2 1 6 3 1 3 0 10 11
Services 1 3 1 3 0 6 2 4 10 2 14 18
Food 0 0 0 0 0 3 0 0 3 0 3 3
Total 2 9 4 6 2 19 6 6 19 3 33 43
Panel D
Sector
Screening based on AAOIFI 2006 Financial screening criteria (Halved)
2006 vs. 2005 2007 vs. 2006 2008 vs. 2007 2009 vs. 2008 2010 vs. 2009 Total
MH MS MH MS MH MS MH MS MH MS MH MS
Real Estate 0 5 0 2 2 0 2 1 1 1 5 9
Industrial 0 2 1 2 1 4 2 2 2 2 6 12
Services 0 5 1 8 6 4 0 6 8 2 15 25
Food 0 2 1 3 2 1 0 2 4 0 7 8
Total 0 14 3 15 11 9 4 11 15 5 33 54
Note: This Table summarizes the Shariah classification change of mixed stocks from MH to MS and vice versa before and
after the halved thresholds of AAOIFI‘s 2004 and 2006 financial screening in sectors: real estate, industrial, service, and food. Each year is compared with the previous one. The last two columns provide the total results of the MH and MS for each sector
and the total of all 4 sectors. The Table controls for new listed companies, as only if an existing stocks change status from
being Shariah compliant based such criteria it is reported in MH column, while if it becomes not compliant with such criteria it
is reported in the MS column, indicating that it is excluded from the MH stocks universe and is not a possible investment anymore in that particular period.

232
Table 6.8 confirms that halving the thresholds for AAOIFI‘s (2006) screening criteria yield a
more stable investment universe for Islamic funds compared to the halved thresholds of
AAOIFI‘s (2004) criteria. This is similar to the results of Table 6.4 (which is panels A and C in
Table 6.8) that AAOIFI‘s (2006) produce a less volatile asset universe.
The volatility of the number of stocks moving from the MH to the MS and from the MS to the
MH categories over years is higher based on the halved thresholds applied to the AAOIFI‘s
(2004) screening criteria compared to the original AAOIFI‘s (2004) screenings (see panels A
and B). Similar results with the halved and original screening thresholds of AAOIFI‘s (2006)
(see panels C and D).This is explained by the fact that many companies are close to the limits
based on the halved thresholds, causing them to be included in a category one year and
excluded in the next.
Panels A to F of Table 6.9 report the overall results for the screening process using both sector
compliance and the halved financial screening thresholds compliance over the entire sample
period, by year, after removing the non-Kuwaiti sector and companies with missing data from
the beginning of the screened period.

233
Table 6.9, Panel A: Screening results After Halving Thresholds at the end of December 2005
Sector Sector compliance Financial Compliance
Based on AAOIFI 2004 Screens (Halved) Total Based on AAOIFI 2006 Screens (Halved)
PH Stocks Sin Stocks MH MS MH MS
No. % No. % No. % No. % No. % No. %
Banking 1 0.13 7 0.88 0 0.00 0 0.00 8 0 0.00 0 0.00
Investment 17 0.46 20 0.54 0 0.00 0 0.00 37 0 0.00 0 0.00
Insurance 2 0.29 5 0.71 0 0.00 0 0.00 7 0 0.00 0 0.00
Real Estate 7 0.29 1 0.04 5 0.21 11 0.46 24 8 0.33 8 0.33
Industrial 0 0.00 0 0.00 10 0.45 12 0.55 22 13 0.59 9 0.41
Services 4 0.13 4 0.13 9 0.28 15 0.47 32 17 0.53 7 0.22
Food 0 0.00 0 0.00 3 0.60 2 0.40 5 5 1.00 0 0.00
Total no. 31 0.23 37 0.27 27 0.20 40 0.30 135 43 0.32 24 0.18
Market Value 6928 0.20 14676 0.42 1930 0.06 11322 0.32 34856 9150 0.26 4102 0.12
Table 6.9, Panel B: Screening results After Halving Thresholds at the end of December 2006
Sector Sector compliance Financial Compliance
Based on AAOIFI 2004 Screens (Halved) Total Based on AAOIFI 2006 Screens (Halved)
PH Stocks Sin Stocks MH MS MH MS
No. % No. % No. % No. % No. % No. %
Banking 2 0.22 7 0.78 0 0.00 0 0.00 9 0 0.00 0 0.00
Investment 18 0.44 23 0.56 0 0.00 0 0.00 41 0 0.00 0 0.00
Insurance 2 0.29 5 0.71 0 0.00 0 0.00 7 0 0.00 0 0.00
Real Estate 8 0.32 1 0.04 2 0.08 14 0.56 25 2 0.08 14 0.56
Industrial 1 0.04 0 0.00 8 0.33 15 0.63 24 11 0.46 12 0.50
Services 7 0.17 4 0.10 13 0.32 17 0.41 41 15 0.37 15 0.37
Food 0 0.00 0 0.00 1 0.20 4 0.80 5 3 0.60 2 0.40
Total 38 0.25 40 0.26 24 0.16 50 0.33 152 31 0.20 43 0.28
Market Value 9693 0.21 17376 0.38 8399 0.18 10661 0.23 46129 9300 0.20 9760 0.21

234
Table 6.9, Panel C: Screening results After Halving Thresholds at the end of December 2007
Sector Sector compliance Financial Compliance
Based on AAOIFI 2004 Screens (Halved) Total Based on AAOIFI 2006 Screens (Halved)
PH Stocks Sin Stocks MH MS MH MS
No. % No. % No. % No. % No. % No. %
Banking 3 0.33 6 0.67 0 0.00 0 0.00 9 0 0.00 0 0.00
Investment 19 0.45 23 0.55 0 0.00 0 0.00 42 0 0.00 0 0.00
Insurance 2 0.29 5 0.71 0 0.00 0 0.00 7 0 0.00 0 0.00
Real Estate 10 0.34 1 0.03 1 0.03 17 0.59 29 0 0.00 18 0.62
Industrial 3 0.12 0 0.00 8 0.31 15 0.58 26 8 0.31 15 0.58
Services 11 0.22 4 0.08 10 0.20 24 0.49 49 10 0.20 24 0.49
Food 0 0.00 0 0.00 1 0.17 5 0.83 6 2 0.33 4 0.67
Total no. 48 0.29 39 0.23 20 0.12 61 0.36 168 20 0.12 61 0.36
Market Value 12031 0.24 18008 0.36 9118 0.18 10342 0.21 49499 10721 0.22 8739 0.18
Table 6.9, Panel D: Screening results After Halving Thresholds at the end of December 2008
Sector Sector compliance Financial Compliance
Based on AAOIFI 2004 Screens (Halved) Total Based on AAOIFI 2006 Screens (Halved)
PH Stocks Sin Stocks MH MS MH MS
No. % No. % No. % No. % No. % No. %
Banking 3 0.33 6 0.67 0 0.00 0 0.00 9 0 0.00 0 0.00
Investment 19 0.45 23 0.55 0 0.00 0 0.00 42 0 0.00 0 0.00
Insurance 2 0.29 5 0.71 0 0.00 0 0.00 7 0 0.00 0 0.00
Real Estate 10 0.33 1 0.03 3 0.10 16 0.53 30 2 0.07 17 0.57
Industrial 3 0.11 0 0.00 10 0.37 14 0.52 27 5 0.19 19 0.70
Services 11 0.21 4 0.08 15 0.28 23 0.43 53 14 0.26 24 0.45
Food 0 0.00 0 0.00 3 0.50 3 0.50 6 3 0.50 3 0.50
Total 48 0.28 39 0.22 31 0.18 56 0.32 174 24 0.14 63 0.36
Market Value 6045 0.21 10230 0.36 7827 0.28 4326 0.15 28428 7717 0.27 4435 0.16

235
Table 6.9, Panel E: Screening results After Halving Thresholds at the end of December 2009
Sector Sector compliance Financial Compliance
Based on AAOIFI 2004 Screens (Halved) Total Based on AAOIFI 2006 Screens (Halved)
PH Stocks Sin Stocks MH MS MH MS
No. % No. % No. % No. % No. % No. %
Banking 3 0.33 6 0.67 0 0.00 0 0.00 9 0 0.00 0 0.00
Investment 19 0.45 23 0.55 0 0.00 0 0.00 42 0 0.00 0 0.00
Insurance 2 0.29 5 0.71 0 0.00 0 0.00 7 0 0.00 0 0.00
Real Estate 11 0.35 1 0.03 3 0.10 16 0.52 31 3 0.10 16 0.52
Industrial 3 0.11 0 0.00 7 0.26 17 0.63 27 5 0.19 19 0.70
Services 11 0.20 4 0.07 7 0.13 32 0.59 54 8 0.15 31 0.57
Food 0 0.00 0 0.00 1 0.17 5 0.83 6 1 0.17 5 0.83
Total no. 49 0.28 39 0.22 18 0.10 70 0.40 176 17 0.10 71 0.40
Market Value 5871 0.20 10892 0.36 851 0.03 12341 0.41 29955 968 0.03 12224 0.41
Table 6.9, Panel F: Screening results After Halving Thresholds at the end of December 2010
Sector Sector compliance Financial Compliance
Based on AAOIFI 2004 Screens (Halved) Total Based on AAOIFI 2006 Screens (Halved)
PH Stocks Sin Stocks MH MS MH MS
No. % No. % No. % No. % No. % No. %
Banking 4 0.44 5 0.56 0 0.00 0 0.00 9 0 0.00 0 0.00
Investment 19 0.45 23 0.55 0 0.00 0 0.00 42 0 0.00 0 0.00
Insurance 2 0.29 5 0.71 0 0.00 0 0.00 7 0 0.00 0 0.00
Real Estate 13 0.36 1 0.03 6 0.17 16 0.44 36 5 0.14 17 0.47
Industrial 3 0.11 0 0.00 7 0.25 18 0.64 28 5 0.18 20 0.71
Services 11 0.20 4 0.07 17 0.30 24 0.43 56 14 0.25 27 0.48
Food 0 0.00 0 0.00 4 0.67 2 0.33 6 5 0.83 1 0.17
Total 52 0.28 38 0.21 34 0.18 60 0.33 184 29 0.16 65 0.35
Market Value 6594 0.22 10826 0.37 7266 0.25 4811 0.16 29498 7515 0.25 4562 0.15
Note: This Table reports the results of the screening process using both qualitative (sector) and quantitative (financial) Shariah screening criteria after having thresholds
of AAOIFI‘s criteria, during the whole sample period. Each panel represents the screening results at that year. All sample stocks are classified according to their

236
compliance with the sector and financial screening, reported across seven sectors. Pure Halal stocks (PH) are those that are compliant with sector or activity criteria,
while Sin stocks are not compliant with such criteria. Whereas Mixed Halal (MH) stocks are those that are compliant with the halved financial screening criteria and
Mixed Sin (MS) are not compliant with such criteria. The financial compliance is divided into two parts based on new halved AAOIFI‘s 2004 and 2006 financial
screening criteria. The (%) ratio column represents the percent of listed stocks in that sector, so PH and Sin combined together with MH and MS based on halved
AAOIFI‘s 2004 financial criteria add up to 100% or PH and Sin with MH and MS based on halved AAOIFI 2006 financial criteria also add up to 100%. The last two
rows shows the number and ratio of total listed stocks and market value in millions K.D for each column, so similarly PH and Sin combined together with MH and MS
based on halved AAOIFI‘s 2004 financial criteria add up to 100% or PH and Sin with MH and MS based on halved AAOIFI‘s 2006 financial criteria also add up to
100%.

237
Table 6.9 shows the impact of halving the financial screening thresholds on the Shariah
classification of mixed companies to MH (Halved) and MS (Halved) stocks. The result of the
sector screening is the same as that shown in Table 6.5. A comparison of the financial
screening results of Table 6.9 with those in Table 6.5 shows that there was a dramatic drop in
both the number and market value of MH stocks under the halved AAOIFI‘s (2004) and (2006)
financial screening methods. For example, at the end of 2005, the number of MH stocks fell
from 48 (see Table 6.5) to 27 (see Table 6.9) under the original and halved AAOIFI‘s (2004),
with a great drop in the market value from 10.721 to 1.930 billion Kuwaiti Dinar (K.D) but a
smaller drop from 50 (see Table 6.5) to 43 MH stocks (see Table 6.9) under the original and
halved AAOIFI‘s (2006) with a small loss in market value from 10.728 to 9.150 billion. In
fact, the 2005 screening results were extraordinary for MH under the halved AAOIFI‘s 2006
criteria as it experienced the least drop. The worst year for MH stocks under the halved
AAOIFI‘s (2004) and (2006) was after the financial crisis immediately in the last quarter of
2008, but since the screening took place at the end of 2008 for 2009, hence, the impact is
shown in the 2009 screening, where the number of MH stocks fell from 54 under the original
criteria (see Table 6.5) to 18 (see Table 6.9) under the AAOIFI‘s (2004) criteria, with a
dramatic loss in market value from 4.266 billion to only 851 million K.D. And a fall in the
number of MH stocks under the AAOIFI‘s (2006) criteria from 38 under the original criteria
(see Table 6.5) to 17, accompanied by a huge shrink in market value from 3.710 billion to 968
million K.D. This enormous fall in the market value of MH stocks in 2009 was because many
large companies were excluded due to their failure to comply with the new halved thresholds.
At the end of 2010, the number and market value of MH stocks started to increase again, but
was still less than that in Table 6.5.

238
To highlight the impact of halving the financial screening thresholds on the MH stocks‘
diversification across sectors, Figures 6.2 and 6.3 show the number of MH stocks in each
sector based on the original and halved AAOIFI‘s 2004 and 2006 financial screening criteria
respectively.
Figure 6.2: The Average Number of MH Stocks in Each Sector Based on the Original and
Halved AAOIFI’s 2004 Financial Screening Criteria
Note: This figure shows the average number of mixed Halal (MH) stocks based on the original and halved
AAOIFI‘s (2004) financial screens over the whole sample period in each sector: real estate, industrial, services,
and food and the average total of all sectors.
Figure 6.3: The Average Number of MH Stocks in Each Sector Based on the Original and
Halved AAOIFI’s 2006 Financial Screening Criteria
Note: This figure shows the average number of mixed Halal (MH) stocks based on the original and halved
AAOIFI‘s (2006) financial screens over the whole sample period in each sector: real estate, industrial, services,
and food and the average total of all sectors.
7.8
14.8
24.0
4.8
51.5
3.3 8.3
11.8
2.2
25.7
Real Estate Industrial Services Food Total
Avr. No. of MH stocks -AAOIFI (2004) Avr. No. of MH stocks-AAOFI (2004-Halved)
6.2
15.2
20.7
4.7
46.7
3.3
7.8
13.0
3.2
27.3
Real Estate Industrial Services Food Total
Avr. No. of MH stocks -AAOIFI (2006) Avr. No. of MH stocks-AAOFI (2006-Halved)

239
Figures 6.2 and 6.3, demonstrates that halving the financial screening thresholds has negatively
influenced MH investment diversification, as the number of MH stocks in each sector, on
average, has dropped, especially when the AAOIFI‘s (2004) financial screening thresholds
were halved. This might affect the risk tolerance level of Islamic funds, as they would have
fewer stocks in each sector compared to the period when the original criteria were employed.
However, the AAOIFI‘s (2006) criteria could be a better option as less MH stocks were lost in
different sectors when the screens thresholds were halved. The risk and return behaviour of
MH and MS under the halved financial screening criteria will be investigated in the two
following chapters.
6.6 Portfolio Construction
Based on the screening process described in Figure 6.1 and the screening results reported in
Tables 6.5 and 6.9, a number of value-weighted portfolios were created for the purpose of this
study to simulate the possible Islamic fund portfolios in the Kuwaiti market. The portfolio
simulation technique has been adopted in prior studies such as Lehmann and Modest (1987),
Grinblatt and Titman (1994), Diltz (1995), Draper and Paudyal (1997), Havemann and Webster
(1999), Cowell (2002), Derwall et al., 2005, Derigs and Marzban (2009); and Rahimie
(2010).155
One study of interest to this thesis is Rahimie‘s (2010) work on the Malaysian stock
market. He created three groups of simulated portfolios, namely a conventional portfolio, as
the proxy for conventional or unrestricted funds investing in both Shariah-compliant and non-
Shariah-compliant stocks; a Shariah-approved portfolio based on a ready list issued by the
Shariah Advisory Council in the stock market as a proxy for Islamic funds; and a non-
Shariah-approved portfolio. This study follows a similar approach, but it differentiates between
155 Diltz (1995), Havemann and Webster (1999), and Derwall et al. (2005) are on SRI, while Derigs and Marzban (2009) and Rahimie (2010) are on Shariah-compliant investments.

240
four types of stocks: PH and MH stocks, ‗Sin‘ based on activity, and MS based on non-
compliance with certain financial criteria, and it uses different financial screening criteria
(halved financial screening thresholds). Using these different screens as described in Figure
6.1, 19 simulated value- weighted portfolios are created. The 19 portfolios are defined as
follows:
P1: Pure Halal (PH) comprises stocks of companies that clearly follow Shariah law in all their
activities and have an SSB. For the purpose of this study, a PH portfolio is regarded as a proxy
for Islamic funds that invest only in PH stocks and do not allow any investment in MH stocks
at all;
P2: Sin portfolio (Sin) includes stocks of companies that fail to comply with sector criteria (sin
core business or activity), as they operate or are engaged in prohibited businesses such as
interest-based financial services, alcohol, and adult entertainment;
P3: Mixed Halal (MH-T.A) consists of stocks of companies that comply with AAOIFI
standard no.21 (2004) financial criteria using total assets in the financial screening criteria;
P4: Mixed Halal (MH-M.C) includes stocks of companies that comply with AAOIFI standard
no.21 (2006) using market capitalization in the financial screening criteria;
P5: Mixed Sin (MS-T.A) comprises stocks of companies that fail to comply with AAOIFI
standard no.21 (2004);
P6: Mixed Sin (MS-M.C) embraces stocks of companies that fail to comply with AAOIFI
standard no.21 (2006);
P7: PH and Mixed Halal-T.A (All Halal-TA) is the combination of portfolios P1 and P3
above. For the purpose of this study, this combination is considered a proxy for Islamic funds
that invest in stocks that are compliant with the AAOIFI‘s (2004) screening criteria;

241
P8: PH and Mixed Halal-M.C (All Halal-M.C) is the integration of portfolios 1 and 4 above.
This is a proxy for Islamic funds that invest according to AAOIFI‘s (2006) screening criteria;
P9: Sin and Mixed Sin-T.A (All Sin-T.A) is the grouping of portfolios P2 and P5 above; failing
AAOIFI‘s (2004) screens;
P10: Sin and Mixed Sin-M.C (All Sin-M.C) is the mixture of portfolios P2 and P6 above;
failing AAOIFI‘s (2006) screens;
P11: Control Portfolio (CP) comprises stocks of all listed companies in KSE, excluding the
non-Kuwaiti sector and companies with missing data. For the purpose of this study, the CP
could be a proxy for conventional or unrestricted funds that are free to invest in any stock in
the market, regardless of its Shariah status;
P12: Mixed Halal (MH-T.A- Halved) compiles stocks of companies that comply with a
halving of AAOIFI‘s (2004) financial criteria thresholds;
P13: Mixed Halal (MH-M.C- Halved) encompasses stocks of companies that comply with a
halving of AAOIFI‘s (2006) financial criteria thresholds;
P14: Mixed Sin (MS-T.A- Halved) incorporates stocks of companies that fail to comply with a
halving of AAOIFI‘s (2004) financial criteria thresholds;
P15: Mixed Sin (MS-M.C- Halved) includes stocks of companies that fail to comply with a
halving of AAOIFI‘s (2006) financial criteria thresholds;
P16: PH and Mixed Halal-T.A (All Halal-TA- Halved) combines portfolios P1 and P12 above,
as a proxy for Islamic funds that invest in MH under halving of AAOIFI‘s (2004) screening
criteria thresholds;
P17: PH and Mixed Halal-M.C (All Halal-M.C- Halved) conglomerates portfolios P1 and P13
above, as a proxy for Islamic funds that invest in MH under halving of AAOIFI‘s (2006)
screening criteria thresholds;

242
P18: Sin and Mixed Sin-T.A (All Sin-T.A- Halved) integrates portfolios P2 and P14 above;
failing a halving of AAOIFI‘s (2004) screening criteria thresholds;
P19: Sin and Mixed Sin-M.C (All Sin-M.C- Halved) join in portfolios P2 and P15 above;
failing a halving of AAOIFI‘s (2006) screening criteria thresholds.
P11, the CP that contains all the stocks, can be broken down in 8 ways as shown in following
two diagrams.
Figure 6.4: Breakdown of Portfolios Using AAOIFI 2004 and 2006 Financial Screening
Criteria
Note: Figure 6.4 shows 4 ways of constructing P11, the control portfolio (CP), by using the original
financial screening thresholds.

243
Figure 6.5: Breakdown of Portfolios Using AAOIFI 2004 and 2006 Halved Financial
Screening Criteria
Note: Figure 6.5 shows 4 ways of constructing P11, the control portfolio (CP), by using the halved
financial screening thresholds.
Figure 6.4 shows 4 ways to create P11, as follows: (i) P1+P2+P3+P5; (ii) P1+P2+P4+P6; (iii)
P7+P9; and (iv) P8+P10. In addition, Figure 6.5 shows another 4 ways to create P11: (i)
P1+P2+P12+P14; (ii) P1+P2+P13+P15; (iii) P16+P18 (iv) P17+P19.
Table 6.10 shows the number of stocks allocated across the KSE sectors and market value for
each of the 19 portfolios in each year of the sample period. This Table is based on the
screening results in Tables 6.5 and 6.9 and the portfolio definitions above of P1-P19.

244
Table 6.10: The Asset Allocation for Portfolios P1-P19 over the Sample Period (2005-2010)
Panel A for the Years 2005-2007 Port. 2005 2006 2007
No. of Stocks in Each Sector T MV No. of Stocks in Each Sector T MV No. of Stocks in Each Sector T MV
B. Inv. Ins. R.E Ind. Ser. F B. Inv. Ins. R.E Ind. Ser. F B. Inv. Ins. R.E Ind. Ser. F
P1 1 17 2 7 0 4 0 31 6928 2 18 2 8 1 7 0 38 9693 3 19 2 10 3 11 0 48 12031
P2 7 20 5 1 0 4 0 37 14676 7 23 5 1 0 4 0 40 17376 6 23 5 1 0 4 0 39 18008
P3 0 0 0 9 15 19 5 48 10721 0 0 0 7 14 18 5 44 14209 0 0 0 7 14 20 5 46 14599
P4 0 0 0 9 17 19 5 50 10728 0 0 0 5 17 20 5 47 14703 0 0 0 7 16 22 6 51 14843
P5 0 0 0 7 7 5 0 19 2531 0 0 0 9 9 12 0 30 4851 0 0 0 11 9 14 1 35 4860
P6 0 0 0 7 5 5 0 17 2524 0 0 0 11 6 10 0 27 4358 0 0 0 11 7 12 0 30 4618
P7 1 17 2 16 15 23 5 79 17649 2 18 2 15 15 25 5 82 23902 3 19 2 17 17 31 5 94 26630
P8 1 17 2 16 17 23 5 81 17656 2 18 2 13 18 27 5 85 24396 3 19 2 17 19 33 6 99 26874
P9 7 20 5 8 7 9 0 56 17207 7 23 5 10 9 16 0 70 22227 6 23 5 12 9 18 1 74 22868
P10 7 20 5 8 5 9 0 54 17200 7 23 5 12 6 14 0 67 21734 6 23 5 12 7 16 0 69 22626
P11 8 37 7 24 22 32 5 135 34856 9 41 7 25 24 41 5 152 46129 9 42 7 29 26 49 6 168 49498
P12 0 0 0 5 10 9 3 27 1930 0 0 0 2 8 13 1 24 8399 0 0 0 1 8 10 1 20 9118
P13 0 0 0 8 13 17 5 43 9150 0 0 0 2 11 15 3 31 9300 0 0 0 0 8 10 2 20 10721
P14 0 0 0 11 12 15 2 40 11322 0 0 0 14 15 17 4 50 10661 0 0 0 17 15 24 5 61 10342
P15 0 0 0 8 9 7 0 24 4102 0 0 0 14 12 15 2 43 9760 0 0 0 18 15 24 4 61 8739
P16 1 17 2 12 10 13 3 58 8858 2 18 2 10 9 20 1 62 18092 3 19 2 11 11 21 1 68 21149
P17 1 17 2 15 13 21 5 74 16078 2 18 2 10 12 22 3 69 18993 3 19 2 10 11 21 2 68 22752
P18 7 20 5 12 12 19 2 77 25998 7 23 5 15 15 21 4 90 28037 6 23 5 18 15 28 5 100 28350
P19 7 20 5 9 9 11 0 61 18778 7 23 5 15 12 19 2 83 27136 6 23 5 19 15 28 4 100 26747

245
Panel B for the Years 2008-2010 Port. 2008 2009 2010
No. of Stocks in Each Sector T MV No. of Stocks in Each Sector T MV No. of Stocks in Each Sector T MV
B. Inv. Ins. R.E Ind. Ser. F B. Inv. Ins. R.E Ind. Ser. F B. Inv. Ins. R.E Ind. Ser. F
P1 3 19 2 10 3 11 0 48 6045 3 19 2 11 3 11 0 49 5871 4 19 2 13 3 11 0 52 6594
P2 6 23 5 1 0 4 0 39 10230 6 23 5 1 0 4 0 39 10892 5 23 5 1 0 4 0 38 10826
P3 0 0 0 8 12 26 4 50 8529 0 0 0 7 15 27 5 54 4266 0 0 0 9 19 34 5 67 9607
P4 0 0 0 4 11 19 3 37 8373 0 0 0 4 13 18 3 38 3710 0 0 0 8 17 26 6 57 9962
P5 0 0 0 11 12 12 2 37 3624 0 0 0 12 9 12 1 34 8876 0 0 0 13 6 7 1 27 2470
P6 0 0 0 15 13 19 3 50 3779 0 0 0 15 11 21 3 50 9482 0 0 0 14 8 15 0 37 2116
P7 3 19 2 18 15 37 4 98 14574 3 19 2 18 18 38 5 103 10137 4 19 2 22 22 45 5 119 16201
P8 3 19 2 14 14 30 3 85 14418 3 19 2 15 16 29 3 87 9581 4 19 2 21 20 37 6 109 16556
P9 6 23 5 12 12 16 2 76 13854 6 23 5 13 9 16 1 73 19768 5 23 5 14 6 11 1 65 13296
P10 6 23 5 16 13 23 3 89 14009 6 23 5 16 11 25 3 89 20374 5 23 5 15 8 19 0 75 12942
P11 9 42 7 30 27 53 6 174 28428 9 42 7 31 27 54 6 176 29905 9 42 7 36 28 56 6 184 29497
P12 0 0 0 3 10 15 3 31 7827 0 0 0 3 7 7 1 18 851 4 19 2 13 3 11 0 52 6594
P13 0 0 0 2 5 14 3 24 7717 0 0 0 3 5 8 1 17 968 5 23 5 1 0 4 0 38 10826
P14 0 0 0 16 14 23 3 56 4326 0 0 0 16 17 32 5 70 12341 0 0 0 6 7 17 4 34 7266
P15 0 0 0 17 19 24 3 63 4435 0 0 0 16 19 31 5 71 12224 0 0 0 5 5 14 5 29 7515
P16 3 19 2 13 13 26 3 79 13872 3 19 2 14 10 18 1 67 6722 8 38 4 26 6 22 0 104 13188
P17 3 19 2 12 8 25 3 72 13762 3 19 2 14 8 19 1 66 6839 9 42 7 14 3 15 0 90 17420
P18 6 23 5 17 14 27 3 95 14556 6 23 5 17 17 36 5 109 23233 5 23 5 7 7 21 4 72 18092
P19 6 23 5 18 19 28 3 102 14665 6 23 5 17 19 35 5 110 23116 5 23 5 6 5 18 5 67 18341
Note: this Table shows the asset allocation across the different sectors in KSE stock market for each of the created portfolios for the years 2005-2007 (panel A) and the years
2008-2010 (panel B). The first column gives a code from 1 to 19 for each created portfolio as defined in section 6.6. The Table provide the number of stocks in sector and the
total number (T) of stocks and market value (MV) in millions K.D for each portfolio. The codes B., Inv. , Ins., R.E, Ind., Ser., F are assigned for the banking, investment,
insurance, real estate, industrial, service, and food sectors respectively. Portfolio number 11 in bold is the control portfolio (CP) that contains the total sample stocks.

246
The performance of all the 19 constructed portfolios (P1-P19) detailed in Table 6.10 will be
empirically tested in the next chapter to examine the impact of different screening criteria on
the risk and return characteristics of Halal and non-Halal portfolios and investigate whether
there is a performance penalty for the proposed halving of the financial screening thresholds.
6.7 Summary
This chapter analyzes the impact of using different Shariah screening criteria on the definition
of the Halal asset universe and the creation of different equity portfolios, pure Halal (PH), sin,
mixed Halal (MH) and, mixed (MS) for the KSE. It builds on the outcomes and findings
generated from the interview analysis chapter, such as the definitions of each portfolio, the
screening criteria and screening process. The screening process and results are described in
Figure 6.1 over the sample period from the end of 2005 until the end of 2010.
The analysis reveals that there are some PH stocks located in the non-financial sectors,
however, the majority of them are concentrated in the financial sector and tend to be smaller
firms as noted by the interviewees in the previous chapter. This means that Islamic funds that
only invest in PH stocks may be deprived from investing in blue chip companies that offer
sound fundamentals and are heavily-weighted stocks in the market. In addition, they are
exposed to concentration risk in the financial sector, and hence a lack of diversification
benefits compared to Islamic funds that invest in both PH and MH stocks, and this may impact
on their risk and return profile, which is investigated in the next two chapters. MH stocks only
exist in the non-financial sector; real estate, industrial, service; and food industries, because
companies that operate in the financial sector, such as banks, investment, and insurance
companies, must be entirely Halal (PH) in order to be included in the Halal stocks universe.
The analysis shows that the use of different financial screening criteria produces slightly
different results when classifying MH and MS stocks. AAOIFI‘s (2006) that use market

247
capitalization as a denominator in its ratios produced more MH stocks, compared with
AAOIFI‘s (2004) criteria that uses total assets as a denominator, but this was just before the
GFC. Further, the screening analysis found that AAOIFI‘s (2006) is less volatile in classifying
mixed stocks from MH to MS and vice versa.
This chapter also halves the financial screening thresholds that are used to screen MH stocks,
in order to be able to investigate whether it is the right time to revisit the fatwa that is the base
of AAOIFI‘s investment criteria, to be more consistent with Islamic investment principles as
noted by the previous chapter. The halved screening criteria show that Islamic funds are still
able, to some extent, to create diversified portfolios. But diversification is negatively affected,
as it causes companies, especially the larger ones to fail being classified as Shariah-compliant.
Nevertheless, this halving screening threshold methodology could be an option for Islamic
funds and Halal-seeking investors who are willing to be more compliant with their religious
values. Nonetheless, in order to answer the research questions, the return and risk
characteristics of the 19 constructed portfolios will be examined in the next chapter.

248
Chapter 7: Evaluating the Performance of Halal and non-Halal
Portfolios

249
7.1 Introduction
Unlike the vast majority of prior studies that compare Islamic funds with conventional ones,
this chapter compares the performance of the 19 different Halal and non-Halal equity
portfolios of listed stocks in KSE that were created and defined in the previous chapter. These
hypothetical portfolios were created using qualitative and quantitative Shariah screening
criteria to test the performance of conventional non-Halal funds against that of Islamic funds
created using different criteria to understand their risk and return performance. This will allow
Islamic fund managers to understand the impact of the different screening strategies that are
available in the market and help investors and regulators to understand Islamic funds‘
performance over the five year study period. This study assumes that Halal driven investors
have the option to choose between differently-screened Islamic funds depending on the market
conditions and their personal preferences. The chapter also empirically tests the impact on the
portfolios‘ performance if halving the financial screening thresholds is adopted by Islamic
funds, as described in chapter 6, and explores whether it is feasible to move towards the ideal
of pure Halal investments that are totally sin free, as raised by many interviewees in chapter 5.
This chapter applies quantitative methods to determine the risk and return characteristics of the
different equity portfolios created to investigate whether there are any significant differences
between the performance of Halal and non-Halal portfolios under different screening methods
over the sample period from the beginning of January 2006 until the end of December 2011.
Dividing the sample period into before, during and after the Global Financial Crisis (GFC),
allow testing the effect of GFC, bearish and bullish markets on the portfolios‘ performance.
There has been evidence that Islamic funds perform better in bearish markets and during
financial crises (Abdullah et. al., 2007; Hayat and Kraeussl, 2008; Merdad et. al., 2010).

250
The analysis starts with descriptive statistics of the return and risk characteristics of the
hypothetical portfolios, followed by a statistical analysis of the differences between the
portfolios‘ returns and the correlation of these both with each other and with the control
portfolio (CP)156
and market index as benchmarks for understanding their behaviour. In
addition, the quantitative analysis measures the performance of the hypothetical portfolios
based on their risk-adjusted return using the three traditional portfolio performance evaluation
measures suggested by Sharpe (1966) Treynor (1965) and Jensen (1968). Multifactor
quantitative models are not used in this study because the interviews demonstrated that fund
managers in Kuwait do not use any sophisticated investment techniques, so simple measures
are more applicable. Furthermore, these performance measures are well established and tested,
and enable comparisons to be made across the Islamic funds literature. Nevertheless, a general
linear model (GLM) is fitted to the data and a matched pair approach is employed in the
following chapter to control for size, sector and other factors that might impact on the
portfolios‘ performance.
The risk-free rate that is used in the traditional performance measures in this chapter is also
replaced with Shariah-compliant alternatives, such as the Murabahah rate, to see if this has
any impact on the portfolios‘ performance, as some interviewees noted this in the interviews.
This approach is more appropriate to Islamic investment principles, whereas, riba is banned
under Shariah law.
The remainder of this chapter is organized as follows. Section 7.2 discusses the data collection
process and the statistical hypotheses. Section 7.3 provides the descriptive statistics of the
portfolios‘ characteristics while section 7.4 analyses statistically the return performance.
Section 7.5 examines the return correlations; section 7.6 documents the risk-adjusted
156
CP is also a proxy for conventional funds, as defined in the previous chapter (section 6.5).

251
performance of the portfolios using the conventional and Shariah-compliant performance
measures; and the final section provides the conclusion.
7.2 Data collection
The empirical data employed to measure the performance of the 19 value-weighted portfolios
created in chapter 6 consist of weekly historical prices and market capitalization values for
each listed company on the KSE, apart from the non-Kuwaiti sector, from DataStream.157
The
closing values of the general market index (KSE) were also obtained at weekly frequencies
from DataStream. Companies‘ closing prices and market values, and the KSE index values
were first downloaded on a daily basis from 1/1/2006-31/12/2011; Wednesday‘s values were
then selected. Wednesdays were chosen to mitigate the influence of anomalies, such as any
weekend effect (Kreander et al., 2005) and also because Friday is a religious holiday in
Kuwait. For the analysis, each portfolio contained 313 weekly observations of the closing
prices of each stock in that portfolio on each Wednesday of the year during the whole period,
from the first Wednesday in January 2006 until the last Wednesday in December 2011. The
portfolios were weighted by the companies‘ market capitalization comprising each portfolio.
Empirical studies on the performance of investment funds in general, and ethical and Islamic
funds in particular, show that fund performance is sensitive to the benchmark market index
(Lehmann and Modest, 1987; Grinblatt and Titman, 1994; Mallian et al., 1995; Gregory et al.,
1997; Kreander et al., 2005; Rahimie, 2010). To mitigate this problem, two market benchmarks
were employed to evaluate the performance of the created portfolios, namely: the general
Kuwait value-weighted index (KSE) and the CP158
value-weighted portfolio. A matched pair
approach is also adopted, used in chapter 8, where the performance of portfolios is matched
157 A decision was made to select weekly rather than daily data to overcome the problems associated with thin trading (Al-Abdulqader, 2003). 158 The CP portfolio as defined in section 6.5 of Chapter 6 as all of the listed companies in KSE apart from the non-Kuwaiti sector and companies with missing data.

252
with stocks of the same size and sector. The KSE index includes all of the listed companies in
every sector, while the CP constitutes companies that are only used in this study, listed in all
sectors,159
except for the non-Kuwaiti sector and a few companies with missing data. It would
have been suitable to use a Halal-based equity index as a benchmark, such as the AL-Aman
Islamic index or Global Islamic index, that are the most common for Islamic funds in Kuwait,
but the data for the AL-Aman index were missing and unavailable for all days, and the Global
Islamic index160
did not appear representative of the market.161
The KSE follows a free float
methodology and is adjusted for free float capitalization.162
163
In this study, the CBK‘s one year T-bonds, obtained from its official website, was used as a
proxy for the risk-free rate in calculating the Jenson alpha, Sharpe and Treynor performance
measures.164
In addition, the one-year Murabahah return rate is also used in this study as a
Shariah-compliant proxy for the interest-based risk-free rate in calculating the three
performance measures. This overcomes the limitation, that exists in the vast majority of
Islamic funds literature, of using the conventional risk-free rate, while conventional risk-free
assets such as T-bonds should not be an option for Shariah-compliant investors, as these are
based on interest that is forbidden in Shariah and is seen by many Shariah scholars, fund
managers and the practitioners interviewed as contradicting the idea of Islamic investment (see
159
Sectors include: banking, investment, insurance, real estate, industrial, service, and food. 160
The Global Islamic index is the first Islamic index in Kuwait provided by the Global investment Company, which offers Islamic and conventional funds. 161
The coefficient of determination, adjusted R2 when running the regression to calculate the portfolios beta and Jensen’s alpha, was very low compared with the literature and KSE index. For instance, the R2 adjusted for the MH (T.A) portfolio is 0.00297 compared to 0.3077 when using the KSE index. This suggests that that Global Islamic index is not a good proxy for the market portfolio to explain the variations of the portfolio returns. 162 The free-float methodology is an index construction methodology that considers only those shares issued by companies that are readily available for trading in the market, and excludes government holdings, strategic holdings and other locked-in shares that will not come to the market for trading in the normal course. This ensures that only the investable opportunity set is included within the index. 163
In emerging markets, there is insufficient disclosure to determine the free float factor, and a large portion of companies' shares are illiquid and not traded in the market, since most of them are government holdings, especially in large companies. 164
T-bonds were chosen because data were available on a regular basis, as opposed to data on T-bills.

253
also: Mirakhor,1996; Selim, 2008; Rahimie, 2010; Kantakji and Omar, 2010). The Murabahah
instrument was chosen as an alternative Shariah-compliant risk-free rate because it is the least
risky Shariah-compliant asset and is commonly used by most IFIs (El-Gamal, 2006). Hence, it
is a close substitute for the conventional risk free asset, such as T-bonds. Data on the
Murabahah rate was downloaded from Thomson Reuter‘s 3000 Xtra financial database.165
However, the data on the Murabahah rate has only been available since 2009, so the analysis
only covers the bearish sample period (2010-2011).
To investigate the impact of the general economic climate on performance, the sample period
was broken down into three two-year sub-periods namely: (i) the bullish period (2006-2007);
(ii) the global financial crisis GFC period (GCF) (2008-2009); and (iii) the bearish period
(2010-2011), in order to capture the impact of the GFC and post-GFC periods (the Arab Spring
and domestic political disputes) that severely slowed every Middle Eastern economy, including
the GCC states and Kuwait, as noted by the interviews in chapter 6. The sub-periods were
determined based on the interviewees‘ feedback in chapter 5 and by examining the major
structural turning points in the general KSE market index and CP performance that indicated
the beginning and ending of the specific market trends. The KSE market Index and CP
performance trends are shown in Figure 7.1.
165
Thomson Reuters launched what it called its Islamic Finance Gateway, which is a global platform and directory consisting of the details of rating agencies, industry standards bodies, Islamic finance hubs, index providers, consulting firms, and Islamic subsidiaries from over 25 countries (http://thomsonreuters.com/content/press_room/financial/2010_02_16_islamic_finance_gateway). Access to Thomson Reuters 3000 Xtra financial platform was obtained from Kuwait University.

254
Figure 7.1: The Performance of the KSE and the Control Portfolio (CP) that contains All
Sample stocks
Note: This figure illustrates the weekly price performance of the KSE, the control portfolio (CP) that contain all
sample stocks, indexed from the 100 index points at 4/1/2006-28/12/2011 which is divided into three sub-
periods, namely: the bullish period (2006-2007), GFC period (2008-2009), and bearish period (2010-2011).
As shown in Figure 7.1, the three two year sub-periods classification capture different
economic climates, during the bull phase, GFC period and the bear markets, and have a
consistent time length. Figure 7.1 shows that 2008-2009 captures the impact of GFC on KSE as
suggested by Ellaboudy (2010) and Senbet and Gande (2009) who indicates that emerging
markets seemed to be unaffected by the initial 2007 sub-prime crisis (See Buckley, 2011;
Trabelsi, 2011; Bourkhis and Nabi, 2013; Örnberg et al., 2013).
For the purpose of this study, the weekly returns are calculated for each individual stock in
every portfolio using the compounded return formula, as shown in equation 7.1:
[7.1]
Where is the return for stock i at time t, Ln is the natural log, is the price for stock i at
time t and is the price of stock i at time t-1. The natural log was used to mitigate any
40
60
80
100
120
140
4/1/2006 4/1/2007 4/1/2008 4/1/2009 4/1/2010 4/1/2011
KSE Index CP
Bullish Period GFC Period Bearish Period

255
problems with the non-normality in the data (Strong, 1992). Having computed the return of the
individual stock, the returns of the portfolios were then calculated, based on the individual
stocks‘ weighted market value, whereby each individual stock within that portfolio is weighted
by its proportionate market capitalization share of the total market capitalization of the whole
portfolio, as in equation 7.2:
∑ [7.2]
Where is the portfolio return, the weighted average market capitalization of stock i in the
portfolio, and the return on stock i, where;
∑ [7.3]
The Market index returns ( for the KSE was estimated using the same technique, as shown
in equation 7.4:
[7.4]
7.2.1 Statistical Tests for analyzing the Portfolios’ Mean Returns
To investigate the statistical significance of the portfolio‘s return, the performance of the 19
portfolios were tested during the full, bullish, GFC and bearish periods, based on the following
null hypotheses:
Ho 1: There is no significant difference between the mean returns of Portfolio i and
that of the other 18 portfolios or KSE Index during the full sample period.
Ho 2: There is no significant difference between the mean returns of Portfolio i and
that of the other18 portfolios or KSE Index during the bullish period.
Ho 3: There is no significant difference between the mean returns of Portfolio i and
that of the other 18 portfolios or KSE Index during the GFC period.

256
Ho 4: There is no significant difference between the mean returns of Portfolio i and
that of the other 18 portfolios or KSE Index during the bearish crisis period.
Parametric and non-parametric tests are utilized to examine the above hypotheses, as the
parametric analysis of variance (ANOVA) test is used to detect significant differences between
the means of portfolio returns but, as a robustness check, to detect any significant differences
between the median of all the portfolios returns, the non-parametric Friedman test (1937) is
also adopted.166
ANOVAs are used in similar finance empirical research, despite asset returns
exhibiting negative skewness (Kat and Lu, 2002), excess kurtosis, heavy tails or outliers, and
the normality assumption being systematically violated (Groenewold and Fraser, 2001).
Further, Groenewold and Fraser (2001) find that the iid-normal assumption does matter for
tests of asset-pricing models. Moreover, when non-normality is present but the sample is
large,167
ANOVA procedures are robust to the validations of non-normality assumptions (Boos
and Brownie, 1994). Both the ANOVA and Friedman‘s tests can only detect significant
differences over multiple comparisons, and are unable to determine which portfolio differs
from the others. Therefore, a pair wise comparison test is required for this purpose, using the
parametric paired sample t-test to test the null hypothesis that the mean difference within pairs
166
Friedman test is the non-parametric alternative to the analysis of variance ANOVA. The samples represent populations with different median values, in a set of k samples, Where k ≥ 2 (Green and Salkind, 2008). The test take into account the dependency among scores introduced by the repeated-measures or matched-subjects characteristics of the design (Green and Salkind, 2008), which is the case in this investigation, as some portfolios depend on the others in their creation. For instance, All Halal (T.A) portfolio is the combination of PH and MH (T.A) portfolios (see section 6.6). This is why Kruskal-Wallis test is not applied in this research, as it assumes independency while Friedman test does not. The values of k variables are ranked from 1 to k for each case, and the mean rank is calculated for each variable over all cases. The test statistic has an approximately chi-square distribution. A single test statistic is calculated, comparing all variables (Boos and Brownie; 1994 and Derrac et al., 2011). The null hypothesis for Friedman’s test considers that there are non-significant differences between the median of populations; where H0: all mean returns are equal, and where H1: at least two mean returns are equal (Green and Salkind, 2008). 167
The sample size is considered large if the number of observations is 30 or more, yet a sample size of 50 or more is recommended if the population distribution is believed to be highly skewed or has outliers (see Anderson et al., 2009).

257
is equal.168
The ANOVA test is conducted for the 19 created portfolios during the whole and
sub sample periods. The test calculates the F-statistic to examine the null hypothesis that there
is no difference in returns, which is estimated as the following equation:
[7.5]
The effect mean square error is the average variation of observations within each group around
the group mean, and the residual mean, square error average variation of the group means
around the grand mean and the ANOVA F-test statistic is the ratio of the two. The test
corresponding P-value is used to determine the significance of the F-statistic. A rejection of the
null hypothesis implies that the performance of at least one portfolio is different.169
Moreover, a paired sample t-test is used to detect whether a Halal portfolio has a significantly
different performance from the other non-Halal portfolios during all sample periods. The null
hypothesis of the paired sample t-test states that the mean returns of the portfolios do not differ
168The Paired-Samples t-test procedure compares the means of two variables for a single group. It computes the differences between the values of the two variables for each case and tests whether the average differs from 0 or not. The paired t-test also solves the multiple comparison problem that could occur due to various comparisons being made at the same time, which could result in the production of statistically significant results merely by chance (Derrac et al., 2011). The t-test was chosen over the post hoc test, such as Bonferroni or Tukey, because neither of them worked due to the large number of comparisons made but a paired t-test is undertaken manually several times to cover all possible portfolio combinations. In addition, it is argued that the t- test is valid even for very small samples if the outcome variable is normally distributed, while it is valid for any distribution if the samples are large (Anderson et al., 2009). 169
The ANOVA results however, should be interpreted with caution because not all of the assumptions are met. The assumptions for the ANOVA are as follows: (1) The observations are assumed to be normally distributed within each group, however, ANOVA is still appropriate if this assumption is not met but the sample size in each group is larger than 30, which is the case as the minimum number of observations for each portfolio for any sample period is 104 (weekly returns for the two years); (2) The variances for responses variable should be the same for all populations (portfolios); (3) The observations must be independent, which is violated in this study because not all 19 portfolios are independent of each other, as stocks in some portfolios are also components of other portfolios. For example; stocks in the PH portfolio are also part of those in All Halal-T.A portfolio and also part of All Halal-M.C portfolio (see section 6.5 of Chapter 6). See Anderson et al. (2009) regarding the assumptions of the ANOVA test.

258
significantly. The test procedure was repeated 190 times, to cover all combinations of portfolio
pairings.170
7.3 Descriptive Statistics
The descriptive statistics for the portfolio returns were conducted before and after halving the
financial screening thresholds. First for 11 portfolios171
and the KSE index in section 7.3.1.
Second, for the 8 other portfolios that are created screening based on halving the financial
screening methodology172
with the CP portfolio and the KSE index in section 7.3.2. This is to
compare the portfolios‘ characteristics before and after halving the financial screening
thresholds is applied. The Shapiro-Wilk (1965) normality test173
was also calculated to
examine whether the Skewness and Kurtosis breached the normality assumption.
7.3.1 Descriptive Statistics before Halving the Financial Screening Criteria
The descriptive statistics are shown in Table 7.1 for the weekly return series of each of the 11
portfolios and the KSE index; the mean, standard deviation, minimum, maximum, skewness,
and kurtosis, during the full sample period (panel A) and three sub-periods (panels B-D).
170
The formula for the number of possible combinations of r objects, which is 2 as the portfolio pairs are compared, from a set of n objects, which is the 19 portfolios plus the KSE index, is computed based on the following equation:
171 Portfolios 1-11 are as shown in section 6.5 in the previous chapter, namely: PH, Sin portfolios and the mixed portfolios (MH and MS) that are screened based on both AAOIFIF's 2004 and 2006 financial screening criteria. 172 The 8 portfolios are 12-19 as shown in section 6.5. These are the mixed portfolios (MH and MS) that are screened based on halving AAOIFIF's 2004 and 2006 financial screening criteria, namely: (1) MH-T.A-Halved; (2) MH-M.C-Halved; (3) MS-T.A-Halved; (4)MS-M.C-Halved; (5) All Halal-T.A-Halved; (6) All Halal-M.C-Halved; (7) All Sin-T.A-Halved, and (8) All Sin-M.C- Halved. 173
The Shapiro and Wilk (1965) test is based on the computed W statistic, the significance is calculated by linearly interpolating within the range of simulated critical values.

259
Table 7.1: Descriptive Statistics for the Weekly Data, Panel A: The Full Sample Period
(2006-2011)
Mean Std.
Deviation
Minimum Maximum Skewness Kurtosis Shapiro-
Wilk
KSE Index -0.0022 0.0235 -0.0984 0.0791 -1.0430 3.0110 0.9230*
CP -0.0012 0.0295 -0.1801 0.0951 -1.4300 7.4700 0.8720*
PH -0.0013 0.0364 -0.2187 0.1293 -1.2120 7.5020 0.8810*
Sin -0.0008 0.0266 -0.1393 0.0761 -0.9730 3.1740 0.9480*
MH-T.A -0.0013 0.0408 -0.2388 0.1471 -1.0900 6.5800 0.9030*
MH M.C -0.0012 0.0399 -0.2417 0.1425 -1.1230 7.1570 0.8950*
All Halal-T.A -0.0013 0.0367 -0.2303 0.1395 -1.2090 7.6380 0.8880*
All Halal-M.C -0.0012 0.0362 -0.2319 0.1368 -1.2250 7.9200 0.8850*
MS-T.A -0.0004 0.0430 -0.1773 0.2189 -0.2070 4.8750 0.9130*
MS-M.C -0.0007 0.0443 -0.1994 0.2160 -0.4380 5.3390 0.9090*
All Sin-T.A -0.0006 0.0281 -0.1404 0.0794 -0.9180 3.2850 0.9430*
All Sin-M.C -0.0007 0.0283 -0.1363 0.0794 -0.9060 3.1770 0.9450*
Panel B: The Bullish Period (2006-2007)
Mean Std.
Deviation
Minimum Maximum Skewness Kurtosis Shapiro-
Wilk
KSE Index 0.0008 0.0219 -0.0862 0.0494 -0.8902 1.8876 0.9770
CP 0.0026 0.0223 -0.0593 0.0563 -0.3501 0.2140 0.9920
PH 0.0022 0.0233 -0.0728 0.0718 -0.2674 0.6648 0.9910
Sin 0.0020 0.0184 -0.0559 0.0465 -0.4588 0.6024 0.9820
MH-T.A 0.0035 0.0305 -0.0621 0.0738 0.1531 -0.2626 0.9840
MH M.C 0.0035 0.0303 -0.0616 0.0750 0.1349 -0.2570 0.9840
All Halal-T.A 0.0030 0.0261 -0.0662 0.0644 -0.0840 -0.1352 0.9880
All Halal-M.C 0.0030 0.0260 -0.0659 0.0651 -0.0878 -0.1201 0.9890
MS-T.A 0.0026 0.0441 -0.1619 0.2189 0.4484 6.5057 0.9370*
MS-M.C 0.0024 0.0440 -0.1641 0.2160 0.3965 6.2442 0.9400**
All Sin-T.A 0.0022 0.0205 -0.0653 0.0568 -0.5788 1.0633 0.9800
All Sin-M.C 0.0021 0.0205 -0.0644 0.0560 -0.5767 0.9821 0.9800
Panel C: The GFC Period (2008-2009)
Mean Std.
Deviation
Minimum Maximum Skewness Kurtosis Shapiro-
Wilk
KSE Index -0.0054 0.0307 -0.0984 0.0791 -0.9160 1.4690 0.9190*
CP -0.0056 0.0444 -0.1801 0.0951 -0.9960 2.5910 0.9320*
PH -0.0057 0.0543 -0.2187 0.1293 -0.8700 2.9740 0.9280*
Sin -0.0061 0.0360 -0.1393 0.0596 -0.7780 1.2220 0.9620*
MH-T.A -0.0057 0.0595 -0.2388 0.1471 -0.9090 2.9070 0.9330*
MH M.C -0.0056 0.0588 -0.2417 0.1425 -0.9090 3.0700 0.9340*
All Halal-T.A -0.0056 0.0545 -0.2303 0.1395 -0.9190 3.1850 0.9280*
All Halal-M.C -0.0055 0.0539 -0.2319 0.1368 -0.9250 3.2880 0.9290*
MS-T.A -0.0050 0.0506 -0.1773 0.1242 -0.7550 2.4820 0.9250*
MS-M.C -0.0058 0.0536 -0.1994 0.1292 -0.9880 3.3660 0.9050*
All Sin-T.A -0.0057 0.0375 -0.1404 0.0708 -0.8460 1.5050 0.9540*
All Sin-M.C -0.0057 0.0377 -0.1363 0.0717 -0.8330 1.4630 0.9550*
Panel D: The Bearish Period (2010-2011) Mean Std.
Deviation
Minimum Maximum Skewness Kurtosis Shapiro-
Wilk
KSE Index -0.0018 0.0147 -0.0467 0.0429 -0.1210 1.3360 0.9720**
CP -0.0006 0.0104 -0.0295 0.0300 -0.0190 0.5670 0.9910
PH -0.0002 0.0214 -0.0793 0.0656 -0.2560 1.9510 0.9680**
Sin 0.0017 0.0213 -0.0724 0.0761 -0.2010 2.0010 0.9720**
MH-T.A -0.0016 0.0219 -0.0766 0.0518 -0.2570 1.3440 0.9720**
MH M.C -0.0015 0.0193 -0.0747 0.0461 -0.4370 2.4300 0.9490*

260
All Halal-T.A -0.0011 0.0189 -0.0660 0.0508 -0.1650 1.3550 0.9770***
All Halal-M.C -0.0011 0.0179 -0.0672 0.0495 -0.2230 1.9190 0.9670**
MS-T.A 0.0014 0.0320 -0.1039 0.1390 0.6980 4.9060 0.9130*
MS-M.C 0.0013 0.0325 -0.0999 0.1352 0.6410 3.8960 0.9360*
All Sin-T.A 0.0017 0.0227 -0.0729 0.0794 0.1640 2.1660 0.9670**
All Sin-M.C 0.0016 0.0231 -0.0715 0.0794 0.1350 1.8570 0.9710**
Note: This Table reports the descriptive statistics for the first11 portfolios and the benchmark (KSE) Index for the
whole sample period in panel A and the three sub-periods in panels B-D. It shows the mean of the weekly returns,
standard deviation, and the minimum and maximum return value for each portfolio. A measure of skewness and
kurtosis is provided in columns 5 and 6 respectively. The last column reports the results of the Shapiro-Wilk
statistics, to test the normality assumption and the significance of the skewness and kurtosis measures. *, **, ***
denote rejection of the normality hypothesis at 1%, 5%, and 10% significance level, respectively.
The 11 portfolios are: (1) CP = control portfolio; (2) PH = pure Halal portfolio; (3) Sin = sin portfolio based on their
core activity; (4) MH-T.A = mixed Halal portfolio based on compliance with AAOIFI‘s 2004 financial criteria; (5)
MH-M.C = mixed Halal portfolio based on compliance with AAOIFI‘s 2006 financial criteria; (6) All Halal-T.A =
combination portfolio of PH and MH-T.A; (7) All Halal-M.C = combination portfolio of PH and MH-M.C; (8) MS-
T.A = mixed sin portfolios based on non-compliance with AAOIFI‘s 2004 financial criteria; (9) MS-M.C = mixed sin
portfolios based on non-compliance with AAOIFI‘s 2006 financial criteria; (10) All Sin-T.A = combination portfolio
of Sin and MS-T.A; (11) All Sin-M.C = combination portfolio of Sin and MS-M.C.
A number of interesting findings emerge from a visual inspection of Table 7.1. First, it
provides strong evidence of non-normally distributed returns for the vast majority of the
sample periods. Second, the portfolios‘ returns are negatively skewed to the left, with long tails
in the full period, except in the bullish period 2006-2007, when they are positive, followed by
very negative returns in the GFC period with a flattering picture thereafter. Furthermore, the
kurtosis that measures the peak (leptokurtic) or flatness (platykurtic) of the distribution of the
series shows that 8 portfolios in panel A for the full period have coefficients higher than 3,
indicating distributions with tails thicker than normal. This finding is similar to that of Al-
Bassam (2007) and AlMujamed (2011) who found that the returns of companies in KSE are
not normally distributed and are skewed174
. The negatively skewed returns in this study are
mainly due to the impact of the GFC. The descriptive statistics also show that the performance
of all of the portfolios is similar and moves in the same direction as the KSE market index.
Further, the performance of all portfolios has converged during the crisis, as reported in Table
7.1 Panel D. The considerably high standard deviations in comparison with the mean returns
during the GFC period show wild swings in stock prices and are reflected in the spread
174
Al-Bassam (2007) sample period was from 1992 to 2005, while AlMujamed (2011) was from 1998-2008.

261
between the minimum and maximum values of the portfolios‘ returns. It is worth noting that
mixed portfolios (MH-T.A, MH-M.C, MS-T.A, and MS-MC) recorded the highest standard
deviations during all periods. These only include non-financial companies,175
and cover fewer
sectors, so were less diversified. Figure 7.2 shows the performance of the selected portfolios,
with a starting index at 100 on 04/01/2006 during 2006-2011.
Figure 7.2: The Performance of 8 selected Portfolios during the Full Sample Period
(2006-2011)
Note: This figure plots the performance of the KSE market index and 8 selected portfolios, indexed from 100 at
04/01/2006. The portfolios are CP = control portfolio, PH = pure Halal portfolio, Sin = sin portfolios based on
their core activity (qualitative screening), MH-TA = mixed Halal portfolio based on compliance with AAOIFI‘s
2004 financial screening criteria, MH-M.C = mixed Halal portfolio based on compliance with AAOIFI‘s 2006
financial screening criteria, MS-T.A = mixed sin portfolio, based on non-compliance with AAOIFI‘s 2004
financial screening criteria, and MS-M.C = mixed sin portfolio, based on non-compliance with AAOIFI‘s 2006
financial screening criteria.
Figure 7.2 show that the portfolios moved closely each other. Prior to the GFC period, all
portfolios perform well but, in the last quarter of 2008, the global financial conditions
deteriorated sharply, affecting the KSE just like the other GCC stock markets (see Chapter 2).
The interview analysis in chapter 5 revealed that the crisis had a strong impact on GCC
175
Financial companies cannot be mixed, because their core business is financial intermediation that is either Halal or Haram (sin), see chapter 6 for details.
35
45
55
65
75
85
95
105
115
125
135
145
155
4/1/2006 4/1/2007 4/1/2008 4/1/2009 4/1/2010 4/1/2011
KSE Index CP PH Sin MH-TA MH-M.C MS-T.A MS-M.C

262
countries, as their financial and banking systems are integrated with those of the USA and
Europe. Figure 7.2 reveals that the performance of all portfolios converged during the two
years of GFC and afterwards. This finding is consistent with the literature that finds that, in the
pre-crisis period, investors benefited from diversifying their portfolios across Islamic and
conventional stocks but that, during the crisis, they were more integrated; thus, there existed
fewer diversification benefits (Hengchao and Hamid, 2011).The downturn of the GFC was
broad, affecting the whole stock market, as demonstrated in Table 7.1.The raw returns of all
the portfolios that were positive during 2006 and 2007 turned into huge negative returns in
2008 and 2009 for all portfolios until the end of the sample period, apart from some non-Halal
portfolios, that showed better performance after the crisis compared to the Halal group
portfolios. However, mixed Halal portfolios176
registered the best performance before the GFC
period, outperforming KSE, CP and all other portfolios.
Another finding from Table 7.1 is the impact of applying different financial screening criteria
in the creation of portfolios‘ performance. The AAOIFI‘s changes from the 2004 financial
screening criteria to the 2006 criteria reduced the number of MH stocks, specifically after the
GFC period177
. However, this did not seem to have an impact on the performance of the MH
(MH-TA and MH-M.C) and MS portfolios screened via these two different methods, except
during the post-GFC (the bearish period). Figure 7.3 below illustrates this finding visually.
176 The Mixed Halal portfolios are namely the MH-T.A and MH-M.C. 177
Table 6.2 reports the MH and MS under the AAOIFI's 2004 and 2006 financial criteria and shows the difference between the two classifications.

263
Figure 7.3: The Performance of Mixed Halal and Mixed Sin Portfolios during the Full
Sample Period (2006-2011)
Note: This figure plots the performance of 4 mixed Halal and mixed sin portfolios, indexed at 100 from
04/01/2006-28/12/2011. The portfolios are MH-TA = mixed Halal portfolio based on compliance with AAOIFI‘s
2004 financial screening criteria, MH-M.C = mixed Halal portfolio based on compliance with AAOIFI‘s 2006
financial screening criteria, MS-T.A = mixed sin portfolio, based on non-compliance with AAOIFI‘s 2004
financial screening criteria, and MS-M.C = mixed sin portfolio, based on non-compliance with AAOIFI‘s 2006
financial screening criteria.
Figure 7.3 shows that the performance of MH portfolios is almost identical during all periods,
because including or excluding a few small or medium stocks under the different financial
screening criteria does not have a significant impact on their performance, as the size and
number of stocks is small relative to that of those in the portfolios. The performance of the
MS-T.A and MS-M.C portfolios started to diverge slightly after the crisis period, with the MS-
TA outperforming the MS-M.C portfolio. Although there are more MS stocks in the MS-MC
portfolio compared to the MS-T.A one, their total market value is similar, indicating that the
stocks in the MS-M.C are smaller. The performance gap between the two portfolios is mainly
35
55
75
95
115
135
155
4/1/2006 4/1/2007 4/1/2008 4/1/2009 4/1/2010 4/1/2011
MH-TA MH-M.C MS-T.A MS-M.C

264
due to the two large-sized stocks, namely; Agility178
and the Kuwait food company
Americana.179
Agility, that was included only in the MH-M.C portfolio in 2010, with a
weighting of 8% of the total portfolio, performed badly, pulling the overall portfolio down.
Americana was only included in the MS-T.A portfolio in 2011, comprising 25% of its market
value, and did well that year, pulling up the overall portfolio‘s performance.
Figure 7.4 below shows the performance of three Halal portfolios: PH, All Halal-T.A and All
Halal-M.C, benchmarked against the CP and KSE. These three Halal portfolios were chosen
because they present all types of Islamic funds in Kuwait, whereas the PH portfolio is a proxy
for Islamic funds that only invest in PH stocks, the All Halal-T.A presents Islamic funds that
invest in both PH and MH stocks that are screened based on AAOIFI‘s 2004 financial criteria,
and the All Halal-M.C presents Islamic funds that invest in both PH and MH stocks that are
screened based on AAOIFI‘s 2006 financial criteria. This was to examine whether Islamic
funds that invest only in PH stocks could perform as well as those that include MH as well.
Further, it was to investigate the impact of using different screening criteria on Islamic funds‘
performance. Portfolios are compared against each other and against CP and KSE index
benchmarks as well, because the chapter also attempts to investigate whether there are
penalties imposed on Islamic investments compared to conventional investments that are not
restricted to any religious or ethical guidelines.180
178
Agility was established in 1979 and listed on the Kuwaiti Stock Exchange in the service sector in 1984 and on the Dubai Financial Market (DFM) in 2006. In 1997, the government sold all of its shares in the company. The company provides supply chain solutions, including: logistics capabilities: warehousing and distribution, systems and technology (http://www.agilitylogistics.com/EN/Pages/Landing.aspx). 179
The Kuwait food company (Americana) was established in 1963 and listed on the Kuwaiti Stock Exchange in the food sector in 1984. The company’s main lines of business are operating food and beverage outlets, as well as manufacturing food products. It is considered the largest operator of restaurant chains and franchise operators in the MENA region (http://www.americana-group.net/Homepage.aspx). 180
Conventional investment funds are represented in the study by CP, and KSE index is also employed because it reflects the whole market, including the non-Kuwaiti sector, that is included in the CP.

265
Figure 7.4: The Performance of Halal-Based Portfolios during the Full Sample Period
(2006-2011)
Note: This figure plots the performance of the KSE market index and CP with 3 Halal portfolios, indexed at 100
from 4/1/2006-28/12/2011. The Halal portfolios are: PH = pure Halal portfolio, All Halal-TA = PH stocks and
mixed Halal stocks based on compliance with AAOIFI‘s 2004 financial screening criteria, and All Halal-M.C =
PH stocks and mixed Halal stocks based on compliance with AAOIFI‘s 2006 financial screening criteria.
Figure 7.4 shows that the PH portfolio underperforms the two other Halal portfolios and CP,
but recorded its highest returns just before the crisis and the first two quarters of 2008; these
returns did not persist after the global crisis period. Nevertheless, all three Halal portfolios
were able to beat the KSE index during the overall sample period. The All Halal-T.A and All
Halal-M.C were tracking the performance of CP during the overall and GFC period, but did
better during the bullish period and somewhat better during the bearish period. Figure 7.4 also
confirms that the two different AAOIFI‘s financial criteria appeared to have an insignificant
impact on the performance of Islamic funds screened under the two methods, since the
performance of the All Halal-T.A portfolio and the All Halal-M.C portfolio was similar.
40
60
80
100
120
140
4/1/2006 4/1/2007 4/1/2008 4/1/2009 4/1/2010 4/1/2011
KSE Index CP PH All Halal-T.A All Halal-M.C

266
7.3.2 Descriptive Statistics after Halving the Financial Screening Criteria
The above descriptive statistics and figures analyze the portfolios and KSE index under the
AAOIFI‘s 2004 and 2006 financial screening. This section analyzes the 8 portfolios that are
screened by halving AAOIFI‘s financial screening thresholds. Table 7.2 reports the descriptive
statistics for these new portfolios, using the CP portfolio and the KSE market index as
benchmarks.
Table 7.2: Descriptive Statistics for Portfolios after Halving AAOIFI’s Financial Criteria
Panel A: The Full Period (2006-2011)
Mean Std.
Deviation
Minimum Maximum Skewness Kurtosis Shapiro-
Wilk
KSE Index -0.0022 0.0235 -0.0984 0.0791 -1.0420 3.0100 0.9230*
CP -0.0012 0.0295 -0.1801 0.0951 -1.4300 7.4710 0.8720*
MH.T.A (Halved) -0.0025 0.0454 -0.2557 0.1556 -1.2380 7.2090 0.8930*
MH.M.C(Halved) -0.0022 0.0444 -0.2582 0.1567 -1.0550 6.9010 0.8990*
All Halal-TA(Halved) -0.0016 0.0334 -0.1590 0.1121 -1.2040 5.1250 0.9120*
All Halal-
MC(Halved)
-0.0016 0.0376 -0.2403 0.1443 -1.1720 7.8380 0.8890*
MS-TA(Halved) 0.0000 0.0363 -0.1568 0.1161 -0.5980 3.8310 0.9230*
MS-MC(Halved) 0.0001 0.0380 -0.1660 0.1605 -0.5110 4.0720 0.9260*
All Sin-T.A(Halved) -0.0008 0.0262 -0.1143 0.0759 -0.9400 3.2780 0.9400*
All Sin-M.C(Halved) -0.0005 0.0281 -0.1343 0.0765 -0.9980 3.4350 0.9370*
Panel B: The Bullish Period (2006-2007)
Mean Std.
Deviation
Minimum Maximum Skewness Kurtosis Shapiro-
Wilk
KSE Index 0.0008 0.0220 -0.0862 0.0494 -0.8900 1.8870 0.9480*
CP 0.0026 0.0224 -0.0593 0.0563 -0.3490 0.2130 0.9840
MH.T.A (Halved) 0.0036 0.0337 -0.0754 0.0852 0.1100 -0.0180 0.9880
MH.M.C(Halved) 0.0035 0.0340 -0.0656 0.0813 0.2870 -0.3330 0.9810
All Halal-TA(Halved) 0.0030 0.0255 -0.0728 0.0626 -0.1870 -0.0020 0.9920
All Halal-
MC(Halved)
0.0028 0.0266 -0.0674 0.0677 -0.0190 -0.2040 0.9930
MS-TA(Halved) 0.0027 0.0305 -0.0761 0.0876 -0.0100 0.7420 0.9790***
MS-MC(Halved) 0.0032 0.0365 -0.1173 0.1605 0.1160 3.6770 0.9410*
All Sin-T.A(Halved) 0.0023 0.0220 -0.0591 0.0542 -0.4090 0.5440 0.9740**
All Sin-M.C(Halved) 0.0025 0.0211 -0.0649 0.0578 -0.5990 0.9370 0.9630*

267
Panel C: The GFC Period (2008-2009) Mean Std.
Deviation
Minimum Maximum Skewness Kurtosis Shapiro-
Wilk
KSE Index -0.0054 0.0307 -0.0984 0.0791 -0.9160 1.4680 -0.9160*
CP -0.0056 0.0444 -0.1801 0.0951 -0.9960 2.5910 -0.9960*
MH.T.A (Halved) -0.0075 0.0666 -0.2557 0.1556 -1.0100 3.1240 -1.0100*
MH.M.C(Halved) -0.0069 0.0649 -0.2582 0.1567 -0.8890 3.0780 -0.8890*
All Halal-
TA(Halved)
-0.0060 0.0478 -0.1590 0.1121 -1.0120 2.1870 -1.0120*
All Halal-
MC(Halved)
-0.0060 0.0561 -0.2403 0.1443 -0.8780 3.2300 -0.8780*
MS-TA(Halved) -0.0041 0.0477 -0.1568 0.1146 -0.7740 2.3040 -0.7740*
MS-MC(Halved) -0.0041 0.0468 -0.1660 0.1096 -0.9160 2.7180 -0.9160*
All Sin-T.A(Halved) -0.0060 0.0335 -0.1143 0.0611 -1.0740 1.9460 -1.0740*
All Sin-M.C(Halved) -0.0055 0.0375 -0.1343 0.0686 -0.9210 1.6360 -0.9210*
Panel D: The Bearish Period (2010-2011)
Mean Std.
Deviation
Minimum Maximum Skewness Kurtosis Shapiro-
Wilk
KSE Index -0.0018 0.0147 -0.0467 0.0429 -0.1230 1.3400 0.9720**
CP -0.0006 0.0104 -0.0295 0.0299 -0.0190 0.5630 0.9910
MH.T.A (Halved) -0.0034 0.0237 -0.1026 0.0591 -0.6410 2.9200 0.9520*
MH.M.C(Halved) -0.0032 0.0226 -0.0977 0.0526 -0.6050 2.7300 0.9520*
All Halal-TA(Halved) -0.0016 0.0197 -0.0668 0.0524 -0.1440 1.0390 0.9790
All Halal-MC(Halved) -0.0015 0.0190 -0.0661 0.0526 -0.1780 1.2950 0.9780***
MS-TA(Halved) 0.0014 0.0270 -0.0767 0.1161 0.7700 4.5950 0.9170*
MS-MC(Halved) 0.0012 0.0284 -0.0776 0.1176 0.6950 3.7860 0.9350*
All Sin-T.A(Halved) 0.0014 0.0205 -0.0588 0.0759 0.4880 2.4830 0.9590*
All Sin-M.C(Halved) 0.0015 0.0221 -0.0719 0.0765 0.1170 2.1510 0.9660*
Note: This Table reports the descriptive statistics for the 8 portfolios, screened using AAOIFI‘s halved financial
criteria, with the CP and the KSE market Index as benchmarks for the full sample period in panel A and the
three sub-periods in panels B-D. It shows the mean of the weekly returns for each portfolio, the standard
deviation, the minimum and the maximum return values. A measure of skewness and kurtosis is provided in
columns 5 and 6 respectively. The last column reports the results of the Shapiro-Wilk statistics, to test the
normality assumption and the significance of the Skewness and Kurtosis measures. *, **, *** denote rejection of
the normality hypothesis at 1%, 5%, and 10% significance level, respectively.
The portfolios are: (1) CP = control portfolio; (2) MH-T.A (Halved) = mixed Halal portfolio based on the
compliance with halved AAOIFI‘s 2004 financial criteria; (3 )MH-M.C (Halved) = mixed Halal portfolio based
on the compliance with halved AAOIFI‘s 2006 financial criteria; (4) All Halal-T.A (Halved) = combination
portfolio of PH and MH-T.A (Halved); (5) All Halal-M.C (Halved) = combination portfolio of PH and MH-M.C
(Halved); (6) MS-T.A (Halved) = mixed sin portfolios based on non-compliance with the halved AAOIFI‘s 2004
financial criteria; (7) MS-M.C (Halved) = mixed sin portfolios based on non-compliance with the halved
AAOIFI‘s 2006 financial criteria; (8) All Sin-T.A = combination portfolio of Sin and MS-T.A (Halved); and (9)
All Sin-T.A (Halved) = combination portfolio of Sin and MS-M.C (Halved).
Similarly to Table 7.1, Table 7.2 shows that the portfolios‘ returns are not normally distributed,
but negatively skewed. The returns of all portfolios are moving with the KSE market index and
the CP portfolio. However, the greatest deviations among the portfolios‘ returns is seen after
the GFC period, as revealed in panel D. Table 7.2 shows that halving the financial screening
methodology favors MS-T.A and MS-M.C but not MH-T.A and MH-M.C. For instance, for

268
the whole sample period, the mean returns for the MS-T.A and MS-M.C improve, from -0.04
percent and -0.07 respectively in Table 7.1 to 0.00 percent and 0.01 percent respectively in
Table 7.2, and the risk level decreases from 4.29 percent and 4.43 percent in Table 7.1 to 3.63
percent and 3.8 percent respectively in Table 7.2. Under this halving methodology, more stocks
from different, non-financial sectors became non-compliant and moved from being in the MH-
T.A and MH-M.C portfolios to the MS-T.A and MS-M.C portfolios, which improves the MS
diversification as reflected by their standard deviations. For instance, the stocks of companies
like Agility, National Mobile Telecommunication, Kuwait Food, Kuwait Cement, Gulf Cable
and Electrical Industries, Mabanee Real Estate, and Boubyan Petrochemicals are often
unavailable to Halal investors (see Table 6.7 in the previous chapter).
Table 7.2 affirms that the halving the AAOIFI‘s financial screening criteria did not create a
significant difference between using AAOIFI‘s 2004 and 2006 criteria during the bullish and
crisis periods, similar to Table 7.1. Figures 7.4 below demonstrates some of these findings
visually.

269
Figure 7.5: The Performance of 5 Selected Portfolios and the KSE Index during the Full
Sample Period (2006-2011)
Note: This figure plots the performance of 4 selected portfolios after halving the AAOIFI‘s 2004 and 2006
financial screening criteria and CP and KSE index as benchmarks, indexed at 100 from 4/1/2006-28/12/2011.The
portfolios are as follows: (1) CP = control portfolio; (2) MH-TA = mixed Halal stocks based on compliance with
the halved AAOIFI‘s 2004 financial screening criteria; (3) MH-M.C = mixed Halal stocks based on compliance
with the halved AAOIFI‘s 2006 financial screening criteria; (4) MS-M.C = mixed sin stocks that are non-
compliant with the halved AAOIFI‘s 2004 financial screening criteria ;and (5) MS-M.C = mixed sin stocks that
are non-compliant with the halved AAOIFI‘s 2006 financial screening criteria.
Figure 7.5 reveals that MH-T.A (Halved) and MH-M.C (Halved) outperformed the KSE index,
CP, MS-T.A (Halved) and the MS-M.C (Halved) in the bullish period, but this trend did not
persist, as the bigger, more profitable companies changed into MS stocks. It also shows the
change in the performance between the MH and MS portfolios during the crisis and bearish
periods. The gap in performance during the bearish period shows that halving the financial
screening methodology has penalized the MH portfolios compared to MS ones. The situation
was worse due to the impact of the GFC.181
181
For example, the number of MH stocks compliant with the halved AAOIFI's 2004 criteria dropped down from 54, under the original criteria, to 18 with a dramatic loss in market value from 4.266 billion to 851 million K.D (See Tables 6.5 and 6.9).
30
50
70
90
110
130
150
170
4/1/2006 4/1/2007 4/1/2008 4/1/2009 4/1/2010 4/1/2011
KSE Index CP MH-TA(Halved)
MH-M.C(Halved) MS-T.A(Halved) MS-MC(Halved)

270
Figure 7.6 below visualizes the performance of 3 selected Halal-based portfolios, namely: PH,
All Halal-M.C; All Halal-M.C (Halved); with the CP and the KSE index as a benchmark, to
examine the impact of the halved financial screening criteria on Islamic funds182
that invest in
MH investments183
and investors who wish to follow the stricter Shariah-compliant screening.
The performance of MH-T.A and MH-M.C, and the performance of MH-T.A (Halved) and
MH-M.C (Halved) were almost identical during all sample periods, as shown in Figures 7.4
and 7.5 respectively. AAOIFI‘s 2006 criteria were chosen to be applied to MH portfolios in
Figure 7.6 for simplicity.
Figure 7.6: The Performance of Halal-Based Portfolios after Halving the AAOIFI’s 2006
Financial Screening Criteria during the Full Sample Period (2006-2011)
Note: This figure plots the performance of 3 selected Halal portfolios, with KSE and CP as benchmarks, indexed
at 100 from 4/1/2006 – 28/12/2011.The Halal portfolios are PH = pure Halal portfolio, All Halal-M.C = PH
stocks and mixed Halal stocks based on compliance with the AAOIFI‘s 2006 financial screening criteria, All
Halal-M.C (Halved) = PH stocks and mixed Halal stocks based on compliance with the halved AAOIFI‘s 2006
financial screening criteria, and CP = control portfolio.
182
The All Halal-M.C portfolio is the proxy for Islamic funds that allow investment in PH stocks and MH stocks that are screened based on AAOIFI's 2006 financial screening criteria, and the All Halal-M.C (Halved) is the proxy for Islamic funds that allow investing in PH stocks and MH stocks that are screened based on the halved AAOIFI's 2006 financial screening criteria, as defined in section 6.5 in the previous chapter. 183
Islamic funds that invest only in PH stocks will not be affected by halving the financial screening thresholds.
40
60
80
100
120
140
4/1/2006 4/1/2007 4/1/2008 4/1/2009 4/1/2010 4/1/2011
KSE Index CP PH All Halal-M.C All Halal-M.C(Halved)

271
Figure 7.6 shows that Islamic funds and investors who wish to follow the proposed tightened
Shariah-compliant screening guidelines do not have to sacrifice returns during bullish and
crisis periods, as the performance of the All Halal-M.C (Halved) portfolio is similar to that of
the All Halal-M.C and CP portfolios. However, their performance started to diverge to some
extent during the bearish period. This suggests that the halved screening thresholds might not
have a significant impact on the performance of Islamic funds if they apply the new screening
guidelines before the crisis period, contrary to the expectations of many of the interviewees in
Chapter 5. In fact, the All Halal-M.C (Halved) portfolio outperformed the KSE index during
the whole and sub periods, apart from the crisis period. This supports the idea proposed by the
interviewees, especially the Shariah scholars in chapter 5, of reducing the financial screening
thresholds in order to take a step closer to an ideal Islamic investment principle and, without
the occurrence of the GFC, the results may have been even better. This also confirms the
interviewed Islamic fund managers‘ concerns regarding the timing of such a decision due to
the impact of the GFC. The chapter continues with the statistical analysis examining the
difference in the portfolios‘ returns.
7.4 Analysis of the Portfolios’ Return Performance
This section further investigates whether differences in portfolio performance are statistically
significant. From the Shapiro-Wilk statistics reported in Tables 7.1 and 7.2, many of the
portfolios‘ returns appeared to be not normally distributed over the full, crisis, and bearish
periods, although the bullish period was normally distributed. As a result, the parametric
analysis of variance (ANOVA) test is used to detect significant differences between the means
of the portfolio returns but, as a robustness check, to detect any significant differences between
the median of all the portfolios returns, the non-parametric Friedman test (1937) is also
adopted. The ANOVA test is conducted for the 19 created portfolios during the whole and the

272
sub sample periods. The test‘s corresponding P-value is used to determine the significance of
the F-statistic. Table 7.3 provides the results of the ANOVA test for all 19 portfolios and the
KSE market index (20 in total).
Table 7.3: The Analysis of Variance (ANOVA) Results for all 19 portfolios
Panel A: The Whole Sample Period (2006-2011)
Source of
Variation
Degrees of
Freedom
Sum of
Squares
Mean Square F- Statistic P-value
Factor 19.000 0.003 0.000 0.120 1.000
Error 6240.000 7.982 0.001 --- ---
Total 6259.000 7.985 --- --- ---
Panel B: The Bullish Period (2006-2007)
Source of
Variation
Degrees of
Freedom
Sum of
Squares
Mean Square F- Statistic P-value
Factor 19.000 0.001 0.000 0.050 1.000
Error 2060.000 1.723 0.001 --- ---
Total 2079.000 1.724 --- --- ---
Panel C: The GFC Period (2008-2009)
Source of
Variation
Degrees of
Freedom
Sum of
Squares
Mean Square F- Statistic P-value
Factor 19.000 0.001 0.000 0.020 1.000
Error 2080.000 5.133 0.002 --- ---
Total 2099.000 5.134 --- --- ---
Panel D: The Bearish Period (2010-2011)
Source of
Variation
Degrees of
Freedom
Sum of
Squares
Mean Square F- Statistic P-value
Factor 19.000 0.006 0.000 0.610 0.904
Error 2060.000 1.047 0.001 --- ---
Total 2079.000 1.052 --- --- ---
Note: This Table reports the analysis of variance ANOVA‘s results for the 19 portfolios and the KSE index
during the whole period in panel A, and the three sub periods in panels B-D. The test investigates the difference
between the mean returns of the portfolios.
Table 7.3 shows that there is no evidence for rejecting the null hypothesis, as the P-values
provided for the F-statistic were very high, indicating that the performance of all 19 portfolios
during all sample periods were not significantly different from each other or from the KSE

273
index. Figure 7.7 compares all of the mean returns of the 19 portfolios during the bearish
period through a box plot.184
Figure 7.7: Box Plot of the 19 Portfolios for the Full Sample Period (2006-2011)
All S
in (M
.C)
All Si
n (T
.A)
MS
(M.C
)
MS (
T.A)
All Ha
lal (
M.C
)
All H
alal (T.A
)
MH(M
.C)
MH(T
.A)
All Sin-
M.C
(Halve
d)
All S
in-T
.A(H
alve
d)
MS-M
C(Halve
d)
MS-
T.A(H
alve
d)
All Hal
al-M
.C(H
alve
d)
All Ha
lal-T
.A(H
alve
d)
MH-T
.A(H
alve
d)_1
MH-T
.A(H
alve
d)SinPHCP
KSE
Inde
x
0.2
0.1
0.0
-0.1
-0.2
-0.3
Da
ta
Note: This Figure shows a box plot that graphically summarizes the weekly returns data for the 19 portfolios
and the KSE index for the whole sample period. Each box shows the median, quartiles, and extreme values
within that portfolio. The line between the boxes links the groups (portfolios and KSE index) means.
Figure 7.7 confirms Table‘s 7.3 results that there are no significant differences between the
portfolios or the KSE index. The alternative non-parametric Friedman test is shown in Table
7.4.
184
A box plot was created for all sub periods but, because the results were almost identical, they are not displayed.

274
Table 7.4: The Friedman’s Test Results for the 19 Portfolios
Portfolios
The Whole
Period
2006-2011
The Bullish
Period
2006-2007
The GFC Period
2008-2009
The Bearish
Period
2010-2011
Mean Rank Mean Rank Mean Rank Mean Rank
KSE Index 10.07 10.21 10.75 9.25
CP 10.53 10.78 10.60 10.19
PH 10.47 10.36 9.93 11.14
Sin 10.97 11.03 10.37 11.50
MH-TA 10.32 10.65 10.60 9.70
MH-MC 10.38 10.59 10.70 9.85
All Halal(T.A) 10.40 10.58 10.35 10.26
All Halal-M.C 10.41 10.52 10.44 10.25
MS-T.A 10.29 9.52 10.40 10.94
MS-M.C 10.24 9.47 10.17 11.07
All Sin-T.A 10.91 10.86 10.40 11.47
All Sin-M.C 10.85 10.81 10.22 11.52
MH-T.A (Halved) 10.08 10.61 10.51 9.12
MH-M.C (Halved) 10.27 10.58 10.86 9.37
All Halal-T.A(Halved) 10.58 11.01 10.60 10.13
All Halal-M.C(Halved) 10.53 10.99 10.41 10.18
MS-TA (Halved) 10.59 10.12 10.75 10.90
MS-MC (Halved) 10.53 10.08 10.80 10.73
All Sin-T.A(Halved) 10.63 10.45 10.33 11.12
All Sin-M.C(Halved) 10.96 10.78 10.79 11.31
Test Statistics
N 313 104 105 104
Chi-Square 12.016 10.997 3.322 34.029
Df 19 19 19 19
Sig. .885 .924 1.000 .018
Note: The table shows the results of the Friedman test for the differences between the median of the portfolios‘
means during the whole sample period as well as the three sub-periods. N indicates the number of observations,
the test is based on the Chi-square distribution, df is the degree of freedom for the test and the last row is the P-
value for the test.
Table 7.4 reveals that that there is insufficient evidence to reject the null hypothesis for the
whole, the bullish, and the GFC periods, but interestingly the null hypothesis was rejected for
the bearish period, indicating that there is at least one portfolio that differs in performance from
the others. To further investigate the result of the Friedman test during the bearish period, the
procedure was repeated for the Halal portfolios only: PH, All Halal-T.A, All Halal-M.C, All

275
Halal-T.A (Halved), and All Halal-M.C(Halved) with the CP and KSE market index, as shown
in Table 7.5, to see whether the Halal portfolios vary from each other and from the CP and
KSE index during the bearish period, because this is what interests Halal investors and Islamic
funds.
Table 7.5: The Friedman’s Test Results for 6 Halal-Based Portfolios during the Bearish
Period
The Bearish Period (2010-2011)
Mean Rank
KSE Index 3.66
CP 4.02
PH 4.35
All Halal(T.A) 4.07
All Halal-M.C 4.11
All Halal-T.A(Halved) 3.87
All Halal-M.C(Halved) 3.93
N 104
Chi-Square 6.210
Df 6
Sig. 0.400
Note: This Table shows the results of the Friedman test of the difference between the median of the Halal-based
portfolios, the CP and the KSE index means returns during the bearish period. N indicates the number of
observations, the test is based on the Chi-square distribution, df is the degree of freedom for the test and the last
row is the p-value for the test.
Table 7.5 shows that that there is no statistical difference between these Halal-based portfolios
and the KSE index and CP benchmarks. Thus, Islamic funds and investors who wish to invest
only in Halal- securities in Kuwait do not have to sacrifice their returns, even when halving
their financial screening thresholds. This finding is consistent with that found in Table 7.3 of
the ANOVA results and with Figure 7.6 in the previous section. Furthermore, the small
performance gaps seen in Figure 7.6 between the PH, All Halal-M.C, All Halal-M.C (Halved)
portfolios are not statistically significant different from each other, asserting that there is no
performance penalty on Islamic funds that only invest in PH, or those that adopt the AAOIFI‘s

276
screening or wish to apply the AAOIFI‘s halved screening thresholds, including the bearish
period.
Although the parametric and non-parametric statistical tests confirm that the performance of
the Halal-based portfolios is not statistically different from each other and the benchmarks,185
a
paired sample t-test was used to detect whether a Halal portfolio in Table 7.5 has significantly
different performance from the other non-Halal portfolios‘ during the bearish period. The null
hypothesis of the paired sample t-test states that the mean returns of the portfolios do not
significantly differ from each other. The test procedure was repeated 190 times, to cover all
combinations of portfolios pairings.186
The results of the test show that none of the values are
significant for the full, bullish, or crisis periods, although some significant values were
detected in the bearish period only, as shown in Table 7.6. The results for the paired sample t-
test for the other periods are reported in Appendix 7.1-7.3.
185
The present study attempts to understand the portfolios from the Halal- based investors' perspective. 186
The formula for the number of possible combinations of r objects, which is 2, as portfolio pairs are compared, from a set of n objects, which are the 19 portfolios plus the KSE index, is computed based on the following equation:

277
Table 7.6: The Paired Sample T – Statistics for Comparison between Row and Column Portfolios during the Bearish Period
KS
E
CP
PH
Sin
MH
-T.A
(H
)
MH
-M.C
(H
)
All
Hala
l-T
A(H
)
All
Hala
l-M
.C(H
)
MS
-TA
(H)
MS
-M.C
(H)
All
Sin
-T.A
(H)
All
Sin
-M.C
(H)
MH
-TA
MH
-MC
All
Hala
l-T
.A
All
Hala
l-M
.C
MS
(T
.A)
MS
(M
.C)
All
Sin
(T.A
)
CP -0.98
PH -0.83 -0.22
Sin -1.87* -1.34 -1.26
MH-T.A (H) 0.72 1.48 1.30 2.10**
MH-M.C (H) 0.63 1.40 1.18 1.98* -0.29
All Halal-TA(H) -0.14 0.70 1.36 2.14** -1.10 -0.89
All Halal-M.C(H) -0.20 0.65 1.30 2.11** -1.15 -0.97 -0.54
MS-TA(H) -1.49 -0.90 -0.68 0.13 -1.78* -1.61 -1.32 -1.27
MS-M.C(H) -1.32 -0.77 -0.57 0.22 -1.71* -1.51 -1.21 -1.15 0.56
All Sin-T.A(H) -1.94* -1.21 -0.76 0.15 -1.86* -1.72* -1.48 -1.44 -0.02 -0.15
All Sin-M.C(H) -1.88* -1.21 -1.02 0.19 -2.10* -1.89* -1.92* -1.85* -0.06 -0.24 -0.03
MH-TA -0.12 0.62 0.66 1.56 -1.37 -1.10 0.02 0.09 1.57 1.46 1.49 1.83*
MH-MC -0.21 0.62 0.61 1.58 -1.66 -1.42 -0.08 -0.01 1.44 1.31 1.45 1.75* -0.21
All Halal-T.A -0.47 0.37 0.78 1.81* -1.44 -1.22 -1.00 -0.81 1.27 1.14 1.36 1.88* -0.51 -0.36
All Halal-M.C -0.51 0.36 0.77 1.86* -1.48 -1.28 -1.26 -1.10 1.22 1.08 1.34 1.82* -0.48 -0.41 -0.15
MS (T.A) -1.19 -0.71 -0.54 0.13 -1.50 -1.35 -1.05 -1.01 0.07 -0.20 0.05 0.08 -1.18 -1.10 -0.96 -0.93
MS (M.C) -1.18 -0.71 -0.55 0.14 -1.54 -1.37 -1.08 -1.03 0.09 -0.21 0.05 0.09 -1.25 -1.12 -0.99 -0.95 0.02
All Sin(T.A) -1.87* -1.24 -1.08 0.03 -2.07** -1.88* -1.91* -1.85* -0.21 -0.36 -0.17 -0.71 -1.74* -1.69* -1.80* -1.77* -0.19 -0.20
All Sin(M.C) -1.83* -1.19 -1.05 0.09 -2.05** -1.85* -1.88* -1.81* -0.15 -0.32 -0.12 -0.52 -1.74* -1.65 -1.79* -1.73* -0.15 -0.17 0.39
Note: This table reports the t-statistic test for comparison between the row and column portfolios of the paired sample t-test for the 190 possible combinations during the
bearish period.
* Significant at the 10% level. ** Significant at the 5% level.

278
The paired sample t-test results in Table 7.6 show that there exists evidence to reject the null
hypothesis for 5 pairs at a 5% significance level during the bearish period, indicating that the
mean returns are different between the pairs for 5 Halal portfolios based on the halved
financial screening thresholds and the non-Halal portfolios.187
This highlights the impact of
halving the financial screening thresholds if such portfolios are benchmarked against the non-
Halal portfolios during the bearish period. Furthermore, there is also weak evidence to show
that the differences between the mean returns of 33 portfolios are significant, since the null
hypothesis is rejected at a 10% significant level. For instance, the mean returns for some non-
Halal portfolios [Sin, All Sin-T.A, All Sin-MC, All Sin-T.A (H), and All Sin-MC (H)] were
different from the KSE index. This consistent with finding of Fabozzi et al. (2008), Hong and
Kacpercyzk (2009), and Liston and Soydemir (2010) who find that ‗sin‘ stocks earn higher
risk-adjusted returns. Particularly, it supports the finding of Salaber (2007) who indicates that
tobacco and alcohol sin stocks recorded higher returns during recessions than in expansions.
The results of Table 7.6 also provide robust statistical evidence that the mean returns for all of
the Halal portfolios are similar to the KSE market index and CP under the 5% and 10%
significance levels. Therefore, there will be no penalty for Islamic funds, even if they wish to
apply the halved screening thresholds, which confirms the results of Tables 7.3 and 7.5. In
addition, Table 7.6 also reveals that the performance of the MH and MS portfolios classified
under the AAOIFI 2004 and 2006 criteria performed similarly, implying that the two methods
of classification do not impact on the portfolios‘ performance.
To conclude this section, both the parametric and non-parametric tests assert that there is no
statistical difference between the performance of the Halal and non-Halal portfolios during the
whole, bullish, and GFC periods and, hence, there is no penalty for investing in PH or MH
187
These 5 pairs, documented in Table 7.6, are as follows: MH-T.A(H) and Sin; All Halal-T.A(H) and Sin; All Halal-M.C(H) and Sin; MH-T.A(H) and All Sin (T.A); and finally MH-T.A(H) and All Sin (M.C).

279
portfolios during these periods. Differences in the portfolios‘ returns were only detected during
the bearish period. Combining the results of Table 7.6 with the descriptive statistics in Tables
7.1 and 7.2, we recognize that, during the bearish period, the Halal portfolios did not
underperform the conventional funds presented by the CP or KSE market index. However,
some Halal portfolios underperformed other non-Halal ones (e.g. Sin and MS). This finding is
inconsistent with Merdad et al. (2010) Abdullah et al. (2007) and Hayat and Kraeussl (2011),
who found that Islamic funds underperformed conventional funds (CP in this study) in the full
sample and bullish periods, and outperformed them in the GFC and bearish periods (Ashraf,
2013). This finding, however, further supports that of Rahimie (2010), Hassan et al. (2010),
Mansor and Bhatti (2011), and BinMahfouz and Hassan (2012) that there was no significant
difference between the return performance of Shariah-compliant funds and conventional
funds.188
7.5 Analysis of the Portfolios’ Return Correlation
This section analyses the correlations of the portfolios‘ returns with each other and the KSE
market Index (i and j) to investigate how a portfolio‘s return is related to or influenced by that
of another portfolio or market index. The covariance is used to measure the degree of
variability of the portfolios‘ returns relative to other portfolio returns, as how they move
together relative to their individual mean returns over time (Anderson et al., 2009; Reilly and
Brown, 2006). The covariance value is obtained by computing the covariance of the two
portfolios based on equation 7.6:
( ) [7.6]
188
The performance of the PH portfolio and Halal-portfolios that apply halved financial screening criteria cannot be compared with the literature, as these have not been previously addressed.

280
In order to standardize the covariance value, the correlation coefficient, ρ, is computed as
follows:189
[7.7]
The correlation coefficient, ρ measures the relationship between the returns of the portfolios i
and j, which can vary in range from -1 to +1. A value of +1 indicates a perfectly positive linear
relationship between Ri and Rj, meaning that the returns of the two portfolios move together in
a completely linear trend, and a value of -1 indicates a perfect negative linear relationship
between the return series of the two portfolios Ri and Rj, while a value of zero suggests that no
linear relationship exists between the trend of returns for the two portfolios. Since the data
appeared to be non-normally distributed, the nonparametric correlation coefficient, Spearman‘s
coefficient, is applied rather than the Pearson‘s correlation (Anderson et al., 2009). The
Spearman test of rank correlation uses ranks to test for association rather than actual data
values. The null hypothesis is that there is no significant correlation or association between the
portfolio returns. Therefore, a rejection of the null hypothesis implies that there is evidence of
an association between the returns behaviour of the portfolios. The correlation analysis is
conducted for the full and sub sample periods. The results of the Spearman‘s correlation for 9
selected portfolios and the KSE index are shown in Table 7.7.
189 See Strong (2003) and Reilly and Brown (2006).

281
Table 7.7: Portfolio Returns Correlations
Panel A: Portfolio Returns Correlations for the Full Sample Period (2006-2011) KSE
Index CP PH Sin MH-
TA MH-
MC MS-
T.A MS-
M.C MH.T.A (Halved)
MH.M.C (Halved)
KSE Index 1
CP .653** 1
PH .662** .784** 1
Sin .642** .778** .757** 1
MH.TA .542** .845** .644** .624** 1
MH.MC .529** .844** .632** .612** .985** 1
MS.T.A .601** .742** .660** .634** .681** .676** 1
MS.M.C .611** .746** .687** .664** .699** .677** .974** 1
MH.T.A(Halved) .450** .752** .565** .544** .897** .905** .562** .573** 1
MH.M.C(Halved) .476** .797** .592** .561** .929** .944** .588** .596** .950** 1
Panel B: Portfolio Returns Correlations for the Bullish Period (2006-2007) KSE
Index
CP PH Sin MH-
TA
MH-
MC
MS-
T.A
MS-
M.C
MH.T.A
(Halved)
MH.M.C
(Halved)
KSE Index 1
CP .680** 1
PH .648** .873** 1
Sin .689** .849** .740** 1
MH.TA .561** .922** .737** .659** 1
MH.MC .563** .921** .734** .658** .998** 1
MS.T.A .613** .819** .733** .631** .710** .711** 1
MS.M.C .606** .811** .734** .628** .698** .695** .992** 1
MH.T.A(Halved) .462** .755** .578** .517** .854** .851** .580** .561** 1
MH.M.C(Halved) .525** .877** .702** .611** .960** .958** .678** .663** .907** 1
Panel C: Portfolio Returns Correlations for the GFC Period (2008-2009) KSE
Index CP PH Sin MH-
TA MH-
MC MS-
T.A MS-
M.C MH.T.A (Halved)
MH.M.C (Halved)
KSE Index 1
CP .681** 1
PH .744** .878** 1
Sin .701** .897** .811** 1
MH.TA .501** .889** .698** .677** 1
MH.MC .497** .887** .699** .671** .998** 1
MS.T.A .640** .841** .789** .735** .731** .729** 1
MS.M.C .639** .840** .790** .737** .736** .727** .973** 1
MH.T.A(Halved) .449** .855** .667** .647** .975** .972** .666** .670** 1
MH.M.C(Halved) .456** .864** .673** .654** .986** .985** .679** .683** .993** 1
Panel D: Portfolio Returns Correlations for the Bearish Period (2010-2011) KSE
Index
CP PH Sin MH-
TA
MH-
MC
MS-
T.A
MS-
M.C
MH.T.A
(Halved)
MH.M.C
(Halved)
KSE Index 1
CP .540** 1
PH .522** .500** 1
Sin .531** .515** .726** 1

282
MH.TA .599** .653** .494** .556** 1
MH.MC .566** .635** .445** .534** .929** 1
MS.T.A .521** .478** .402** .531** .574** .568** 1
MS.M.C .560** .522** .469** .597** .668** .612** .952** 1
MH.T.A(Halved) .458** .548** .428** .494** .810** .855** .419** .495** 1
MH.M.C(Halved) .459** .517** .349** .408** .751** .812** .335** .392** .925** 1
Note: The Table demonstrates the results of the 2-tailed Spearman correlation test between the returns of 9
selected portfolios and the KSE market index during the full (in panel A) and sub sample periods (in panels B-D).
** Correlation is significant at the 1% level (2-tailed).
The Spearman‘s correlation results in Table 7.7 suggest that there is strong evidence for
rejecting the null hypothesis that there is no correlation between the returns of the created
portfolios, affirming that the returns of the portfolios in general are highly and positively
correlated with each other, with the CP and with the KSE market index during the full sample
period and sub periods. This finding is consistent with Rahimie (2010) and Merdad et al.
(2010), who found that Halal and non-Halal portfolios were highly correlated with the CP and
the market index. Interestingly, the correlation reduced during the bearish period, which is
consistent with previous results, showing same differences in the bearish period.
The PH and Sin portfolios are closely associated with the KSE index and each other, possibly
due to the fact that 60- 86% of the stocks in both PH and Sin exist in the financial sector, which
was affected by the performance of the whole sector rather than that of the individual
companies within it. In particular, they might be affected by the performance of the banking
sector which represents the vast majority of the weighted value for the PH and Sin portfolios.
For instance, banks represented 75% of the PH portfolio and 79% of the Sin portfolio in 2011.
The return of the MH- T.A and MH-M.C portfolios were the most positively correlated,
approaching a perfect positive correlation, indicating that these portfolios move in a very
similar direction during all sample periods, reflecting almost identical performance. The same

283
applies to MS-T.A and MS-M.C,190
implying that the change in AAOIFI‘s financial screening
criteria from 2004 to 2006 did not affect the returns behaviour of such portfolio pairings
differently. Furthermore, the return for the MH-T.A and MH-T.A (Halved) portfolios was also
highly correlated during all periods, but less so during the bearish period, and the same applies
to the MH-M.C and MH-M.C (Halved). This suggests that halving the financial screening
thresholds did not reduce the number of stocks significantly, and the impact was more due to
the impact of the crisis on screening as discussed in Chapter 6.
Of all of the portfolios, MH-T.A and MH-M.C are the most closely correlated with the CP
benchmark during the bullish period, but the correlation is weaker during the bearish period.
This may be because MH portfolios lost more stocks after the crisis period, and therefore
became less correlated to the CP. The least correlated portfolios with the CP and KSE index
are MH-TA (Halved) and MH-MC (Halved). This suggests that including such portfolios
within a PH portfolio would offer diversification benefits for Islamic funds and Halal-seeking
investors, as their correlation coefficient is lower.191
One reason for this is that MH stocks are
in the non-financial sector and hence better diversified across more sectors in the market. This
could explain why the majority of Islamic funds invest in both PH and MH stocks, rather than
PH stocks only. As Table 7.7 reveals, not only are the stocks that are classified under
AAOIFI‘s 2004 and 2006 criteria highly correlated but also the degree of correlation amongst
all of the portfolios‘ returns and with the KSE index increased during the crisis period. This is
consistent with the finding that the correlations of returns often increase during financial
turbulence (Corsetti et al., 2010). In the bearish period, however, the portfolios are less
190There is also a high level of correlation between the following portfolios (not displayed in Table 7.7): All Halal-T.A and All Halal-M.C; All Sin-T.A and All Sin-M.C and; All Halal-T.A (Halved) and All Halal-M.C (Halved); MH-T.A (Halved) and MH-M.C (Halved); and finally MS-T.A (Halved) and MS-M.C (Halved). 191
The portfolio that includes PH and MH-T.A (Halved) is portfolio number 16 in section 5 of chapter 6 (All Halal-TA- Halved), and the portfolio that includes PH and MH-M.C (Halved) is portfolio number 17 in section 5 of chapter 6 (All Halal-M.C- Halved).

284
correlated than in other periods, suggesting the diverse movement after crisis, which explains
the significant differences in portfolios means only during this period as shown in the previous
section.
Overall, the correlation analysis reveals that the returns of all of the portfolios are significantly
correlated with each other and with the benchmark KSE. This positive correlation shows that
the returns of all the portfolios are moving in a similar direction together with the overall
market return. There is also slight evidence of a varying level of correlation in different time
periods.
7.6 Analysis of the Portfolios’ Risk-Adjusted Return Performance
This section analyses the portfolios‘ performance using the traditional portfolio risk-adjusted
performance measures, namely the Treynor ratio (Treynor, 1965), the Sharpe ratio (Sharpe,
1966) and the Jensen-alpha (Jensen, 1968). These ratios were calculated for each of the 19
portfolios and KSE Index in the different full and sub sample periods, based on Equation 4.1
for the Sharpe ratio, Equation 4.4 for the Treynor ratio, and finally Equation 4.5 for the Jensen-
alpha. The standard errors from the Jensen‘s alpha regression were corrected for
autocorrelation and Heteroskedasticity problems using the Newey-West procedure. The
traditional performance measures allow the portfolios‘ performance to be analyzed based on
their risk-adjusted returns and enables the ranking of the portfolios according to their
performance. Although these performance measures employed are very common in the
investment funds literature, the uniqueness of this analysis is that it also employs a Shariah-
compliant risk free asset (Murabahah rate) alternative when calculating the Sharpe and
Treynor ratios, as detailed in Chapters 4 and 5, for all of the possible portfolios. Hence, the
first part of this section reports the results of the risk-adjusted returns for all portfolios using
the three traditional portfolio performance measures, whilst the second part of this section

285
analyses the portfolios‘ performance via the same three traditional performance measures but
using a Shariah-compliant risk free asset (Murabahah rate).
7.6.1 The Results of the Portfolios’ Risk-Adjusted Return Performance Analysis Using
the Interest-Based Risk-free Rate
This section reports the results of risk-adjusted returns for all portfolios using the traditional
portfolio performance measures, namely: the Sharpe ratio, the Treynor ratio, and the Jensen-
alpha, after which the portfolios are ranked according to their performance. The results of the
risk-adjusted return performance analysis for all 19 portfolios and the KSE index and the
rankings of the portfolios according to these measures during the full sample period and in
each sub-period192
are provided in Table 7.8. To provide a clearer understanding, the Sharpe
and Treynor ratio results are also presented graphically in Appendix 7.6 for each portfolio
during all sample periods.
192
To examine the impact of the market condition on the portfolios’ risk-adjusted performance.

286
Table 7.8: The Risk-adjusted Performance Analysis and Rankings of the 19 portfolios
Panel A: for the Full Sample Period (2006-2011)
Portfolio Performance Measures Ranking
Sharpe Treynor Jensen
Alpha
Sharpe Treynor Jensen
Alpha CP -1.0695 -0.6113 0.0007 17 15 15
PH -0.8876 -0.5270 0.0011 13 9 8
Sin -0.9027 -0.5464 0.0008 15 12 14
MH- T.A -0.8101 -0.5616 0.0010 9 14 12
MH- M.C -0.7790 -0.5475 0.0010 8 13 11
All Halal-T.A -0.8711 -0.5351 0.0011 11 11 10
All Halal-M.C -0.8565 -0.5281 0.0011 10 10 9
MS-T.A -0.3849 -0.2284 0.0025* 3 3 2
MS-M.C -0.4994 -0.2945 0.0024 4 4 3
All Sin-T.A -0.7391 -0.4185 0.0012 6 6 6
All Sin-M.C -0.7721 -0.4368 0.0012 7 7 7
MH-T.A(Halved) -1.1785 -0.9714 -0.0004 19 19 19
MH-M.C(Halved) -0.8818 -0.6921 0.0000 12 17 18
All Halal-T.A(Halved) -1.1267 -0.7213 0.0004 18 18 17
All Halal-M.C(Halved) -1.0044 -0.6438 0.0007 16 16 16
MS-T.A(Halved) -0.2662 -0.1704 0.0019** 2 2 4
MS-M.C(Halved) -0.2216 -0.1233 0.0028** 1 1 1
All Sin-TA(Halved) -0.8906 -0.4938 0.0010 14 8 13
All Sin-M.C(Halved) -0.6728 -0.3691 0.0014 5 5 5
Average -0.7797 -0.4958 0.0011 N/A N/A N/A
KSE Index -2.0510 -0.8514 0.0000 N/A N/A N/A
Panel B: For the Bullish Period (2006-2007)
Portfolio Performance Measures Ranking
Sharpe Treynor Jensen
Alpha
Sharpe Treynor Jensen
Alpha
CP 0.7164 0.2018 0.0018 8 9 11
PH 0.4984 0.1468 0.0013 17 17 17
Sin 0.5362 0.1567 0.0011 16 15 19
MH- T.A 0.8191 0.2822 0.0027 3 4 4
MH- M.C 0.8259 0.2834 0.0027 2 3 3
All Halal-T.A 0.7570 0.2328 0.0021 7 7 8
All Halal-M.C 0.7644 0.2348 0.0022 6 6 6
MS-T.A 0.3592 0.1182 0.0019 18 18 10
MS-M.C 0.3113 0.1024 0.0017 19 19 12
All Sin-T.A 0.5739 0.1598 0.0013 13 13 16
All Sin-M.C 0.5488 0.1531 0.0013 15 16 18
MH-T.A(Halved) 0.7707 0.3336 0.0027 5 2 1
MH-M.C(Halved) 1.0528 0.4026 0.0027 1 1 2
All Halal-T.A(Halved) 0.7793 0.2432 0.0021 4 5 7
All Halal-M.C(Halved) 0.6906 0.2188 0.0020 10 8 9
MS-T.A(Halved) 0.5677 0.1576 0.0015 14 14 14
MS-M.C(Halved) 0.6054 0.1881 0.0024 11 11 5

287
All Sin-TA(Halved) 0.5844 0.1643 0.0014 12 12 15
All Sin-M.C(Halved) 0.7035 0.1951 0.0016* 9 10 13
Average 0.6561 0.2092 0.0019 N/A N/A N/A
KSE Index -0.1087 -0.0243 0.0000 N/A N/A N/A
Panel C: For the GFC Period (2008-2009)
Portfolio Performance Measures Ranking
Sharpe Treynor Jensen
Alpha
Sharpe Treynor Jensen
Alpha
CP -1.3866 -0.5829 0.0003 14 11 11
PH -1.1532 -0.4845 0.0016 9 5 5
Sin -1.8486 -0.7917 -0.0015 18 19 19
MH- T.A -1.0609 -0.5610 0.0005 4 10 10
MH- M.C -1.0411 -0.5577 0.0006 3 9 9
All Halal-T.A -1.1246 -0.5127 0.0011 8 7 7
All Halal-M.C -1.1166 -0.5104 0.0011 7 6 6
MS-T.A -1.1045 -0.4478 0.0020 6 3 3
MS-M.C -1.1804 -0.4786 0.0017 11 4 4
All Sin-T.A -1.6666 -0.6767 -0.0006 16 15 14
All Sin-M.C -1.6735 -0.6789 -0.0006 17 16 15
MH-T.A(Halved) -1.2202 -0.7372 -0.0014 12 17 17
MH-M.C(Halved) -1.0964 -0.6464 -0.0008 5 13 16
All Halal-T.A(Halved) -1.3864 -0.6628 -0.0005 13 14 13
All Halal-M.C(Halved) -1.1757 -0.5552 0.0006 10 8 8
MS-T.A(Halved) -0.9638 -0.3765 0.0028 1 1 1
MS-M.C(Halved) -0.9877 -0.3798 0.0027 2 2 2
All Sin-TA(Halved) -1.9545 -0.7787 -0.0014 19 18 18
All Sin-M.C(Halved) -1.6065 -0.6323 -0.0002 15 12 12
Average -1.3025 -0.5817 0.0004 N/A N/A N/A
KSE Index -1.9480 -0.6098 0.0000 N/A N/A N/A
Panel D: For the Bearish Period (2010-2011)
Portfolio Performance Measures Ranking
Sharpe Treynor Jensen
Alpha
Sharpe Treynor Jensen
Alpha
CP -0.8745 -0.2399 -0.0001 14 14 13
PH -0.2338 -0.0777 0.0009 10 10 10
Sin 0.7117 0.2284 0.0029* 1 1 8
MH- T.A -0.8738 -0.2327 -0.0001 13 13 14
MH- M.C -0.9193 -0.2594 -0.0003 15 15 15
All Halal-T.A -0.7327 -0.1907 0.0002 11 11 11
All Halal-M.C -0.7528 -0.2013 0.0001 12 12 12
MS-T.A 0.3566 0.1035 0.0035 7 7 2
MS-M.C 0.3458 0.0957 0.0036 8 8 1
All Sin-T.A 0.6468 0.1768 0.0032* 2 2 5
All Sin-M.C 0.6057 0.1627 0.0032* 3 3 6
MH-T.A(Halved) -1.5826 -0.5809 -0.0023 19 19 19
MH-M.C(Halved) -1.4359 -0.5240 -0.0021 18 18 18

288
All Halal-T.A(Halved) -0.9602 -0.2893 -0.0005 17 17 17
All Halal-M.C(Halved) -0.9434 -0.2801 -0.0004 16 16 16
MS-T.A(Halved) 0.4449 0.1186 0.0033 6 6 3
MS-M.C(Halved) 0.3409 0.0905 0.0032 9 9 4
All Sin-TA(Halved) 0.6051 0.1622 0.0028 4 4 9
All Sin-M.C(Halved) 0.5781 0.1489 0.0031* 5 5 7
Average -0.3064 -0.0903 0.0012 N/A N/A N/A
KSE Index -1.4546 -0.2173 0.0000 N/A N/A N/A
Note: The first three columns reports the results of the risk-adjusted performance analysis of the 19 portfolios
based on the three traditional performance measures, and the remaining three columns reports the portfolios‘
ranking based on these performance measures for the full sample period (in panel A) and for the three sub
sample periods (in panel B-D).The last two rows show the average results for the 19 portfolios and the KSE
index performance, that is not applicable to the rankings. The standard errors from the Jensen‘s alpha regression
were corrected for autorotation and Heteroskedasticity problems using the Newey-West procedure.
*Indicates that Jensen alpha values are significant at the 10% level. ** Significant at the 5% level.
The risk-adjusted performance measures and rankings provided in Table 7.8 show that, in
general, the results are close to each other, especially those of the Treynor and Jensen
measures.193
However, the portfolios‘ performance varied across different sample periods
contrary to the returns performance in section 7.3, which did not have risk in consideration.
The results in Table 7.8 show that using AAOIFI‘s 2004 and 2006 financial screening criteria
in general does not have a significant impact on the portfolios‘ performance.194
The results during the full sample period (2006-2011) reveal that the Sharpe and Treynor
performance of all portfolios was negative due to the significant impact of the GFC driving the
whole results, similar to return performance in Tables 7.1 and 7.2. However, all portfolios had
positive alpha values, apart from MH-T.A (Halved); nevertheless, the only three portfolios that
had significant values were MS-T.A, MS-T.A (Halved), and MS-M.C (Halved), indicating
193
The correlation between the rankings of the Sharpe, Treynor, and Jensen measures for the full and three sub-periods is calculated in Appendix 7.5. 194
Only a few portfolios showed somewhat some small differences after halving the financial screening criteria. For instance, during the overall sample period, the MH-M.C (Halved) was ranked 12th, 17th and 18th according to the Sharpe, Treynor and Jensen measures respectively, while MH-T.A (Halved) was ranked 19th across all three measures. Another example is the MH-M.C (Halved) during the GFC period, which was ranked 5th, 13th and 16th according to the Sharpe, Treynor and Jensen measures, while the MH-T.A(Halved) was ranked 12th according to the Sharpe and 17th according the Treynor and Jensen measures.

289
their superior performance. Overall, the top portfolios were the non-Halal; MS ones, most of
the Halal portfolios beat the CP and almost all 19 portfolios beat the KSE index.195
The analysis highlights that, prior to the GFC period, all of the portfolios were performing
well, as they all recorded positive Sharpe, Treynor and Jensen measures.196
The only
significant alpha however, was recorded by All Sin-M.C (Halved). The Halal portfolios, apart
from the PH, performed the best during the bullish period, even after halving the financial
screening thresholds. Surprisingly, the MH-M.C (Halved) and MH-T.A (Halved) portfolios
were the top two performers of all during the bullish period.197
This is because they were still
heavily weighted with Zain stock, the large-sized stock in KSE that led the market and
achieved the best performance during the bullish period.198
199
This also suggests that the new,
tighter financial screening criteria might not have a negative impact on portfolio performance
during the bullish period. The PH portfolio did not perform very well during the bullish period
as it was less diversified. For instance, there was only one Islamic bank (PH stock) included in
2006 that was KFH and another smaller one was added in 2007 (Boubyan Islamic Bank), while
the rest were small-sized stocks that did not have any significant weight in the portfolio. Thus,
195
The only Halal portfolio that was able slightly to beat the average performance was MH-M.C, as the averages were -0.7797,-0.4958, 0.0011 for the Sharpe, Treynor, and Jensen measures respectively, while the MH-M.C results were -0.7721, -0.4368, and -0.0012 for the Sharpe, Treynor, and Jensen measures respectively. 196
On average, the Sharpe measure during the bullish period (2006-2007) was 0.6561 while the Treynor and Jensen measures were 0.2092 and 0.0019 respectively. 197 The MH-M.C (Halved) and MH-T.A (Halved) portfolios were the top portfolios based on the Treynor and Jensen measures, while MH-M.C (Halved) was the top one based on the Sharpe measure. 198 For instance, Zain comprised 41% and 75% in 2006 and 2007 respectively in the MH-T.A (Halved) portfolio and 84% of the MH-M.C (Halved) portfolio in 2007. 199
Appendix 7.4 graphically shows the performance of the top four stocks in the KSE that have a market capitalization above 1.5 billion (K.D) to see how they impact on the portfolios included. These stocks were Kuwait Finance House (KFH- PH stock), National Bank of Kuwait (NBK-Sin Stock), Zain, Telecmunication Company, and Agility, a logistics and warehousing company. The last two are mixed companies that are usually classified as MH stocks. The market capitalization for the 4 companies together counts for approximately 33% of the average total market capitalization during all sample periods.

290
the portfolio was affected by the performance of KFH which did not perform as well as it did
in 2008.200
The Sharpe and Treynor measures for all the portfolios, that were positive during the bullish
period, mostly turned negative during the GFC period (2008-2009). The top two portfolios
during this period were non-Halal portfolios: MS-T.A (Halved) and MS-M.C (Halved),
followed by Halal portfolios. This was expected because many MH stocks turned into MS
stocks after halving the financial screening thresholds, thus enhancing the risk-adjusted returns,
as they became more diversified. Nevertheless, all of the Halal portfolios outperformed the CP
and KSE benchmarks; in addition they were able to outperform the average, except for the All
Halal-T.A (Halved) portfolio.
After the GFC period (2010-2011), most of the Halal portfolios reversed their position with the
non-Halal portfolios. For instance, the Sin portfolio performed far below the average and the
CP during the crisis, being ranked 18th
according to the Sharpe measure and last according to
the Treynor and Jensen measures, but registered a superior performance during the bearish
period, as it was ranked the top of all portfolios, pulling other portfolios that comprise Sin
stocks; All Sin-T.A, All Sin-M.C, All Sin-TA (Halved), and All Sin-M.C (Halved). In
addition, the only positive and significant alpha values were recorded by Sin, All Sin-T.A, and
All Sin-M.C (Halved). This shows the positive impact of the CBK‘s intervention in supporting
the banking sector along with government spending to mitigate the impact of the GFC and
stabilize the economy.201
Most of these supported banks were the main constitution of such
non-Halal portfolios; for instance, banks comprise 60-80% of the Sin portfolio market
200
Kuwait Finance House (KFH) comprised alone 38% of the portfolio in 2006, while in 2007 it comprised alone 44% of the portfolio and the second Islamic bank (Boubyan) comprised 7% only. See Appendix 7.4 for the return performance of KFH during the full sample period (2006-2011). 201
See: CBK Economic Report (2010), Global Research (2009), and KAMCO Research (2011).

291
capitalization. Following the Sin portfolio, another 4 non-Halal portfolios202
performed above
average with positive performance measures. This could be due to the fact that all of these non-
Halal portfolios contain only non-financial companies that were generally less affected by the
GFC.203
In addition, Zain stock became non-compliant with the original and halved AAOIFI‘s
2004 and 2006 screening criteria in 2009, and was thus excluded from the 2010 MH
portfolios204
and included in the MS portfolios.205
The CBK intervention after the GFC also
explains why the PH portfolio was the only Halal portfolio to perform above average during
the bearish period, as 75-66% of the portfolio‘s constituents were the stocks of banks that
benefitted from such intervention, yet the PH portfolio achieved negative performance. It could
be that PH banks benefitted less from CBK support compared to conventional banks, as most
of the liquidity support was in the form of conventional loans that are forbidden for Islamic
banks. In addition, the large owners of conventional banks are big merchant families and the
government, who supported these banks after the crisis, as noted by the interviewees in
Chapter 5.
Most importantly, the analysis in Table 7.8 reveals that there were no risk-adjusted
performance penalties for Islamic funds that invest in both PH and MH stocks during all
sample periods; using the original AAOIFI‘s screening criteria.206
This finding supports the
previous findings, that the Shariah-compliant screening did not have a negative impact on the
portfolios‘ return performance. This is consistent with prior research such as Hoepner et al.
202
These non-Halal portfolios are MS-T.A (Halved), MS-T.A, MS-M.C, and MS-M.C (Halved) respectively. 203 The non-financial portfolios, MS-T.A (Halved), MS-M.C (Halved), MH-M.C, and MH-T.A, were ranked as the top performers during the GFC period, as shown in Table 7.8 panel C. This is consistent with many interviewees’ input. This is empirically tested in the next chapter to examine the key factors affecting the stock's performance. 204
Because Zain was highly leveraged, it therefore failed to comply with Interest bearing debt to total assets or the market capitalization financial screening criteria. 205
Zain signed a huge deal of USD1.70 billion to sell its African assets (excluding Morocco and Sudan) to Bharti Airtel. The company also made great strides in the completion of the sale of a 46 percent stake to the Emirates Telecommunications Corporation (Etisalat). These events inflated Zain's stocks price on the KSE, as reported by several interviewees. 206
The proxies for these Islamic funds in this study are portfolios: All Halal-T.A and All Halal-M.C.

292
(2011) who found that there was no significant difference in performance between Islamic and
conventional funds and benchmarks especially in the GCC and Malaysia as they are the six
largest Islamic financial centers.207
Moreover, Islamic funds that invest only in PH stocks do not have to sacrifice risk-adjusted
returns, apart from the bullish period. Therefore, it might be a wise idea for Islamic fund
managers of these funds and PH investors to include MH stocks during bullish markets.
The rankings of the risk-adjusted performance measures in Table 7.8 indicate that, in general,
they are positively and strongly correlated during all sample periods, as shown in Appendix
7.5. The rankings of the Sharpe and Treynor ratios were less correlated during the GFC, but it
was highly correlated between the Treynor and Jensen measures.208
This is due to the fact that
the Treynor ratio and Jensen alpha reward a portfolio with the lowest systematic (market) risk,
unlike the Sharpe ratio that provides advantage to portfolios with the lowest total risk. This
confirms that, during the GFC period, the systematic risk was a significant factor affecting the
performance of the portfolios but, overall, the high correlation between the rankings indicates
that the difference between most of the portfolio ratings does not depend on the performance
measure used, as the results were relatively similar across different performance measures,
especially during the bearish period.209
Appendices 7.6-7.9 provide a visual confirmation of the
Sharpe and Jensen performance for the full and sub-sample period.210
207
Hoepner et al. (2011) also found that Islamic funds from most countries with less developed Islamic financial services underperform their benchmarks, particularly Islamic funds from predominantly Christian economies. 208 The correlation between the Shape and Treynor rankings was 0.768 and that between Sharpe and Jensen rankings during the crisis period was 0.714, but it was highly correlated (0.989) between the Treynor and Jensen measures. 209
During the bearish period, the Shape and Treynor rankings were perfectly correlated. 210 Any portfolio that is located above the respective market line (CML and SML) for a given level of risk provides evidence of superior performance as it offers higher returns (total or systematic risk).

293
7.6.2 The Results of the Portfolios’ Risk-Adjusted Return Performance Analysis using a
Shariah-Compliant Risk-free Rate
The valuation of the portfolios‘ performance on the basis of their risk-adjusted returns in
section 7.1 was undertaken using the Kuwait T-bond rate as a proxy for the risk free rate. It is
now appropriate to extend the analysis by applying a Shariah-compliant asset as an alternative
to the conventional risk-free rate, as discussed in Chapters 4 and 5. Therefore, this section
analyses the portfolios‘ performance via the same three traditional performance measures but
using the Murabahah rate as the Shariah-compliant risk free asset.211
The Kuwait weekly one-
year Murabahah returns were obtained from Thomson Reuters Knowledge database for the
bearish period (2010-2011) only, since data were only available from 2009. The results of risk-
adjusted performance measures and rankings are provided in Table 7.9 below in comparison
with the results from the previous section when using the CBK one year T-bonds rate for the
same sample period (Table 7.8 panel D).
211 The Murabahah rate was chosen because it was the one that was most frequently recommended by the interviewees (see Chapter 5).

294
Table 7.9: The Risk-adjusted Performance Analysis and Rankings of the 19 Portfolios for the Bearish Period (2010-2011), using a
Shariah-Compliant and Conventional Risk-free Rates
Performance Measures Ranking
Portfolio
Performance Measures Ranking
Using a Shariah-Compliant Risk-free Rate Using a Conventional Risk-free Rate
Sharpe Treynor Jensen
Alpha Sharpe Treynor
Jensen
Alpha Sharpe Treynor
Jensen
Alpha Sharpe Treynor
Jensen
Alpha
-0.9002 -0.2471 -0.0001 14 14 13 CP -0.8745 -0.2399 -0.0001 14 14 13
-0.2462 -0.0818 0.0009 10 10 10 PH -0.2338 -0.0777 0.0009 10 10 10
0.6992 0.2245 0.0029* 1 1 7 Sin 0.7117 0.2284 0.0029* 1 1 8
-0.8859 -0.2360 -0.0020 13 13 16 MH- T.A -0.8738 -0.2327 -0.0001 13 13 14
-0.9331 -0.2634 -0.0003 15 15 14 MH- M.C -0.9193 -0.2594 -0.0003 15 15 15
-0.7467 -0.1944 0.0002 11 11 11 All Halal-T.A -0.7327 -0.1907 0.0002 11 11 11
-0.7677 -0.2053 0.0001 12 12 12 All Halal-M.C -0.7528 -0.2013 0.0001 12 12 12
0.3483 0.1011 0.0035 7 7 2 MS-T.A 0.3566 0.1035 0.0035 7 7 2
0.3376 0.0935 0.0036 8 8 1 MS-M.C 0.3458 0.0957 0.0036 8 8 1
0.6351 0.1737 0.0032* 2 2 5 All Sin-T.A 0.6468 0.1768 0.0032* 2 2 5
0.5942 0.1596 0.0032* 3 3 6 All Sin-M.C 0.6057 0.1627 0.0032* 3 3 6
-1.5938 -1.4600 -0.0023 19 19 19 MH-T.A(Halved) -1.5826 -0.5809 -0.0023 19 19 19
-1.5577 -0.5687 -0.0021 18 18 18 MH-M.C(Halved) -1.4359 -0.524 -0.0021 18 18 18
-0.9737 -0.2934 -0.0020 17 17 17 All Halal-T.A(Halved) -0.9602 -0.2893 -0.0005 17 17 17
-0.9574 -0.2843 -0.0019 16 16 15 All Halal-M.C(Halved) -0.9434 -0.2801 -0.0004 16 16 16
0.4350 0.1160 0.0033 6 6 3 MS-T.A(Halved) 0.4449 0.1186 0.0033 6 6 3
0.3315 0.0880 0.0032 9 9 4 MS-M.C(Halved) 0.3409 0.0905 0.0032 9 9 4
0.5921 0.1588 0.0028 4 4 8 All Sin-TA(Halved) 0.6051 0.1622 0.0028 4 4 9
0.5660 0.1458 0.0011* 5 5 9 All Sin-M.C(Halved) 0.5781 0.1489 0.0031* 5 5 7
-0.2644 -0.1355 0.0009 N/A N/A N/A Average -0.3064 -0.0903 0.0012 N/A N/A N/A
-1.4727 -0.2200 0.0000 N/A N/A N/A KSE Index -1.4546 -0.2173 0.0000 N/A N/A N/A
Note: This table reports the risk-adjusted performance of the 19 portfolios and their ranking, during the bearish sample period (2010-2011), based on the three traditional
performance measures using the Murabahah rate as a Shariah-compliant risk-free asset, and a conventional risk-free rate (CBK‘s one year T-bonds). The last two rows
show the average results for the 19 portfolios and the KSE index performance that is not applicable for the rankings. The Table covers the The standard errors from the
Jensen‘s alpha regression were corrected for autorotation and Heteroskedasticity problems using the Newey-West procedure.
*Indicates that the Jensen alpha values are significant at the 10% level.

295
Table 7.9 reveals that the risk-adjusted performance measures have not changed much after
using the Shariah-compliant risk free asset, as the performance of all portfolios measured by
the Sharpe and Treynor ratios are consistent with the outcomes of the previous analysis using
the conventional risk-free rate. Nevertheless, a few insignificant differences were identified
under the Jensen alpha measure for the portfolios: Sin, MH-T.A, MH-M.C, All Halal-M.C
(Halved), All Sin-T.A (Halved), All Sin-T.A (Halved), and All Sin-M.C (Halved).
Appendix 7.10 reports the correlation between the rankings of the Sharpe, Treynor, and Jensen
measures using the Shariah-compliant risk-free rate, and confirms that the Sharpe and Treynor
ratios were the same as using the conventional risk-free rate, and the rankings are highly
correlated for the Jensen alpha. Furthermore, as a robustness check, a correlation test was also
conducted between the rankings based on the Sharpe, Treynor, Jensen measures of all
portfolios using the conventional risk-free rate and the same measures using the Shariah-
compliant risk-free rate, as shown in Appendix 7.11, which are exactly the same for Sharpe
and Treynor ratios and similar for Jensen alpha. Therefore, in contrast to the findings of
Rahimie (2010), this analysis suggests that using a Murabahah rate as the risk-free rate leads to
the same conclusion as using a conventional risk-free rate (T-bonds).212
This could be due to
the fact that Rahimie (2010) used both an Islamic index to calculate the portfolios‘ alpha and
beta and Mudarabah investment account rate as the proxy for the risk-free rate, while this
study used the KSE index and Murabahah rate as the Shariah-compliant risk-free rate and the
difference in time periods. A Mudarabah investment account rate could not be used because
the data were not available.213
212 Appendix 7.12 plots the performance of the T-bond rate (Conventional risk-free rate), and the Murabahah rate (Shariah-compliant risk-free rate). 213 It is believed that financial instruments that are based on the Mudarabah contract, such as the Mudarabah investment account, are more suitable because they are based on profit-loss sharing which achieve Maqasid al-Shariah (see Al-Suwailem, 2009; Al-Mubarak and Osmani, 2010).

296
Nevertheless, the finding of this section was expected by some interviewees who outlined that
moving away from the conventional interest-based benchmark is difficult because there is a
correlation between interest rates and Murabahah rate, as both are affected by the conventional
financial system (see section 5.7). This is also consistent with Chong and Liu (2009), Zainol
and Kassim (2010), and with Cevik and Charap (2011), who noted that there is a substantial
link between the Islamic and conventional financial system, as changes in interest rates put
pressure on Islamic deposit rates and hence they are sensitive to changes in interest rates too
due to competition. As in dual financial systems, clients are free to choose to bank with an
Islamic bank and/or a conventional bank, which creates an arbitrage opportunity due to rate
differentials (see Chong and Liu, 2009; Zainol and Kassim, 2010).
However, a further extension to the current analysis could be conducted in the future,
especially after the launch of the first world Islamic Interbank Benchmark Rate (IIBR) on the
22nd
of November 2011 by Thomson Reuters.214
This rate was established to be independent of
LIBOR and thereby gives the Islamic finance industry a rate that reflects its own unique
characteristics and market conditions. Therefore, it would be interesting to employ this new
Islamic rate as a Shariah-compliant risk-free rate instead of the Murabahah rate used her, and
the conventional risk-free rate such as T-bonds.
7.7 Summary
This chapter has examined the performance of the Halal and non-Halal portfolios of stocks
listed on the KSE that were created in Chapter 6, using quantitative analysis. Several major
findings emerge from this chapter. First, the return performances of all of the portfolios are
214 IIBR was established by Thomson Reuters Corp, in cooperation with the Islamic Development Bank, SSB of AAOIFI, the Association of Islamic Banking Institutions Malaysia, the Bahrain Association of Banks, the Hawkamah Institute for Corporate Governance, the Statistical Economic and Social Research Center for Islamic Countries, and 19 Islamic banks, most of them based in the Gulf. For more details see Reuters website: http://www.reuters.com/article/2011/11/22/islamic-interbank-idUSL5E7ML0QC20111122

297
positively correlated and move in the same direction as the KSE market index. However, the
deviations among the portfolios‘ returns during the last bearish period were more marked.
Second, the parametric and non-parametric tests reveal that there is no statistical difference
between the raw return performance of the Halal and non-Halal portfolios during the full, the
bullish or the GFC periods and, hence, there is no penalty for investing in PH or MH
portfolios. Nevertheless, differences were identified during the bearish period, showing that
some non-Halal portfolios performed better. However, the Halal portfolios did not
underperform the CP or the KSE index in any of the sample periods, even after halving the
AAOIFI‘s financial criteria, implying that all Islamic funds do not gain less than other
investment funds. Third, the risk-adjusted returns, however, show that there is a performance
penalty on Islamic funds that invest only in PH stocks during the bullish period. Fourth,
Islamic funds that wish to apply the suggested halved AAOIFI‘s screening criteria would be
unable to outperform the non-halved portfolios and CP during the full and bearish periods. This
shows the negative impact of using AAOIFI‘s ‗tighter‘ financial screening on the performance
of such Halal portfolios due to the impact of the GFC, as the crisis has reduced the number of
MH stocks for Islamic funds who invest in both PH and MH stocks, making them less
diversified and lower in terms of risk-adjusted returns. Therefore, reducing the financial
screening thresholds by 50% is possible, but not during market shocks. Fifth, AAOIFI‘s
change from the 2004 to the 2006 screening criteria did not seem to hinder the risk-adjusted
performance of the Halal-based portfolios. Finally, using a Shariah-compliant alternative
(Murabahah rate) as the risk-free rate did not have a significant impact on the risk-adjusted
performance of the portfolios due to the correlation between the conventional and Islamic rates
that are dominated by the conventional financial system. Nonetheless, the recent IIBR

298
launched by Thomson Reuters opens the door for future empirical investigation as it could
provide the Islamic finance industry a rate that reflects its own unique identity.

299
Chapter 8: The Performance of the Halal and non-Halal Portfolios,
a Matched Pair and a General Linear Model (GLM) Analysis

300
8.1 Introduction
The previous chapter revealed that PH and MH portfolios were able to perform as well as
conventional funds as represented by the CP, but underperformed when compared with some
non-Halal portfolios; it was also suggested that halving AAOIFI‘s screening criteria was
feasible before the GFC. This chapter takes the analysis a step further by employing two
different approaches that control for other factors that might impact on the financial
performance of Halal and non-Halal stocks and complements the findings outlined in chapter
7. The first approach is the matched pair approach which controls for size and sector when
comparing the risk-adjusted performance of the Halal portfolios against the non-Halal ones.
The matched pair approach is a methodology that has been adopted by studies that match
ethical funds and non-ethical funds to overcome the benchmark problem, such as Mallin et al.
(1995), Gregory et al. (1997), Statman (2000) and Kreander et al. (2005), to evaluate the
performance of ethical funds with non-ethical funds. Only Abderrezak (2008)215
and
BinMahfouz and Hassan (2012) employed this approach when comparing the performance of
Islamic and conventional funds. However, the matched pair approach in this chapter is distinct
from the previous literature, as it matches more than just two equity investment types, namely
the Halal stocks represented by PH, MH, and MH (Halved) which are directly matched against
each other and against their non-Halal (Sin)216
counterparts on the basis of size and
sector.217
This approach controls for the impact of size and sector that might impact on financial
performance and also mitigates the problem of any benchmark selection in the portfolio‘s
evaluation, as prior studies have established that funds‘ performance can be sensitive to the
215 Abderrezak (2008) is an unpublished master’s dissertation. 216 PH, MH, MH (Halved) portfolios represent the Halal portfolios group while the Sin portfolio represents the non-Halal portfolio group, because the chapter is mainly concerned with Halal investors. 217 AAOIFI’s 2006 criteria were chosen to screen MH stocks based on the findings of the previous chapter in sections 7.4 and 7.6 that the impact of AAOIFI’s 2004 and 2006 criteria on portfolio performance is not significantly different and since AAOIFI’s 2006 screening criteria are the most recent, they are used in this chapter.

301
benchmark market index employed (Lehmann and Modest, 1987; Grinblatt and Titman, 1994;
Mallin et al., 1995; Gregory et al., 1997; Kreander et al., 2005; Rahimie, 2010). The purpose of
the matched pair analysis is to investigate whether there is a risk-adjusted performance penalty
for Halal investment, including the impact of halving AAOIFI‘s screening criteria, after
controlling for size and sector.
This chapter also applies a General Linear Model (GLM) to investigate the impact of a number
of factors on the performance of KSE stock returns, such as Shariah classification of stocks to
Halal and non-Halal, the sector, the firm size, and the GFC. The GLM model builds on the
findings of the interviews in Chapter 5. The model has the benefit of allowing interaction
effects between the factors to be investigated in addition to the main factors.218
The remainder of this chapter is structured as follows. Summary information, descriptive
statistics and risk-adjusted performance for the matched pair‘s portfolios are provided in the
next section. The results of the GLM analysis before and after halving AAOIFI‘s financial
screening thresholds and an analysis of the models are reported in section 8.3. Finally, section
8.4 offers a number of conclusions.
8.2 Descriptive Statistics and Risk-Adjusted Performance of the Matched Pairs
This section provides the descriptive statistics of the sample of matched portfolios, analyses the
results of the different performance measures, and relates them to the findings outlined in the
previous chapter.
For this thesis portfolios were created and five matched pairs were analyzed, namely: (I) PH
(A) versus Sin (A); (II) PH (B) versus MH (A); (III) Sin (B) versus MH (B); (IV) PH (C)
versus MH (Halved) (A); and (V) Sin (C) versus MH (Halved) (B). It is worth noting that each
matched pair portfolio has its own constitution of stocks and sectors. This is why each portfolio
218 The GLM procedure provides regression analysis and analysis of variance for one dependent variable by one or more factors and/or variables (See online help search of SPSS).

302
was given a different alphabetic code. For instance, the stocks in the PH (A) portfolio of
matched pair (I) are different from the stocks of the PH (B) and PH (C) portfolios of matched
pairs (II) and (IV) respectively, as per Appendix 8.1. For each stock in each portfolio the size
and sector was matched. Size and sector were selected as the criteria for matching the stocks in
each matched pair portfolio to the other portfolios because they are seen by many of the
investors and fund managers interviewed as significant variables affecting funds‘ performance.
The size of each matched stock was chosen to be the closest possible within the same sector.
Similar to Chapter 7, this chapter uses weekly data. Summary information about these matched
portfolios is reported in Appendix 8.1. All of these stocks were investable for the whole sample
period, from 04/01/2006 to 28/12/2011; any new listed stocks during this period were not
considered in the sample stocks.219
Table 8.1 shows the descriptive statistics for each portfolio in the five matched pairs and the
KSE market index as a benchmark, namely: the mean; standard deviation; maximum;
minimum; and the three traditional risk-adjusted performance measures of the Sharpe ratio
(Sharpe, 1966), the Treynor ratio (Treynor, 1965) and the Jensen-alpha (Jensen, 1968), as
calculated based on Equations 4.1, 4.4, and 4.5 respectively. The standard errors from the
Jensen‘s alpha regression were corrected for autocorrelation and Heteroskedasticity problems
using the Newey-West procedure.220
The matched pair portfolios contain just a few stocks
ranging from 4 stocks in matched pair portfolios (III) to 13 in matched pair portfolios (I).221
In
219 In chapter 7 any new listed companies during the sample years are considered and the portfolios are rebalanced for the following year, as elaborated in chapter 6. 220 The CP portfolio is not used as a benchmark in this matched pairs comparison, because CP is a well-diversified portfolio that includes all the stocks in the study. 221 This could be considered a limitation of using matched pair approach, as it was difficult to create larger portfolios based on defined matching criteria. Nevertheless, some studies have found that diversifiable risk can be eliminated with a random selection of 10 securities (Evans and Archner, 1968), while others argue that there is a significant reduction in risk moving from 10 shares to 25 (Poon et al.,1992).

303
addition, Figures 8.1- 8.5 plot the return performance for the matched pair portfolios against
the KSE index.

304
Table 8.1: Descriptive Statistics and Performance Measures for the Five Matched Pairs portfolios
Panel A: The Full period (2006-2011)
Pair (I) Pair (II) Pair (III) Pair (IV) Pair (V) KSE
Index PH (A) Sin(A) PH(B) MH(A) Sin(B) MH(B) PH (C) MH
(Halved)(A)
Sin (C) MH
(Halved)(B)
Mean -0.0023 -0.0015 -0.0041 -0.0044 -0.0009 -0.004 -0.0043 -0.0011 -0.0015 -0.0051 -0.0022
St. Dev. 0.0408 0.0373 0.0458 0.0419 0.0377 0.0474 0.0439 0.0453 0.0404 0.0469 0.0235
Max. 0.1575 0.1560 0.1480 0.1210 0.1202 0.2043 0.1445 0.2395 0.1750 0.1396 0.0791
Min. -0.3096 -0.2309 -0.2036 -0.1509 -0.1719 -0.3755 -0.1916 -0.2260 -0.1695 -0.1894 -0.0984
Sharpe Ratio -1.2177 -0.9729 -1.8138 -2.0908 -0.6989 -1.6888 -1.9674 -0.6436 -0.9189 -2.1345 -2.0510
Treynor Ratio -0.8347 -0.6975 -1.2763 -1.3986 -1.4614 -4.4428 -1.3748 -0.3895 -1.6300 -1.6924 -0.8514
Jensen Alpha 0.0001 0.0005 -0.0016 -0.0019 -0.0037 -0.0037 -0.0019 0.0020 -0.0010 -0.0028 -0.0000
Panel B: The Bullish period (2006-2007)
Pair (I) Pair (II) Pair (III) Pair (IV) Pair (V) KSE
Index PH (A) Sin(A) PH(B) MH(A) Sin(B) MH(B) PH (C) MH
(Halved)(A)
Sin (C) MH
(Halved)(B)
Mean 0.0035 0.0013 0.0002 -0.0027 -0.0003 -0.0086 -0.0002 0.0023 -0.0016 -0.0075 0.0008
St. Dev. 0.0244 0.0244 0.0334 0.0343 0.0393 0.0618 0.0324 0.0322 0.0333 0.0483 0.0219
Max. 0.0559 0.0621 0.1480 0.1092 0.1202 0.2043 0.1445 0.1231 0.0966 0.1120 0.0494
Min. -0.0639 -0.0731 -0.1142 -0.0990 -0.1719 -0.3755 -0.1074 -0.1049 -0.0914 -0.1894 -0.0862
Sharpe Ratio 1.0413 0.1280 -0.2616 -1.0943 -0.3504 -1.5892 -0.3814 0.3897 -0.7955 -1.7949 -0.1087
Treynor Ratio 0.3729 0.0548 -0.1096 -0.4007 -0.2323 -1.559 -0.1540 0.1594 -0.9448 -0.6079 -0.0243
Jensen Alpha 0.0027 0.0004 -0.0007 -0.0035 -0.0012 -0.0095* -0.0010 0.0014 0.4363 -0.0082** -0.0000

305
Panel C: The Financial crisis period (2008-2009)
Pair (I) Pair (II) Pair (III) Pair (IV) Pair (V) KSE
Index PH (A) Sin(A) PH(B) MH(A) Sin(B) MH(B) PH (C) MH
(Halved)(A)
Sin (C) MH
(Halved)(B)
Mean -0.0087 -0.0064 -0.0055 -0.0056 -0.0026 -0.0016 -0.0058 -0.0050 -0.0020 -0.0043 -0.0054
St. Dev. 0.0616 0.0518 0.0596 0.0503 0.0373 0.0456 0.0569 0.0652 0.0433 0.0513 0.0306
Max. 0.1575 0.1560 0.1308 0.1210 0.1029 0.1931 0.1230 0.2395 0.1131 0.1396 0.0791
Min. -0.3096 -0.2309 -0.2036 -0.1509 -0.1547 -0.1186 -0.1916 -0.2260 -0.1695 -0.1874 -0.0984
Sharpe Ratio -1.5184 -1.3487 -1.0060 -1.2096 -0.8225 -0.458 -1.1155 -0.8463 -0.5592 -0.9468 -1.9480
Treynor Ratio -0.7151 -0.6448 -0.4283 -0.5615 -1.0165 -1.1951 -0.4785 -0.3485 -0.5379 -0.5823 -0.6098
Jensen Alpha -0.0013 -0.0004 0.0025 0.0005 -0.001 -0.001 0.0017 0.0040 0.0003 0.0002 0.0000
Panel D: The Bearish period (2010-2011)
Pair (I) Pair (II) Pair (III) Pair (IV) Pair (V) KSE
Index PH (A) Sin(A) PH(B) MH(A) Sin(B) MH(B) PH (C) MH
(Halved)(A)
Sin (C) MH
(Halved)(B)
Mean -0.0015 0.0007 -0.0071 -0.0050 0.0001 -0.0017 -0.0070 -0.0005 -0.0011 -0.0035 -0.0018
St. Dev. 0.0224 0.0290 0.0399 0.0393 0.0363 0.0286 0.0384 0.0285 0.0437 0.0402 0.0146
Max. 0.0594 0.0767 0.1003 0.1106 0.1110 0.1046 0.0943 0.0763 0.1750 0.1314 0.0429
Min. -0.0675 -0.0967 -0.1146 -0.1047 -0.1501 -0.1100 -0.1078 -0.0760 -0.1083 -0.1420 -0.0467
Sharpe Ratio -0.7858 0.1456 -1.8865 -1.3553 -0.0292 -0.6906 -1.9264 -0.2689 -0.3109 -0.9471 -1.4546
Treynor Ratio -0.3499 0.0532 -1.0855 -0.3639 -0.0614 -0.6290 -1.0450 -0.0659 -0.3146 -0.3558 -0.2173
Jensen Alpha -0.0007 0.0021 -0.0059** -0.0021 0.0003 -0.0013 -0.0057** 0.0017 -0.0004 -0.0015 0.0000
Note: This table provides some descriptive statistics and the three performance measures, namely: Sharpe Ratio, Treynor Ratio, and Jensen Alpha for five value
weighted matched pairs portfolios and the KSE index as a benchmark during the full sample period (in panel A) and the three sub periods (in panels B-D). The
matched pairs are based on matching 13 PH and Sin stocks, 8 PH and MH stocks, 4 Sin and MH stocks, 9 PH and MH (Halved) stocks, and finally 5 MH (Halved) and
Sin stocks. PH=Pure Halal stocks, Sin= non-Halal portfolio based on their core activities (non-compliance with the qualitative screening criteria), MH=Mixed Halal
stocks based on compliance with AAOIFI‘s 2006 screening criteria, and MH (Halved)= Mixed Halal stocks based on compliance with the halved AAOIFI‘s 2006
screening criteria. The standard errors from the Jensen‘s alpha regression were corrected for autorotation and Heteroskedasticity problems using the Newey-West
procedure. *Indicates that Jensen alpha values are significant at the 10% level. ** Significant at the 5% level.

306
The analysis in Table 8.1 shows that the risk-adjusted performance of the matched pairs‘
portfolios varied across the sample periods, especially before and after the GFC. Unlike the
previous chapter, some portfolios did not perform well, even in the bull market. This could be
due to the individual performance of each stock within each portfolio as there are a smaller
number of stocks in each compared to the portfolios created in Chapter 7.
For matched pair (I), Table 8.1 and Figure 8.1 show that the PH (A) portfolio is only better
than the Sin (A) portfolio during the bullish period. This finding is in line with the findings
outlined in section 7.5 whereby PH underperformed the Sin portfolio during the bearish period
although the performance of the PH outperformed that of the Sin during the full sample period.
Figure 8.1: The performance of the PH (A) and Sin (A) Matched Pair Portfolios (I)
during the Full Sample Period (2006-2011)
Note: This figure plots the return performance of PH and Sin matched pair portfolios and the KSE index as a
benchmark indexed from 100 at 4/1/2006-28/12/2011. Each portfolio contains 13 stocks. PH= Pure Halal
portfolio, Sin= non-Halal portfolio based on their core activities (non-compliance with the qualitative
screening criteria).
Based on the Sharpe ratio, the PH portfolio beat the KSE index during all sample periods,
consistent with the findings outlined in section 7.6. Based on the Treynor and Jensen measures,
the PH (A) portfolio beat the KSE index during the bullish and full sample periods while the
Sin (A) portfolio beat the KSE index during the bearish period. However, neither the PH (A)
10
30
50
70
90
110
130
150
170
4/1/2006 4/1/2007 4/1/2008 4/1/2009 4/1/2010 4/1/2011
PH Sin KSE

307
nor the Sin (A) portfolios beat the KSE index during the GFC period. This is because the KSE
index had the lower risk as it is diversified, containing all listed stocks.
For the results of the matched pair (II) portfolios, Table 8.1 and Figure 8.2 reveal that the PH
(B) portfolio outperformed its MH (A) matched pair during all sample periods except for the
bearish period, during which the MH (A) portfolio only slightly outperformed the PH(B)
portfolio. This confirms the previous findings that PH portfolios do not do so well during the
bearish period.
Figure 8.2: The performance of the PH (B) and MH (A) Matched Pair Portfolios (II)
during the Full Sample Period (2006-2011)
Note: This figure plots the return performance of PH and MH matched pair portfolios and the KSE index as a
benchmark indexed from 100 at 4/1/2006-28/12/2011. Each portfolio contains 8 stocks. PH= Pure Halal
portfolio, MH=Mixed Halal stocks according to AAOIFI‘s 2006 screening criteria.
The results also show that both the PH (B) and MH (A) underperformed the KSE index during
the GFC period across all performance measures, while the MH (A) outperformed during the
bearish period by the Sharpe ratio. The PH (B) outperformed the KSE index during when the
full sample is considered; the result is inconsistent with the findings reported in section 7.6 that
the MH portfolios did better than the PH during all sample periods, apart from the bearish
period. While Figure 8.2 shows that the return rates of PH (B) and MH (A) are lower than the
0
20
40
60
80
100
120
140
160
4/1/2006 4/1/2007 4/1/2008 4/1/2009 4/1/2010 4/1/2011
PH MH KSE

308
return of KSE, the Sharpe ratios show that PH (B) outperformed the KSE during the GFC
period but the MH (A) outperforms both the PH (B) and KSE during the bearish period.
Therefore, PH stocks may be complements to MH stocks in maximizing risk-adjusted
performance, in contrast to the interviewed fund managers‘ perceptions that it was a
disadvantage to include many PH stocks in an Islamic fund. This advocates that investing in
both PH and MH stocks could boost Islamic funds‘ performance because, if one group does not
do well in certain market cycles, the other may counterbalance this.
The results of the matched pair (III) portfolios as shown in Table 8.1 demonstrates that the Sin
(B) portfolio outperforms MH (B), apart from the GFC period when the MH portfolio beat the
Sin based on the Sharpe ratio. The Sin (B) portfolio in this matched pair also beats the KSE
index during the bearish period by all performance measures but struggled to do so before and
during the GFC, while the MH (B) matched pair portfolio was only able to beat the KSE index
during the full sample period by the Sharpe ratio alone. Figure 8.3 illustrates this return
performance gap graphically.
Figure 8.3: The performance of the Sin (B) and MH (B) Matched Pair Portfolios (III)
during the Full Sample Period (2006-2011)
Note: This figure plots the return performance of MH and Sin matched pair portfolios and the KSE index as a
benchmark indexed from 100 at 4/1/2006-28/12/2011. Each portfolio contains 4 stocks. MH=Mixed Halal stocks
according to AAOIFI‘s 2006 screening criteria, Sin= non-Halal portfolio based on their core activities (non-
compliance with the qualitative screening criteria).
0
20
40
60
80
100
120
140
4/1/2006 4/1/2007 4/1/2008 4/1/2009 4/1/2010 4/1/2011
MH Sin KSE Index

309
Therefore, if investors are risk neutral and choose stocks or portfolios based on returns only,
then they will invest in the KSE. In contrast, by taking into account total risk (measured by the
Sharpe ratio), MH is preferable from investing in the KSE, even for conventional investors
during all sample periods, apart from the bullish period. However, risk averse investors would
still prefer Sin to MH and KSE, unlike religious driven investors who might still stick to Halal
stocks.
From matched pair (IV) portfolios as shown in Table 8.1 and Figure 8.4, the PH (C) portfolio
and KSE index underperformed MH (Halved) (A) across all sample periods.
Figure 8.4: The performance of the PH (C) and MH-Halved (A) Matched Pair Portfolios
(IV) during the Full Sample Period (2006-2011)
Note: This figure plots the return performance of PH and MH (Halved) matched pair portfolios and the KSE
index as a benchmark indexed from 100 at 4/1/2006-28/12/2011. Each portfolio contains 9 stocks. PH= Pure
Halal portfolio, and MH-halved= Mixed Halal stocks based on compliance with the halved AAOIFI‘s 2006
screening criteria.
0
20
40
60
80
100
120
140
160
4/1/2006 4/1/2007 4/1/2008 4/1/2009 4/1/2010 4/1/2011
PH MH(Halved) KSE Index

310
Furthermore, the PH (C) underperformed the KSE index during the bullish and bearish periods.
This finding is consistent with that outlined in section 7.6.222
This indicates that halving the
screening thresholds,223
makes the MH (Halved) (A) portfolio beat the market benchmark and
PH (C) portfolio. Therefore, for Islamic funds and religious driven investors who invest mainly
in PH stocks, investing in the MH (Halved) stocks is the optimal Halal investment alternative,
because the MH (Halved) are seen by Shariah scholars and other interviewees in chapter 5 to
be more Shariah-compliant than MH classified stocks based on current AAOIFI screens.
The results from Table 8.1and Figure 8.5 below, on the other hand, show that the MH (Halved)
(B) in the matched pair (V) consistently underperformed its Sin counterpart portfolio.224
Both
the MH (Halved) (B) and Sin (C) matched pairs tracked the risk-adjusted performance of the
KSE index, apart from the full sample period, where both portfolios performed worse than the
KSE index by the Treynor and Jensen measures, while only the Sin (C) portfolio did better
than the KSE on the Sharpe ratio.
222 In section 7.6 the MH (Halved) stocks did perform better than the PH and the KSE index during the full, the bullish, and the crisis periods; however, the matched pair (IV) results in this section shows that the MH (Halved) (A) stocks were also able to beat the PH (C) and the market index during the bearish period. 223 Which means making the definition of MH stocks ‘tighter’ than the original definition suggested by AAOIFI 2006. 224 Except in the bullish period, MH (Halved) (B) beat Sin (C) on Treynor measure.

311
Figure 8.5: The performance of the MH-halved and Sin Matched Pair Portfolios (V)
during the Full Sample Period (2006-2011)
Note: This figure plots the return performance of MH-halved and Sin matched pair portfolios and the KSE index
as a benchmark indexed from 100 at 4/1/2006-28/12/2011. Each portfolio contains 5 stocks.MH-halved= Mixed
Halal stocks based on compliance with the halved AAOIFI‘s 2006 screening criteria. Sin= non-Halal portfolio
based on their core activities (non-compliance with the qualitative screening criteria)
Overall, the analysis reveals that the performance of the various types of portfolios (PH, MH,
MH-Halved, and Sin) varied during different sample periods, suggesting that the Shariah-
compliance classification is not the main factor affecting the stock performance, but rather it
may be the individual performance of each Halal stock per se, the sector to it belongs, or the
time period.225
This mixed result of Halal portfolios confirms the literature such as Hussein
and Omran (2005), Abdullah et al. (2007), Merdad et al. (2010), Hassan (2009), and Ashraf
(2013) which show that Islamic portfolios performs differently over different sample periods.
However, in most cases Sin stocks tend to outperform their Halal counterparts as revealed
from Figures 8.6-8.9 (and Appendix 8.2 for a summary of all matched pairs).
225 The next section investigates certain key factors that might affect stocks performance in addition to sector and firm’s size, namely: Stocks’ Shariah classification and GFC.
0
20
40
60
80
100
120
140
1/4/2006 1/4/2007 1/4/2008 1/4/2009 1/4/2010 1/4/2011
MH(Halved) Sin KSE Index

312
Figure 8.6: Return and Risk of the Matched Pairs Portfolios for the Full Sample Period
(2006-2011)
0.0500.0450.0400.0350.0300.0250.020
-0.001
-0.002
-0.003
-0.004
-0.005
St. Dev.
Me
an
KSE Index
Sin (C)
MH ( Halved) (B)
MH (Halved) (A)
PH (C)
MH (B)
Sin (B)
MH (A)
PH (B)
Sin (A)
PH (A)
Note: This figure shows the return (mean) and risk (standard deviation) of each portfolio in the matched
pairs over the full sample period.
Figure 8.7: Return and Risk of the Matched Pairs Portfolios for the Bullish Period (2006-
2007)
0.060.050.040.030.02
0.0050
0.0025
0.0000
-0.0025
-0.0050
-0.0075
-0.0100
St. Dev.
Me
an
KSE Index
Sin (C)
MH ( Halved) (B)
MH (Halved) (A)
PH (C)
MH (B)
Sin (B)
MH (A)
PH (B)
Sin (A)
PH (A)
Note: This figure shows the return (mean) and risk (standard deviation) of each portfolio in the matched
pairs over the bullish period.

313
Figure 8.8: Return and Risk of the Matched Pairs Portfolios for the GFC Period (2008-
2009)
0.070.060.050.040.03
-0.001
-0.002
-0.003
-0.004
-0.005
-0.006
-0.007
-0.008
-0.009
St. Dev.
Me
aN
KSE Index
Sin (C)
MH (Halved) (B)
MH (Halved) (A)
PH (C)
MH (B)
Sin (B)
MH (A) PH (B)
Sin (A)
PH (A)
Note: This figure shows the return (mean) and risk (standard deviation) of each portfolio in the matched
pairs over the global financial crisis period.
Figure 8.9: Return and Risk of the Matched Pairs Portfolios for the Bearish Period (2010-
2012)
0.0450.0400.0350.0300.0250.0200.015
0.001
0.000
-0.001
-0.002
-0.003
-0.004
-0.005
-0.006
-0.007
-0.008
St. Dev.
Me
an
KSE Index
Sin V
MH ( Halved) V
MH (Halved) IV
PH IV
MH III
Sin III
MH II
PH II
Sin I
PH I
Note: This figure shows the return (mean) and risk (standard deviation) of each portfolio in the matched
pairs over the bearish period.

314
The analysis shows that the Sin portfolios in general performed well over the full period and
after GFC, in particular the Sin portfolio in matched pair (I) did the best.226
This finding is
supported by the findings of Fabozzi et al. (2008), Hong and Kacpercyzk (2009), and Liston
and Soydemir (2010) who find that ‗sin‘ stocks earn higher risk-adjusted returns. Fabozzi et al.
(2008) for instance, found that their sin portfolios outperformed common benchmarks; while,
Liston and Soydemir (2010) revealed that their sin portfolio outperformed the faith-portfolio.
Nevertheless, Kim and Venkatachalam (2008) argue that, despite the superior returns of sin
stocks, investors are willing to neglect them and accept a financial cost to comply with social
norms.
The positive impact of CBK‘s intervention after the GFC is reflected in these findings, as the
NBK had a weight of 74% of the Sin portfolio (matched pair I) as shown in Appendix 8.1 and
this institution benefited the most from the CBK‘s actions. In addition, the major shareholder
of NBK is a well-known merchant family which also supported its bank after the crisis.
Further, the Kuwaiti government invested more to pop up conventional companies and
conventional investment funds than Islamic ones, as reported in the interviews, and thus
supported them more after the crisis. Not only was Sin (A) in matched pair (I) the best, but also
the PH (A) portfolio in matched pair (I) did well especially before the GFC. This highlights the
sectorial impact, since 70-74% of the portfolio‘s components were banks (see Appendix 8.1).
Hence, the banking sector performed the best before and after the crisis, driving the
performance of these portfolios. Figures 8.6-8.9 also show that the KSE index had the lower
risk as it is diversified, containing all listed stocks.
226 Sin (A) was the only portfolio that achieved positive performance across all return and risk-adjusted measures after the GFC (see table 8.1).

315
Finally, it can be inferred from Table 8.1 and Appendix 8.1 that, in order to maximize Islamic
funds‘ performance, PH stocks from the banking sector and MH (Halved) stocks from the real
estate and service sectors should be included.227
Nonetheless, the findings of this section should be interpreted cautiously, because the number
and size of the stocks in these matched pair portfolios are small, except KFH and NBK in the
PH (A) and Sin (A) portfolios of matched pair (I).228
Hence, to overcome this shortcoming the
remainder of this chapter extends the analysis by using another approach that employs a wider
sample of stocks and controls for more factors to examine their impact on the portfolios‘
performance.
8.3 Analysis of Factors affecting the Financial Performance of Stocks in KSE
The findings in the previous chapter and former section show that there are some differences
between the performance of Halal and non-Halal portfolios over certain sample periods. The
matched pair approach in Section 8.2 attempted to control for two key factors that might affect
stocks performance; size and sector but, since the number of stocks was small and not all
sectors were represented in each matched pair portfolio, a GLM is now fitted to the time series
data to explore how size, sector and time period might influence different stocks‘ returns to
investigate whether the Shariah classification of stocks to Halal (PH and MH) and non-Halal
(Sin and MS) is important. The factors incorporated in the GLM were as suggested by the
interviewees in Chapter 5.
The data in this thesis involves the impact of the GFC that started to impact the financial sector
in the US in late 2007 (Senbet and Gande, 2009; Buckley, 2011; Trabelsi, 2011; Samarakoon,
227 This is true especially during the bull and bear markets and concentrate more on the MH (Halved) during sharp stock market crashes. 228 The stocks of KFH and NBK are ranked on the top three large sized stocks in whole KSE market. See (Table 2.5 in Chapter 2), and discussion about the impact of the large 4 stocks in KSE on the performance of the weighted-value portfolios in Chapter 7 and their performance in Appendix 7.4.

316
2011; Neaime, 2012; Karim et al., 2012; Bourkhis and Nabi, 2013). The Sub-prime crisis from
the last quarter of 2007 in the US affected global financial institutions (Trabelsi, 2011) and led
US and European banks to lose their values and damage global stock markets (Buckley, 2011;
Örnberg et al., 2013).229
Senbet and Gande (2009) note that emerging markets, including the
GCC oil rich countries, seemed to be unaffected by the initial 2007 sub-prime crisis, but they
too were hit eventually when, after a relatively stable first half in the US in 2008 due to the
central banks‘ repetitive interventions, tensions intensified again in September 2008 after
Lehman Brothers declared bankruptcy (Buckley, 2011; Trabelsi, 2011; Bourkhis and Nabi,
2013; Örnberg et al., 2013). Hence, different studies may vary in determining the cut off points
of the start and end of the GFC period. For instance, Karim et al. (2012) define the GFC from
July 2007- Dec. 2008. Similarly Baurkhis and Nabi (2013) denote 2007/2008 as their GFC
period, while Karim et al. (2012) expands the end of the GCF period to Dec. 2011. Other
studies use the period 2008-2009 as their GFC period (Samarakoon, 2011; Örnberg et al.,
2013) as defined in Chapter 7 and the matched pairs in the previous section. The GLM model,
however (sections 8.3 and 8.4) refines the two year GFC period (2008-2009) to a narrower 15
months period from November 2007 to February 2009. This definition of GFC tallies with the
literature (Senbet and Gande, 2009) and, most importantly, with the structural break in global
stock markets as shown in Figure 8.10, which plots the performance of the Kuwait, US and
other world indices. This shows that structural brake in Kuwait occurred 3 months after other
major stock markets. Therefore, in order to examine the impact of GFC on KSE, three months
229 Buckley (2011) notes that 2007 was the year when US home sales fell and the subprime mortgage business collapsed. For instance, on August 31 2007, Ameriquest, once the largest US subprime lender, went out of business. On the first of November 2007 the Federal Reserve injected USD 41 billion for banks to borrow at a low rate, the largest single expansion by the Fed since 2001, and on December 12 2007, central banks, the Federal Reserve, Bank of England, Swiss National Bank and Bank of Canada announced measures designed to deal with pressures in short-term funding markets.

317
before the structural break that occurred in KSE was chosen based on the global stock markets
structural break.
Figure 8.10: Performance of different MSCI market Indices
Note: this figure shows the monthly performance of the MSCI index for the world and several different
countries, namely: Kuwait, Saudi Arabia, UK, US, and Turkey from Dec.2005-Dec. 2011.
Source: MSCI official website
Unlike mainstream studies that use cross-sectional regression analysis to explain stocks or fund
returns (such as Gregory et al., 1997; Bilson et al., 2001; and Kreander, 2005), this study
employs a GLM, that allows more than two factors to interact and be investigated at the same
time as well as the effects of individual factors. This section attempts not only to capture the
effect of Halal and non-Halal stocks (the Shariah classification) on stock returns but also the
effect of them being in different sectors or of different sizes, and in different years which also
considers the impact of the GFC. The results of the analysis will provide some insights to
explain the previous findings of portfolio performance in chapter 7.
This investigation is conducted for a wider number of stocks compared to the matched pair
approach adopted in the previous section, as all KSE stocks that were in existence for the
whole sample period are included, from 2006 until 2011. This produces a sample of 135
20
40
60
80
100
120
140
160
Dec
01
, 200
5
Ap
r 01
, 200
6
Au
g 01
, 200
6
Dec
01
, 200
6
Ap
r 01
, 200
7
Au
g 01
, 200
7
Dec
01
, 200
7
Ap
r 01
, 200
8
Au
g 01
, 200
8
Dec
01
, 200
8
Ap
r 01
, 200
9
Au
g 01
, 200
9
Dec
01
, 200
9
Ap
r 01
, 201
0
Au
g 01
, 201
0
Dec
01
, 201
0
Ap
r 01
, 201
1
Au
g 01
, 201
1
Dec
01
, 201
1
KUWAIT
SAUDI ARABIA
UK
USA
WORLD
TURKEY

318
company stocks drawn from all sectors,230
comprising 31 ‗PH‘, 37 ‗Sin‘, 50 ‗MH‘ and 17 ‗MS‘
stocks.231
The Shariah classification of stocks was allowed to change annually based on the
screening conducted in chapter 6. The model controls for newly listed stocks, unlike the
portfolio performance in Chapter 7 which allowed newly listed companies to be screened and
included in the relevant portfolios during the sample period. Appendix 8.3 reports the 135
companies‘ sample information. Similar to Chapter 7 and the prior section, the same set of
weekly panel data was obtained from DataStream to be used for the GLM. The null hypotheses
test the effects of the following 4 factors on the mean stock returns: (i) Shariah classification of
stocks232
; (ii) company size; (iii) sector; and (iv) the global financial crisis (GFC).233
The null
hypotheses also test the interactions between the 4 explanatory factors on the means of the
stock returns. The final model took the following form:
Where is the return of company that has a Shariah classification , listed in sector
of size ; during the GFC period or not; is the overall mean return of company for the
whole time period. is the main effect for the stocks‘ Shariah classification , where = 1, 2,
230 Apart from non-Kuwaitis sector which was excluded from the sample period because data were unavailable on DataStream, as discussed in chapter 6. 231 After halving AAOIFI’s thresholds screening criteria as of 31/12/2005, the MH decreased to 42 stocks while the MS increased to 25 stocks. 232 The Shariah classification of stocks is based on the screening in chapter 6: PH, MH, MS, and Sin and after halving the financial screening criteria thresholds; MH (Halved) and MS (Halved). AAOIFI’s 2006 screening criteria are used to classify mixed stocks for the GLM model for the same reason discussed in the matched pairs section. 233 The GLM originally used an additional fifth factor, namely: timed period- represented by the ‘year’ of sample period to reflect market cycles. However, since using both the year and the GFC factors exposed the model to a confounding problem, which occurs when the data are such that it is not possible to estimate both of the two parameters as the same data is affected by each parameter (similar impact of multicollinearity problem), the year factor was then dropped.

319
3, 4 representing the PH, Sin, MH, and MS234
respectively. is the main effect for sector ,
where is assigned values from 1-7 to indicate: banking, investment, insurance, real estate,
industrial, service, and food. is the main effect for size , where varies between 1- 3 to
identify the firm size.235
Finally, a dummy variable was introduced into the model to
examine the main effect for the GFC, where = 1 if the stocks return is during this time
period, or = 0 otherwise. As noted earlier, November 2007 to February 2009 was chosen to
represent the GFC period.
The terms that denote the two levels of interaction between the main factors are as follows:
is the interaction effect for the stock‘s Shariah classification and their sector ;
shows the interaction effect for the stock‘s Shariah classification and company size ;
denotes the interaction effect for the stock‘s Shariah classification and the crisis period ;
indicates the interaction effect between sector and company size ; represents
the interaction effect for sector and the financial crisis period ; is the interaction
between company size and the financial crisis period . The terms that represent the three
level interactions are as follows: is the interaction effect for stocks‘ Shariah
classification , sector and company‘s size ; is the interaction effect for stocks‘
Shariah classification , sector , and financial crisis ; is the interaction effect for
stocks‘ Shariah classification , company size and financial crisis ; is the
interaction effect for sector , company‘s size and financial crisis ; is the four
level interaction effect the interaction effect for the stock‘s Shariah classification , sector ,
firm‘s size and financial crisis . Finally, denotes the random error term for company
234 The Shariah classification of stocks was reassigned after halving the AAOIFI’s financial screening criteria and the model was rerun. 235 The market capitalization of the firms is based on average weekly values for the whole sample periods from
2006-2011. Firms with an average market capitalization of not more than KD 100 million are categorized as small, while firms with an average market capitalization of between KD 100 million – 1 billion are categorized as medium, and firms with an average market capitalization of over KD 1 billion are considered as large.

320
which is assumed to be an independent, identically distributed random variable for the
estimation period.
An F-ratio was utilized to test the null hypothesis that the returns of the sample stocks are
unaffected by the independent factors, or by the interaction effect of their combinations. The F-
ratio was estimated as follows:
The null hypothesis is rejected if the test statistic takes values greater than the critical values of
the F-distribution with appropriate degrees of freedom, or when the p-value is less than the
significance level α. Moreover, after an F-test has shown significance, the Bonferroni test is
used for multiple comparisons to determine which means differ. Finally, the model also
provides estimated means that give estimates of the predicted mean values between the main
factors in the model to allow for visualization of some of the relationships between the factors.
The model is fitted to the data twice to test the null hypotheses again after halving AAOIFI‘s
financial screening thresholds to examine whether that has an impact on stock returns. Hence,
section 8.3.1 analyses the results for the GLM using AAOIFI‘s financial screening criteria for
the Shariah classification factor, while section 8.3.2 analyses the results of the GLM using
AAOIFI‘s halved financial screening thresholds for the Shariah classification factor.236
236 Only the mixed Halal stocks (MH) and the mixed sin stocks (MS) will be affected by halving the AAOIFI’s financial screening thresholds, because the pure Halal stocks (PH) and the sin stocks (Sin) are screened based only on the first level of screening (sector compliance) rather than on the financial screening criteria (the second level of screening), as detailed in chapter 6.

321
8.3.1 The Results of the GLM Analysis Using AAOIFI’s (2006) Screening Criteria for the
Shariah Classification Factor
Table 8.2 summarizes the results obtained by estimating equation [8.1]. The sum of the
squares, degrees of freedom, mean square, F-ratio and the P-value for the F-test are reported
for each main factor under investigation and the related interaction factor groups.
Table 8.2: Results of the GLM the Analysis, Factors and Interaction Effects
Source of Variation Sum of
Squares
Degrees
of
Freedom
Mean
Square
F-ratio P-value
Corrected Model 1.384a 68 .020 3.940 .000
Intercept .197 1 .197 38.181 .000
Shariah Classification .002 3 .001 .141 .936
Sector .104 6 .017 3.372 .003
Size .002 2 .001 .148 .863
GFC .236 1 .236 45.706 .000
Shariah Classification * Sector .055 9 .006 1.185 .300
Shariah Classification * Size .025 5 .005 .973 .432
Shariah Classification *
Financial Crisis
.015 3 .005 .964 .409
Sector * Size .009 4 .002 .457 .767
Sector * GFC .066 6 .011 2.141 .046
Size * GFC .017 2 .009 1.669 .188
Shariah Classification * Sector *
Size
.007 4 .002 .355 .841
Shariah Classification * Sector
* GFC
.126 9 .014 2.701 .004
Shariah Classification * Size *
GFC
.012 4 .003 .595 .666
Sector * Size * GFC .016 4 .004 .754 .555
Shariah Classification * Sector *
Size * GFC
.011 4 .003 .519 .722
Error 217.879 42186 .005
Total 219.866 42255
Corrected Total 219.263 42254
Notes: The table reports the analysis of variance of the weekly returns for the sample stocks for the full sample
period from 4/1/2006-28/12/2011. The p-value shows the significance of the F-ratio that tests whether any of the 4
main factors: Shariah classification; sector; size; and global financial crisis (GFC), or their interactions is
significant. Bold are the significant values.

322
Several interesting findings emerge from the analysis shown in Table 8.2.237
To begin with, the
GFC factor appears to be the most significant factor impacting stock returns (F-ratio=45.706,
p-value=.000).This implies that the stock returns of the KSE differ during the GFC which
supports the findings in section 7.5 and the matched pairs analysis in the previous section that
show different performance patterns before, during and after the 2008-2009 crisis. In addition,
this is also consistent with the interviewees‘ input in Chapter 5 and with prior studies which
have found that the time horizon matters when explaining stock returns (Sinclair et al., 1996;
Fifield et al., 1999; Middleton, 2006; Abdullah et al., 2007; Hayat and Kraeussl, 2011; Hassan,
2009).
Interestingly, the analysis in Table 8.2 shows that there is evidence of a significant effect of
sector on stock returns (F-ratio=3.372, p-value=0.003), implying that different sectors in KSE
performed differently during the sample period. Such a finding corroborates those from the
interviews, outlined in chapter 5 and prior studies on KSE such as Almujamed (2011), Al-
Mutari (2011), and other studies on emerging markets such as Middleton (2006) who found
that the performance of stocks in different sectors varies through time in several central and
Eastern European emerging markets, and Evrensel and Kutan (2007) who found that financial
sector returns behaved differently from non-financial sector returns during the Asian financial
crisis in Indonesia, Korea, and Thailand. The analysis, however, shows that the interaction
effect between sector and Shariah classification (F-ratio= 1.185 and p-value =0.300) or
237 It is worth noting that the the coefficient of determination for the model is only 0.05 indicating that that the model is incapable of explaining most of the total variation in the stock returns of the KSE market. Nevertheless, similar studies that attempted to explain stock returns also suffered from low , such as Fifield et al. (1999), Bilson et al. (2001) and Kreander et al. (2005). In addition, more factors were investigated in the literature which explain the variations in stock returns; for instance, the effect of a company’s specific factors like the EPS, ownership structure and capital structure or macroeconomic factors such as interest rate, oil prices, and GDP. However, since the aim of this investigation was to examine the impact of certain factors under investigation, rather than to predict or explain variations in stock returns, maximizing was not an objective. Furthermore, there were limitations imposed related to the computational power of the model and the statistical software used to calculate all of the interaction effects for all factors and the unavailability of the most required data. Thus, the number of incorporated factors had to be reduced.

323
between sector and firm size (F-ratio= 0.973 and p-value =0.432) tend to be insignificant,
indicating that the performance of Halal and non-Halal stocks or stocks of different sizes did
not vary on a sector basis. However, the interaction effect between the GFC and sector
appeared to also be significant (F-ratio=2.141, p-value=.046) suggesting that performance of
stocks in different sectors performed differently during the GFC. These findings are consistent
with many interviewees‘ input, who thought that, regardless of stocks‘ Shariah classification,
overall, the banking and investment sectors were hit most during the crisis.238
Interestingly, and most importantly, Table 8.2 establishes that there is no reward or penalty for
Halal investing (PH and MH) and highlights that the GFC affected the performance of stocks
in the KSE, irrespective of their Shariah classification. This finding is consistent with that of
the parametric and non-parametric tests reported in section 7.3 and 7.6. In addition, it is
consistent with many of the interviewees‘ thoughts, outlined in chapter 5, and prior studies,
such as Elfakhani et al. (2005), Girard and Hassan (2008), Hasan and Dridi (2010), Parashar
(2010),239
Rahimie (2010), Hassan et al.(2010), and Zarrouk (2012).This finding brings good
news for Islamic or religious-driven investors, as they are not penalized compared to
conventional investors during normal period, because the Shariah classification factor is not
significant in itself, or at any of the two level interactions between the Shariah factor with
other factors. Nonetheless, the three level interaction effect between GFC, sector, and stocks‘
Shariah classification is significant (F-ratio= 2.701 and p-value =0.004), suggesting that the
238 The banking sector recovered the quickest in 2010 due to CBK intervention, while the vast majority of investment companies were still suffering and some of them were delisted in 2012. The performance of different sectors is examined later in this section. 239 Hasan and Dridi (2010) suggested that the Islamic banks (which are considered PH stocks in this study) have been affected differently to the conventional banks, whereby variables related to the Islamic banks’ business model reduced the adverse effect on profitability in 2008. However, weaknesses in risk management practices in some Islamic banks led to a larger decline in profitability in 2009 compared with conventional banks. Parashar (2010) shows that the conventional banks have suffered more than the Islamic banks during the GFC in terms of return on average assets and liquidity, while the Islamic banks have suffered more in terms of capital ratio, leverage and return on average equity.

324
Halal and non-Halal stocks within different sectors performed differently during the GFC.240
This supports the interviewees‘ argument in Chapter 5 who noted that the performance of the
Halal and non-Halal stocks were different during and after the GFC.
Finally, Table 8.2, finds that firm size does not explain variations in stock returns, (F-
ratio=0.148, p-value=0.863)241
unlike some studies that find evidence of a size effect such as
Fifield et al. (1999), Kreander et al. (2005) and Almujamed (2011),242
but in line with the
findings of Gregory et al. (1997),243
and Middleton (2006).
As the sector was significant, further analysis was carried out in order to determine the
performance of different sectors and a Bonferroni244
post hoc test was conducted to investigate
the pairwise comparisons for the stock returns in each sector, as reported in Table 8.3.245
Although the year factor is dropped from the model, as it confounds the GFC factor, a
Bonferroni test for the year factor was also conducted to measure the impact of GFC over the
sample period (2006-2011) and is reported in Table 8.4.
240 The three level interactions between GFC, sector, and stocks’ Shariah classification is elaborated later in this chapter. 241 As a robustness check, an attempt was made further to investigate the firm size effect. Thus, a lower classification cut-off was constructed to allocate fewer companies to each size category. Hence, size was classified from 1-6 to be 6 categories instead of 3, consisting of stocks with the largest market capitalization to stocks with the smallest market capitalization. In addition, size was further classified from 1-9 and then from 1-16 classifications; however, the size effect was not significant in all cases. 242 Fifield et al. (1999) and Almujamed (2011) found significant reverse size effect in their analysis of emerging markets, suggesting that larger firms outperform their smaller counterparts. For instance, Almujamed (2011) discovered that large firms’, mainly banks, outperformed smaller and medium-sized ones during his sample period from 1998-2008 for 40 companies listed in KSE, and the findings of Fifield et al. (1999) who found a reverse size effect in the analysis of seventeen emerging markets over the period 1991-1996. 243 Gregory et al. (1997) and Kreander et al. (2005) investigated the performance of ethical funds. 244 The Bonferroni test provides a pairwise multiple comparison to determine which means differ (not the interaction factors) based on the Student’s t-statistic. 245 This test was not undertaken for the Shariah classification or size factors because they were insignificant.

325
Table 8.3: Multiple Comparisons of the Mean Stock Returns of KSE in Each Sector
Sector I/J Banking Investment Insurance Real Estate Industrial Services
Banking
Investment 0.00621*
Insurance 0.00183 -0.00438
Real Estate 0.00417 -0.00204 0.00234
Industrial 0.00194 -0.00427* 0.00011 -0.00223
Services 0.00276 -0.00345* 0.00093 -0.00142 0.00082
Food 0.00123 -0.00498 -0.00060 -0.00294 -0.00071 -0.00153
Note: This table provides multiple comparisons of the mean difference for stock returns in each sector in the KSE
Market for the whole sample period from 01/04/2006-28/12/2011 using a Bonferroni test. The results in the
columns represent the mean difference between sector J-I, for instance, banking minus investment (0.00621).
* note mean difference significant at the 5% significance level.
Table 8.3 reveals that the investment sector tends to underperform all sectors and is
significantly different from the banking, industrial and service sectors, while the performance
of the baking sector is always better than the others although the other sectors are not
significantly different from each other.
Table 8.4: Multiple Comparisons of the Mean Stock Returns of KSE for each Year
Year I/J 2006 2007 2008 2009 2010
2006
2007 -0.0061*
2008 0.0077* 0.0137*
2009 -0.0002 0.0059* -0.0078*
2010 -0.0010 0.0051* -0.0087* -0.0009
2011 0.0011 0.0072* -0.0066* 0.0012 0.0021
Note: This table provides multiple comparisons of the mean differences for stock returns in each sample year in
the KSE Market for the whole sample period from 01/04/2006-28/12/2011 using a Bonferroni test. The results in
the columns represent the mean difference between year J-I, for instance, 2006 minus 2007 (-0.0061).
* note mean difference significant at the 5% significance level.
Table 8.4 uncovers that 2007 was the best year, while 2008 was the worst year for all stocks in
KSE, as expected, due to the impact of the GFC as confirmed in all of the previous analyses.
Most importantly, 2007 and 2008, that contain the GFC period, were significantly different

326
from other years. In addition, 2007 showed a recovery after a burst of a bubble in the GCC in
2006 markets (Sturm et al., 2008; Hertog, 2012) (see Chapter 2).
Unlike some of the interviewees‘ thoughts that 2011 was affected by the Arab spring and
internal domestic political disputes,246
Table 8.4 shows that 2011 was not significantly
different from 2009 and 2010. But perhaps, as the KSE had already experienced a steep
downturn during the GFC, no further significant underperformance was detected. In addition,
this supports KAMCO‘s (2012, p. 12) projection about the future performance of KSE which
stated that:
―Looking ahead, we believe that gradual recovery in Kuwait Stock Exchange will continue
throughout 2013 fuelled by the positive political environment, positive economic growth
aided by robust oil prices, expected improvement in liquidity, restoration of investors‘
confidence in the local bourse driven by the implementation of CMA bylaws and regulations
along with restructuring of the stock market and the implementation of the new Commercial
Law‖.
To examine the performance of KSE in greater depth, Figure 8.6 plots the performance of each
sector during all of the sample years (2006-2011).
246 The domestic political distress is briefly related to accusations of corruption against the previous Prime Minister (Nasser Al-Mohammed Al-Sabah); causing the government to resign several times, and the parliament to be dissolved and early elections to be called (Sabrie and Hakala, 2013). In 2009, larges-scale protests led by young activists and MPs called for serious political reforms and the removal of the Prime Minister (Sabrie and Hakala, 2013). Hence, the Emir dissolved parliament on the 18th of March 2009 and early elections took place on the 16th of May 2009, which brought a regime-friendly majority to dominate the parliament; hence, the Emir decided to keep the previous Prime Minister (Sabrie and Hakala, 2013). Just a few months after the beginning of the new parliament, in December 2009, opposition MPs filed a motion of “non-cooperation” against the Prime Minister over corruption charges, claiming that his office had misappropriated millions of dollars in the run up to the 2008 elections. But, because he had a majority in parliament, was able to stay until April 2011 when the Emir replaced him with a new Prime Minister from the Sabah family, as protests continued to build in 2010. A new parliament was elected in 2012 but with a strong opposition majority this time, which argued that the new Prime Minister was not strong enough to stand up to the corruption, and hence further called for an elected government and Prime Minister (Davidson, 2013). Yet, the opposition and youth activists continued to lead mass protests to boycott these elections. It was argued that the local political unrest during 2009-2012 seemed to impact the KSE performance and slowed down the economic projects (KAMCO, 2012). See Chapter 2.

327
Figure 8.11: KSE Sectors Performance from 2006-2011
Note: This figure plots the mean return performance of stocks in each of the 7 sectors in KSE; namely, banking,
investment, insurance, real estate, industrial, service, and food, across all sample years from 2006-2011.
Figure 8.11, shows that 2007 was the best year for most sectors in the KSE market, while 2008
was the worst. The year 2008 experienced the most significant decline, due to the impact of the
GFC, when every sector faced a sharp drop, reaching their lowest performance level, especially
the investment sector. This is because the GFC impacted on many investment companies,
particularly reflecting the high leverage these had that exposed their risks after the crisis, as
highlighted by many interviewees in chapter 5 (see Penman et al., 2007; George and Hwang,
2010; Bhatt and Sultan, 2012). The market witnessed improvements in 2009, especially food,
industry and services sectors as their operational activities were less affected compared to the

328
financial sector. The banking sector witnessed a dramatic jump reaching a peak in 2010, for the
full sample period, attributed to the government and CBK intervention after the crisis,
supporting the findings of the matched pairs analysis and many interviewees‘ thoughts in
chapter 5, that the banking sector was bailed out after the crisis.247
The insurance sector was
the least affected by the crisis, but the downward effect lasted to 2010, and this could be due to
the low trading volume of this sector, as noted by the interviews.
Figure 8.11 also illustrates that the performance of the different sectors in the market varied
more after the GFC, especially in 2010. Nevertheless, most sectors had negative returns in
2011 possibly due to the Arab spring radical political changes in the region, and the domestic
political dispute in Kuwait.
Overall, the analyses in Tables 8.4 and 8.5 and Figure 8.11 suggest that Islamic fund managers
should pay more attention to their investment allocation across different sectors in different
economic cycles e.g. invest more in food, industrial and service sectors during bearish markets
as they were the best performers. This highlights the importance of including MH stocks in
Islamic funds investment universe because only a few PH stocks exist in the non-financial
sector, and the non-financial sectors were the most profitable after the GFC period.248
In
addition, most PH stocks are concentrated in the investment and real estate sectors that were hit
the worst during the GFC. This supports the findings of Table 8.2 that the three level
interaction effect between GFC, sector, and stocks‘ Shariah classification is significant,
247 The Interviews asserted that the government intervention was essential, since the banking system has been affected by a huge decline in asset prices, low credit growth, and a limited ability to lend to the corporate sector. Moreover, they noted that banks are mainly owned by merchant families who enjoy strong political and economic power, and the government or government agencies. Merchant families and the government are usually major owners of conventional banks in Kuwait. This might explain why the vast majority of institutional and government investment funds invest heavily in banks, mainly in conventional banks, believing that the banking sector is leading the market and protected by the government as revealed from the interviews. 248 The screening in Table 6.5 shows that, in 2006, for instance, the PH stocks covered only 4% of the industrial sector, 17% of the service sector and none of the food sector. However, the MH stocks comprised 71% of the industrial sector, 49% of the service sector and 100% of the food sector (see Table 6.5 in chapter 6 for details).

329
indicating that the performance of Halal and non-Halal stocks within the different sectors
varied during the GFC period and non-GFC period. Appendixes 8.3-8.9 examines the
performance of the different Shariah classified stocks; PH, MH, MS, and Sin, across different
sectors, over time.249
Generally, the graphs of Appendixes 8.4-8.10 suggest mixed results across different sectors
over time, indicating that the Shariah classification of stocks itself does not matters but rather
the sector and time period they are in. For instance, during the years that contain the GCF
period, PH stocks did well in the real estate, industrial, and service sectors while in banking
and investment sectors, they did not do so well. In contrast, after the GFC period (2009-2011),
PH performed well in the investment but bad in the insurance, industrial and service sectors.
These findings support the previous findings that there is no penalty for PH and MH
investments. Hence, Islamic funds should diversify the Halal investments (PH and MH) across
different sectors during different markets (bullish, crisis, and bearish). For example, in
downturn markets, it is wise to include more PH stocks from the industrial sector and MH
stocks from the real estate sector. This again highlights the need to include both PH and MH
stocks in the Islamic investment universe, as they behave differently over sectors and years.
However, the results suggest that during GFC period, if Islamic funds only invest in PH stocks,
they might sacrifice financial returns, not because of the Shariah classification of their stocks,
but due to the of lack of diversification, where few PH are located in non-financial sector as
noted earlier.
Furthermore, since the results show that PH stocks, mainly IFIs,250
were exposed to the impact
of the GFC similar to non-PH stocks, this may challenge the arguments raised in the literature
249 Appendixes 8.3-8.9 show that there are no MH and MS stocks in the banking, investment, and insurance sectors as noted earlier in Chapter 6 and it can be noted that there are no Sin stocks in the industrial sector and no PH and Sin stocks in the food sector as the performances of such stocks were non-estimable and not plotted. 250 IFI are classified as PH stocks in this study as noted in earlier chapters.

330
that IFIs are asset-based, and adopt profit and loss sharing principles251
that make their
activities closely related to the real economy, and are hence able to cope with economic
downturns more than their conventional peers (Hasan and Dridi, 2010; Trabelsi, 2011; Karim
et al., 2012). On the other hand, it could support the findings of studies showing that IFIs
mimick the commercial strategies of their conventional peers and diverge from their theoretical
business model (Bourkhis and Nabi, 2013). But, as pointed out by many interviewees and prior
researchers, although IFIs may have been immune from the direct impact of the US subprime
crisis, the ongoing economic effects of the GFC impacted upon them too, as large numbers of
IFIs contracts are backed by real estate and property as collateral which all lost value after the
GFC (Parashar, 2010; and Zarrouk, 2012).
8.3.2 The Results of the GLM Analysis using AAOIFI’s Halved Screening Thresholds for
the Shariah Classification Factor
The above GLM model was estimated again as in equation [8.1] but used AAOIFI‘s (2006)
halved screening thresholds for the Shariah classification rather than the original AAOIFI
thresholds (see Appendix 8.3 for the changes of MH and MS stocks). The GLM results are
documented in Table 8.5.
251 For instance, instead of paying interest to depositors, those with investment mudarabah accounts share in the Islamic banks’ profits, where, if the profitability decreases during an economic downturn, depositors receive lower returns while, if profits increase, they enjoy higher returns. However, many Islamic banks build up profit equalization reserves as a depositor’s protection for difficult years.

331
Table 8.5: Results of the GLM Analysis, Factors and Interaction Effects Using Halved
AAOIFI’s Screening Thresholds
Source of Variation Sum of
Squares
Degree of
Freedom
Mean
Square
F-ration P-Value
Corrected Model 1.391a 69 .020 3.903 .000
Intercept .137 1 .137 26.571 .000
Shariah Classification (Halved) .001 3 .000 .038 .990
Sector .089 6 .015 2.881 .008
Size .003 2 .001 .289 .749
GFC .138 1 .138 26.630 .000
Shariah Classification (Halved) *
Sector
.048 8 .006 1.171 .312
Shariah Classification (Halved) *
Size
.021 4 .005 1.012 .400
Shariah Classification (Halved) *
GFC
.007 3 .002 .470 .703
Sector * Size .011 4 .003 .538 .708
Sector * GFC .034 6 .006 1.103 .357
Size * GFC .004 2 .002 .364 .695
Shariah Classification (Halved) *
Sector * Size
.012 5 .002 .453 .812
Shariah Classification (Halved)
* Sector * GFC
.105 8 .013 2.546 .009
Shariah Classification (Halved) *
Size * GFC
.009 4 .002 .433 .785
Sector * Size * GFC .011 4 .003 .523 .719
Shariah Classification (Halved) *
Sector * Size * GFC
.002 5 .000 .078 .996
Error 217.872 42185 .005
Total 219.866 42255
Corrected Total 219.263 42254
Notes: The table reports the analysis of variance of the weekly returns for the sample stocks for the full sample
period from 04/01/2006-28/12/2011. The p-value shows the significance of the F-ratio that tests whether any of the
5 main factors: Shariah classification(Halved) after halving the AAOIFI‘s screening thresholds; sector; size; year;
and financial crisis, or their two and three level interactions, is significant.
Table 8.5 confirms the findings that emerged from the previous section that sector and GFC are
significant, and size is insignificant. However, contrary to what was expected from Chapters 6

332
and 7, there are no significant differences between the performance of the Halal and non-Halal
stocks, despite halving AAOIFI‘s financial screening thresholds (F-ratio= 0.038, p-value=
0.990).This implies that Islamic funds could apply more conservative, stricter financial
screening strategies that are more Shariah-compliant, without sacrificing any of their returns.
This interesting conclusion supports the arguments raised by many of the Shariah scholars
interviewed and other fund managers, that the financial screening criteria should become more
rigorous since the need for such stocks nowadays has diminished. However, similar to the
previous section, the three way interaction between the Shariah classification (Halved), sector,
and the GFC is significant (F-ratio=2.546, p-value =0.009), uncovers that the performance of
Halal and non-Halal stocks under the suggested halved financial screening thresholds within
different sectors varied between the GFC and non-GFC periods. Appendix 8.11-8.14 graphs
the performance of the Halal and non-Halal stocks after halving AAOIFI‘s (2006) screening
thresholds compared to the portfolios with the non-halved screening thresholds within real
estate, industrial, service, and food sectors over time. Stocks in the banking, investment, and
insurance sectors will not be affected by the screen‘s halving methodology as they do not
contain MH or MS stocks in them, and thus are not plotted.
Overall, the Figures in Appendices 8.11-8.14 show that AAOIFI‘s thresholds being halved do
not impact the results and during and after the crisis, the performance of MH stocks slightly
declined in real estate, industrial and service sectors after the GFC, as the portfolio of MH
became less diversified (as expected from section 6.4 in Chapter 6 and interviews) but did not
adversely impact their performance. This again indicates that AAOIFI‘s halved screens are not
the main reason for MH stocks to underperform MS stocks but rather it is the performance of
the sector and time horizon.

333
Moreover, the Figures in Appendices 8.11-8.14 may suggest that Islamic funds could enhance
their performance when halving the screening thresholds, if they invested in MH industrial
stocks during crisis periods (e.g. 2008) and MH food sector stocks during bearish periods (e.g.
2011). This mixed result supports the model output in Table 8.5 which suggests that the overall
Shariah classification under halved screening criteria is insignificant.
8.4 Summary
This chapter compares the performance of Halal and non-Halal stocks after controlling for size
and sector in the matched pair analysis and for size, sector, GFC and their interactions in the
GLM model. This was to investigate whether managers of investment funds can employ
Shariah-compliant screening criteria without bearing any loss in performance in order to
comply with their religious beliefs. The chapter also examines the impact of halving AAOIFI‘s
existing screening thresholds.
The results of the Halal and non-Halal matched pairs portfolios were mixed and inconclusive
across different sample periods. This suggests that the Shariah screening criteria do not seem
to impact on portfolio performance, which implies that Islamic funds and religious driven
investors are not penalized for investing according to their faith. Nevertheless, the analysis
provides some evidence that Sin portfolios tend to outperform during downturn markets.
The GLM analysis shows that GFC and sector are important while Shariah-compliance and
size are not significant. These findings from both the matched pairs and the GLM provide
support to individual investors and investment funds that they can pursue Shariah guidelines,
including halving AAOIFI‘s financial screening thresholds, and still expect investment returns
to be similar to those of conventional investments. In addition, the results suggest that
‗tightening‘ the MH stocks‘ financial screening thresholds is a possibility.

334
Finally, this chapter shows that stock performance varies across the sectors over time; the
investment sector was the worst, while the banking and non-financial sectors were the best.
Hence, Islamic funds could be encouraged to allocate their investments more in MH stocks
rather than PH stocks, especially during bearish markets, since more MH stocks exist in the
non-financial sectors rather than the financial sector. Thus, it is not the right time to ban
investment in MH and only invest in PH stocks, but alternatively it should place more
restrictions on the screening thresholds as a step towards only PH investments in the future.

335
Chapter 9: Conclusion
336
9.1 Introduction
This study provides a critical review of the issues associated with the screening and
performance of Islamic funds in Kuwait to conclude whether the fatwa on investing in MH
companies should be revisited and further steps be taken to encourage Islamic funds to invest
only in PH stocks. In particular, the thesis attempts to answer the following research questions:
(i) how do participants define and screen PH and MH equity investments?; (ii) do participants
believe that MH stocks are still necessary for a Halal diversified portfolio?; (iii) is there a
financial penalty for investing in Halal equity portfolios?; (iv) did AAOIFI‘s change in
screening criteria in 2006 affect portfolio creation and performance?; (v) is there an impact of
halving AAOIFI‘s screening thresholds on portfolios creation and performance?; and (vi) does
the Shariah-compliant classification of stocks, firm size, sector or GFC period affect
performance?
The thesis uses both qualitative and quantitative analyses to answer these questions so that the
limitation of using one research approach is compensated by the strength of the other
approaches used in the thesis. Specifically, the qualitative analysis (58 semi-structured
interviews) initially explores whether Islamic funds are currently good investments from a
Shariah perspective with a wide range of stakeholders, and whether there is a need to revisit
the tolerance of the mixed Halal screening criteria. In addition, the interviews explored the
investment strategies and opinions of market participants such as Islamic fund managers,
SSBs, investors, and regulators on the screening and performance evaluation of PH and MH
equity investments and relevant Shariah issues.
Various quantitative analyses are applied in Chapters 6-8 to investigate the performance of
Halal portfolios to see how good they are from a financial perspective. Prior studies use

337
secondary data drawn from a sample of Islamic funds or Islamic indexes to examine fund
managers‘ timing and stocks selection skills. This study instead screens individual securities to
form hypothetical portfolios that are constructed for the purpose of empirical analysis to
examine the performance of Islamic funds.
Most importantly, unlike previous studies, this thesis distinguishes between pure Halal and
Mixed Halal portfolios based on various screens, which helps in explaining the inconclusive
results in the literature on Islamic funds‘ performance when studying the behaviour of each
group individually. Thus, Chapter 6 uses content analysis of companies‘ annual reports during
the sample period 2005-2010 to classify stocks as: (i) Pure Halal (PH); (ii) Mixed Halal (MH);
(iii) Mixed Sin (MS); and (v) Sin, based on the screening criteria of AAOIFI and definitions
suggested by the practitioners interviewed. Further, the chapter studies the impact of halving
AAOIFI‘s financial screening on the creation of mixed Halal portfolios.
Chapter 7 measures the performance of the PH, MH, MS and Sin portfolios. The chapter
employs parametric and non-parametric statistical tests of portfolio returns and the three
traditional risk-adjusted returns, namely: Sharpe (1966) Treynor (1965), and Jensen (1968).
Portfolio performance is then re-evaluated using a Shariah-compliant risk-free rate
(Murabahah rate).
Chapter 8 employs a matched pair approach to compare the performance of portfolios of
similar firm size and sector. Moreover, a GLM is developed to investigate the determinants of
portfolio returns, specifically by examining the importance of the Shariah classifications of
stocks as Halal and non-Halal, under the current and halved screening criteria, as well as firm
size and sector, and the impact of the GFC.

338
The significance of the study can be appreciated academically through its contribution towards
the expansion of knowledge and the literature related to Islamic fund screening and
performance, as well as practically by policy makers, Shariah scholars and investors.
The remainder of this chapter is organized as follows. Section 9.2 discusses the key findings of
the empirical chapters and outlines the major conclusions that can be drawn. The limitations of
the research are discussed in section 9.3 while section 9.4 highlights potential avenues for
future research. Finally, section 9.5 concludes the chapter.
9.2 Main Findings and Contribution to Knowledge
This section summarizes the key findings of the empirical chapters of this thesis. First, the
interviewees distinguished between PH and MH investee companies and noted that there is a
growing number of Islamic funds and individual investors in the GCC that invest merely in PH
stocks, driven by religious motivation. However, the interview analysis reveals a gap between
the motivations of Islamic investors and fund managers, as investors are concerned about
religious and economic motives while fund managers are concerned mostly with profit
maximization. This gap should motivate Islamic investment funds to differentiate themselves
from conventional ones on the basis of religious and ethical values. This finding may explain
why some Islamic fund managers resist restricting their investments in mixed Halal stocks
based on the current screens or only PH stocks as this result in smaller Halal universe and
possible portfolio underperformance. The interviewees suggest that the SSBs and regulators
should lead the change in having a more Shariah focus rather than driven by profit
maximization.
Second, some interviewees seriously questioned the Shariah-compliance of MH stocks and
many were unaware of the Shariah rationale underlying MH screening. Thus, the interviewees

339
called for a revisit of the fatwa that allows MH stocks, and some indicated that Islamic funds
can still do well with only PH stocks due to the recent growth in the number of PH stocks; this
finding is consistent with the Shariah jurisprudence literature (Al-Quradaqi, 2002; Al-Khalel,
2005; Al-Shubali, 2005; Al-Tunaji, 2009; Al-Nifasa, 2010). Many interviewees, therefore,
agreed that financial screening criteria needs to become tighter and that, companies in Muslim
countries should be treated differently from western ones as noted by Wilson (2005).
Third, the analysis in Chapter 7 affirms that there is no statistical difference between the
performance of the Halal and non-Halal portfolios during the full, the bullish or GFC periods,
indicating there is no penalty for Halal investments. Differences were only identified during
the bearish period, showing that some sin portfolios performed better, but overall, Halal
portfolios did not underperform either the CP or the KSE index in any of the sample periods.
This supports the evidence from the substantive literature which suggests that Islamic funds
possess competitive performance characteristics (Abullah et al., 2007; Merdad et al., 2010;
Hassan et al., 2010; Mansor and Bhatti, 2011; BinMahfous and Hassan, 2012; Asharaf, 2013).
The GLM analysis in chapter 8 however, shows that Shariah-compliance is not as significant
on portfolio performance as the GFC and the sector factors, confirming that a Shariah
classification does not cause underperformance.
Fourth, Islamic funds should consider allocating their investments more in the non-financial
sectors rather than in the financial sector, especially during bearish markets to improve
diversification. However, there are fewer PH non-financial stocks, thus, as stated by some
interviewees, a ban on investment in MH stocks is premature. Indeed, some interviewees
pointed out that some investors prefer to invest in PH stocks even with relatively low returns
rather than investing in stocks that are questionable in Shariah (i.e. MH). This is consistent
340
with the idea that investors may be willing to accept a lower return in order for their
investments to not compromise their beliefs (Gregory and Whittaker, 2007; Renneboog et al.,
2008a; Hong and Kacperczyk, 2009; Kim and Venkatachalam, 2011). Some interviewees also
suggested that PH investors could diversify by investing across all GCC stocks markets. Thus,
Islamic fund managers need to be active fund managers focusing on certain sectors and
markets in different market conditions.
Fifth, the interviewees revealed that AAOIFI‘s financial screening criteria are widely adopted
by Islamic funds in the GCC, and they knew that AAOIFI had changed its financial screening
criteria in 2006 to use market capitalization instead of total assets. Most interviewees believed
that this change was intended to widen the Halal asset universe. However, the analysis of
companies‘ annual reports reveals that the use of AAOIFI (2006) during the GFC resulted in a
sizeable number of MH equities being re-categorised as MS stocks, as the market capitalization
of all listed companies dropped leading, for example, to higher interest-bearing debt to market
capitalization ratios. However, in terms of performance, the different Halal portfolios created
based on the different AAOIFI financial screens was not significantly different, as revealed
from the parametric and non-parametric statistical tests and the risk-adjusted performance.
Sixth, the screening results presented in Chapter 6 show that Halal stocks shrink in number if
financial screening thresholds are halved although this does not affect performance. This may
be because the loss in the number of MH stocks is compensated for by the lower interest-
bearing gearing ratio of the individual companies suggested by the halved financial screening
thresholds, as previous studies report a negative relationship between stock returns and firms‘
gearing, especially during downturn markets (Penman et al, 2007; George and Hwang, 2010;
Bhatt and Sultan, 2012). Such a result is similar to that of Abdullah et al. (2007), Hassan

341
(2009), Hoepner et al. (2011) and Ashraf (2013), who found that Islamic funds perform better
than conventional ones, especially in an economic downturn, due to the lower levels of
leverage from the equities they hold. This implies that ‗tightening‘ the MH stocks‘ financial
screening thresholds is a viable option, that would not cause Islamic funds to underperform
conventional ones, and is better than banning MH stocks totally or only investing in PH stocks.
Seventh, Chapter 7 shows that using a Shariah-compliant alternative (Murabahah rate) as the
risk-free rate did not seem to significantly impact on the risk-adjusted returns of Halal
portfolios. This finding was expected by some interviewees who thought that moving away
from the conventional interest-based benchmark is difficult due to the correlation between the
conventional and Islamic rates that are dominated by the conventional financial system.
Nonetheless, the recent IIBR launched by Thomson Reuters opens the door for future empirical
investigation as it could provide the Islamic finance industry a rate that reflects its own unique
identity. This supports the interviewee‘s views that developing an alternative performance
evaluation model that avoids interest-based benchmarks would be an essential step forward
towards a pure Islamic capital market among Muslim countries.
Finally, the interview analysis as the well as content analysis suggest that the Shariah-
compliant equity investment screening process is dynamic in nature that requires laborious
efforts, and is time consuming, especially given that accounting information is not prepared for
Shariah-compliant investors. The screening analysis and interviews show an inadequate level
of disclosure for assessing Sharia-compliance from the companies‘ annual reports. Hence,
there is a need for harmonizing the Shariah screening criteria, as suggested by Derigs and
Marzban (2008) and Abdul Rahman et al. (2010), to have one unique list of Halal stocks for all
individual investors and Islamic funds, as in Malaysia (Rahimie, 2010; Abdul Rahman et al.,

342
2010). This accords with Derigs and Marzban (2008), as it was unclear in this study whether or
not certain items were Halal (e.g. other income, cash in banks, debt, other investments,
investment in securities, and other liabilities). Therefore, many interviewees called for the
development of accounting and auditing standards and a disclosure framework based on
Islamic values rather than western ones to reflect the unique characteristics of Halal
investments, consistent with the recommendation of Karim (2001), Lewis (2001), Kamla et al.
(2006), Maali et al. (2006), Haniffa and Hudaib (2007), Kasim et al. (2009), Yaacob and
Donglah (2012), and Kasim and Sanusi (2013). Thus, for companies that are not governed
purely by Shariah (MH and MS), additional disclosures related to Shariah-compliance are
required so that Halal investors know what portion of a company‘s operations and income are
non-Shariah-compliant in order to purify it or to decide if it is a Shariah-compliant investment.
For example, disclosures of whether debt is interest-bearing or Shariah-compliant like
Murabahah. The interviewees suggested that AAOIFI, as an Islamic regulatory body, could
coordinate countries‘ market authorities (i.e. CBK and CMA in Kuwait) to introduce these
recommendations.
Overall, the results of the empirical chapters suggest that it is difficult to ban MH completely
and only invest in PH stocks in KSE due to the impact of the GFC. However, halving the
current AAOIFI financial screening thresholds for MH is possible. This demonstrates that
further work needs to be done on PH equity portfolios from GCC stocks markets and this thesis
provides a solid ground for additional investigations in the future.
9.3 Limitations of the Study
Although the thesis provides a systematic examination of the issues discussed, it is
nevertheless subject to certain limitations. First, though the sample of 58 interviewees

343
represents a very wide proportion of the Islamic funds industry‘s population in Kuwait, only
six interviews of the 58 were conducted in other GCC countries, namely in Saudi Arabia,
Qatar, Bahrain and the UAE. This could make the results biased towards Kuwait, but the 12
interviewed SSBs are the most active Shariah scholars in the GCC and around the globe.
Second, the quantitative empirical analyses were restricted in their coverage to Kuwaiti listed
equities on the KSE. Therefore, the quantitative empirical findings reflect Kuwait‘s experience,
which may not necessarily be similar to that of other countries, due to the differences in the
stock market and Islamic funds industry‘s environment, regulatory structure, and fund
management practice. Nonetheless, the reason for GCC listed companies not being included in
the quantitative empirical analyses is because the companies‘ annual reports were unavailable
before 2007 in most countries, which would not allow the analyses to cover the period before
the GFC. In addition, companies‘ annual reports were only available for the Saudi and Omani
stock markets in 2008. Further, Oman only launched Islamic banks in 2012, while Bahrain has
a very thin, illiquid market.
Third, the thesis only used AAOIFI‘s 2004 and 2006 financial screening criteria to screen MH
stocks, while there are other screening criteria issued by for example the Dow Jones Islamic
Index Market index (DJIM), the Financial Times Shariah Index (FTSE), the Standard & Poor‘s
Islamic Index and, the Morgan Stanley Capital International Islamic Index (MSCI). This
decision was made due to the fact that the interviewees reported that AAOIFI‘s financial
screening criteria are dominant in the GCC. Further, Derigs and Marzban (2008) and Marzban
and Asutay (2012) outlined that the main distinction between the different screens is the use of
either total assets or market capitalization for calculating ratios. Thus, AAOIFI (2004) captures
the screens that use total assets, while AAOIFI (2006) reflects those that use market

344
capitalization as the denominator for the different financial ratios. In addition, AAOIFI‘s
criteria were chosen because the prior studies on Islamic funds‘ screening and performance do
not use it as the vast majority of studies have been conducted in non-GCC countries, and is
therefore a contribution to knowledge.
Fourth, the created hypothetical portfolios used in the quantitative empirical analysis were
consistent with a single type of asset, namely KSE listed equities, while, in practice,
investment funds may invest in several types of security other than stocks, such as cash, money
market instruments, and real estate, in accordance with the fund‘s asset allocation and
investment strategy. Hence, the results of the quantitative analysis do not reflect the
performance of multi-asset portfolios.
Fifth, the created portfolios adopt an annual buy-and-hold strategy, rather than an active
strategy, but in practice Islamic funds may not do this.252
Moreover, transaction costs have
been ignored in the analysis, as it is deemed to be small in KSE (Almujamed et al., 2013), and
varies according to the stock‘s price range, which changes over time. This is in line with most
other empirical studies.
Sixth, some companies were removed from the empirical analyses, even after screening,
because the stock data was unavailable. Thus, the CP was created to serve as a relevant
benchmark, as well as the KSE index. Further, the Kuwait weekly Murabahah returns were
calculated only for the bearish period (2010-2011) since data were only available from 2009.
Finally, the for the GLM was relatively small, although other studies (Fifield
et al., 1999; Bilson et al., 2001; Kreander et al., 2005) suffer from a low too. In addition,
other factors (e.g. EPS, ownership structure, and capital structure), and macroeconomic factors
252
Islamic funds may follow certain investment or allocation strategies and not invest in all of the Halal stocks available, or may sell Halal stocks for reasons other than the fact that they are non-Shariah-compliant.

345
(e.g. interest rate, oil prices, and GDP) are not investigated as the objective was mainly to
examine the impact the Shariah-compliance of stocks, rather than to predict or explain all the
variations in stock returns.
Nonetheless, despite the aforementioned limitations, the current thesis remains one of the first
comprehensive investigations of a topic that has been challenged from a Shariah point of view
since it was first discussed at the OIC Fiqh Academy in Saudi Arabia on 9-14 May 1992.
Therefore, this research provides a springboard for future research as presented in the
following section.
9.4 Future Research
Future research on the issues discussed in this thesis could be extended to cover other GCC
countries, such as Saudi Arabia, Qatar, and the UAE and whether there are diversification
benefits from investing in PH equity portfolios over several GCC stock markets. Further, the
potential of establishing an Islamic market among member countries of the Organization of
Islamic Cooperation (OIC), free from interest-based or non-Halal securities and speculations
grounded on Islamic values.
Future research may also measure the extent to which companies and hence their stocks fully
embrace Islamic principles. For example, research may examine the Shariah screening process
covering CSR and environmental issues. This would provide Islamic investors with a broader
picture of the additional Islamic values of a firm before making their investment decisions.
Thus, positive screens could also be taken into account to see how this would impact Halal
portfolios creation and performance.

346
Moreover, future studies might examine the role of the fund management companies, SSBs and
regulators in Shariah investing. This could include examining the education of Islamic fund
managers and investors and their level of awareness of the moral intention and true philosophy
behind Islamic investment and explore the extent to which Islamic funds uphold the true spirit
of Shariah objectives. This could include studies on improving the quality of Shariah
information dissemination, training for fund managers and Islamic fund prospectuses. Further,
future research may explore the roles of SSBs in ensuring the compliance of Islamic funds with
Shariah guidelines and values, and investigate the roles of regulators in overseeing the Islamic
fund industry. For instance, the CBK only oversees IFIs, such as banks, investment and finance
companies, insurance companies, and investment funds, while no regulatory body oversees
non-financial PH companies to see if they are fully Shariah-compliant. Furthermore, it is worth
examining the different regulatory frameworks in the GCC that oversee the Islamic funds
industry.
It is also worth examining the importance of developing a unified, standardized screening
framework and issuing one, unique Halal securities list, for the market. Harmonizing the
screening criteria would provide a clear, understandable classification that would enhance the
credibility and consistency of Islamic equity funds and would make the screening process more
efficient and cost effective.
The disclosure practices of companies to examine the Shariah screening relevant information
in companies‘ annual reports and their compliance with Shariah is an important issue that
could be another avenue for future research. Such research could construct a benchmark
disclosure index to measure the compliance of companies. Further, a new comprehensive
Islamic accounting framework could be explored, based on Islamic values rather than western
ones, to reflect the unique characteristics of Halal companies as investments since currently no

347
Islamic accounting standards have yet been designed for Islamic companies (PH) in the non-
financial sector. AAOIFI has only developed Islamic accounting standards for IFIs that are
even not obligatory in many Muslim countries (Maali et al., 2006).
It would also be interesting to examine the impact of reducing the financial screening
thresholds further on portfolio creation and performance under different market conditions.
Income purification also needs examination as it is not included in MH stocks‘ performance.
Thus, the impact of income purification on the performance of MH stocks, as opposed to PH
ones, remains an empirical research question that could be to be tested.
Further research might also consider Islamic finance theory as a means of explaining the non-
monetary satisfaction that may be achieved through making Islamic, especially PH,
investments. Non-monetary satisfaction means meeting investor‘s utility preferences not just in
terms of financial returns, which may include pleasure, or religious beliefs (See Hamilton et
al., 1993; Jensen, 2001; Statman, 2005; Beal et al., 2005).
Finally, further extension of the risk-adjusted performance analysis could be conducted using
the IIBR established by Thomson Reuters that was designed to be independent of LIBOR
instead of the Murabahah rate adopted in current study. Moreover, future analysis could
empirically test other Shariah-compliant risk-free proxies suggested by some interviewees such
as gold or the old Islamic golden currency, Islamic banks‘ deposit rate, profitability index
based on Musharakah rate of returns, Islamic investment accounts, government Sukuk or
leasing Sukuk.

348
9.5 Concluding Thoughts
The current thesis demonstrates the learning process of the researcher; it was a stepping stone
into an academic research career that has enhanced my capacity for independent, deep and
critical thought. Although working on a research project that involves a new avenue of research
was challenging and required a lot of motivation and hard work, it was also extremely
rewarding. This PhD journey has developed my skills and understanding, which also relies on
my previous working experience in the industry. It helped me challenge and question common
standards and norms, and showed me how to put my own intellect and ideas into being
constructively critical. This learning journey has boosted my confidence to present my
empirical work at conferences and seminars, which will be written up into academic papers for
publication in well-known international journals with the support of the supervisors. Further,
this research has shown me how to examine other peoples‘ work critically and has exposed me
to potential avenues of future academic research. In addition, it has provided me with the
courage and enthusiasm to jump into new areas, even when others have looked at them before,
as I have learned that there is always something interesting to find and to develop; it has helped
me to value creativity and seek it out, and to think differently from other people in all aspects
of life.
No piece of academic research is fully perfect and complete and the current study is not an
exception. Overall, despite the limitations and suggestions for future research, the current
thesis has significantly contributed to our knowledge about the screening and performance of
PH and MH equity investments, and it provides fertile ground for further study.

349
References
AAOIFI (2004), Accounting, Auditing and Governance Standards for Islamic Financial
Institutions, Manama, Bahrain: Accounting and Auditing Organisation for Islamic Financial
Institutions.
AAOIFI (2006), Accounting, Auditing and Governance Standards for Islamic Financial
Institutions, Manama, Bahrain: Accounting and Auditing Organisation for Islamic Financial
Institutions.
AAOIFI. (2010). Accounting, Auditing and Governance Standards for Islamic Financial
Institutions. Manama, Bahrain: Accounting and Auditing Organization for Islamic Financial
Institutions.
Abbasi, T., H., M., T., Kausar, A., Ashiq, H., Inam, H., Nasar, H. & Amjad, R. (2012).
Corporate Social Responsibility Disclosure: A Comparison between Islamic and Conventional
Financial Institutions in Bahawalpur Region. Research Journal of Finance and Accounting,
3(3), 51-62.
Abderrezak, F., (2008), ―The Performance of Islamic Equity Funds: A Comparison to
Conventional, Islamic and Ethical Benchmarks‖, Unpublished Master‘s thesis, University of
Maastricht, Maastricht, NL.
Abdul Rahman, A., Yahya,M., Nasir, M., (2010), ―Islamic norms for stock screening: A
comparison between the Kuala Lumpur Stock Exchange Islamic Index and the Dow Jones
Islamic Market Index‖, International Journal of Islamic and Middle Eastern Finance and
Management, Vol. 3, No. 3, pp.228 – 240.
Abdul Wahab, A. R., Lewis, M. K., and Hassan, M. K., (2007), ―Islamic Takaful: Business
models, Shariah concerns, and proposed solutions‖, Thunderbird International Business
Review, Vol.49, No.3, pp. 371-396.
Abdullah, F., Hassan, T. and Mohamad, S., (2007), ―Investigation of Performance of
Malaysian Islamic Unit Trust Funds: Comparison with Conventional Unit Trust Funds‖.
Managerial Finance, Vol. 33, No. 2, pp. 142-153.
Abu-Hussin, M.F., (2010), ―Exploring International Trade between Malaysia and GCC
Countries: Empirical Analysis on Trends, Developments and Challenges”, Unpublished PhD
thesis, Durham University.
Abumustafa, N., (2007), ―A Review of Regulation, Opportunity and Risk in Gulf Cooperation
Council Stock Markets: The Case of Kuwait”, International Research Journal of Finance and
Economics, Vol. 12, No. 8, pp. 134-146.
Ahmad, K., (2010), “Islam: Its Meaning and Message”, the Islamic Foundation, United
Kingdom.
Ahmed, A.U.F. and Hassan, M.K., (2007), ―Riba and Islamic banking‖, Journal of Islamic
Economics, Banking and Finance, Vol. 3 No. 1, pp. 9-42.

350
Akouma, I., Grahamb, M., Kivihahoc, J., Nikkinenc, J., Omrand, M., (2012), ―Co-movement
of Oil and Stock Prices in the GCC Region: A Wavelet Analysis, The Quarterly Review of
Economics and Finance, Vol. 52, pp. 385-394.
Al-Mutawaa, A., (2010), ―Disclosure Level and Compliance with IFRSs: An Empirical
Investigation Of Kuwaiti Companies‖, International Business & Economics Research Journal,
Vol. 9, No. 5, pp.33-50.
Al-Abdulqader, Khalid A., (2003), “Share valuation and Stock Market Efficiency in the Saudi
Stock Market”, Unpublished PhD thesis, University of Dundee.
Alam, N. and Rajjaque, M., (2010), ―Shariah-Compliant Equities: Empirical Evaluation of
Performance in the European Market During Credit Crunch‖, Journal of Financial Services
Marketing, Vol. 15 No. 3, pp. 228-240.
Al-Amine, M., (2008), ―Sukuk Market: Innovations and Challenges‖, Islamic Economic Studies
Vol. 15, No. 2, pp.1-22.
Al-Arabiya, (2012), ―Kuwait Regulator Orders Nine Firms to Delist From Bourse Due to Their
Debts‖ 16 February 2012, http://www.alarabiya.net/articles/2012/02/16/195084.html
Albaity, M., and Ahmad, R., (2008), ―Performance of Syariah and Composite Indices:
Evidence from Bursa Malaysia‖, Asian Academy of Management: Journal of Accounting and
Finance, Vol. 4, pp. 23–43.
Al-Bassam, M. (2007), “Kuwait Stock Market: Islamic Vs. Conventional Financial
Companies: A Comparison of Performance”, Industrial Bank of Kuwait (IBK) papers, series
no. 91.
Al-Buraey, M., (1988), ―Administrative Development: An Islamic Perspective”, Kegan Paul
International, London and New York.
Al-Dihlawi, Shah WaliAllah, (2003), “Differences of Opinion in Figh”, Translated by
Muhammad Abdul Wahhab, Taha Publishers: London.
Al-Hunnayan, S., (2011), ―The Payout Policy in the GCC: The Case of Islamic Banks‖,
Unpublished PhD thesis, Durham University, UK.
Ali, A. and Gibbs, M., (1998), ―Foundation of business ethics in contemporary religious
thought: the Ten Commandment perspective‖, International Journal of Social Economics, Vol.
25, No. 10, pp.1552 – 1564.
Ali, S. and Syed A., (2010), ―Post-9/11 Perceptions of Islamic Finance‖, International
Research Journal of Finance and Economics - Issue 39.
Al-Mubarak, T. and Osmani, N., (2010), ―Applications of Maqasid al-Shari’ah and Maslahah
in Islamic Banking practices: an analysis”, In: International Seminar on Islamic Finance in
India, 4 - 6 October 2010, Kochi, India. (Unpublished)
Almujamed, H., (2011), “Technical Analysis in the Kuwait Stock Exchange”, Unpublished
PhD Thesis, University of Dundee.UK

351
Almujamed, H., Fifield, S., and Power, D., (2013) ―An Investigation of the Role of Technical
Analysis in Kuwait‖, Qualitative Research in Financial Markets, Vol. 5, No.1, pp.43 – 64
Al-Mutari, M., (2011), “Corporate Finance Decisions, Governance, Environmental Concerns
and Performance in Emerging Markets: the Case Study of Kuwait”, Unpublished PhD thesis,
University of Wollongong, Australia.
AlQahtani, D., (2012), ―Islamic Investment and Finance Post-2009– 2010 and Beyond: A
Sustainable Alternative‖, The Journal of Investing, Vol. 20, No. 3: pp. 85-88.
Al-Qahtani, D. S., (2012), ―Redefining Sukuk as an Investment Instrument, Not a Debt One‖,
The Journal of Investing, Vol. 21, No. 4: pp. 190-195.
Al-Qaradawi, Y., (2005), ―The Lawful and Prohibited in Islam‖, Islamic Publications, Lahore.
Al-Qur’an Text and Translation by Muhammad Assad, (2008)
Al-Shalhoob, Salah, (2007), ―Organised Tawarruq in Islamic Law: A Study of Organised
Tawarruq as Practised in the Financial Institutions in Saudi Arabia‖, presented in the a
conference in the International Islamic University of Malaysia, 23-25 of April 2007.
Al-Shamali, M., (1989), “Week Form Efficiency and Factors Leading to Market Efficiency in
Kuwait Stock Market”, Unpublished PhD Thesis, Loughborough University, UK.
Al-Wasmi, M., (2011), ―Corporate Governance Practice in the GCC: Kuwait as a Case
Study”, Unpublished PhD thesis, Brunel University, UK.
Al-Yaqout, A., (2006), ―The Usefulness of Quarterly Financial Reports to Kuwaiti Financial
Users in the Kuwait Stock Exchange‖, Unpublished PhD thesis, Loughborough University,
UK.
Al-Zuhayli, W., (2003), “Financial Transactions in Islamic Jurisprudence” Translated by El-
Gamal M., Dar Al-Fikr, Lebanon.
Ameer, R., Othman, R., and Mahzan, N., (2012), ―Information Asymmetry and Regulatory
Shortcomings in Profit Sharing Investment Accounts‖, International Journal of Islamic and
Middle Eastern Finance and Management, Vol. 5 No. 4, pp. 371-387.
Anderson, D.R., Sweeney, D.J., and Williams, T.A. (2009), ―Statistics for Business and
Economics”,Thomas Rennie: UK.
Aribi, Z., and Gao, S., (2010) "Corporate Social Responsibility Disclosure: A Comparison
Between Islamic and Conventional Financial Institutions", Journal of Financial Reporting and
Accounting, Vol. 8 Iss: 2, pp.72 – 91.
Arms, m., (1999), ―The Opportunity Cost of Monetary Conviction: A Comparison of the DSI
and the S&P 500‖, The Park Place Economist, Vol. VII, pp. 21-32.
Ashraf, D., (2013), ―Performance evaluation of Islamic mutual funds relative to conventional
funds: Empirical evidence from Saudi Arabia‖, International Journal of Islamic and Middle
Eastern Finance and Management, Vol. 6, No. 2, pp.105 – 121.

352
Ash-Sheikh, M., As-sa‘di, A., and Bin Baz, A., (2000), “Fatwa (Rulings) Concerning Tobacco
and Cigarettes”, translated by Abu Hisham, Vision printing and Distribution, Pakistan.
Attia, Gamal Eldin., (2007), “Towards Realization of the Higher Intents of Islamic Law,
Maqasid al-Shari’ah: A Functional Approach”, translated from the Arabic by Nancy Robert,
The international Institute of Islamic Thought: London.
Ayub, M., (2007), “Understanding Islamic Finance”. John Wiley and Sons, U.K.
Bakar, M. D., (2008), ―Developing Modern Islamic Financial System Via Ijtihad: An
Overview‖ in Essential Readings in Islamic Finance, Kuala Lumpur: CERT Publications Sdn
Bhd.
Bal, Y. and Leger, L. (1996), ―The Performance of UK Investment Trusts‖, The Service
Industries Journal, Vol. 16, No 1, pp.67-81.
Balli, F., Basher, S., and Louisd, R., (2013), ―Sectoral Equity Returns and Portfolio
Diversification Opportunities Across the GCC Region‖, Int. Fin. Markets, Inst. and Money ,
Vol. 25,pp. 33-48.
Barnett, M. L., and Salomon, R. M., (2006), ―Beyond Dichotomy: The Curvilinear
Relationship Between Social Responsibility and Financial Performance‖, Strategic
Management Journal, Vol. 27, pp.1101–1122.
Bauer, R., Dewall, J. and Otten, R., (2007), ―The Ethical Mutual Fund Performance Debate:
New Evidence from Canada‖, Journal of Business Ethics, Vol. 70, No. 2, pp. 111-124.
Bauer, R., Kees K., and Roger O., (2005), ―International Evidence on Ethical Mutual Fund
Performance and Investment Style‖, Journal of Banking and Finance, Vol. 29, pp. 1751–1767.
Beal, D. J., Goyen, M. and Phillips, P. (2005), ―Why Do We Invest Ethically?‖, The Journal of
Investing, Vol. 14, No. 3, pp. 66-78.
Beck, T., A. Demirguç-Kunt, and O. Merrouche, (2013), ―Islamic vs. Conventional Banking:
Busi-ness Model, Efficiency and Stability.‖ Journal of Banking and Finance, Vol. 37, pp.433–
447.
Bello, Z. Y., (2005), ―Socially responsible investing and portfolio diversification‖, Journal of
Financial Research, Vol. 28, pp. 41–57.
Berg, B.L., (2007), ―Qualitative Research Methods for the Social Sciences” (4th Ed.), London:
Pearson.
Bhatt, V., and Sultan, J., (2012), ―Leverage Risk, Financial Crisis, and Stock Returns: A
Comparison among Islamic, Conventional, and Socially Responsible Stocks‖, Islamic
Economic Studies, Vol. 20, No.1, pp. 87-143
Bilson, C. M., Brailsford, T. J., and Hooper, V. J., (2001), ―Selecting Macroeconomic
Variables as Explanatory Factors of Emerging Stock Market Returns‖, Pacific-Basin Finance
Journal, Vol. 9, pp. 401−426.

353
BinMahfous, S. and Hassan, M. (2012), ―A Comparative Study between the Investment
Characteristics of Islamic and Conventional Equity Mutual Funds in Saudi Arabia‖, The
Journal of Investing, Vol. 21, No. 4: pp. 128-143.
Bley, J., and Chen, K., (2006), ―Gulf Cooperation Council (GCC) stock markets: The dawn of
a new era‖, Global Finance Journal, Vol. 17, pp. 75–91
Bley, J., and Saad, M., (2011), ―The Effect of Financial Liberalization on Stock-Return
Volatility in GCC Markets‖, Int. Fin. Markets, Inst. and Money, Vol. 21, pp. 662– 685.
Blowfield, M. and Murray, A., (2008), ―Corporate Responsibility: A Critical Introduction‖,
Oxford : Oxford University Press.
Boland, R. J., (1989), ―Beyond the Objectivist and the Subjectivist: Learning to Read
Accounting as Text‖ Accounting, Organizations and Society, Vol. 14, No. 5–6, pp. 591–604
Borg, W. and Gall, M., (1989), “Educational Research: an introduction”, Longman, New
York.
Bourkhis, K. and Nabi, M., (2013), ―Islamic and Conventional Banks‘ Soundness during the
2007–2008‖, Review of Financial Economics, Vol. 22, No. 2, pp. 68-77.
BP Statistical Review, (2012), accessed from:
http://www.bp.com/assets/bp_internet/globalbp/globalbp_uk_english/reports_and_publications
/statistical_energy_review_2011/STAGING/local_assets/pdf/statistical_review_of_world_ener
gy_full_report_2012.pdf
Brownie, C. and Boos, D., (1994), ―Type I Error Robustness of ANOVA and ANOVA on
Ranks When the Number of Treatments is Large‖, Biometrics, Vol. 50, No. 2 (Jun., 1994), pp.
542-549.
Bryman, Alan, (2008), “Social Research Methods”, 3nd edition, Oxford : Oxford University
Press.
Buckley, Adrian, (2011), “Financial Crisis: Causes, Context and Consequences”, Harlow:
Pearson Financial Times, Prentice Hall.
Burrell, G. and Morgan, G., (1979), ―Social Paradigms and Organisational Analysis; Elements
of the Sociology of Corporate Life”, London: Heinemann.
Burton, B. (2007), ―Qualitative Research in Finance – Pedigree and Renaissance‖, Studies in
Economics and Finance, Vol. 24, No. 1, pp.5-12.
Butler, K.C. and Malaikah, S. J., (1992), ―Efficiency and Stock Market Efficiency in
Inefficiency in Thinly Traded Stock Markets: Kuwait and Saudi Arabia,‖ Journal of Banking
and Finance, Vol. 16, pp. 197-210.
Capital Standards Report, (2011), Kuwait Economic Report, February, downloaded from:
http://www.capstandards.com/CSR_KuwaitEconomicReport_Feb2011.pdf
Carhart, M. M., (1997), ―On persistence in mutual fund performance‖, The Journal of Finance,
Vol. 52, No. 1, pp.57–82.

354
Carosella, N., Rodriguez, J., Williams, S., Nawrocki, D. and P. Doh, J., (2012), ―The Return-
to-Risk Performance of Socially Responsible Investing According to Catholic Values‖, The
Journal of Investing, Vol. 21, No. 4, pp. 47-58.
Central Bank of Kuwait (2013), “CBK Quarterly Statistical Bulletin”, March, 2013.
Cevik, S. and Charap, J., (2011), ―The Behavior of Conventional and Islamic Bank Deposit
Returns in Malaysia and Turkey‖, International Monetary Fund (IMF) Working Paper.
Chapra, M.U., (2000), ―Why has Islam prohibited interest: rationale behind the prohibition of
interest‖, Review of Islamic Economics, Vol. 9, pp. 5-20.
Chapra, U., (1985), “Towards a just monetary system”, The Islamic Foundation, UK.
Chen, D., Bin, F., (2001), ―Effects of Legislation Events on US Gaming Stock Returns and
Market Turnings‖, Tourism Management, Vol. 22, pp. 539–549.
Chen, Dar-Hsin and Bin, Feng-Shun, (2001) ―Effects of Legislation Events on US Gaming
Stock Returns and Market Turnings‖, Tourism Management, Vol. 22, pp. 539-549.
Chong, J., Her, M. and Phillips, G. M. (2006), ―To Sin or Not to Sin? Now That‘s the
Question‖. Journal of Asset Management, Vol. 6, No. 6, pp. 406-417.
Chong, B., Liu, M., (2009), ―Islamic banking: Interest-free or interest-based?‖, Pacific-Basin
Finance Journal, Vol.17, pp. 125–144
Chua, W. F., (1986), ―Radical Developments in Accounting Thought‖, Accounting Review,
Vol. 61, No. 4, 601-632.
Cognizant Report, (2012), ―Cognizant 20-20 Insights: Sharia Stock Screening: A Fund
Manager‘s Conundrum‖ downloaded from
http://www.cognizant.com/InsightsWhitepapers/Sharia-Stock-Screening-A-Fund-Managers-
Conundrum.pdf
Collis, J. and Hussey, R., (2009), ―Business Research: A practical guide for undergraduate
and postgraduate studies”, 3nd edition, New York, Macmillan.
Consolandi, C., Jaiswal-Dale, A., Poggiani, E. and Vercelli, A., (2009), ―Global Standards and
Ethical Stock Indexes: The Case of the Dow Jones Sustainability Stoxx Index‖, Journal of
Business Ethics, Vol. 87, pp.185–197.
Cortez, M., Silva, F., and Areal, N., (2009), ―The Performance of European Socially
Responsible Funds‖, Journal of Business Ethics, Vol.87, pp.573–588.
Cowell, F., (2002), ―Simulation as a Means of Portfolio Performance Evaluation‖, pp.142-159
in ―Performance Measurement in Finance: Firms, Funds and Managers‖, edited by Knight, J.
and Satchell, S. Oxford: Elsevier Science Ltd.
Cowton, C. J., (2004), ―Managing Financial Performance at an Ethical Investment Fund‖,
Accounting, Auditing & Accountability Journal, Vo.17, No. 2, pp.249-275.
Creswell, John W. (1998),“Qualitative Inquiry and Research Design: Choosing Among Five
Traditions”, London : Sage Publications.

355
Creswell, John W., (2009), “Research Design: Qualitative, Quantitative, and Mixed Methods
Approaches‖, Thousand Oaks, Calif.; London: Sage Publications.
Crotty, Michael, (1998), “The Foundations of Social Research: Meaning and Perspective in
the Research Process”, London: Sage Publications.
Cuba, L., and Cocking, J., (1997), ―How to Write about the Social Sciences‖, London:
HarperCollins.
Davidson, C., (2013), “After the Sheikhs: The Coming Collapse of The Gulf Monarchies”,
Hurst & Company, London.
Deetz, S., (1996), ―Describing Differences in Approaches to Organization Science: Rethinking
Burrell and Morgan and Their Legacy‖, Organization Science, Vol.7, No. 2, pp. 191-207.
Delorenzo, Y. T., (2007), ―Shari‘ah Compliant Risk‖, Chicago Journal of International Law,
Vol.7, No.2, pp.397-408.
Denzin, N. and Lincoln, Y., (2003), ―Collecting and Interpreting Qualitative Material”, 2nd
Edition, London, Sage Publications, Inc.
Denzin, N. K., (1978), ―The research act: A theoretical introduction to sociological methods”,
New York: McGraw-Hill.
Derigs, U. and Marzban, S., (2008), ―Review and analysis of current Shariah-compliant equity
screening practices‖, International Journal of Islamic and Middle Eastern Finance and
Management, Vol. 1, No. 4, pp. 285–303.
Derigs, U. and Marzban, S., (2009), ―New strategies and a new paradigm for Shariah-
compliant portfolio optimization‖, Journal of Banking and Finance, Vol. 33, No. 6, pp. 1166–
76.
Derrac, J., García, S., Molina, D. and Herrera, F., (2011), ―A practical Tutorial On the Use of
Nonparametric Statistical Tests as a Methodology for Comparing Evolutionary and Swarm
Intelligence Algorithms‖, Swarm and Evolutionary Computation, Vol. 1, No. 1, pp.3 -18.
Derwall, J., Guenster, N., Bauer, R. and Koedijk, K., (2005), ―The Eco-Efficiency Premium
Puzzle‖, Financial Analysts Journal, Vol. 61, No. 2, pp. 51–63.
Diltz, J. David, (1995), ―Does social screening affect portfolio performance?‖, The Journal of
Investing, Vol. 4, No. 1, pp. 64–69.
Dion, M., (2009), ―Christian mutual funds, codes of ethics and corporate illegalities‖,
International Journal of Social Economics, Vol. 36, Vol.9, pp.916 – 929.
Draper, P. and Paudyal, K., (1997), ―Microstructure and Seasonality in the UK Equity
Market‖, Journal of Business Finance and Accounting, Vol. 24(7 & 8), pp. 1177-1204.
Durand, B., Koh, S., and Tan, P., (2013), ―The Price of Sin in the Pacific-Basin‖, Pacific-Basin
Journal, Vol. 21, No. 1, pp. 899–913.
Dusuki, A., and Abdullah, N., (2007), ―Maqasid al-Shariah, Maslahah and Corporate Social
Responsibility‖, The American Journal of Islamic Social Science, Vol. 24, No.1, pp. 25-45.

356
Eisenhardt, K.M, (1989), ―Building Theories from Case Study Research‖, The Academy of
Management Review, Vol. 14, No. 4, pp. 532-550.
El Mosaid, F. and Boutti, R., (2012), ―Relationship between Corporate Social Responsibility
and Financial Performance in Islamic Banking‖, Research Journal of Finance and Accounting,
Vol. 3, No. 10, pp.93-103.
El-Beblawi, H., (2011), ―Gulf Industrialization in Perspective‖, in J.-F. Seznec, & M. Kirk
(Eds.), Industrialization in the Gulf a Socioeconomic Revolution, Oxon: Routledge, pp. 205–
203.
El-Gamal, M. (2007), ―Mutuality as an Antidote to Rent-Seeking Shari‘a Arbitrage in Islamic
Finance.‖ Thunderbird International Business Review, Vol. 49, No. 2, pp. 187-202.
El-Gamal, M., (2004), ―Interest and the Paradox of Comtemporary Islamic Law and Finance.‖
Fordham International Law Review, pp.108-149.
El-Gamal, M., (2006), ―Islamic finance, law, economics, and practice‖, Cambridge University
Press, Cambridge
Elgari, M.A. (2002), ―Islamic Equity Investment‖ in Archer, S. Abdel Karim, R.A. (eds.),
Islamic Finance: Innovation and Growth. London; Euromoney Books and AAOIFI.
Ellaboudy, S. (2010) ―The Global Financial Crisis: Economic Impact on GCC Countries and
Policy Implications‖ International Research Journal of Finance and Economics, Vol.21, pp.
180-193.
Elo S. and Kyngas, H., (2008), ―The qualitative content analysis process‖, Journal of Advanced
Nursing, Vol. 62, No. 1, pp. 107–115.
El-Qorchi, M., (2005), ―Islamic Finance Gears Up‖, Finance and Development, Vol. 42, No. 4,
pp. 46-50.
Elton, E. J., Gruber, M. J., Brown, S. J. and Goetzmann, W. N., (2007), ―Modern Portfolio
Theory and Investment Analysis”, 7th Edition. New York: John Wiley & Sons, Inc.
Ethical Investment Research Service (EIRIS) Report, (20120, accessed from
http://www.eiris.org/news/statistics.html
European Sustainable Investment Forum (EUROSIF, 2006)
Evans, J.L., and Archner, S.H., (1968), ―Diversification and the Reduction of Dispersion: An
Empirical Analysis‖, The Journal of Finance, Vol. 23, pp. 761-767.
Evrensel, A., Kutan, A.M., (2007), ―IMF-related Announcements and Stock Market Returns:
Evidence from Financial and Non-Financial Sectors in Indonesia, Korea, and Thailand‖,
Pacific Basin Finance Journal, Vol. 15, pp. 80–104.
Fabozzi, F., Ma, K.C. and Oliphant, B., (2008), ―Sin Stock Returns‖, Journal of Portfolio
Management, Vol. 35, pp. 82-94.
Fama, E. F., and French, K. R., (1993), ―Common risk factors in the returns on stocks and
bonds‖, Journal of Financial Economics, Vol. 33, pp.3–56.

357
Fama, E. F., and French, K.R., (2004), ―The capital asset pricing model: Theory and evidence‖,
Journal of Economic Perspectives, Vol. 18, No. 3, pp. 25-46.
Fifield, S.G.M., Lonie, A.A., Power, D.M, and Sinclair, C.D, (1999), ―Investing in Emerging
Markets: An Analysis at Country, Industry and Company Levels‖, Global Business and
Finance Review, Vol. 4, No. 1, pp. 1-12.
Forte, G. and Miglietta, F., (2007), ―Islamic Mutual Funds as Faith-Based Funds in a Socially
Responsible Context‖, downloaded from Social Science Research Network (SSRN):
http://ssrn.com/abstract=1012813.
Friedman, M, (1937), ―The Use of Ranks to Avoid the Assumption of Normality Implicit in the
Analysis of Variance‖, Journal of the American Statistical Association, Vol. 32, No. 200, pp.
675- 701.
Geczy, C., Stambaugh, R., Levin, D., (2005), ―Investing in socially responsible mutual funds‖,
Unpublished Working Paper, the Wharton School, University of Pennsylvania.
George, T.J., and Hwang, C.Y., (2010), ―A Resolution of the Distress Risk and Leverage
Puzzles in the Cross Section of Stock Returns‖, Journal of Financial Economics, Vol. 96, pp.
56–79.
Ghoul, W., (2012), ―Islamic Investing Goes Mainstream: A SWOT Analysis‖, The Journal of
Investing, Vol. 21, No. 4, pp. 171-181.
Ghoul, W., and Karam, P., (2007), ―MRI and SRI Mutual Funds: A Comparison of Christian,
Islamic (Morally Responsible Investing), and Socially Responsible Investing (SRI) Mutual
Funds.‖ The Journal of Investing, Vol. 16, No. 2, pp. 96-102.
Girard, E., Rahman, H., and Stone, B., (2007), ―Socially Responsible Investments: Goody-
Two-Shoes or Bad to the Bone?‖, The Journal of Investing, 96-110.
Girard, E.C. and Hassan M.K., (2008), ―Is There a Cost to Faith-Based Investing: Evidence
from FTSE Islamic Indices‖, The Journal of Investing, Vol. 17, No. 4, pp. 112-121.
Gitman, L. J., and Joehnk, M. D. (2007), ―Fundamentals of investing”, (10th
ed.), Addison-
Wesley, Longman.
Global Investment House (2012), Global Research, Kuwait.
Global Islamic Finance Forum Guide Book, (2010), “Islamic Finance Opportunities: Country
and Business Guide”, KFH Research Ltd, Malaysia.
Goodall Leonard (1994) ―Market Behavior of Gaming Stocks: an Analysis of the First Twenty
Years.‖ Journal of Gambling Studies 10, 4, 323-337.
Grafton, J., Lillis, A., and Mahama, H., (2011), ―Mixed Methods Research in Accounting‖
Qualitative Research in Accounting and Management, Vol. 8, No. 1, pp. 5-21.
Green, S. B., and Salkind, N. J. (2008), ―Using SPSS for Window and Macintosh: Analyzing
and understanding data”, (5th ed.), Upper Saddle River, NJ: Pearson Prentice Hall.

358
Gregory, A. and Whittaker, J., (2007), ―Performance and Performance Persistence of Ethical
Unit Trusts in the UK‖, Journal of Business Finance and Accounting, Vol. 34, pp. 1327–1344.
Gregory, A., Matatko, J., Luther, R., (1997), ―Ethical unit trust financial performance: Small
company effects and fund size effects‖, Journal of Business Finance and Accounting, Vol. 24,
No. 5, pp. 705–724.
Grinblatt, M. and Titman, S., (1994), ―A Study of Monthly Mutual Fund Returns and
Performance Evaluation Techniques‖, The Journal of Financial and Quantitative Analysis,
Vol. 29, No. 3, pp. 419-444.
Groenewold, N., and Fraser, P., (2001), ―Tests of Asset-Pricing Models: How Important is the
iid-Normal Assumption?‖, Journal of Empirical Finance, Vol. 8, pp. 427–449.
Hakim, S. and Rashidian, M., (2004), ―Risk and return of Islamic stock market indexes‖, paper
presented at the International Seminar of Non-bank Financial Institutions: Islamic
Alternatives, Kuala Lumpur.
Hamilton, S., Jo, H. and Statman, M., (1993), ―Doing well while doing good? The investment
performance of socially responsible mutual funds‖, Financial Analysts Journal, Vol. 49, No. 6,
pp. 62-6.
Haneef, M., (1996), “What Everyone Should Know About Islam and Muslims”, Library of
Islam, United States of America.
Haniffa, R., and Hudaib, M., (2007), ―Exploring the Ethical Identity of Islamic Banks via
Communication in Annual Reports‖, Journal of Business Ethics, Vol.76, pp. 97–116.
Harahap, S.S., (2003) ,―The Disclosure of Islamic Values – Annual Report, the Analysis of
Bank Muamalat Indonesia‘s annual report‖, Managerial Finance, Vol. 29, No. 7, pp.70 – 89.
Hasan, M., Dridi, J., (2010), ―The Effects of the Global Crisis on Islamic and Conventional
Banks: A Comparative Study‖, IMF Working Paper.
Hassan, A. and Latiff, S.A., (2009), ―Corporate social responsibility of Islamic financial
institutions and businesses: Optimizing charity value‖, Humanomics, Vol. 25, No. 3, pp.177-
188.
Hassan, A., (2005), ―Islamic Economics and the Environment: Material Flow Analysis in
Society-Nature Interrelationships‖, KAU: Islamic Economics, Vol. 18, No. 1, pp. 15-31.
Hassan, A., (2009), ―After the credit crunch: the future of Shari‘ah compliant sustainable
investing‖, Humanomics, Vol. 25, No. 4, pp.285 – 296.
Hassan, K., and Lewis, K., (2007), “Handbook of Islamic banking”, Edward Elgar Publishing,
UK.
Hassan, M., Khan, A., and Ngow, T. (2010) ―Is faith-based investing rewarding? The case for
Malaysian Islamic unit trust funds‖, Journal of Islamic Accounting and Business Research,
Vol. 1, No. 2, pp.148 – 171

359
Hassan, O., and Marston, C. (2010), ―Disclosure Measurement in the Empirical Accounting
Literature: A Review Article‖, Economics and Finance Working Papers Series, Economics and
Finance Working Paper Series. SSRN eLibrary, 1-59. Electronic copy available at:
http://ssrn.com/abstract=1640598
Havemann, R. and Webster, P., (1999), “Does Ethical Investment Pay?”, Ethical Investment
Research Service, Report.
Hayat, R., Kraeussl, R., (2011), ―Risk and return characteristics of Islamic equity funds‖,
Emerging Markets Review, Vol. 12, No. 2, pp. 189–203.
Helfont, Samuel - Helfont, Tally, (2012), ―Jordan: Between the Arab Spring and the Gulf
Cooperation Council‖, Orbis, Vol. 56, pp. 82-95.
Helliar, C.V., Power, D.M., Lonie, A.A. and Sinclair, C.D. (2000), ―The Risks of Investing in
Emerging Markets: Fund Managers‘ Perspectives‖, Journal of European Financial Services,
Vol. 4 No. 1, pp. 7-30.
Hengchao, Z. and Hamid, Z., (2011), ―The Impact of Subprime Crisis on Asia-Pacific Islamic
Stock Markets‖, Conference Paper presented in the 8th International Conference on Islamic
Economics and Finance, December 19-21, 2011, Doha, Qatar.
Henry, P.B., (2000), ―Do stock market liberalizations cause investment booms?‖, Journal of
Financial Economics, Vol. 58, pp.301– 334.
Hertog, S. (2012), ―Financial Markets in GCC Countries: Recent Crises and Structural
Weaknesses”, Norwegian Publication Resource Centre, November, 2009.
Hirschberger, M., Steuer, R.E., Utz, S., Wimmer, M., (2012), “Is socially responsible investing
just screening? Evidence from mutual funds”, Discussion Paper, SFB 649
Ho, C., Masood, O., Abdul Rehman, A, and Bellalah, M., (2012), ―Syariah Accounting and
Compliant Screening Practices‖, Qualitative Research in Financial Markets, Vol. 4, Vol. 2, pp.
240 – 254.
Hoepner, A., Rammal, H., and Rezec, M., (2011), ―Islamic Mutual Funds‘ Financial
Performance and International Investment Style: Evidence from 20 Countries‖, European
Journal of Finance, Vol. 17, pp. 829–850.
Holland, J. (2001), ―Financial Institutions, Intangibles and Corporate Governance‖,
Accounting, Auditing and Accountability Journal, Vol. 14, No. 4, pp. 497-529.
Hong, H., Kacperczyk, M., (2009), ―The price of sin: the effects of social norms on markets‖,
Journal of Financial Economics, Vol. 93, pp. 15–36.
Hopper, T. and Powell, A., (1985), Making Sense of Research into the Organizational and
Social Aspects of Management Accounting: A Review of its Underlying Assumptions‖,
Journal of Management Studies, Vol.22, No. 5, pp.429-465.
Hossain, M. Z., (2009), ―Why is Interest Prohibited in Islam? A Statistical Justification‖,
Humanomics, Vol. 25 No. 4, pp. 241-253.

360
Hudson, J., (1987), ―The age, regional, and industrial structure of company liquidations‖,
Journal of Business Finance and Accounting, Vol. 14, No. 2, pp. 199-213.
Huimin, L., Kong, C.A.W., Eduardo, R., (2010), ―Socially Responsible Investment in Good
and Bad Times‖, International Research Journal of Finance and Economics, Vol. 54, pp. 152–
165.
Hussain, A. (2013), “Islamic finance in Qatar: Ready to take on the world”, Islamic Finance
News, 13th March 2013.
Hussein, K., and Omran, M., (2005), ―Ethical investment revisited: Evidence from Dow Jones
Islamic Indexes‖, The Journal of Investing, Vol. 14, No. 3, pp. 105–124.
Imam, P. and Kpodar, K., (2010), ―Islamic Banking: How Has it Diffused?‖, International
Monetary Fund (IMF) Working Paper.
Institute of Banking Studies-Kuwait Report (2011), “GCC Banks Financial Report 2008 –
2010”, Research Unit, Institute of Banking Studies, State of Kuwait.
International Monetary Fund Report (2012), “Economic Prospects and Policy Challenges for
the GCC Countries”, Annual Meeting of Ministers of Finance and Central Bank Governors,
October 5–6, 2012, Saudi Arabia, Downloaded:
http://www.imf.org/external/pubs/ft/dp/2012/mcd1012.pdf.
Iqbal, M. & Molyneux, P., (2005), ―Thirty years of Islamic banking: History, performance, and
prospects‖, New York: Palgrave Macmillan.
Islam, N. and Al-Khateeb, M. (1995), ―Challenges and opportunities for tobacco control in the
Islamic countries—a case-study from Bangladesh‖, Eastern Mediterranean Health Journal,
Vol. 1, No., 2, pp. 230-234.
Jamhour, A., (2011), ―The Role of the State in Economic Development: A Case Study of the
GCC Countries”, Unpublished PhD thesis, University of Birmingham, UK.
Jensen, M., (1968), ―The performance of mutual funds in the period 1945-1964‖, Journal of
Finance, Vol. 23, pp. 389-416.
Jensen, M.C., (2001), ―Value Maximization, Stakeholder Theory, and the Corporate Objective
Function‖, European Financial Management Review, V. 7, No. 3: pp. 297-317.
Jick, T. (1979) ―Mixing Qualitative and Quantitative Methods: Triangulation in Action‖,
Administrative Science Quarterly, Vol. 24, No. 4, pp 602-611.
Jobson, J. D. and Korkie, B. M., (1981), ―Performance Hypothesis Testing With the Sharpe
and Treynor Measures‖ Journal of Finance, Vol. 36, No. 4, pp.889–908.
Johnson, P. and Duberley, J. (2000), “Understanding Management Research”, London: Sage
Publications.
Jonker, J., and Pennink, B. (2010), ―The Essence of Research Methodology: A Concise Guide
for Master and PhD Students in Management Science‖, London, UK: Springer.

361
Joro, T. and Na, P., (2006), ―Portfolio Performance Evaluation in a Mean-Variance- Skewness
Framework‖, European Journal of Operational Research, Vol. 175, pp. 446-461.
Jouini, J., (2013), ―Stock Markets in GCC Countries and Global Factors: A Further
Investigation‖, Economic Modelling, Vol. 31, pp. 80–86
Kader, R.A., and Leong, Y.K, (2009), ―The Impact of Interest Rate Changes on Islamic Bank
Financing‖, International Review of Business Research Papers, Vol. 5 No. 3, pp. 189-201.
Kamal, O.M., (2001), ―Stock investing from an Islamic perspective and the uncertainty of
Gharar‖, Coventry University, Unpublished PhD Thesis.
Kamali, M. Hashim, (2006), ―An introduction to Shariah‖, (Kuala Lumpur: Ilmiah Publishers
Sdn Bhd).
KAMCO Research (2012), ―GCC Equity Market Review‖, December 2012. Accessed from
http://www.kamconline.com/
Kamil, N. M., (2011), ―Ontology and Epistemology in Management Research: An Islamic
Perspective, Postmodern Openings, Vol.7, pp.67-74.
Kamla, R., (2009), ―Critical insights into contemporary Islamic accounting‖, Critical
Perspectives on Accounting, Vol. 20, pp. 921–932.
Kamla, R., Gallhofer S., Haslam J., (2006), ―Islam, nature and accounting: Islamic principles
and the notion of accounting for the environment‖, Accounting Forum, Vol. 30, No. 3, pp.245–
65.
Kantakji, Samer and Omar, O‘haj, (2010), “Performance Benchmark for Islamic Financial
Transactions, MQAM, a Substitute for LIBOR”, working paper downloaded from:
http://www.kantakji.com/fiqh/Files/Finance/MQAM_Ver%201_En.pdf
Karim, A.B, Lee, W.S., Karim, A.Z, and Jais, M., (2012), ―The Impact of Subprime Mortgage
Crisis on Islamic Banking and Islamic Stock Market‖, Procedia - Social and Behavioral
Sciences, Vol. 65, pp. 668 – 673.
Karim, B., Kassim, N., and Arip, M., (2010), ―The Subprime Crisis and Islamic Stock Markets
Integration‖, International Journal of Islamic and Middle Eastern Finance and Management,
Vol. 3, No. 4, pp. 363-371.
Karim R.A., (2001), ―International accounting harmonization, banking regulation, and Islamic
banks‖, The International Journal of Accounting, Vol. 36, pp.169–93.
Kasim, N. and Sanusi, Z., (2013), ―Emerging issues for auditing in Islamic Financial
Institutions: Empirical evidence from Malaysia‖, Journal of Business and Management, Vol. 8,
No. 5, pp.10-17.
Kasim, N., Ibrahim, S. H. M., & Sulaiman, M., (2009), Shari‘ah auditing in Islamic financial
institutions: exploring the gap between the ‗desired‘ and the ‗actual‘. Global Economy and
Finance Journal, Vol. 2, No. 2, pp. 127-137.

362
Kat, H.M., and Lu, S., (2002), ―An Excursion into the Statistical Properties of Hedge Fund
Returns‖, Working paper, The University of Reading.
Kettell, B., (2011), ―Introduction to Islamic Banking and Finance” Wiley, NJ, USA.
KFH Research, (2009), “Global Islamic Finance Directory 2009”, KFH Research Ltd, Kuala
Lumpur, Malaysia.
KFH Research, (2011), “GCC Research: “Turning a Corner”, KFH Research Ltd, Kuala
Lumpur, Malaysia.
KFH Research, (2011), “Islamic Funds Industry”, KFH Research Ltd, Kuala Lumpur,
Malaysia.
Khan, M., (1999), “An Introduction to Islamic Economics”, Kalan Mahal, India.
Khan, M.N., (2012), “An Analysis of Market Efficiency in the South Asian Emerging Stock
Markets: Bangladesh, India, Pakistan, and Srilanka”, Unpublished PhD thesis, University of
Dundee.
Khan, N.U., (2011), “Dividend Policy and the Stock Market Reaction to Dividend
Announcements in Pakistan”, Unpublished PhD thesis, University of Dundee.
Khatkhatay, M.H. and Nisar, S., (2007), ―Shari‘ah compliant equity investments: An
assessment of current screening norms‖, Islamic Economic Studies, Vol. 15, No. 1, pp. 47-76.
Kim, I., and Venkatachalam, M. (2011), ―Are Sin Stocks Paying the Price for Accounting
Sins?‖, Journal of Accounting, Auditing & Finance, Vol. 26, No. 2, pp.415-442.
Knoll, M., (2002), “Ethical Screening in Modern Financial Markets”, Bus. Law. , Vol. 57, pp.
681-726.
KPMG International (2009), “International Financial Centres Competitive Assessment”,
Dubai International Financial Centre, December, 2009.
Kreander, N. and McPhail, K., (2004), ―God‘s Fund Managers: A Critical Study of Stock
Market Investment Practices of the Church of England and UK Methodists‖, Accounting,
Auditing and Accountability Journal, Vol. 17, No. 3, pp. 408-441.
Kreander, N., Gray, R. H., Power, D. M. and Sinclair, C. D., (2005), ―Evaluating the
Performance of Ethical and Non-Ethical Funds: A Matched Pair Analysis‖, Journal of Business
Finance and Accounting, 32(7) & (8), pp.1465-1493.
Kreander, N., Gray, R., Power, D. and Sinclair, C., (2002), ―The financial performance of
European ethical funds 1996-1998‖, Journal of Accounting and Finance, Vol. 1, pp. 3-22.
Krippendorff, K., (2013), “Content Analysis an Introduction to its Methodology”, 3rd
ed., Sage
Publications Ltd., London.
Kuhn, Thomas S., (1962), “The Structure of Scientific Revolutions”, Chicago: University of
Chicago Press.

363
Kuhn, Thomas S., (1970), “The Structure of Scientific Revolutions”, 2nd edition, Chicago:
University of Chicago Press.
Kumar, A., Page, J., and Spalt, S., (2011), ―Religious Beliefs, Gambling Attitudes, and
Financial Market Outcomes.‖ Journal of Financial Economics, Vol. 102, No. 3, pp. 671-708.
Kuran, T., (2004), Islam and Mammon: The Economic Predicaments of Islamism. Princeton
University Press, Princeton.
Kurtz, L., (1997), ―No effect, or no net effects? Studies on socially responsible investing‖, The
Journal of Investing, pp. 37–49.
Kurtz, L., (2005), ―Answers to Four Questions‖, The Journal of Investing, Vol. 14, No.3,
pp.125–139.
Kuwait Capital Market Authority (CMA) article of association, (2012).
Kuwait Central Bank (CBK) Annual Report (2011), Accessed from: http://www.cbk.gov.kw
Kuwait Stock Exchange Rule Book (2012), downloaded from:
http://www.kuwaitse.com/Portal/Report/Index%20Rulebook%2009052012.pdf
Laldin, M. A., (2008), “Fundamentals and Practices in Islamic Finance”, International
Shari'ah Research Academy for Islamic Finance (ISRA), Kuala Lumpur.
Laughlin, R., (1995), ―Empirical Research in Accounting: Alternative Approaches and a Case
for ―Middle-Range‖ Thinking‖, Accounting, Auditing and Accountability Journal, Vol. 8, No.
1, pp.63 – 87
Lee, D., Humphrey, J., Benson, K., and Ahn, J., (2010) ―Socially responsible investment fund
performance: the impact of screening intensity‖, Accounting and Finance, Vol. 50, pp. 351–
370.
Lee, M.P. and Detta, I.J., (2007), ―Islamic Banking & Finance Law‖, Pearson Malaysia Sdn
Bhd, Kuala Lumpur.
Leedy, Paul D., (1993), “Practical Research: Planning and Design”, 5th
ed., New York:
Macmillan.
Lehmann, B. N. and Modest, D. M. (1987), ―Mutual Fund Performance Evaluation: A
Comparison of Benchmarks and Benchmark Comparisons‖, The Journal of Finance, Vol. 42,
No. 2, pp. 233-265.
Lewis, A. and Cullis, J. (1990), ―Ethical Investments: Preference and Morality‖. The Journal of
Behavioral Economics, Vol. 19, No.4, pp. 395-411.
Lewis, A. and Mackenzie, C. (2000), ―Morals, Money, Ethical Investing and Economic
Psychology‖, Human Relations, Vol. 53, pp. 179–191.
Lewis M. K., (2001), ―Islam and accounting‖, Accounting Forum, Vol., 25, No. 2, pp. 103–27.

364
Lintner, J., (1965), ―The Valuation of Risk Assets and the Selection of Risky Investments in
Stock Portfolios and Capital Budgets‖, The Review of Economics and Statistics, Vol. 47, No. 1,
pp.13-37.
Liston, D. and Soydemir, G., (2010), ―Faith-Based and Sin Portfolios: An Empirical Inquiry
into Norm-Neglect vs Norm-Conforming Investor Behavior‖, Managerial Finance,Vol. 36 No.
10, pp. 876-885.
Lobe, S., Rößle, F., and Walkshäusl, C., (2012), ―The Price of Faith: Performance, Bulland
Bear Markets, and Screening Effects of Islamic Investing Around the Globe‖, The Journal of
Investing, Vol. 21, No. 4, pp. 153-164.
Loo, I.D. and Lowe, A., (2011), ―Mixed methods research: Don‘t – ―Just Do It‖ ‖, Qualitative
Research in Accounting and Management, Vol. 8 No. 1, pp. 22-38.
Louche, C., Arenas, D., and van Cranenburg, K. C., (2012), ―From preaching to investing:
Attitudes of religious organizations towards responsible investment, Journal of Business
Ethics, Vol. 110, No. 3, pp. 301–320.
Luther, R. & Matatko, J., (1994), ―The performance of ethical unit trusts: Choosing an
appropriate benchmark‖, British Accounting Review, Vol. 26, pp. 77-89.
Luther, R.G., Matatko, J., Corner, D., (1992), ―The investment performance of UK ethical unit
trusts‖, Accounting, Auditing and Accountability Journal, Vol. 5, No. 4, pp. 57–70.
Lyn, O. and Zychowicz, E., (2010), ―The Impact of Faith-Based Screens on Investment
Performanc‖, The Journal of Investing, Vol. 19, No. 3, pp. 136-143.
Maali, B., Casson P, Napier C., (2006), ―Social reporting by Islamic banks‖, ABACUS, Vol.
42, No. 2, pp. 266–89.
Malaikah, S., (2012), “The Globalization of Islamic Finance: Connecting the GCC with Asia
and Beyond”, Working Paper, Standards & Poor‘s Islamic Finance Conference, 25th
of
September 2012.
Malik, A. and Awadallah, B., (2013), ―The Economics of the Arab Spring‖, World
Development Vol. 45, pp. 296–313.
Malina, M., Nørreklit, H., Selto, F., (2011), ―Lessons Learned: Advantages and Disadvantages
of Mixed Method Research‖, Qualitative Research in Accounting & Management, Vol. 8 No.
1, pp. 59-71.
Mallin, C., Saadouni, B. and Briston, R., (1995), ―The financial performance of ethical
investment funds‖, Journal of Business Finance and Accounting, Vol. 22, No. 4, pp. 483–496.
Mansor, F., and Bhatti, I., (2011), ―Risk and Return Analysis on Performance of the Islamic
Mutual Funds: Evidence from Malaysia‖, Global Economy and Finance Journal, Vol. 4, No. 1
pp. 19-31.
Markowitz, H., (1952), ―Portfolio selection‖, Journal of Finance, Vol. 7, pp. 77–91.

365
Marzban, S. and Asutay, M., (2012), ―The Impact of Asset-based versus Market
Capitalization-based Shari‘ah Screening on US and Japanese Equities: An Empirical
Analysis‖, Asian and African Area Studies, Vol. 11, No. 2, pp. 151-165.
May, T., (2011), ―Social Research: Issues, Methods and Process‖ Maidenhead : Open
University Press.
McClusky, T.G., (2005), “An Empirical Investigation of the Dividend Decision in Irish
Companies‖, Unpublished PhD thesis, University of Dundee.
Merdad, H., Hassan, M. and Alhenawi, Y., (2010), ―Islamic Versus Conventional Mutual
Funds Performance in Saudi Arabia: A Case Study‖, JKAU: Islamic Economics, Vol. 23 No. 2,
pp.157-193.
Mews, C. J., and Abraham, I., (2007), ―Usury and Just Compensation; Religious and Financial
Ethics in Historical Perspective‖, Journal of Business Ethics, Vol. 72, pp. 1-15.
Middleton, Calum A. J., (2006), “An Analysis of Equity Investment in the Emerging Stock
Markets of Central and Eastern Europe”, Unpublished PhD thesis, University of Dundee.
Mirakhor, A. and Zaidi, I. (2007), ―Profit-and-Loss Sharing Contracts in Islamic finance,‖ in
Hassan, M. Kabir and Mervyn Lewis, eds., Handbook of Islamic Banking, Edward Elgar,
Cheltenham, UK.
Mirakhor, A., (1996), ―Cost of Capital and Investment in a Non-Interest Economy‖, Islamic
Economic Studies, Vol. 4, No. 1, pp.35-47.
Modell, S., (2005), ―Triangulation between Case Study and Survey Methods in Management
Accounting Research: an Assessment of Validity Implications‖, Management Accounting
Research, Vol. 16, pp. 231–254.
Modell, S., (2010), ―Bridging the Paradigm Divide in Management Accounting Research: The
Role of Mixed Methods Approaches‖, Management Accounting Research, Vol. 21, pp.142-
129.
Modigliani, F. and Modigliani, L., (1997), ―Risk-Adjusted Performance‖, The Journal of
Portfolio Management, Vol. 23, No. 2: pp. 45-54.
Mohanty, S. K., Nandha, M., Turkistani, A. Q., and Alaitani, M. Y., (2011), ―Oil price
movements and stock market returns: Evidence from Gulf Cooperation Council (GCC)
countries‖, Global Finance Journal, Vo. 22, pp. 42–55.
Mossin, J., (1966), ―Equilibrium in a Capital Asset Market‖, Econometrica, Vol. 34, pp. 768-
783.
Mueller, S. A., (1994), ―Investment Returns on an Islamic-Principled Mutual Fund in the
United States: Further Evidence for the Cost-of-Discipleship Hypothesis‖, Sociology of
Religion, Vol. 55, No.1, pp. 85-87.
Al-Muthanna Market Research (December 2012), Investment Research, downloaded from
http://www.mic.com.kw/en/

366
Neaime, S., (2012), ―The global financial crisis, financial linkages and correlations inreturns
and volatilities in emerging MENA stock markets‖, Emerging Markets Review, Vol. 13, pp.
268–282.
Neuendorf, K. A., (2002), “The content analysis guidebook”, Sage Publications, Thousand
Oaks, CA.
Nur, E. M., (2006), ―Principles of an Integrated Concept of Riba: Toward an Islamic Theory of
Value‖, pp. 19-66 in Hanee, M. and Anwar, M. (Ed.), Studies in Islamic Economics In The 21st
Century, Shariah Foundation, theory and institutions, International Islamic University
Malaysia,
O‘Rourke, A., (2003), ―The Message and Methods of Ethical Investment‖, Journal of Cleaner
Production, Vol. 11, pp. 683-693.
Ooi, E. and Lajbcygier, P., (2013), ―Virtue Remains After Removing Sin: Finding Skill
Amongst Socially Responsible Investment Managers‖, Journal of Business Ethics, Vol. 113,
No. 2, pp. 199-224.
Örnberg, k.j., Nikkinen, J., and Äijö, J. (2013), ―Stock Market Correlations during the
Financial Crisis of 2008–2009: Evidence from 50 Equity Markets, International Review of
Financial Analysis, Vol. 28, pp. 70–78.
Ortas, E., Moneva, J, and Salvador, M., (2012), ―Does Socially Responsible Investment Equity
Indexes in Emerging Markets Pay Off? Evidence from Brazil‖, Emerging Markets Review,
Vol. 13, pp. 581–597.
Paino, H., Bahari, A., and Bakar, R., (2011), ―Shariah, Social Responsibilities and Corporate
Governance of the Islamic Banks in Malaysia‖ European Journal of Social Sciences, Vol. 23,
No. 3, pp.382-391.
Parashar, S.P., (2010), ―How Did Islamic Banks Do During Global Financial Crisis?‖, Banks
and Bank Systems, Vol. 5, No. 4, pp. 54-62.
Penman, S., Richardson, S., Tuna, I., (2007), ―The Book-to-Price Effect in Stock Returns:
Accounting for Leverage‖, Journal of Accounting Research, Vol. 45, pp. 427–467.
Philips, A.A, (2006), ―The Evolution of Figh: Islamic Law and the Madh-habs, International
Islamic Publishing House, Riyadh.
Pok, W.C., (2012), ―Analysis of Syariah Quantitative Screening Norms Among Malaysia
Syariah-Compliant Stocks‖, Investment Management and Financial Innovations, Vol. 9, No. 2,
pp.69-80.
Poon, S., Taylor, S.J., Ward, C.W., (1992), ―Portfolio Diversification: A Pictorial Analysis of
the UK Stock Market‖, The Journal of Business Finance & Accounting, Vol. 19, No.1, pp. 87-
101.
Punch, Keith F., (2001), “Introduction to Social Research: Quantitative and Qualitative
Approaches”, London: Sage Publications.

367
Qadhi, Y., (2002), ―15 Ways to Increase Your Earnings from the Qur’an and Sunnah”, Al-
Hyiddayah Publishing and Distributing, UK.
Rahimie, A.M., (2010), ―Analysing the Characteristics and Performance of Islamic Funds: A
Critical Review of the Malaysian Case‖, Unpublished PhD thesis, Durham University.
Random House Unabridged Dictionary (2nd edition), Randon House, New York.
Reilly, F. K. and Brown, K. C., (2006), ―Investment Analysis and Portfolio Management‖, 8th
Edition. Ohio: Thomson South-Western.
Renneboog, L., Ter Horst, J., Zhang, C., (2008a), ―Socially responsible investments:
Institutional aspects, performance, and investor behavior‖, Journal of Banking and Finance,
Vol. 32, pp.1723–1742.
Renneboog, L., Ter Horst, J. and Zhang, C., (2008b), ―The Price of Ethics and Stakeholder
Governance: The Performance of Socially Responsible Mutual Funds‖, Journal of Corporate
Finance, Vol.14, pp. 302-322.
Resolutions of the Securities Commission Shariah Advisory Council (SAC), (2007), Second
Edition, Kuala Lumpur, Malaysia.
Rocco, T.S., Bliss, S.A., Gallagher, S. and Pe´rez-Prado, A. (2003), ―Taking the Next Step:
Mixed Methods Research in Organizational Systems‖, Information Technology, Learning, and
Performance Journal, Vol. 21, No. 1, pp. 19-29.
Rosly, S. A., (2010) ―Shariah Parameters Reconsidered‖, International Journal of Islamic and
Middle Eastern Finance and Management, Vol. 3, No. 2, pp.132 – 146.
Ryan, B., Scapens R, and Theobold, M., (2002), ―Research Method and Methodology in
Finance and Accounting‖, London: Thomson Learning.
Sabrie, S. and Hakala, P., (2013), “Policy Briefing: Kuwait’s political crisis deepens”,
Working Paper, European Parliament, Policy Department, Directorate-General for External
Policies.
Sarea, A. Hanefah, M., (2013) ―Adoption of AAOIFI accounting standards by Islamic banks of
Bahrain‖, Journal of Financial Reporting and Accounting, Vol. 11 Iss: 2, pp.131 – 142.
Saidi N., (2006), “GCC Stock Markets: Fundamentals, Bubbles, and Governance”, IIF MENA
Region Forum, Kuwait, 6-7, November 2006.
Salaber, J., (2007), ―Sin Stock Returns Over the Business Cycle‖, unpublished manuscript,
University of Bath School of Management, Bath.
Salaber, J., (2007), “The Determinants of Sin Stock Returns: Evidence on the European
Market” Working paper, Paris-Dauphine University.
Salem, P., (2007), “Kuwait: Politics in a Participatory Emirate”, Carnegie Middle East
Center, Carnegie Papers, No. 3, June 2007.
Salter, B.S., (1998), ―Corporate Financial Disclosure in Emerging Markets: Does Economic
Development Matter?‖, The International Journal of Accounting, Vol.33, No.2, pp.211-234.

368
Samarakoon, L.P., (2011), ―Stock Market Interdependence, Contagion, and the U.S. Financial
Crisis: The Case of Emerging and Frontier Markets‖, Int. Fin. Markets, Inst. and Money, Vol.
21, pp. 724– 742
SAMBA Report (2011), “The GCC: Economic Outlook 2012”, December 2011, downloaded
from: www.samba.com
Sauer, D. A., (1997), ―The Impact of Social-Responsibility Screens on Investment
Performance: Evidence from the Domini 400 Social Index and Domini Equity Mutual Fund‖,
Review of Financial Economics, Vol. 6, No. 2, pp. 137-149.
Saunders, M., Lewis, P. and Thornhill, A., (2012), ―Research Methods for Business Students‖,
New York: Pearson.
Sayer, Andrew, (1992), “Method in Social Science: a Realist Approach”, New York:
Routledge.
Schnietz, K. E. and Epstein, M. C., (2005), ―Exploring the Financial Value of a Reputation for
Corporate Social Responsibility during a Crisis‖, Corporate Reputation Review, Vol. 7, pp.
327–345.
Schnietz, K., and Epstein, M., (2005), ―Exploring the Financial Value of a Reputation for
Corporate Social Responsibility During a Crisis‖, Corporate Reputation Review, Vol. 7, No. 4,
2005, pp. 327–345.
Scholtens, B., (2005), ―Style and Performance of Dutch Social Responsible Investment
Funds‖, The Journal of Investing, Vol. 14, No. 1, pp. 63–72.
Schröder, M., (2007), ―Is there a difference? ―The performance characteraistics of SRI equity
indices‖, Journal of Business Finance and Accounting, Vol. 34, No.1, pp. 331–348.
Schueth, S., (2003), ―Socially Responsible Investing in the United States‖, Journal of Business
Ethics, Vol. 43, No.3, pp. 189–194.
Schwartz, M., Tamari, M., and Schwab, D., (2007), ―Ethical Investing from a Jewish
Perspective‖, Business and Society Review, Vol. 112, No.1, pp. 137–161.
Sekaran, Uma, (2003), “Research Methods for Business: a Skill-Building Approach”, New
York: Wiley.
Selim, T.H., (2008), ―An Islamic Capital Asset Pricing Model‖, Humanomics, Vol. 24, No. 2:
pp.122–129.
Senbet, L.W. and Gande, A., (2009), “Financial Crisis and Stock Markets: Issues, Impact, and
Policies”, Conference Prepared presented at the annual conference of the Dubai Economic
Council ―Financial Crisis, Its Causes, Implications, and Policy Responses‖, Dubai, October
2009.
Shah, I., Iqbal, J., and Malik, M., (2012), ―Comparative Valuation between Islamic and
Conventional Mutual Fund‖, International Research Journal of Finance and Economics, Vol.
96, pp.28-34.

369
Shapiro, S.S. and Wilk, M.B., (1965), ―An analysis of variance test for normality (complete
samples)‖, Biometrika, Vol. 65, pp. 591-611.
Sharpe, W. F., (1966), ―Mutual Fund Performance‖, Journal of Business, Vol.39, pp. 119-138.
Siddiqui, R. (2007), ―Shari‘ah Compliance, Performance and Conversion: The Case of the
Dow Jones Islamic Market Index‖, Chicago Journal of International Law, Vol. 7, No. 2, 495-
520.
Sinclair, C.D., Lonie, A.A., Power, D.M., Helliar, C.V., (1996), ―Assessing the Potential
Benefits from Investing in Emerging Markets‖, Managerial Finance, Vol. 22, No. 12, pp.15 –
29.
Smith, H. W., (1991), “Strategies of Social Research”, 3nd edition, Rinehart and Winston.
Smolo, E., and Mirakhor, A., (2010), ―The Global Financial Crisis and its Implications for the
Islamic Financial Industry‖, International Journal of Islamic and Middle Eastern Finance and
Management,Vol. 3, No. 4, pp. 372-385.
Social Investment Forum, (1999), ―Report on Socially Responsible Investing Trends in the
United States‖, http://www.socialinvest.org/areas/research/trends/1999- Trends.htm.
Social Investment Forum report on socially responsible investing trends in the United States,
(2005) SIF Industry Research Program.
Social Investment Forum report on socially responsible investing trends in the United States,
(2006) SIF Industry Research Program.
Solomon J., (2007), “Corporate governance and accountability”, (2nd ed), New York, NY:
Wiley.
Sparkes, R. and Cowton, C. J., (2004), ―The Maturing Of Socially Responsible Investment: A
Review Of The Developing Link With Corporate Social Responsibility‖, Journal of Business
Ethics, Vol. 52, pp. 45–57.
Sparkes, R., (1995), ―The Ethical Investor‖, Harper Collins Publishers, London.
Sparkes, R., (2001), ―Ethical Investment: Whose Ethics, Which Investment?‖, Business Ethics:
A European Review, Vol. 10, No. 3, pp. 194-205.
Sparkes, R., (2002), ―Socially Responsible Investment: A Global Revolution”. England: John
Wiley & Sons Ltd.
Standard & Poor‘s, (2009), Global Stock Market Factbook.
Statman, M. (2006). ―Socially Responsible Indexes: Composition, Performance and Tracking
Error‖. The Journal of Portfolio Management, Spring, pp. 100-109.
Statman, M. and Glushkov, D, (2009), ―The Wages of Social Responsibility‖, Financial
Analysts Journal, Vol. 65, No. 4, pp. 33–46.
Statman, M., (1987), ―How Many Stocks Make a Diversified Portfolio?‖, Journal of Financial
and Quantitative Analysis, Vol. 22, No. 3, pp. 353-363.
370
Statman, M., (2000), ―Socially Responsible Mutual Funds‖, Financial Analysts Journal, Vol.
56, No. 3, pp. 30-39.
Statman, M., (2005), ―The Religions of Social Responsibility‖, The Journal of Investing, Vol.
14, No. 3, pp. 14-22.
Statman, M., (2006), ―Socially Responsible Indexes‖, Journal of Portfolio Management, Vol.
32, No. 3, pp. 100–109.
Strong, N., (1992), ―Modelling Abnormal Returns: A review Article‖, Journal of Business
Finance and Accounting, Vol. 19, pp. 533–553.
Sturm, M., Strasky, J., Adolf, P., and Peschel, D., (2008), “The Gulf Cooperation Council
countries economic structures, recent developments and role in the global economy”,
Occasional paper series, No. 92, July, European Central Bank, downloaded from
http://www.ecb.europa.eu
Sultan, S. A. M., (2007), ―A mini guide to shari’ah audit for Islamic financial institutions”,
CERT Publication, Kuala Lumpur.
Tariq, A. (2004), “Managing Financial Risks of Sukuk Structures”, Unpublished Masters
dissertation, Loughborough University, UK.
Tashakkori, A. and Teddlie, C. (1998), ―Mixed Methodology: Combining Qualitative and
Quantitative Approaches‖, Sage, Thousand Oaks: London.
The UK Islamic Finance Secretariat (UKIFS) (2012), Financial Markets Series, March 2012,
Sponsored by Gatehouse Bank downloaded from:
http://www.londonstockexchange.com/specialist-issuers/islamic/downloads/city-uk-if-2012.pdf
Tijjani, Bashir,(2008), “An Empirical Investigation of the Equity investment and Share
Valuation Process in Nigeria”, Unpublished PhD thesis, University of Dundee.
Tobin, J. (1958). ―Liquidity Preference as Behaviour Towards Risk‖. The Review of Economic
Studies, Vol. 25, No. 2, pp. 65-86.
Trabelsi, M.A., (2011), ―The Impact of the Financial Crisis on the Global Economy: Can the
Islamic Financial System Help?‖, The Journal of Risk Finance, Vol. 12 No. 1, pp. 15-25.
Treynor, J., (1965), ―How to Rate Management of Investment Funds‖, Harvard Business
Review, Vol. 44, pp. 63-75.
Usmani, M.T., (2010), “An Introduction to Islamic Finance”, Quranic Studies Publishers,
Karachi, Pakistan.
Visser, H., (2009), “Islamic finance :principles and practice”, Cheltenham: Edward Elgar,
UK.
Vogel, F. E. and Hayes, S. L., (1998), “Islamic Law and Finance: Religion, Risk, and Return”,
The Hague, London: Kluwer Law International.
Waddock, S. and Graves, S., (1997), ―The Corporate Social Performance-Financial
Performance Link‖, Strategic Management Journal, Vol. 18, No.4, pp. 303–320.

371
Walkshäusl, C. and Lobe, S., (2012), ―Islamic Investing‖, Review of Financial Economics,
Vol. 21, No.2, pp. 53–62.
Weber R.P., (1990), “Basic Content Analysis”, Sage Publications, Newburry Park, CA.
Webster‘s Third New International Dictionary of the English Language Unabridged, (1961),
Springfield, MA.
Wilson, R. (1997), ―Islamic Finance and Ethical Investment‖, International Journal of Social
Economics, Vol. 24, No. 11, pp. 1325-1342.
Wilson, R. and Henry, C., (2004), “The Politics of Islamic Finance”, Edinburgh, Edinburgh
University Press, pp. 307.
Wilson, R. (2004), ―Screening Criteria for Islamic Equity Funds‖, pp. 35–45 in S. Jaffer (Ed.),
Islamic Asset Management, Euromoney Books, London.
Wilson, R. (2005), ―Islamic Fund Management‖. In Anwar, M., and Haneedf, M. (Ed.), Studies
in Islamic Banking and Finance in the 21ST
Century Theory and Practice, International Islamic
University, Malaysia.
Wilson, R., (2008), ―Innovation in the structuring of Islamic Sukuk securities‖, Humanomics,
Vol. 24 No. 3, pp. 170-181.
Wilson, R., (2009), ―The development of Islamic finance in the GCC‖, Working Paper, Kuwait
Programme on Development, Governance and Globalization in the Gulf States.
World Economic Outlook of the International Monetary fund (2012), accessed from
http://www.opec.org.
Worrall, J., (2012), ―Oman: The ―Forgotten‖ Corner of the Arab Spring‖, Middle East Policy,
Vol. 19, No. 3, pp. 98-115.
Xu, D., (2010), “An Empirical Investigation of Weak-form Efficiency in The Chinese Stock
Market”, Unpublished PhD thesis, University of Dundee.
Yaacob, H. and Donglah, N. K., (2012), ―Shari‘ah audit in Islamic financial institutions: The
postgraduates‘ perspective‖, International Journal of Economic and Finance, Vol. 4, No. 12,
pp. 224-239.
Zaher, T.S. and Hassan, M.K., (2001), ―A comparative literature survey of Islamic finance and
banking‖, Financial Markets, Institutions & Instruments, Vol. 10, No. 4, pp. 155-199.
Zainol, Z., and Kassim, S.H., (2010), ―An Analysis of Islamic Banks‘ Exposure to Rate of
Return Risk‖, Journal of Economic Cooperation and Development, Vol. 3, No. 1, pp. 59-84.
Zarrouk, H., (2012), ―Does Financial Crisis Reduce Islamic Banks‘ Performance? Evidence
from GCC Countries‖, Journal of Islamic Finance and Business Research, Vol. 1, No. 1, pp. 1-
16.
Zawya report, (2011), “The Small World of Islamic Finance Shariah Scholars and Governance
- A Network Analytic Perspective”, funds@work, downloaded from: http://www.funds-at-
work.com/uploads/media/Sharia-Network_by_Funds_at_Work_AG.pdf.pdf

372
Zubairu, U., Sakariyau, O., and Dauda, C., (2011), ―Social Reporting Practices of Islamic
Banks in Saudi Arabia‖, International Journal of Business and Social Science, Vol. 2, No. 23,
pp.193-205.

373
Arabic References
Al Manea, Sulaman, (1998), “Trading in Stocks of Companies Based On Islamic Foundations
and Principles”, the Fifth Jurisprudence Conference, Kuwait Finance House, 2-4 November,
1998, pp. 33-71.
(، "بحذ ف حى اخاجزة باطه اشزواث اظاهت وا ذه لىد وظىابػ حمخعها 0000طا، )اغ، ػبذهللا ب
000-00، ص 0000ىفبز، 0-0لىاػذ اإلطال وأصىه"، اذوة افمهت بج اخى اىىخ،
Al-Birwari, Shaban, M.I., (2001), “The Financial Security Markets from an Islamic
Perspective, a Critical Analytical Study”, Dar Al-Fikar, Syria.
(، "بىرصت األوراق اات ظىر إطال، دراطت ححت مذت"، دار افىز، 0000ابزواري، شؼبا حذ إطال، )
طىرا0
Al-Jazaeri, Abu Bakr Jabir, (1995), ―The Muslim’s Path”, First Edition, Dar Al-Salam, Egypt.
( "هاس اظ" ، اطبؼت األوى، دار اظال طباػت واشز، صز00000اجشائزي، أبىبىز ، )
Al-Khalel, Ahmad M., (2005), ―The Rulings of Stocks and Bonds according to Islamic
Jurisprudence”, Second edition, Dar Ibn Al-jawzi, Saudi Arabia.
(، "األطه واظذاث وأحىاها ف افمه اإلطال"، اطبؼت األوى، دار اب اجىسي، 0000اخ، أحذ ب حذ، )
اظؼىدت
Al-Nashmi, Ajel J., )1998(, “Trading and Participating in Stocks of Companies whose
Business is Permissible but Sometimes Deals with Haram”, the Fifth Jurisprudence
Conference, Kuwait Finance House, 2-4 November, 1998, pp. 139-172.
(، "اخؼا واشاروت ف شزواث أص شاغها حالي إال أها حخؼا أحاا باحزا"، اذوة 0000اش، ػج جاط، )
0000-000، ص 0000 ىفبز، 0-0افمهت بج اخى اىىخ،
Al-Nifasa, Abdul Rahman, A., (2010), ―Investment Funds: The Shariah Guidelines and
Governance Rulings, Empirical Comparison Study”, First Edition, Dar Al-Nafaes, Jordon.
اعىابػ اشزػت واألحىا اظات، دراطت حطبمت ( ، "صادك االطخزار: 0000افظت، ػبذازح ب ػبذاؼشش، )
مارت" اطبؼت األوى، دار افائض، األرد0
Al-Quradaqi, Ali, M.A., (2002), ―The Rulings and Types of Stocks in Light of Islamic
Jurisprudence‖ pp. 169-220 in “Research in Islamic Economics‖, First edition, Dar Al-
Bashaer, Lebanon.

374
000-000"ص، (، "أحىا األطه وأىاػها ػى ظىء لىاػذ افمه اإلطال0000امزة داغ، ػ ح اذ، )
وخابه "بحىد ف اإللخصاد اإلطال" اطبؼت األوى، دار ابشائز اإلطالت، با0
Al-Quradaqi, Ali, M.A., (2003), “The Impact of Debt and Liquidity of the Company or
Portfolio on Trading Stocks, Sukuk, Investments Funds Units: the problem and solution”,
Islamic Development Bank Publications, No. 61, Saudi Arabia.
أو احفظت ػى حى حذاوي األطه واصىىن واىحذاث (، أرز دى ومىد اشزوت0000امزة داغ، ػ ح اذ،)
، اظؼىدت000االطخزارت اشىت واحىي، طبىػاث اؼهذ اإلطال بحىد اخابغ به اإلطال خت، بحذ رل
Al-Qurdi, (2001), ― Trading in Stocks of Companies whose Business and Purpose is
Permissible but Borrow and Lend on Interest Basis‖, Journal of Shariah and Islamic Studies,
Vol. 44, No. 16, p.16
ا باح ى حمزض وحمخزض ابه بصفت (، "اخاجزة بأطه شزواث غزظها وػه0000اىزدي، أحذ احج، )
00ارص، ص – 00رل – 00ظخزة"، جت اشزؼت واذراطاث اإلطالت، ع
Al-Salaami, M.M, (1998), “Trading in Stocks of Companies whose Business is Permissible but
Borrow and Lend on Interest Basis”, the Fifth Jurisprudence Conference, Kuwait Finance
House, 2-4 November, 1998, pp. 9-30.
اذوة (، "اخاجزة باطه شزواث غزظها وشاغها باح ىها حمزض ومخزض بفائذة"، 0000اظال، حذ اخخار، )
000-0، ص 0000ىفبز، 0-0افمهت بج اخى اىىخ،
Al-Shubali,Yusif A., (2005), ―Trading in Securities‖ pp.222-291 in “The Investment Services
in Banking and their Rulings according to Islamic Jurisprudence”, First edition, Dar Ibn Al-
jawzi, Saudi Arabia.
اث االطخزارت ف اصارف وأحىاها (، "بحذ اخاجزة باألطه" وخابه "اخذ0000اشب، ىطف ب ػبذهللا، )
ف افمه اإلطال" اطبؼت األوى، دار اب اجىسي، اظؼىدت0
AL-Sulaman, Mubarak, S.M., (0000), ―The Rulings of Dealing with Contemporary Stocks
Markets”, Dar Khonoz Eshbelia, Saudi Arabia.
(، "أحىا اخؼا ف األطىاق اات "، دار وىس إشبا شز واخىسغ، 0000حذ، ) آي طا، بارن ب طا ب
اظؼىدت0
Al-Suwailem, Sami, I., (2009), “Tawarruq Banking Products”, a working paper presented in
the International Council of Fiqh, February 2009.

375
(، "خجاث اخىرق اصزفت"، ورلت ػ مذت جغ افمه االطال اذو، فبزاز 0000ابزاه، )اظى، طا ب
00000
Al-Tunaji, Ibraheem, A., (2009), ―Governance for Buying Mixed Stocks in Islamic
Jurisprudence‖, Journal of Shariah and Islamic Studies, Vol. 77, No. 24, pp. 459-485.
إبزاه ػ أحذ اشاي اطج ظىابػ شزاء أطه اشزواث اخخطت ف افمه اإلطال جت اشزؼت واذراطاث
0000-000، ص 00، رل 00اإلطالت ، ع
Alyahsobi, Eyadh Bin Musa, (2002), ―The Comprehensive Definition of the Rights of the
Prophet‖ Dar Ibn Hazem, Beirut.
(، "اشفا بخؼزف حمىق اصطفى"، دار اب حش، بزوث0000احصب، اماظ ػاض ب ىطى، )
Al-Zuhayli, Wahba, (2005), ― The Brief in Islamic Jurisprudence‖, Dar Al-Fikar, Syria.
اإلطال"، دار افىز، طىرا0(، اىجش ف افمه 0000اشح، وهبت )
Fiqh Encyclopedia, Ministry of Awqaf and Islamic affairs in Kuwait, vol. 4, p. 259.
0000اىطىػت افمهت اىىخت، وسارة األولاف واشؤو اإلطالت ف اىىج، اجذ ازابغ، ص
Mustafa, I., (2006), ―evaluating the Phenomenon of Conventional Banks conversion to Islamic
Banks: Empirical Study on Banks in Saudi Arabia‖, Masters Desertion, American Open
University, Cairo.
بؼط حجزبت ػ حطبمت دراطتاإلطالت: صزفت اخمذت ابىن ححىي ظاهزة حم(، 0000صطفى، ابزاه حذ، )
، رطات اجظخز، اجاؼت األزوت افخىحت، صز اظؼىدت ابىن
Sano, Kutab M., (2000), “The Investment, its Rulings and Guidelines in Islamic
Jurisprudence” Dar Al-Nafaes, Jordon.
(، "االطخزار أحىاه وظىابطه ف افمه اإلطال"، دار افائض، األرد0 0000طاى، لطب صطفى، )
Zaidan, Abudl Karim, (1999), “The Introductory to Study Islamic Shariah”, Dar, Al-Risala,
Lebanon.
دار ازطات شز، با0(، "اذخ ذراطت اشزؼت اإلطالت"، 0000سذا ، ػبذ اىز، )

376
Ziqaba, A.A., (2010), “Maqasid al-Shariah related to Financial Transactions”, Dar Al-
Nafaes, Jordon.
اات"، دار افائض، األرد0 (، "ماصذ اشزؼت اخاصت باخصزفاث0000سغبت، ػش اذ، )

377
Appendices
Appendix 1.1: Comparison of AAOIFI’s Screening Criteria for Mixed Halal Stocks
in 2004 and 2006
AAOIFI’s Screening Criteria in 2004 AAOIFI’s Screening Criteria in 2006
1. Interest revenue to un-Halal (sin)
revenue to total revenue of less than 5%.
2. Interest bearing debt to total assets of
less than 30%.
3. Interest bearing Investment and cash to
total assets of less than 30%.
1. Interest revenue and un-Halal (sin) revenue
to total revenue of less than 5%.
2. Interest bearing debt to market
capitalization of less than 30%.
3. Interest bearing Investment and cash to
market capitalization of less than 30%. Note: this table compares the financial screening criteria for both AAOIFI‘s 2004 and 2006 standards. The
differences between the two sets of criteria are shown in bold.
Appendix 2.1: The Area and Population of each GCC Country
Country Area Population
2005 2006 2007 2008 2009 2010 2011 2012* 2013*
Bahrain 767 0.734 0.749 0.764 0.779 1.039 1.107 1.129 1.151 1.174
Kuwait 17,818 2.991 3.183 3.4 3.442 3.485 3.582 3.682 3.785 3.89
Oman 309,500 2.618 2.67 2.726 2.785 2.883 2.981 3.083 3.18 3.28
Qatar 11,607 0.888 1.042 1.226 1.448 1.639 1.7 1.768 1.839 1.912
Saudi
Arabia
2,000,00
0
23.11
9
24.12
2
24.94
1
25.78
7
26.66 27.56
3
28.16
9
28.78
9
29.42
2
UAE 71,024 4.106 4.229 4.488 4.765 5.066 5.218 5.375 5.536 5.702
Total 2410716 34.45
6
35.99
5
37.54
5
39.00
6
40.77
2
42.15
1
43.20
6
44.28 45.38
Note: the area is calculated in square kilometers and the population in millions of people. Source: the
International Monetary Fund (IMF) data and statistics (2012). * The figures for the years 2012 and 2013 are
estimated.

378
Appendix 2.2: The Performance of the official KSE index and MSCI Kuwait index
Note: this figure compares the performance of the official KSE and MSCI Kuwait index, index from 100 points
from the 4/1/2006-31/12/2011 based on weekly prices.
Appendix 2.3: The Stock Price Maximum Daily Change
Stock Price Range (Fils) Unit Change (Fils) Max Daily Change (5 Units)
1-50 0.5 5x0.5 = 2.5 Fils
51-100 1 5x1 = 5 Fils
102-250 2 5x2 = 10 Fils
255-500 5 5x5 = 25 Fils
510-1000 10 5x10 = 50 Fils
1020-2500 20 5x20 = 100 Fils
2520-5000 20 5x20 = 100 Fils
5050-9900 50 50X5 = 250 Fils
Note: This table shows the maximum daily price changes per stock based on its price range. The One Kuwaiti
Dinar (K.D) is equivalent to 1,000 Fils. The price is not permitted to increase or to decrease more than 5 units per
day. For example, a stock with a value of 300 Fils cannot increase more than 325 Fils or decrease less than 275
Fils daily during its daily trading.
Source: KSE official website: http://www.kse.com.kw/KSE/Trading.aspx
0
20
40
60
80
100
120
140
160
04/01/2006 04/01/2007 04/01/2008 04/01/2009 04/01/2010 04/01/2011
KSE MSCI KU

379
Appendix 2.4: the Differences between Islamic and Conventional Banking
Conventional Banking Islamic Banking
The functions and operating modes of
conventional banks are based on man-made
principles.
The functions and operating modes of Islamic
banks are based on the principles of Islamic
Shariah. Thus, they have to have a SSB that play a
significant role in ensuring Shariah compliancy.
The investor is assured of a predetermined rate of
interest.
In contrast, it promotes risk sharing between
provider of capital (investor) and the user of funds
(entrepreneur).
It aims at maximizing profit without any
restriction.
It also aims at maximizing profit but subject to
Shariah restrictions.
It does not deal with zakat. In the modern Islamic banking system, it has
become one of the service-oriented functions of
the Islamic banks to collect and distribute zakat.
Lending money and getting it back with interest is
the fundamental function of the conventional
banks.
Participation in partnership business is the
fundamental function of the Islamic banks.
Its scope of activities is narrower when compared
with an Islamic bank.
Its scope of activities is wider when compared
with a conventional bank. It is, in effect, a multi-
purpose institution.
It can charge additional money (compound rate of
interest) in case of defaulters.
The Islamic banks have no provision to charge
any extra money from the defaulters.
In it very often, bank‘s own interest becomes
prominent. It makes no effort to ensure growth
with equity.
It gives due importance to the public interest. Its
ultimate aim is to ensure growth with equity.
For interest-based commercial banks, borrowing
from the money market is relatively easier.
For Islamic banks, it is comparatively difficult to
borrow money from the money market.
Since income from the advances is fixed, it gives
little importance to developing expertise in project
appraisal and evaluations.
Since it shares profit and loss, Islamic banks pay
greater attention to developing project appraisal
and evaluations.
Conventional banks give greater emphasis on
credit-worthiness of the clients.
Islamic banks, on the other hand, give greater
emphasis on the viability of the projects.
The status of a conventional bank, in relation to its
clients, is that of creditor and debtors.
The status of Islamic bank in relation to its clients
is that of partners, investors and trader.
A conventional bank has to guarantee all its
deposits.
Strictly speaking, an Islamic bank cannot
guarantee all its deposits.
Note: this table shows the differences between conventional and Islamic banking system.
Source: (Ahmad and Hassan, 2007)

380
Appendix 3.1: Summary of Studies on the Performance of Ethical Investments
Author(s) Methods, Sample, and Period Key findings
Luther et al.
(1992)
Compared 15 U.K. ethical funds with two
market indices (domestic and
international) from Dec. 1972- Jun.1990
using monthly data.
Weak evidence that ethical funds outperformed
both indices measured by Jensen alpha and Sharpe
ratio.
Hamilton et
al. (1993)
Compared 32 U.S ethical funds with 170
random conventional funds from Jan.
1981- Dec.1990 using monthly data
No statistical performance difference measured by
Jensen alpha.
Luther and
Matatko
(1994)
9 U.K ethical funds from the period 1985-
1992
Ethical funds performed better when evaluated
against a small company benchmark than when
using the financial times all share index.
Diltz (1995) Compared the performance of 14
constructed equity portfolio pairs of U.S
159 firms according to their compliance
with 11 ethical screens classified to either
good, fair (for mixed results), or poor,
using daily stock price data from
Jan.1989-Dec.1991
Ethical and social screening appears to have
little, if any, effect on portfolio returns. Significant differences occur between alphas
for portfolios rated good and poor only when military and nuclear involvements are scrutinized. The excess returns showed that
enhanced performance comes from applying environmental and charitable giving screens, and negative performance comes from
applying the family benefits screen. Mallin et al.
(1995)
29 U.K ethical funds directly compared
with 29 ‗non-ethical‘ funds matched based
on funds‘ size and formation data from
Jan. 1986- Dec.1993, using monthly data.
Ethical funds underperformed non-ethical
matched funds and market index. But some
evidence of superior risk-adjusted performance of
ethical funds using Jensen, Sharpe, and Treynor
measures.
Bal and Leger
(1996)
Analyzed the Performance of 92 UK
investment trusts over the period 1975 to
1993.
Weak evidence of superior performance of
UK funds by Jensen and Treynor measures.
Gregory et al.
(1997)
Compared 18 U.K ethical funds with 18
‗non-ethical‘ funds using a matched pair
analysis based on age, size from Jan.
1986- Dec.1994. Examine the impact of
funds characteristics on the performance
of 108 funds (16 ethical and 92 non -
ethical). Investigated the small firm‘s
effects on funds‘ performance (13ethical
and 74 non-ethical)
Lower returns but not significantly different. Both
groups underperform the FTSA benchmark index.
The age of a fund appears to be an important
factor affecting each fund‘s alpha measure, while
the size of a fund and its ethical status are found to
be insignificant. Ethical funds have greater
exposure to small firm‘s size.
Sauer (1997) Examined the performance of Domini 400
Social Index (DSI) , S&P500 and CRSP
value weighted market index from 1986-
1994 using Jensen‘s alpha and Sharpe
ratio.
No adverse impact of socially responsibility
screens on investment performance.
Statman
(2000)
Compared 31 U.S ethical funds with 62
‗non-ethical‘ funds and two indices
(S&P500 and DSI). Each ethical fund was
matched with two non-ethical funds based
on funds‘ asset size, from 1990-1998,
using monthly data.
Ethical funds performed better, but differences are
not statistically significant. Both types of funds
underperformed the market. Used Jensen alpha
and modified Sharpe measures for the risk-
adjusted performance. The risk-adjusted returns of
the DSI were slightly lower than those of the S&P
500, but the difference was not statistically
significant.
Kreander et
al. (2002)
Studied the performance of 40 ethical
funds from 7 European countries from the
period Jan. 1996- Dec. 1998 using weekly
Most funds seemed to outperform the benchmark
index as measured by the Jensen and the Treynor
performance measures but not statistically

381
data
significant. The index slightly outperformed the
average fund based on Sharpe ratio. Size was
positively related to good fund performance as
measured by the Jensen alpha, but neither the
universe nor the country factors were significant.
No evidence of a significant positive market
timing ability.
Bauer et al.
(2005)
Examined the performance of 103
German, U.K., and US ethical,
conventional funds, and international,
domestic, and ethical indices, using Jensen
alpha and investment style using Carhar
(1997) 4 factor model from 1990-2001
using monthly data.
No statistically significant difference in
performance (Jensen alpha) between ethical and
conventional mutual funds. Ethical funds were
less exposed to market return variability compared
to conventional funds. U.K. and German ethical
funds and are heavily exposed to small caps, while
US ethical funds invest more in large caps
compared to their conventional peers. Ethical
indices perform worse than conventional indices
in explaining ethical mutual fund returns.
Kreander et
al. (2005)
Analyzed the performance of 30 European
ethical funds and 30 non-ethical funds
employing a matched pair approach based
on age, size, country and investment
universe. The four countries are Germany,
Netherlands, Sweden, and U.K) from
Jan.1995-Dec. 2001 using weekly data.
No significant risk-adjusted performance
difference between ethical and non-ethical funds
measured by Jensen alpha, Sharpe, and Traynor
ratios. Neither type of fund displayed any ability
to time the market. Management fee is a
significant explanatory variable for the Jensen
measure.
Derwall et al.
(2005)
Examined the performance of Stock
portfolios composed of U.S. companies
based on eco-efficiency253
ranking (via a
best-in-class stock selection strategy) over
the 1995–2003 period.
The high ranked portfolio provided substantially
higher significant returns than its low-ranked
counterpart. Suggesting that the benefits of
considering environmental criteria in the
investment process can be substantial contrary to
the portfolio and asset pricing theory.
Statman
(2006)
Compared the returns of the four SRI
indexes and the returns of the conventional
S&P 500 index during May 1990-April
2004.
Returns of SRI indexes generally exceeded returns
of the S&P 500 index but Jensen‘s alphas are not
statistically significant. Correlations between the
returns of SRI indexes and the S&P 500 are high.
Girard et al.
(2007) Investigating the performance of 117 U.S
ethical funds (equity, bond, and balanced)
and appropriate style benchmarks, from
Jan. 1984-Dec. 2003
Found evidence of poor selectivity and market
timing ability on the part of ethical fund
managers. Equity funds‘ size had not impact on
performance. Funds with the most ethical screens
have the least selectivity performance and lack
diversification.
Schröder
(2007)
Analyzed the performance of 29
international ethical equity indices with
conventional benchmarks.254
From the
Ethical screens for equities neither lead to a
significant out-performance nor an
underperformance
compared to the benchmarks based on Jensen
253 According to Derwall et al. (2005) eco-efficiency measures the environmental performance of a company and can be described as the ratio of the value a company adds (e.g. by producing products) and the wastes the company generates resulting from the creation of that value. See Schaltegger et al. (2003). Derwall et al. (2005) obtained rating data from Innovest Strategic Value Advisors to proxy for corporate eco-efficiency. 254 The Ethical indices used such as families Dow Jones Sustainability indices (DJSI), Ethical, FTSE4Good, Humanix and KLD covering different international investment areas. Seven indices have a global investment universe and ten cover European stocks, of which four concentrate on the euro area. The other 12 indices contain stocks of single countries (number of indices in brackets): Australia (1), Canada (1), Sweden (1), the United Kingdom (2) and the United States (7). Most indices concentrate on stocks with a large market capitalization and aim to sufficiently represent the market capitalization of the stock market. Hence, Schroder (2007) argues that small cap bias, the relatively high investment weight of stocks with a low market capitalization, which has been found in several studies (Luther et al., 1992; Schroder, 2004; Bauer et al., 2005), would not affect his study.

382
starting date of each index till the end of
Dec. 2003255
on monthly basis.
alpha and Sharpe ratio. 19 out of the 29 ethical
indices exhibited a higher risk exposure measured
by β.
Consolandi et
al. (2009)
Investigated the performance of the DJSSI
compared to the Surrogate
Complementary Index (SCI) 256
in
European countries, over the full 2001–
2006 and sub-periods, using daily data
time series data.
The performance of ethical companies in the
ethical index performed as well as that of the other
firms in the conventional index suing excess
returns and Sharpe ratio.
Lyn and
Zychowicz
(2010)
Analyzed the performance of 43 faith-
based funds against Domini 400 Social
Index (DS400) as a proxy for the
performance of SRI and S&P 500 Index,
during the period during from May 2001
to Feb.2008 on monthly basis.
The faith-based funds did better than SRI funds in
general. They also found that additional faith and
social value screens used by these funds do not
hinder their performance relative to the market
overall. Measured by Jensen alpha, Sharpe,
Trynor, information ratios.
Carosella et
al.
(2012)
Compared the performance of a Catholic
ethical values portfolio of large cap 500
U.S stocks that is ranked as defined by
IWFinancial (IWF) according to
compliance such screens257
and
benchmarked against various ethical and
conventional indices, from May 1998-
Dec.2007, using monthly data.
The bottom quintile of the ethical rankings
provided better performance results on a risk–
reward basis (Jensen alpha, Share ratio, Treynor
ratio, and the reward to semi variability ratio) than
top quintile of the ethical rankings. They
explained their finding based on the performance
of economic performance of different sectors. As
high ethical returns high CSP sectors; financials
and consumer discretionary have poor
performance, while low ethical sectors; energy
and industrials have high CFP results.
Ortas et al.
(2012)
Analyzed the performance of the
mainstream ethical equity index in
emerging markets in the Latin American
context: the Brazilian Corporate
Sustainability Index (BCSI), from 2007-
2010.
Found evidence that there is no risk or return
disadvantage in bullish market periods. However,
the financial crisis led the ethical index to take a
riskier and less profitable portfolio as they were
more sensitive to changes in the market cycle,
whereas its benchmark comprises more stocks in
‗sin‘ sectors that are not affected to the same
extent. 258
Note: this table shows a summary of previous studies on the performance of ethical investments. For each study,
the table reports the countries studied, the data and time period and finally the key findings.
255 The start date varies across indices (e.g. KLD1 starts at June 1990, while FT1 starts at Aug. 1996) 256 Dow Jones Sustainability Stoxx Index (DJSSI) focuses on the European corporations with the highest CSR scores among those included in the Dow Jones Stoxx 600 Index. The Surrogate Complementary Index (SCI) is a benchmark built by the authors to include only companies that do not belong to the ethical index to serve as an unbiased conventional index, because any official conventional index includes ‘ethical’ companies that may blur the findings Consolandi et al. (2009). DJ stoxx 600 Index contained 556 stocks, while DJSSI and SCI contained 137 and 419 stocks respectively. 257 IWFinancial (IWF) allows users to construct SRI scores based on a user-specified SRI profile. In the IWF database, different overarching issues and specific social and ethical practices can be excluded or given “high,” “medium,” or “low” according to their compliance with such screens (Carosella et al., 2012). Their rankings were done with IWFinancial data available on June 27, 2007 as the IWFinancial does not maintain a history of its database. 258 Unlike, all the literature on ethical investments that used the signal factor model and multifactor models (static analysis) Ortas et al. (2012) used a dynamic analysis of its time-varying behavior of the alphas and betas arguing that will provide more robust insights about the BCSI performance.

383
Appendix 3.2: Summary of Studies on the performance Islamic Investments
Author(s) Methods, Sample, and Period Key findings
Mueller (1994) Compared the risk-adjusted returns of
the Amana Income Fund (Islamic
fund) in U.S as his only sample with a
conventional fund and index, from
1987-1992 using annual data.
The Amana income fund underperformed the
conventional index and fund measured by Traynor
ratio. Thus he evidence to support the cost-of-
discipleship hypothesis which suggests that ethical
based investment suffers additional costs on
investment return.
Hakim and
Rashidian
(2004)*
Compared the performance of DJIM,
Dow Jones World Index (DJW) and
Dow Jones Sustainability World Index
(DJS) using weekly data from Jan.
2000- Aug. 2004, employing CAPM
measures.
The total fluctuations in the DJIM index have been
in line with other two indices during the full period
and bear market sub-period (2000-2002). The DJIM
index has done as well as the DJW, however
measured against the DJS index, the performance of
the DJI has been lacking.
Hussein (2004) Compared the performance of the
FTSE Global Islamic index with FTSE
All-World Index and FTSE4Good
index during the sample period 1996-
2003, using monthly data. Using
Jensen, Sharpe, Treynor measures.
FTSE Islamic index performed as well as the FTSE
All-World index over the entire period. Gained
positive returns in the bull market period, but
underperformed in the bear market period.
FTSE4Good index has the best performance during
the entire and bull markets periods but
underperforms the FTSE All-World index during the
bear market. In general, they concluded that there is
no adverse effect on FTSE Islamic index.
Hussein and
Omran (2005)
Examined the performance of DJIM
and sub-indices (based on size and
industry) and their DJ counterparts,
using monthly data obtained from DJ
data bases covering a full period from
1996- 2003, using Jensen, Sharpe,
Treynor measures, as well as non-
parametric test to measure the
significance of indices returns.
Islamic indices yield significant positive returns over
the full and the bull market periods, then they
underperform their index counterparts over the bear
market period (but not statistically significant). They
argued that positive returns may be attributed to
small firm effect and low gearing of firms in DJIM
index. While the underperformance could be due to
the removal of several alcoholic beverage firms
when they were among the best performers during
the bear market.
Abdullah et al.
(2007)
Investigated the performance of 14
Islamic funds and 51 conventional
mutual funds in the Malaysian over the
period 1992- 2001 using monthly data.
Jensen Alpha, Sharpe, adjusted Sharpe,
Modigliani measure.
Islamic funds performed better than the conventional
funds during bearish market, while conventional
funds showed better performance than Islamic funds
during bullish market. They implied that implies that
Islamic funds can be used as a hedging instrument
during bad economic conditions. Conventional funds
were better diversified.
Abderrezak
(2008)*
Studied the performance of 46 Islamic
and ethical Equity funds divided in
different regions, measured against 3
benchmarks during January 1997 to
August 2002. He used Sharpe measure,
and Fama and French (1993) model to
evaluate funds investment style.
Islamic funds in the west did poorly against their
respective indices. Islamic funds are exposed to
small cap firms and also a preference for growth
preference stocks. No significant difference between
ethical and conventional funds was detected. Finally,
Islamic funds do suffer from lower diversification
Girard and
Hassan (2008)
Compared the performance of 5 FTSE
Islamic with conventional series
classified into regions, over the period
Dec.1998-Dec.2006 on monthly basis.
Used Carhart (1997) 4 factor model in
addition to Jensen, Sharpe, Treynor
measures.
Did not find strong evidence of performance
differences between Islamic and non-Islamic indices
peers. They found that Islamic indices are growth
and small-cap oriented and conventional indices are
relatively more value and midcap focused. They
indicated that Islamic indices exclude value sectors
with higher environmental risks, such as chemical,
energy, and basic industries.
Albaity and Measured the risk and return Found no evidence of significant statistical

384
Ahmad (2008) performance of the Kuala Lumpur
Syariah Index (KLSI) and the Kuala
Lumpur Composite Index (KLCI)
during 1999-2005.
differences in risk-adjusted returns between Islamic
and conventional stock market indices.
Derigs and
Marzban
(2009)
Examined the impact of the different
Shariah financial screens on portfolio
performance of S&P 500 index
companies on the 17th of Sep. 2007
using a Mean-Variance model to create
efficient frontiers.
The Shariah-compliance portfolios underperformed
the unrestricted portfolio. The Shariah-compliant
portfolios that use market capitalization based ratios
in their financial screens outperform those which use
total assets based ratios.
Merdad et al.
(2010)
Analyzed the performance of a sample
of 28 Islamic and conventional mutual
funds managed by HSBC in Saudi
Arabia259
, from January 2003 to
January 2010 employing Jensen,
Sharpe, Treynor measures.
Islamic funds underperform conventional funds
during full period and bullish period, but they over
perform them during bearish and financial crisis
period. Hence, they implied that Islamic mutual
funds do offer hedging opportunity for investors
during economic downturns.
Hassan et al.
(2010)
Compared the performance of 80 funds
in Malaysia (30 Islamic and 50
conventional) from Nov. 2005-
Jan.1996 on a monthly basis. Using
Jensen, Sharpe, Treynor measures and
Carhart (1997) model.
They did not find performance differences between
the two investment groups. Conventional funds were
value-focused while Islamic funds were small cap
oriented.
Rahimie
(2010)
Examined the return and risk
characteristics of Shariah compliant,
non-Shariah compliant, and
unrestricted
portfolios260
in Malaysia from 1989 to
2008 divided to four sub periods,
using annual data. Employing Jensen,
Sharpe, Treynor measures.
Statistical results show that the return of Shariah
compliant portfolio is not significantly different from
conventional portfolio. However, the non-Shariah-
compliant portfolio outperformed the Shariah
compliant ones as they were able to invest in large
capitalized.
Alam and
Rajjaque
(2010)
Analyzed the performance of three
constructed portfolios based on the
constituents of S&P Europe 350 to
represent the market, the market
without the financial companies and
the market of Shariah-compliant
companies from 2007-2009 on weekly
basis using Jensen and Sharpe
measures.
The portfolio of Shariah-compliant equities performs
better than the other two portfolios during the crisis.
Nevertheless, the Shariah-compliant portfolio tends
to slightly underperform when the market is
generally trending upward.
Hayat and
Kraeussl
(2011)
Analyzes the return and risk
characteristics of 145 Islamic funds
across five regions benchmarked
against Islamic and conventional
indices, over the period 2000 to 2009
using CAPM, employing weekly data.
Islamic funds underperform both their Islamic and
conventional benchmarks, which have been worse
during the GFC period. This could be because they
are young funds. Globally invested Islamic funds did
less than locally invested ones.
Hoepner et al.,
(2011)
Studied the performance and
investment style of 265 Islamic funds
from 20 different countries in five
regions from Sep.1990-April 2009 on
monthly basis. They used CAPM and
Islamic funds from the Muslim prominent countries,
especially the six largest Islamic financial markets
(GCC and Malaysia) are competitive to their
respective benchmarks, while those from Western
nations with less Shariah-compliant assets tend to
259 The 28 funds used in Merdad et al. (2010) sample include different types of securities: equity, bond, balanced, and money market. Not all funds invest in Saudi Arabia, as some of them invest globally or in Arab countries. 260 The Shariah-compliant stocks were identified based on the list of Shariah-approved securities provided by the Securities Commission of Malaysia (SC) issued on 28th November 2008. Non-Shariah-compliant portfolio are stocks of companies that fail to comply with SC, and unrestricted or conventional portfolio includes all stocks.

385
Carhart models. significantly underperform. Islamic funds investment
style is slightly towards growth stocks, and small cap
preference in predominantly Muslim countries.
Mansor and
Bhatti (2011)
Evaluating the monthly aggregate raw
returns of the 128 Islamic mutual funds
and 350 conventional mutual funds
from 1996-2009 by only using
statistical t- test.
There is no significant different between the mean
returns of the Islamic fund‘s portfolio and that of the
conventional funds‘ portfolio. Yet, the Islamic
portfolio is riskier than the conventional portfolio
(measured by standard deviation). Both portfolios
are highly correlated with the market.
BinMahfouz
and Hassan
(2012)
Examined the performance of 55
Islamic and 40 conventional funds in
Saudi Arabia but matched based on
their geographical focus, between July
2005-July 2010 on a monthly basis,
using CAPM and Fama-French
models.
Islamic funds performed as well as their
conventional counterpart‘s pairs and indices. The
systematic risk measured by β reveals that Islamic
funds in most cases tend to be less exposed to market
risk than their conventional ones. Islamic funds do
not seem to be influenced to target smaller size
stocks.
Shah et al.
(2012)
Compared the performance of 35
Islamic with 94 conventional funds in
Pakistan, using daily data from the
time of their incentive to November
2011 using Jensen, Sharpe, Treynor,
Modigliani & Modigliani measures.
Islamic funds showed lower average risk rate with
higher average return but both funds provide less
returns than the risk-free rate. Interestingly, they
found that conventional funds are less diversified
due to their higher volatility.
Lobe et al.
(2012)
Explored the performance of 155
Islamic indices aggregated into three
groups (global, regional, domestic)
from data of availability to June 2012,
using CAPM and Carhart models.
Did not find evidence of an out-or underperformance
by Islamic indices. Islamic indices showed but
significant positive alphas for the recent bear market.
Islamic Indices based on different screens (MSCI or
DJIM) did not impact their performance.
Walkshäusl
and Lobe
(2012)
Analyzed the performance of 35
Islamic indices (21 from developed
markets and 14 emerging markets)
from MSCI against their respective
market benchmarks during the period
2002–2011 on monthly basis.
Employing Sharpe ratio, CAPM, and
Carhart models.
The performance of Islamic indices and conventional
benchmarks is similar. However, they found
significant outperformance of Islamic indices in
developed market during the recent GFC. As this is
related to the decline of financial stocks that are
excluded in Sharia-compliant indices. Islamic
indices tend to invest particularly in large-
capitalization stocks in emerging markets.
Ashraf (2013) Examined the performance of 159
investment funds in Saudi Arabian
from 2007 to 2011 by using the CAPM
regression.
Found evidence of better performance of Islamic
funds compared to conventional ones GFC.
Note: this table summarizes the previous studies on the performance of Islamic equity investments. For each
study, the table reports the countries studied, the data and time period and finally the key findings.
*Denotes unpublished conference papers.

386
Appendix 4.1: Interview’s Authorization Letter

387
Appendix 5.1 Interview Questions
Background information:
Participant:
Age: □ 20-30, □ 30-40, □ 40-50, □ over 50
Years of experience:
Professional Qualifications:
Educational background:
A. Shariah portfolios
1. How do you classify and define Halal stocks?
2. Have the number of pure and mixed Shariah-compliant companies
increased over the last ten years in GCC stock markets? If so, what have
been the main drivers to such growth?
3. Is there a growing demand by investors seeking for Halal investments in
GCC stock markets?
4. Why do you think investors invest in Islamic funds, are they profit driven or
religious driven?
5. What factors influence the performance of Islamic funds?
6. How do you allocate your investments across sectors or markets?
7. What type of stocks do you hold in your funds (large, small,..others)?
8. How do Islamic and conventional funds differ in terms of: size, operating
cost, performance?
9. Are there any diversification benefits of Islamic investing in different GCC
markets? Are there any diversification opportunities for western ethical
investors or Islamic investors?
10. What was the impact of the recent financial crisis on the investment funds
(Halal vs. non-Halal)?
B. Shariah Screening Criteria
11. What criteria do you apply (positive and negative) in screening mixed
Shariah-compliant stocks for your Islamic funds?
A. qualitative screens; (tobacco, alcohol, gambling, conventional financial
services) any involvement or core business?

388
B. quantitative screens or financial criteria (interest ratios, leverage, non-
permissible ratios)
12. What criteria do you apply in screening pure Halal stocks for your Islamic
funds?
13. What do you use for screening; annual accounts, information providers,
company managers?
14. In order to include an investee company in an Islamic fund, is it sufficient
to accept its claim that is Islamic, or do you investigate further? For
example KFH (Islamic Bank).
15. Do all your funds follow the same screening criteria?
16. How often are your portfolios screened?
17. Do different Shariah screening threshold levels produce variations in the
Halal asset universe that can be selected from?
18. What are the advantages and disadvantages of using total assets over market
cap. in screening criteria? Which is more sensitive to market movements?
Which is more reliable from a Shariah perspective?
19. How often do SSB auditors review investment funds to ensure full
compliance with Shariah?
20. What happens if a Halal stock becomes non Halal, what do you do?
21. Do SSB or Fund managers have influence over investee companies and
encourage them towards more Shariah compliant?
C. Islamic Portfolios’ Performance and evaluation
22. Do Shariah screening criteria hinder you from achieving an efficient or
profitable portfolio?
23. Can you select stocks from a Shariah screened universe that can outperform
any market indices?
24. What is the minimum number of stocks required to diversify your
portfolios? Are there enough Halal stocks (Islamic or compliant) to
diversify and achieve a profitable and efficient portfolio?
25. Is there a penalty for investing in pure or mixed companies?
26. Does Shariah screening discourage investment in leveraged companies? If yes,
why? Is it because of interest or the ban on trading debt? What if there are
Islamic debts?
27. What is the Shariah rational behind the thresholds: 5%, 25%, 30%, and 33% 50%
in the financial screening?
28. Is there a need to harmonize Shariah screening criteria? Should there be
one unique list for all Islamic funds?
29. If you invest in mixed companies, do you purify your portfolio earnings and
when and how (on cash dividend or capital gains)? and where does this

389
amount go to? Does this earnings purification affect your portfolio
profitability?
30. Is it more efficient to invest in pure stocks, as there will be no need to
purify earnings?
31. Given the fact that the number of pure Islamic investee companies has
increased rapidly in the GCC stock market over the few years, should it still
be permissible to invest in mixed stocks?
32. How do you measure the performance of your portfolios?
33. How do you measure risk?
34. Do you think that using an interest-based benchmark is against Islamic
finance principles?
35. Do you use the risk free interest rate in your performance evaluation, such
as the Sharpe ratio?
36. What could be a Shariah-compliant alternative for the risk free rate? Is a
Mudarabah investment account, as used in Malaysia or gold suitable to
proxy for the risk free rate?
37. Do you think that Islamic funds require different performance measures
from western ones based on unique Shariah foundations?
38. Why do you think there are no Islamic alternative performance measures?
D. Islamic indices/benchmarks
39. Which benchmarks do you use to compare your portfolio performance?
Does it differ depending upon whether it is a pure or mixed portfolio?
40. Are there any pure Islamic Indices in any GCC or other stock markets?
41. Is there a need for a pure Islamic index in the GCC or globally?
42. Can an Islamic index be created of pure Halal investments?

390
Appendix 6.1: The Final Screening Results for Mixed Companies over the 2005-2010
Period Based on AAOIFI 2004 Screening Criteria, Ranked According to their
Market Value in Million (K.D)
Company
Code
Sector MV % of
Total
% of
Mixed
Compliant With AAOIFI 2004 Screening Criteria
2005 2006 2007 2008 2009 2010
ZAIN Services 5377 16.24 33.83 MH MH MH MH MS MH
AGLTY Services 1014 3.06 6.38 MH MH MH MH MH MH
NMTC Services 999 3.02 6.28 MH MH MH MH MH MH
NIND Industrial 949 2.87 5.97 MS MS MS MS MS MS
FOOD Food 624 1.89 3.93 MH MH MH MH MH MS
KCEM Industrial 465 1.41 2.93 MH MH MH MS MS MS
CABLE Industrial 381 1.15 2.39 MH MS MH MS MS MH
MABANEE Real Estate 368 1.11 2.32 MH MS MH MS MS MH
BPCC Industrial 334 1.01 2.10 MH MH MH MS MS MH
NRE Real Estate 281 0.85 1.77 MH MH MS MS MS MS
ALQURAIN Industrial 278 0.84 1.75 MS MS MH MH
ALNAWADI Services 225 0.68 1.41 MH
SULTAN Services 189 0.57 1.19 MH MS MS MS MS MS
SRE Real Estate 145 0.44 0.91 MS MS MS MS MS MS
MAZAYA Real Estate 139 0.42 0.87 MH MH MH MH MH MH
NICBM Industrial 134 0.41 0.85 MH MH MH MS MH MH
TAM Real Estate 129 0.39 0.81 MH MS MS MS MS MS
IKARUS Industrial 121 0.37 0.76 MS MH MH
THEMAR Real Estate 118 0.36 0.74 MH MS MS MS MS MS
CGC Services 117 0.35 0.74 MH MH MH MH MH
KRE Real Estate 115 0.35 0.72 MH MH MH MH MH MH
ABAR Services 114 0.35 0.72 MS MH MH MH MH MH
OULAFUEL Services 114 0.34 0.72 MS MS MH MH MH
KFOUC Industrial 111 0.34 0.70 MH MS MH MH MH MH
URC Real Estate 104 0.31 0.65 MS MS MS MS MS MS
FIRSTDUBAI Real Estate 98 0.30 0.62 MH MH MS MH
KGL Services 98 0.30 0.62 MS MS MS MS MS MH
SOOR Services 93 0.28 0.59 MH MH MH
ACICO Industrial 89 0.27 0.56 MS MS MS MS MS MS
CITYGROUP Services 88 0.27 0.55 MH MH MS MS MH MH
PCEM Industrial 87 0.26 0.55 MH MH MH MH MH MH
MENA* Industrial 87 0.26 0.55 MH MH PH PH PH PH
KPPC Services 81 0.24 0.51 MH MS MS MS MS MS
MARIN Industrial 74 0.22 0.46 MS MS MS MS MS MS
PIPE Industrial 73 0.22 0.46 MS MS MS MH MS MS
INJAZZAT Real Estate 72 0.22 0.46 MH MH MS MS MS MS
CATTL Food 71 0.22 0.45 MH MH MH MS MS MH
NAFAIS Services 70 0.21 0.44 MH MH MH MH MH MH

391
REMAL Real Estate 69 0.21 0.44 MS
ARGAN Real Estate 69 0.21 0.44 MH MH MH MH
ATC Services 67 0.20 0.42 MH MH MS MH
IPG Services 65 0.20 0.41 MH MS MS MS MS MH
LOGISTICS Services 65 0.20 0.41 MH MH
MAYADEEN Services 64 0.19 0.40 MH MS MS MS MH MH
SHIP Industrial 63 0.19 0.40 MH MH MH MH MS MH
SHOP Services 56 0.17 0.35 MS MH MS MS MS MS
JAZEERA Services 56 0.17 0.35 MS MS MS MS
UIC Industrial 56 0.17 0.35 MS MH MS MS MS MS
HITSTELEC Services 53 0.16 0.33 MH MS MS MH MH MH
DANAH Food 49 0.15 0.31 MH MH MH MH MH MH
ARABREC Real Estate 48 0.15 0.30 MS MH MS MS MS MS
AREEC Real Estate 46 0.14 0.29 MS MS MS MS MS MS
ALKOUT Industrial 44 0.13 0.28 MH MH MH MS MH MH
KNA Services 44 0.13 0.27 MH MH MH
SENERGY Services 43 0.13 0.27 MH MH MH MH MH MH
YIACO Services 40 0.12 0.25 MH MH MH MH
KOUTFOOD Food 37 0.11 0.23 MH MS MH MH
KBT Real Estate 36 0.11 0.23 MS MS MS
BIIHC Industrial 32 0.10 0.20 MH
MTCC Services 31 0.09 0.20 MS MH MH MH MH
JEERANH Services 31 0.09 0.20 MH MH MH MH MH
UREC Real Estate 31 0.09 0.20 MH MH MH MH MH MH
MASSALEH Real Estate 31 0.09 0.19 MS MH MS MS MS MS
SAFTEC Services 30 0.09 0.19 MH MH MH MH MH
REFRI Industrial 30 0.09 0.19 MH MH MH MH MH MH
UPAC Services 29 0.09 0.18 MS MH MH MH MH
MRC Industrial 29 0.09 0.18 MH MH MH MS MH MH
HUMANSOFT Services 27 0.08 0.17 MH MH MH MH MH MH
FUTURE Services 27 0.08 0.17 MS MH MH MS
AQAR Real Estate 26 0.08 0.17 MS MS MS MS MS MH
AGHC Services 26 0.08 0.16 MS MS MS MS MS MH
GGMC Industrial 25 0.07 0.16 MS MS MS MH MH MH
KPAK Industrial 25 0.07 0.15 MH MH MH MH MH MH
TAAMEER Real Estate 24 0.07 0.15 MS MS MH MH MS MH
ALMUDON Real Estate 24 0.07 0.15 MH MH
EQUIPMENT Industrial 23 0.07 0.14 MH MH MH MH MH MH
HCC Industrial 22 0.07 0.14 MS MS MS MH MH MH
CLEANING Services 22 0.07 0.14 MH MH MH MH MH MH
ALRAI Services 22 0.06 0.14 MH
SANAM Real Estate 19 0.06 0.12 MH MS MS MH MH MH
NAPESCO Services 18 0.05 0.11 MH MH MS MH MH MH
SAFWAN* Services 18 0.05 0.11 MH MH PH PH PH PH

392
HAYATCOMM Services 17 0.05 0.11 MH MH MH MH
POULT Food 16 0.05 0.10 MH MH MH MH MH MH
GFC Services 16 0.05 0.10 MH MH MH MH MH MH
KCPC Services 16 0.05 0.10 MH MS MH MS MH MH
ASC Services 16 0.05 0.10 MS MS MS MS MS MS
MARAKEZ Real Estate 14 0.04 0.09 MH
PAPER Industrial 13 0.04 0.08 MH MH MH MH MH MH
FUTUREKID Services 13 0.04 0.08 MH MH MH
UFIG Food 13 0.04 0.08 MH MH MS MH MH MH
KSH Services 10 0.03 0.07 MH MH MH MH MS MH
PAPCO Services 10 0.03 0.06 MH MS MH MH MH
GYPSUM Industrial 8 0.03 0.05 MS MS MH MH MH
KBMMC Industrial 8 0.02 0.05 MH MH MH MH MH MH
NSH Services 6 0.02 0.04 MH MH MS MS MS MS
Note: This table shows the final results of financial screening results of all mixed companies based on their
compliance with AAOIFI‘s (2004) criteria across all the sample period, ordered according to their average market
value (MV) as of the average of all 6 years, from large to small, MV in millions K.D. The tables also illustrate the
corresponding sector, percent out of the total market value of all stocks, percent out of the market value of mixed
stocks including mixed Halal (MH) and mixed sin (MS). Empty cells indicate that the company was not listed then.
*Indicates the two companies that converted from mixed stocks to pure Halal (PH) stocks during the sample period
in 2007.

393
Appendix7.1: The Paired Sample T–Statistics for Comparison between Row and Column Portfolios for the Full Sample Period
(2006-2011)
KS
E
CP
PH
Sin
MH
-T.A
(H
)
MH
-M.C
(H
)
All
Ha
lal-
TA
(H)
All
Ha
lal-
M.C
(H)
MS
-TA
(H)
MS
-M.C
(H)
All
Sin
-T.A
(H)
All
Sin
-M.C
(H)
MH
-TA
MH
-MC
All
Ha
lal-
T.A
All
Ha
lal-
M.C
MS
(T
.A)
MS
(M
.C)
All
Sin
(T.A
)
CP -0.82
PH -0.61 0.05
Sin -1.20 -0.47 -0.39
MH-T.A (H) 0.14 0.83 0.63 0.82
MH-M.C (H) 0.02 0.73 0.52 0.73 -0.44
All Halal-TA(H) -0.41 0.36 0.25 0.59 -0.64 -0.47
All Halal-M.C(H) -0.36 0.47 0.35 0.58 -0.79 -0.66 0.00
MS-TA(H) -1.57 -1.14 -0.97 -0.59 -1.23 -1.20 -1.12 -1.19
MS-M.C(H) -1.54 -1.07 -0.95 -0.59 -1.21 -1.14 -1.11 -1.12 -0.14
All Sin-T.A(H) -1.39 -0.55 -0.39 -0.05 -0.84 -0.76 -0.63 -0.60 0.79 0.76
All Sin-M.C(H) -1.58 -0.92 -0.69 -0.55 -1.01 -0.92 -0.88 -0.87 0.58 0.59 -0.47
MH-TA -0.46 0.08 0.03 0.30 -1.38 -1.42 -0.23 -0.36 0.92 0.88 0.35 0.54
MH-MC -0.53 -0.02 -0.04 0.24 -1.53 -1.70 -0.32 -0.51 0.84 0.81 0.28 0.47 -0.45
All Halal-T.A -0.60 0.04 -0.02 0.35 -1.02 -0.93 -0.36 -1.33 1.07 1.00 0.39 0.67 -0.09 0.07
All Halal-M.C -0.64 -0.05 -0.08 0.31 -1.07 -0.99 -0.42 -1.63 1.02 0.96 0.35 0.62 -0.17 -0.01 -0.46
MS (T.A) -1.00 -0.56 -0.54 -0.24 -0.93 -0.86 -0.69 -0.71 0.44 0.69 -0.27 -0.10 -0.51 -0.45 -0.55 -0.51
MS (M.C) -0.80 -0.34 -0.35 -0.06 -0.78 -0.70 -0.51 -0.52 0.76 1.14 -0.05 0.13 -0.34 -0.27 -0.35 -0.31 0.72
All Sin(T.A) -1.41 -0.74 -0.58 -0.38 -0.95 -0.85 -0.77 -0.77 0.63 0.64 -0.25 0.58 -0.45 -0.38 -0.54 -0.50 0.18 -0.05
All Sin(M.C) -1.35 -0.66 -0.53 -0.25 -0.91 -0.82 -0.72 -0.72 0.70 0.70 -0.14 0.96 -0.41 -0.34 -0.49 -0.45 0.22 -0.01 0.63
Note: This table reports the t-statistic test for comparison between the row and column portfolios of the paired sample t-test for the 190 possible combinations during the
full sample period (2006-2011). None of the values are significant at the 10% significance level.

394
Appendix 7.2: The Paired Sample T–Statistics for Comparison between the Row and Column Portfolios for the Full Sample
Period (2006-2007)
KS
E
CP
PH
Sin
MH
-T.A
(H
)
MH
-M.C
(H
)
All
Ha
lal-
TA
(H)
All
Ha
lal-
M.C
(H)
MS
-TA
(H)
MS
-M.C
(H)
All
Sin
-T.A
(H)
All
Sin
-M.C
(H)
MH
-TA
MH
-MC
All
Ha
lal-
T.A
All
Ha
lal-
M.C
MS
(T
.A)
MS
(M
.C)
All
Sin
(T.A
)
CP -1.29
PH -0.89 0.45
Sin -0.85 0.59 0.13
MH-T.A (H) -0.97 -0.43 -0.52 -0.56
MH-M.C (H) -1.00 -0.49 -0.55 -0.57 0.05
All Halal-TA(H) -1.22 -0.41 -0.75 -0.58 0.35 0.34
All Halal-M.C(H) -1.09 -0.27 -0.53 -0.48 0.41 0.57 0.23
MS-TA(H) -0.93 -0.10 -0.33 -0.35 0.30 0.36 0.14 0.07
MS-M.C(H) -0.95 -0.30 -0.46 -0.45 0.12 0.11 -0.09 -0.16 -0.34
All Sin-T.A(H) -1.08 0.61 -0.10 -0.34 0.49 0.55 0.49 0.42 0.36 0.46
All Sin-M.C(H) -1.28 0.18 -0.26 -0.72 0.40 0.42 0.34 0.23 0.16 0.36 -0.46
MH-TA -1.17 -0.66 -0.67 -0.67 0.05 0.02 -0.39 -0.72 -0.52 -0.13 -0.72 -0.53
MH-MC -1.18 -0.67 -0.68 -0.68 0.05 0.01 -0.39 -0.74 -0.54 -0.13 -0.74 -0.54 -0.02
All Halal-T.A -1.22 -0.52 -0.68 -0.58 0.32 0.39 0.02 -0.33 -0.20 0.11 -0.61 -0.36 0.66 0.67
All Halal-M.C -1.23 -0.54 -0.69 -0.59 0.31 0.38 -0.01 -0.36 -0.21 0.10 -0.63 -0.38 0.63 0.66 -0.19
MS (T.A) -0.55 0.01 -0.14 -0.17 0.25 0.26 0.13 0.08 0.06 0.41 -0.11 -0.04 0.28 0.28 0.13 0.13
MS (M.C) -0.48 0.08 -0.07 -0.11 0.30 0.32 0.20 0.15 0.15 0.54 -0.03 0.04 0.34 0.34 0.20 0.20 0.46
All Sin(T.A) -1.05 0.55 -0.01 -0.35 0.50 0.53 0.53 0.41 0.32 0.46 0.18 0.85 0.64 0.65 0.53 0.55 0.14 0.07
All Sin(M.C) -1.01 0.61 0.03 -0.27 0.52 0.55 0.56 0.44 0.35 0.48 0.26 0.99 0.66 0.67 0.56 0.58 0.15 0.08 0.64
Note: This table reports the t-statistic test for comparison between the row and column portfolios of the paired sample t-tests for the 190 possible combinations during
the full sample period (2006-2007). None of the values are significant at the 10% significance level.

395
Appendix 7.3: The Paired Sample T–Statistics for Comparison between the Row and Column Portfolios for the Full Sample
Period (2008-2009)
KS
E
CP
PH
Sin
MH
-T.A
(H
)
MH
-M.C
(H
)
All
Ha
lal-
TA
(H)
All
Ha
lal-
M.C
(H)
MS
-TA
(H)
MS
-M.C
(H)
All
Sin
-T.A
(H)
All
Sin
-M.C
(H)
MH
-TA
MH
-MC
All
Ha
lal-
T.A
All
Ha
lal-
M.C
MS
(T
.A)
MS
(M
.C)
All
Sin
(T.A
)
CP 0.06
PH 0.07 0.05
Sin 0.27 0.28 0.13
MH-T.A (H) 0.38 0.57 0.41 0.30
MH-M.C (H) 0.28 0.42 0.30 0.18 -0.92
All Halal-TA(H) 0.18 0.20 0.11 -0.01 -0.42 -0.26
All Halal-M.C(H) 0.14 0.27 0.15 -0.02 -0.64 -0.45 -0.02
MS-TA(H) -0.47 -0.79 -0.63 -0.75 -0.75 -0.66 -0.65 -0.67
MS-M.C(H) -0.48 -0.75 -0.60 -0.75 -0.73 -0.64 -0.64 -0.63 0.04
All Sin-T.A(H) 0.27 0.22 0.10 -0.09 -0.32 -0.21 -0.03 -0.01 0.89 0.89
All Sin-M.C(H) 0.02 -0.10 -0.09 -0.76 -0.45 -0.34 -0.20 -0.19 0.74 0.74 -0.65
MH-TA 0.07 0.06 0.02 -0.09 -1.29 -1.21 -0.11 -0.19 0.48 0.45 -0.06 0.08
MH-MC 0.03 -0.02 -0.04 -0.13 -1.39 -1.37 -0.17 -0.30 0.42 0.40 -0.11 0.03 -0.57
All Halal-T.A 0.04 -0.02 -0.06 -0.17 -0.77 -0.61 -0.19 -1.20 0.56 0.53 -0.14 0.04 -0.12 0.00
All Halal-M.C 0.01 -0.10 -0.11 -0.20 -0.81 -0.66 -0.23 -1.37 0.53 0.50 -0.17 0.00 -0.19 -0.06 -0.55
MS (T.A) -0.12 -0.27 -0.24 -0.36 -0.55 -0.45 -0.33 -0.33 1.04 0.90 -0.38 -0.20 -0.20 -0.15 -0.19 -0.16
MS (M.C) 0.10 0.07 0.02 -0.10 -0.38 -0.26 -0.10 -0.08 1.35 1.40 -0.08 0.12 0.00 0.05 0.07 0.10 0.71
All Sin(T.A) 0.11 0.06 0.00 -0.64 -0.40 -0.29 -0.13 -0.12 0.77 0.76 -0.33 0.63 -0.02 0.03 0.04 0.08 0.28 -0.03
All Sin(M.C) 0.14 0.10 0.02 -0.51 -0.39 -0.27 -0.11 -0.09 0.80 0.80 -0.27 0.87 0.00 0.05 0.06 0.10 0.31 -0.01 0.28
Note: This table reports the t-statistic test for comparisons between the row and column portfolios of the paired sample t-tests for the 190 possible combinations during
the full sample period (2006-2007). None of the values are significant at the 10% significance level.

396
Appendix 7.4: The Performance of the Four Large-Sized Stocks in the KSE Market
during the Full Sample Period (2006-2011)
Note: this figure plots the return performance for the four large-sized stocks in the KSE market with the market
index and CP as benchmarks, indexd from 100 at 04/01/2006. CP = control portfolio, KFH = Kuwait Finance
House (PH stock), NBK = National Bank of Kuwait (Sin Stock), Zain = telecommunication company, and Agility
= a logistics and warehousing company. Zain and Agility are mixed companies that are classified as MH stocks
most of the time.
Appendix 7.5: The Correlation between the Ranking of the Sharpe, Treynor, and
Jensen Measures with the conventional risk-free Rate
Full Sample Period Bullish Period GFC Period Bearish Period
Sharpe Treynor Sharpe Treynor Sharpe Treynor Sharpe Treynor
Sharpe Sharpe Sharpe Sharpe
Treynor 0.877* Treynor 0.982* Treynor 0.768* Treynor 1.000*
Jensen 0.918* 0.958* Jensen 0.789* 0.818* Jensen 0.714* 0.989* Jensen 0.819* 0.819*
Note: This Table shows the correlation between the rankings of the Sharpe, Treynor, and Jensen measures for the
full sample period, and three sub-periods.
*Indicates significance at the 1% level
0
50
100
150
200
250
4/1/2006 4/1/2007 4/1/2008 4/1/2009 4/1/2010 4/1/2011
KSE Index CP KFH NBK ZAIN AGILITY

397
Appendix 7.6, Panel A: The Risk-Adjusted Performance for the Full Sample Period (2006-2011) using Sharpe Ratio
0.80.70.60.50.4
0.00
-0.25
-0.50
-0.75
Standard Deviation
Av
era
ge
An
nu
aliz
ed
Re
turn
(%
)
KSE Index
All Sin-M.C(Halved)
All Sin-TA(Halved)
MS-M.C(Halved)
MS-T.A(Halved)
All Halal-M.C(Halved)All Halal-T.A(Halved)
MH-M.C(Halved)
MH-T.A(Halved)
All Sin-M.C
All Sin-T.A
MS-M.C
MS-T.A
All halal-M.C
All halal-T.A
MH- M.C
MH- T.A
Sin
PH
CP
Panel A. Risk-Adjusted Performance (Sharpe Ratio)
Rf
CML
Note: This scatter plot shows the Sharpe ratio performance of the 19 portfolios, which is the annualized returns (on the Y-axis) as a function of total risk
measured by standard deviation (on the X-axis). The CML = the Capital market line and the Rf = risk-free rate, which is 0.172 for this period. The Figure covers
the full sample period.

398
Appendix 7.6, Panel B: The Risk-Adjusted Performance for the Full Sample Period (2006-2011) using Treynor Ratio
1.41.31.21.11.00.90.80.7
0.00
-0.25
-0.50
-0.75
Beta
Ave
rage
Ann
ualiz
ed R
etur
n (%
)
KSE Index
All Sin-M.C(Halved)
All Sin-TA(Halved)
MS-M.C(Halved)MS-T.A(Halved)
All Halal-M.C(Halved)All Halal-T.A(Halved)
MH-M.C(Halved)
MH-T.A(Halved)
All Sin-M.C
All Sin-T.A MS-M.C
MS-T.A
All halal-M.CAll halal-T.AMH-M.C
MH-T.A
Sin
PH
CP
Panel B. Risk-Adjusted Performance (Treynor Ratio)
Rf
SML
Note: This scatter plot shows the Treynor ratio performance for the 19 portfolios which is the annualized returns (on the Y-axis) as a function of systematic risk
measured by the beta (on the X-axis). The SML = the security market line and the Rf = risk-free rate, which is 0.172 for this period. The Figure covers the full
sample period.

399
Appendix 7.7, Panel A: The Risk-Adjusted Performance for the Bullish Period (2006-2007) using Sharpe Ratio
0.450.400.350.300.250.20
0.40
0.35
0.30
0.25
0.20
0.15
0.10
Standard Deviation
Ret
urn
KSE Index
All Sin-M.C(Halved)
All Sin-TA(Halved)
MS-M.C(Halved)
MS-T.A(Halved)All Halal-M.C(Halved)
All Halal-T.A(Halved)
MH-M.C(Halved)
MH-T.A(Halved)
All Sin-M.C
All Sin-T.A
MS-M.C
MS-T.A
All halal-M.CAll halal-T.A
MH- M.C
MH- T.A
SinPH
CP
Panel A: Risk-Adjusted Performance (Sharpe Ratio) 2006-2007
Rf
CML
Note: This scatter plot shows the Sharpe ratio performance of the 19 portfolios, which is the annualized returns (on the Y-axis) as a function of total risk
measured by standard deviation (on the X-axis). The CML = the Capital market line and the Rf = the risk-free rate, which is 0.106 for this period. The Figure
covers the bullish period.

400
Appendix 7.7, Panel B: The Risk-Adjusted Performance for the Bullish Period (2006-2007) using Treynor Ratio
1.41.31.21.11.00.90.80.70.6
0.40
0.35
0.30
0.25
0.20
0.15
0.10
Beta
Ret
urn
KSE Index
All Sin-M.C(Halved)
All Sin-TA(Halved)
MS-M.C(Halved)
MS-T.A(Halved)All Halal-M.C(Halved)
All Halal-T.A(Halved)
MH-M.C(Halved)
MH-T.A(Halved)
All Sin-M.C
All Sin-T.AMS-M.C
MS-T.A
All halal-M.CAll halal-T.A
MH- M.C
MH- T.A
Sin PH
CP
Panel B: Risk-Adjusted Performance (Treynor Ratio)
Rf
SML
Note: This scatter plot shows the Treynor ratio performance for the 19 portfolios which is the annualized returns (on the Y-axis) as a function of systematic risk
measured by the beta (on the X-axis). The SML = the security market line and the Rf = the risk-free rate, which is 0.106 for this period. The Figure covers the
bullish period.

401
Appendix 7.8, Panel A: The Risk-Adjusted Performance for the GFC Period (2008-2009) Using Sharpe Ratio
0.70.60.50.40.3
0.0
-0.1
-0.2
-0.3
-0.4
-0.5
-0.6
-0.7
-0.8
Standard Deviation
Ret
un
KSE Index All Sin-M.C(Halved)
All Sin-TA(Halved)
MS-M.C(Halved)MS-T.A(Halved)
All Halal-M.C(Halved)All Halal-T.A(Halved)MH-M.C(Halved)
MH-T.A(Halved)
All Sin-M.CAll Sin-T.A
MS-M.C
MS-T.A
All halal-M.CAll halal-T.A MH- M.C
MH- T.A
SinPH
CP
Panel A: Risk-Adjusted Performance (Sharpe Ratio) 08-09
Rf
CML
Note: This scatter plot shows the Sharpe ratio performance of the 19 portfolios, which is the annualized returns (on the Y-axis) as a function of total risk
measured by the standard deviation (on the X-axis). The CML = the Capital market line and the Rf = the risk-free rate, which is 0.041 for this period. The
Figure covers the GFC period.

402
Appendix 7.8, Panel B: The Risk-Adjusted Performance for the GFC Period (2008-2009) Using Treynor Ratio
1.41.31.21.11.00.90.8
0.0
-0.1
-0.2
-0.3
-0.4
-0.5
-0.6
-0.7
-0.8
Beta
Ret
urn
KSE IndexAll Sin-M.C(Halved)
All Sin-TA(Halved)
MS-M.C(Halved)
MS-T.A(Halved)
All Halal-M.C(Halved)
All Halal-T.A(Halved)MH-M.C(Halved)
MH-T.A(Halved)
All Sin-M.C
All Sin-T.A MS-M.C
MS-T.A
All halal-M.CAll halal-T.AMH- M.C
MH- T.A
Sin
PH
CP
Panel B: Risk-Adjusted Performance (Treynor Ratio)
Rf
SML
Note: This scatter plot shows the Treynor ratio performance for the 19 portfolios which is the annualized returns (on the Y-axis) as a function of systematic risk
measured by the beta (on the X-axis). The SML = the security market line and the Rf = the risk-free rate, which is 0.041 for this period. The Figure covers the
GFC period.

403
Appendix 7.9, Panel A: The Risk-Adjusted Performance for the Bearish Period (2010-2011) using Sharpe Ratio
0.350.300.250.200.150.10
0.2
0.1
0.0
-0.1
-0.2
-0.3
-0.4
Standard Deviation
Ret
urn
KSE Index
All Sin-M.C(Halved)All Sin-TA(Halved)MS-M.C(Halved)
MS-T.A(Halved)
All Halal-M.C(Halved)All Halal-T.A(Halved)
MH-M.C(Halved)
MH-T.A(Halved)
All Sin-M.CAll Sin-T.A
MS-M.C
MS-T.A
All halal-M.CAll halal-T.A
MH- M.C
MH- T.A
Sin
PH
CP
Panel A: Risk-Adjusted Performance (Sharpe Ratio)
Rf
CML
Note: This scatter plot shows the Sharpe ratio performance of the 19 portfolios, which is the annualized returns (on the Y-axis) as a function of total risk
measured by standard deviation (on the X-axis). The CML = the Capital market line and the Rf = the risk-free rate, which is 0.0255 for this period. The Figure
covers the bearish period.

404
Appendix 7.9, Panel B: The Risk-Adjusted Performance for the Bearish Period (2010-2011) using Sharpe Ratio
1.21.11.00.90.80.70.60.50.40.3
0.2
0.1
0.0
-0.1
-0.2
-0.3
-0.4
Beta
Ret
un
KSE Index
All Sin-M.C(Halved)All Sin-TA(Halved)
MS-M.C(Halved)
MS-T.A(Halved)
All Halal-M.C(Halved)
All Halal-T.A(Halved)
MH-M.C(Halved)
MH-T.A(Halved)
All Sin-M.CAll Sin-T.AMS-M.C
MS-T.A
All halal-M.CAll halal-T.A
MH- M.C
MH- T.A
Sin
PH
CP
Panel B: Risk-Adjusted Performance (Treynor Ratio)
Rf
SML
Note: This scatter plot shows the Treynor ratio performance for the 19 portfolios which is the annualized returns (on the Y-axis) as a function of systematic
risk measured by the beta (on the X-axis). The SML = the security market line and the Rf = the risk-free rate, which is 0.0255 for this period. The Figure
covers the bearish period.

405
Appendix 7.10: The Correlation between the rankings of the Sharpe, Treynor, and
Jensen Measures with the Shariah-compliant benchmarks for the Bearish Period
(2010-2011) Bearish Period
Sharpe Treynor
Sharpe
Treynor 1.000*
Jensen 0.819* 0.819*
Note: This Table shows the correlation between the rankings of the Sharpe, Treynor, and Jensen measures for the
bearish period (2010-2011).
*Indicates significance at the 1% level
Appendix 7.11: The Correlation between the rankings of the Sharpe, Treynor, and
Jensen Measures Using the Conventional and the Shariah-Compliant rates for the
Bearish Period (2010-2011) Sharpe- Conventional Treynor – Conventional Jensen-
Conventional
Sharpe- Shariah- Compliant 1.000*
Treynor- Shariah- Compliant 1.000*
Jensen- Shariah-Compliant 0.989*
Note: this Table shows correlation between the rankings of the Sharpe, Treynor, and Jensen measures
using the conventional and shariah-compliant risk-free rates for the Bearish Period (2010-2011).
*Indicates significance at the 1% level
Appendix 7.12: The Performance of the T-bond and the Murabahah rates
Note: This figure plots the performance of the T-bond rate (the conventional risk-free rate), and the Murabahah
rate (the Shariah-compliant risk-free rate) index from 100 points.
100
100.01
100.02
100.03
100.04
100.05
100.06
100.07
Murabaha Rate T-bonds Rate

406
Appendix to 8.1: Summary Information about the Matched Pair Sample
Panel A: Matched Pair (I): PH (A) and Sin (B) Portfolios
No. PH stocks (A)
Sector Sin Stocks (A)
Company name Size ( Avg. MV) Size of total Company name Size ( Avg. MV) Size of total
1 KUWAIT FINANCE HOUSE 3379 0.70 Banking NATIONAL BANK OF KUWAIT 4282 0.74
2 THE INVESTMENT DAR 440 0.09 Investment GLOBAL INVESTMENT HOUSE 463 0.08
3 SECURITIES HOUSE 216 0.04 Investment COMMERCIAL FACS. 233 0.04
4 FIRST INVESTMENT CO 159 0.03 Investment AL-DEERA HOLDING 160 0.03
5 AAYAN LSG.& INV. 144 0.03 Investment AL-SAFAT INVESTMENT 138 0.02
6 INTERNATIONAL FINANCE 128 0.03 Investment KIPCO ASSET MANAGEMENT 133 0.02
7 INTERNATIONAL INV.GROUP 78 0.02 Investment KW.& MID.EAST FINL.INV. CO 74 0.01
8 AL-MADAR FINANCE & INV. 67 0.01 Investment BAYAN INVESTMENT 73 0.01
9 INDUSTRIAL INVESTMENTS 54 0.01 Investment HOUSING FINANCE 51 0.01
10 OSOUL INVESTMENT 38 0.01 Investment AL-QURAIN HOLDING 33 0.01
11 FIRST TAKAFUL INSURANCE 31 0.01 Insurance KUWAIT REINSURANCE 27 0.00
12 KUWAIT REAL ESTATE HLDG. 34 0.01 Real Estate INTERNATIONAL RESORTS 19 0.00
13 AL-SAFWA GROUP CO. 92 0.02 Services KUWAIT NATIONAL CINEMA 87 0.02
Total 4862 1.00 Total 5771 1.00

407
Panel B: Matched Pair (II): PH (B) and MH (A) Portfolios
No. PH Stocks (B) Sector MH Stocks (A)
Company name Size ( Avg. MV) Size of total Company name Size ( Avg. MV) Size of total
1 THE COMMERCIAL REAL EST. 278 0.38 Real Estate NATIONAL REAL ESTATE 281 0.38
2 GRAND REAL ESTATE PRJS. 69 0.10 Real Estate INJAZZAT RLST.DEV. 73 0.10
3 AAYAN REAL ESTATE 50 0.07 Real Estate ARAB REAL ESTATE 48 0.07
4 KUWAIT REAL ESTATE HLDG. 34 0.05 Real Estate UNION REAL ESTATE 31 0.04
5 AREF ENERGY HOLDING CO. 109 0.15 Services BURGAN CO.FOR WELL DRL. 115 0.16
6 AL-SAFWA GROUP CO. 92 0.13 Services CITY GROUP COMPANY 88 0.12
7 CREDIT RATING & CLLN. 53 0.07 Services HITS TELECOM HOLDING 53 0.07
8 GULF PETROLEUM INV. 41 0.06 Services AL SAFAT EN.HOLDING 42 0.06
Total 726 1.00 Total 731 1.00
Panel C: Matched Pair sample (III): Sin (B) and MH (B) Portfolios
No. Sin Stocks (B) Sector MH stocks (B)
Sin Company name Size ( Avg. MV) Size of total Company name Size ( Avg. MV) Size of total
1 INTERNATIONAL RESORTS 19 0.15 Real Estate SANAM REAL ESTATE 19 0.15
2 KUWAIT NATIONAL CINEMA 87 0.68 Services CITY GROUP COMPANY 88 0.71
3 KUWAIT HOTELS 13 0.10 Services KUWAIT SLAUGHTER HOUSE 10 0.08
4 KUWAIT CABLE VISION 8 0.06 Services NATIONAL SLAUGHTER HOUSE 6 0.05
Total 127 1.00 Total 123 1.00

408
Panel D: Matched Pair sample (IV): PH (C) and MH-Halved (A) Portfolios
No. PH Stocks (C) Sector MH (Halved)Stocks (A)
Company name Size (Avg. MV)
( Avr. MV)
Size of total
(%) of total
Company name Size ( Avg. MV) Size of total
1 THE COMMERCIAL REAL EST 278 0.36 Real Estate MABANEE 369 0.43
2 GRAND REAL ESTATE PRJS. 69 0.09 Real Estate INJAZZAT RLST. 73 0.09
3 AAYAN REAL ESTATE 50 0.06 Real Estate ARAB REAL ESTATE 48 0.06
4 TIJARA & REALESTATE INVEST. 46 0.06 Real Estate AJIAL RLST.ENTM. 46 0.05
5 KUWAIT REAL ESTATE HLDG 34 0.04 Real Estate UNION REAL ESTATE 31 0.04
6 AREF ENERGY HOLDING CO 109 0.14 Services KUWAIT & GULF LINK TRAN. 98 0.12
7 AL-SAFWA GROUP CO. 92 0.12 Services CITY GROUP COMPANY 88 0.10
8 CREDIT RATING & CLLN. 53 0.07 Services HITS TELECOM HOLDING 53 0.06
9 GULF PETROLEUM INV 41 0.05 Services AL SAFAT EN.HOLDING 42 0.05
Total 772 1.00 Total 848 1.00
Panel E: Matched Pair sample (V): Sin (C) and MH-Halved (B) Portfolios
No
.
Sin Stocks (C)
Sector
MH (Halved)Stocks (B)
Company name Size (Avg.)
MV)
Size of
total
Company name Size (Avg.)
MV)
( Avr. MV)
Size of
total
1 INTERNATIONAL RESORTS 19 0.05 Real
Estate
SANAM REAL ESTATE 19 0.06
2 IFA HOTELS & RESORTS 278 0.69 Services SULTAN CENTRE FOOD 189 0.58
3 KUWAIT NATIONAL
CINEMA
87 0.21 Services CITY GROUP COMPANY 88 0.27
4 KUWAIT HOTELS 13 0.03 Services KUWAIT PROCESS PLANT CONSTRUCTION &
CNTG.
16 0.05
5 KUWAIT CABLE VISION 8 0.02 Services AUTOMATED SYSTEMS 16 0.05
Total 405 1.00 Total 328 1.00
Note: This Table, panels A- E, provides summary information about each matched pair portfolio in the sample. It reports the name of the companies in
each sector, their average size (Avg.) in millions of Kuwaiti Dinar (KWD) during the whole sample period, and their size as a percentage of the total
portfolio‘s market value. The last row shows the total of size of each portfolio.

409
Appendix 8.2: Summary of Risk, Return, and Risk-Adjusted Returns of Portfolio in the Matched Pairs
Periods/ Pairs Pair (I) Pair (II) Pair (III) Pair (IV) Pair (V) Best
Portfolio
Full
(2006-2011)
Return Sin>KSE>PH KSE>PH>MH Sin>KSE>MH MH(H)>KSE>PH Sin>KSE>MH(H) Sin
Risk PH>Sin>KSE PH>MH>KSE MH>Sin>KSE MH(H)>PH>KSE MH(H)>Sin>KSE Sin*
Sharpe Sin>PH>KSE PH>KSE>MH Sin>MH>KSE MH(H)>PH>KSE Sin>KSE>MH(H) Sin
Treynor Sin>PH>KSE KSE>PH>MH KSE>Sin>MH MH(H)>KSE>PH KSE>Sin>MH(H) Sin*
Jensen Sin>PH>KSE KSE>PH>MH KSE>Sin=MH MH(H)>KSE>PH KSE>Sin>MH(H) Sin*
Bullish
(2006-2007)
Return PH>Sin>KSE PH>KSE>MH KSE>Sin>MH MH(H)>KSE>PH KSE>Sin>MH(H) PH/Sin
Risk PH=Sin>KSE MH>PH>KSE MH>Sin>KSE PH>MH(H)>KSE MH(H)>Sin>KSE Sin*
Sharpe PH>Sin>KSE KSE>PH>MH KSE>Sin>MH MH(H)>KSE>PH KSE>Sin>MH(H) PH/Sin*
Treynor PH>Sin>KSE KSE>PH>MH KSE>Sin>MH MH(H)>KSE>PH KSE>MH(H)>Sin PH/MH(H)*
Jensen PH>Sin>KSE KSE>PH>MH KSE>Sin>MH MH(H)>KSE>PH Sin>KSE>MH(H) PH/Sin
GFC
(2008-2009)
Return KSE>Sin>PH KSE>PH>MH MH>Sin>KSE MH(H)>KSE>PH Sin>MH(H)>KSE Sin
Risk PH>Sin>KSE PH>MH>KSE MH>Sin>KSE MH(H)>PH>KSE MH(H)>Sin>KSE Sin*
Sharpe Sin>PH>KSE PH>MH>KSE MH>Sin>KSE MH(H)>PH>KSE Sin>MH(H)>KSE Sin
Treynor KSE>Sin>PH PH>MH>KSE KSE>Sin>MH MH(H)>PH>KSE Sin>MH(H)>KSE Sin
Jensen KSE>Sin>PH PH>MH>KSE KSE>Sin=MH MH(H)>PH>KSE Sin>MH(H)>KSE Sin
Bearish
(2010-2011)
Return Sin>PH>KSE KSE>MH>PH Sin>MH>KSE MH(H)>KSE>PH Sin>KSE>MH(H) Sin
Risk Sin>PH>KSE PH>MH>KSE Sin>MH>KSE PH>MH(H)>KSE Sin>MH(H)>KSE MH/MH(H)*
Sharpe Sin>PH>KSE MH>KSE>PH Sin>MH>KSE MH(H)>KSE>PH Sin>MH(H)>KSE Sin
Treynor Sin>KSE>PH KSE>MH>PH Sin>KSE>MH MH(H)>KSE>PH KSE>Sin>MH(H) Sin
Jensen Sin>KSE>PH KSE>MH>PH Sin>KSE>MH MH(H)>KSE>PH KSE>Sin>MH(H) Sin
Note: this Table summarizes the risk, return, and risk-adjusted returns of portfolio in the matched pairs benchmarked against KSE, over the full and sub-sample periods.
The last column reports the best portfolios across different matched pairs based on the performance and risk measures. The (*) indicates that KSE is better in that
portfolio.

410
Appendix 8.3: Information of Companies included in the GLM
Sector No. Companies Name Size
Avg.
MV
Size
of
Total
Shariah Classification
AAOIFI Halved
AAOIFI
Banking
(1)
1 KUWAIT FINANCE HOUSE 3379.2 0.099 PH PH
2 AHLI UNITED BANK 625.8 0.018 Sin Sin
3 AL-AHLI BANK OF KUWAIT 898.4 0.026 Sin Sin
4 BURGAN BANK 669.0 0.020 Sin Sin
5 COMMERCIAL BK.OF KUWAIT 1385.7 0.040 Sin Sin
6 GULF BANK OF KUWAIT 1384.3 0.040 Sin Sin
7 KUWAIT INTL.BANK 392.6 0.011 Sin Sin
8 NATIONAL BANK OF KUWAIT 4281.5 0.125 Sin Sin
Investment
(2)
9 AL-QURAIN HOLDING 32.9 0.001 Sin Sin
10 AL-AHLEIA HOLDING 105.1 0.003 Sin Sin
11 AL-DEERA HOLDING 159.8 0.005 Sin Sin
12 AL-MAL INVESTMENT 108.8 0.003 Sin Sin
13 AL-SAFAT INVESTMENT 138.1 0.004 Sin Sin
14 BAYAN INVESTMENT 72.8 0.002 Sin Sin
15 COAST INV.& DEV. 112.0 0.003 Sin Sin
16 COMMERCIAL FACS. 233.0 0.007 Sin Sin
17 GLOBAL INVESTMENT HOUSE 462.7 0.014 Sin Sin
18 GULFINVEST INTERNATIONAL 50.1 0.001 Sin Sin
19 HOUSING FINANCE 50.8 0.001 Sin Sin
20 INTL.FINANCIAL ADVISORS 233.3 0.007 Sin Sin
21 KIPCO ASSET MANAGEMENT 133.2 0.004 Sin Sin
22 KW.& MID.EAST FINL.INV. CO
KSCC
73.6 0.002 Sin Sin
23 KUWAIT FINANCE & INV.CO. 105.6 0.003 Sin Sin
24 KUWAIT FINANCIAL CENTRE 105.6 0.003 Sin Sin
25 KUWAIT INVESTMENT 151.1 0.004 Sin Sin
26 KUWAIT INV.PRJS. 675.1 0.020 Sin Sin
27 NATIONAL INTL.HOLDING 28.7 0.001 Sin Sin
28 NATIONAL INVESTMENTS 445.4 0.013 Sin Sin
29 AAYAN LSG.& INV. 144.5 0.004 PH PH
30 AL-AMAN INVESTMENT CO. 65.9 0.002 PH PH
31 AL-MADAR FINANCE & INV. 67.1 0.002 PH PH
32 ALSALAM GROUP HOLDING 18.1 0.001 PH PH
33 AREF INVESTMENT GROUP 198.3 0.006 PH PH
34 FIRST INVESTMENT CO 159.2 0.005 PH PH
35 GULF INVESTMENT HOUSE 84.8 0.002 PH PH
36 INDUSTRIAL INVESTMENTS 54.0 0.002 PH PH
37 INTERNATIONAL FINANCE 128.2 0.004 PH PH
38 INTERNATIONAL INV.GROUP 78.4 0.002 PH PH
39 INTERNATIONAL LSG.& INV. 86.9 0.003 PH PH
40 OSOUL INVESTMENT 37.8 0.001 PH PH
41 SECURITIES GROUP 80.4 0.002 PH PH
42 SECURITIES HOUSE 215.6 0.006 PH PH
43 SOKOUK HOLDING 66.0 0.002 PH PH
44 THE INTL.INVESTOR 63.6 0.002 PH PH
45 THE INVESTMENT DAR 440.0 0.013 PH PH

411
Insurance
(3)
46 FIRST TAKAFUL INSURANCE 31.4 0.001 PH PH
47 WETHAQ TAKAFUL INSURANCE 16.0 0.000 PH PH
48 AL-AHLEIA INSURANCE 86.3 0.003 Sin Sin
49 GULF INSURANCE 90.5 0.003 Sin Sin
50 KUWAIT INSURANCE 88.3 0.003 Sin Sin
51 KUWAIT REINSURANCE 27.0 0.001 Sin Sin
52 WARBA INSURANCE 47.3 0.001 Sin Sin
Real Estate
(4)
53 AAYAN REAL ESTATE 49.8 0.001 PH PH
54 AL-DAR NAT.REAL ESTATE 41.0 0.001 PH PH
55 AL-ENMA A REAL ESTATE 66.6 0.002 PH PH
56 GRAND REAL ESTATE PRJS. 69.0 0.002 PH PH
57 KUWAIT REAL ESTATE HLDG. 34.5 0.001 PH PH
58 THE COMMERCIAL REAL EST. 277.9 0.008 PH PH
59 TIJARA & REALESTATE 46.4 0.001 PH PH
60 INTERNATIONAL RESORTS 19.3 0.001 Sin Sin
61 AL-MAZAYA HOLDING 138.8 0.004 MH MH(H)
62 AL-THEMAR INTL.HLDG. 117.6 0.003 MH MH(H)
63 ARAB REAL ESTATE 48.3 0.001 MH MH(H)
64 INJAZZAT RLST.DEV. 72.5 0.002 MH MH(H)
65 KUWAIT REAL ESTATE 114.6 0.003 MH MS(H)
66 MABANEE 368.6 0.011 MH MH(H)
67 NATIONAL REAL ESTATE 281.0 0.008 MH MS(H)
68 SANAM REAL ESTATE 18.9 0.001 MH MH(H)
69 UNION REAL ESTATE 31.1 0.001 MH MH(H)
70 AJIAL RLST.ENTM. 46.4 0.001 MS MH(H)
71 AL-MASSALEH RLST. 30.8 0.001 MS MS(H)
72 AQAR REAL ESTATE INVS. 26.3 0.001 MS MS(H)
73 SALHIAH REAL ESTATE 145.2 0.004 MS MS(H)
74 TAMEER REAL EST.INVT. 24.3 0.001 MS MH(H)
75 TAMDEEN REAL ESTATE 129.4 0.004 MS MH(H)
76 UNITED REAL ESTATE 104.1 0.003 MS MS(H)
Industrial
(5)
77 ALKOUT INDL.PROJECTS 44.0 0.001 MH MS(H)
78 BOUBYAN PETROCHEM. 334.6 0.010 MH MS(H)
79 EQUIPMENT HOLDING 22.6 0.001 MH MS(H)
80 GULF CABLE & ELECT.INDS. 380.7 0.011 MH MH(H)
81 GULF GLASS MANUFACTURING 24.8 0.001 MH MS(H)
82 HEAVY ENGR.& SHIP BLDG. 63.3 0.002 MH MH(H)
83 HILAL CEMENT 21.7 0.001 MH MH(H)
84 KUWAIT BLDG.MATS.MNFG. 8.0 0.000 MH MH(H)
85 KUWAIT CEMENT 466.3 0.014 MH MH(H)
86 KUWAIT FOUNDARY 111.7 0.003 MH MH(H)
87 KUWAIT PCKG.MATS.MNFG. 24.5 0.001 MH MH(H)
88 MENA HOLDING 86.8 0.003 MH MH(H)
89 METAL AND RECYCLING 28.7 0.001 MH MH(H)
90 NATIONAL INDUSTRIES 134.4 0.004 MH MH(H)
91 PORTLAND CEMENT 87.4 0.003 MH MS(H)
92 REFRIGERATION INDS. 29.6 0.001 MH MH(H)
93 SHUAIBA INDUSTRIAL 13.5 0.000 MH MS(H)
94 ACICO INDUSTRIES 89.0 0.003 MS MS(H)
95 CONTRACTING & MAR.SVS. 73.8 0.002 MS MH(H)
96 KUWAIT PIPES INDS.& OIL 73.2 0.002 MS MH(H)
97 NATIONAL INDS.GP.HDG. 948.7 0.028 MS MS(H)
98 UNITED INDUSTRIES 56.0 0.002 MS MS(H)
Service 99 AL-SAFWA GROUP CO. 91.9 0.003 PH PH

412
(6)
100 AREF ENERGY HOLDING CO. 108.7 0.003 PH PH
101 CREDIT RATING & CLLN. 52.5 0.002 PH PH
102 GULF PETROLEUM INV. 41.4 0.001 PH PH
103 KUWAIT NATIONAL CINEMA 86.6 0.003 Sin Sin
104 KUWAIT HOTELS 13.3 0.000 Sin Sin
105 KUWAIT CABLE VISION 7.6 0.000 Sin Sin
106 IFA HOTELS & RESORTS 277.8 0.008 Sin Sin
107 AGILITY PUB.WHSG. 1014.5 0.030 MH MH(H)
108 AL SAFAT EN.HOLDING 42.5 0.001 MH MH(H)
109 AUTOMATED SYSTEMS 16.0 0.000 MH MH(H)
110 BURGAN CO.FOR WELL DRL. 114.5 0.003 MH MS(H)
111 CITY GROUP COMPANY 87.9 0.003 MH MH(H)
112 GULF FRANCHISING HLDG. 16.1 0.000 MH MH(H)
113 HITS TELECOM HOLDING 52.8 0.002 MH MH(H)
114 HUMAN SOFT HOLDING 27.0 0.001 MH MS(H)
115 KUWAIT SLAUGHTER HOUSE 10.4 0.000 MH MS(H)
116 ZAIN GROUP 5364.7 0.157 MH MH(H)
117 NAFAIS HOLDING 69.4 0.002 MH MH(H)
118 NATIONAL CLEANING 21.6 0.001 MH MH(H)
119 NATIONAL MOBL.TELECOM. 999.3 0.029 MH MH(H)
120 NATIONAL PTL.SVS. 18.0 0.001 MH MH(H)
121 NATIONAL RANGES CO. 64.2 0.002 MH MH(H)
122 NATIONAL SLAUGHTER HOUSE 5.9 0.000 MH MS(H)
123 PRIVATIZATION HOLDING 80.5 0.002 MH MH(H)
124 SAFWAN TRADING & CNTG. 17.7 0.001 MH MS(H)
125 SULTAN CENTRE FOOD 188.7 0.006 MH MH(H)
126 AL-ARABI GP.HLDG. 26.1 0.001 MS MS(H)
127 INDE.PETROLEUM GROUP 64.8 0.002 MS MS(H)
128 KUWAIT & GULF LINK TRAN. 97.9 0.003 MS MH(H)
129 KUWAIT PROCESS PLANT
CONSTRUCTION & CNTG.
16.0 0.000 MS MH(H)
130 KUWAIT COML.MKTS.CMX. 56.2 0.002 MS MS(H)
Food
(7)
131 LIVESTOCK TRAN.&TRDG. 71.3 0.002 MH MH(H)
132 UNITED FOODSTUFF INDUSTRIES 13.3 0.000 MH MH(H)
133 DANAH ALSAFAT FOODSTUFF 48.8 0.001 MH MS(H)
134 KUWAIT FOOD (AMERCANA) 624.5 0.018 MH MS(H)
135 KUWAIT UTD.POULTRY 16.5 0.000 MH MH(H)
Note: This table provides details about the sample companies used in the GLM model. It reports the name of the
companies in each sector, their average size (Avg.) in millions of Kuwaiti Dinar (KWD) during the whole sample
period, and their size as a percentage of the total sample stocks market value. The last two columns provide
companies‘ Shariah classification using the original and halved AAOIFI thresholds only as of 31/12/2005.

413
Appendix 8.4: Mean Returns of Stock Based on their Sharia Classification in Banking Sector
Note: The figure plots the mean return of stocks in the banking sector based on their Shariah classifications, namely:
PH=pure Halal Stocks, Sin= sin stocks, MH= mixed Halal stocks and MS= mixed sin stocks over the sample years
(2006-2011).

414
Appendix 8.5: Mean Returns of Stock Based on their Sharia Classification in Investment Sector
Note: The figure plots the mean return of stocks in the investment sector based on their Shariah classifications, namely:
PH=pure Halal Stocks, Sin= sin stocks, MH= mixed Halal stocks and MS= mixed sin stocks over the sample years (2006-
2011).

415
Appendix 8.6: Mean Returns of Stock Based on their Sharia Classification in Insurance Sector
Note: The figure plots the mean return of stocks in the insurance sector based on their Shariah classifications, namely:
PH=pure Halal Stocks, Sin= sin stocks, MH= mixed Halal stocks and MS= mixed sin stocks over the sample years
(2006-2011).

416
Appendix 8.7: Mean Returns of Stock Based on their Sharia Classification in Real Estate Sector
Note: The figure plots the mean return of stocks in the real estate sector based on their Shariah classifications, namely:
PH=pure Halal Stocks, Sin= sin stocks, MH= mixed Halal stocks and MS= mixed sin stocks over the sample years
(2006-2011).
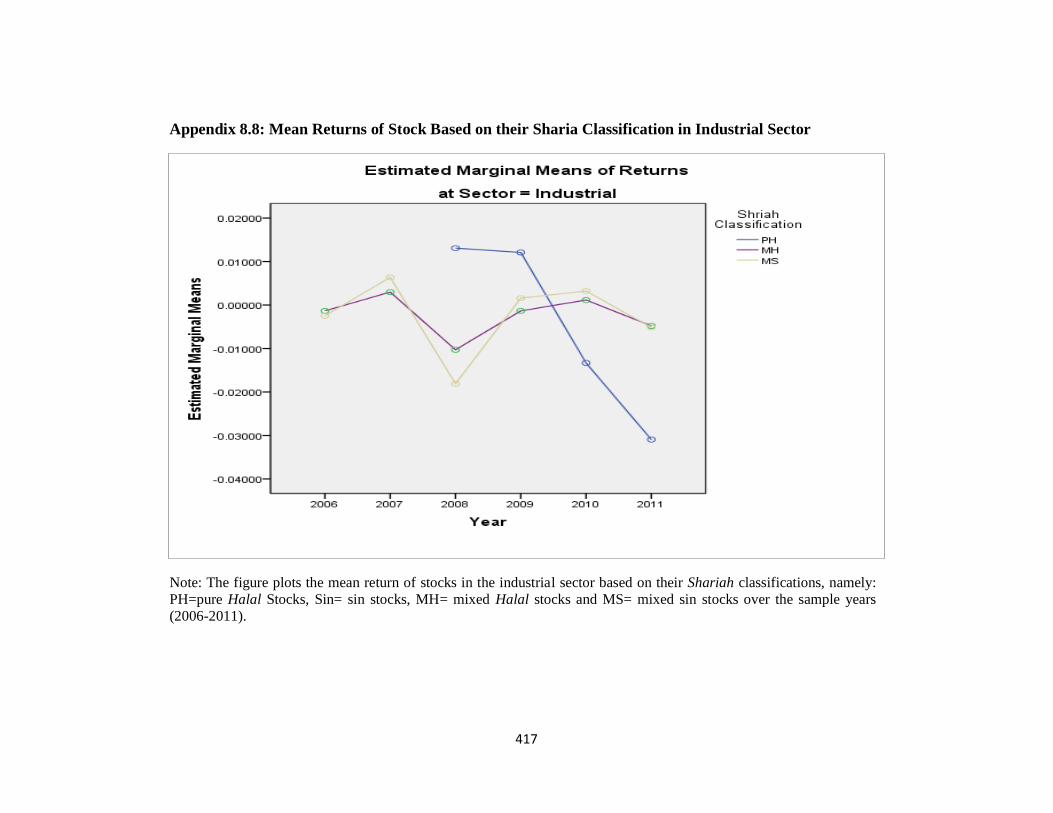
417
Appendix 8.8: Mean Returns of Stock Based on their Sharia Classification in Industrial Sector
Note: The figure plots the mean return of stocks in the industrial sector based on their Shariah classifications, namely:
PH=pure Halal Stocks, Sin= sin stocks, MH= mixed Halal stocks and MS= mixed sin stocks over the sample years
(2006-2011).

418
Appendix 8.9: Mean Returns of Stock Based on their Sharia Classification in Service Sector
Note: The figure plots the mean return of stocks in the service sector based on their Shariah classifications, namely:
PH=pure Halal Stocks, Sin= sin stocks, MH= mixed Halal stocks and MS= mixed sin stocks over the sample years
(2006-2011).

419
Appendix 8.10: Mean Returns of Stock Based on their Sharia Classification in Food Sector
Note: The figure plots the mean return of stocks in the food sector based on their Shariah classifications, namely:
PH=pure Halal Stocks, Sin= sin stocks, MH= mixed Halal stocks and MS= mixed sin stocks over the sample years
(2006-2011).

420
Appendix 8.11: Mean Returns of Stock Based on their Sharia Classification in Real Estate Sector Before and After
Halving AAOIFI’s (2006) Screens
Note: The figures plots the mean return of stocks in the real estate sector based on their Shariah classifications, namely: PH=pure Halal Stocks, Sin= sin stocks,
MH= mixed Halal stocks and MS= mixed sin stocks over the sample years.
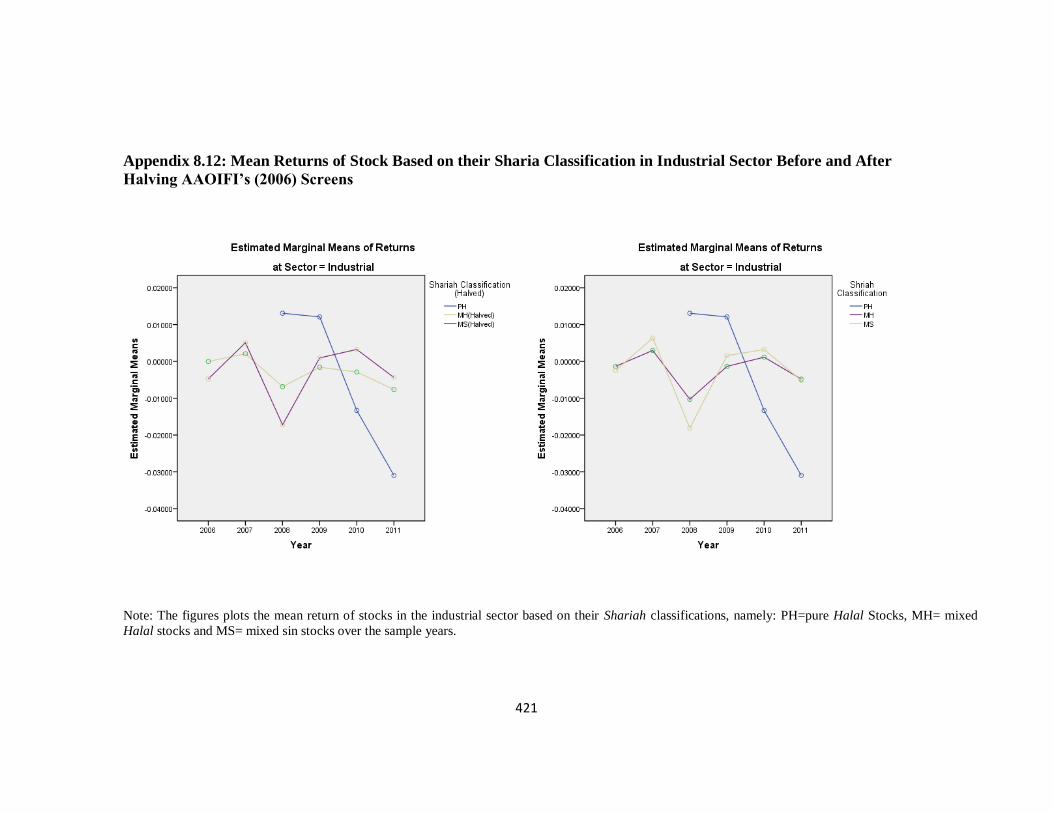
421
Appendix 8.12: Mean Returns of Stock Based on their Sharia Classification in Industrial Sector Before and After
Halving AAOIFI’s (2006) Screens
Note: The figures plots the mean return of stocks in the industrial sector based on their Shariah classifications, namely: PH=pure Halal Stocks, MH= mixed
Halal stocks and MS= mixed sin stocks over the sample years.

422
Appendix 8.13: Mean Returns of Stock Based on their Sharia Classification in Service Sector Before and After Halving
AAOIFI’s (2006) Screens
Note: The figures plots the mean return of stocks in the services sector based on their Shariah classifications, namely: PH=pure Halal Stocks, Sin= sin stocks,
MH= mixed Halal stocks and MS= mixed sin stocks over the sample years.

423
Appendix 8.14: Mean Returns of Stock Based on their Sharia Classification in Food Sector Before and after Halving
AAOIFI’s (2006) Screens
Note: The figures plots the mean return of stocks in the food sector based on their Shariah classifications, namely: MH= mixed Halal stocks and MS= mixed
sin stocks over the sample years.