the halo white dwarf wd 0346 246 revisited halo white dwarf wd 0346+246 revisited p. bergeron d...
TRANSCRIPT

The Halo White Dwarf WD 0346+246 Revisited
P. Bergeron
Departement de Physique, Universite de Montreal, C.P. 6128, Succ. Centre-Ville, Montreal,Quebec, Canada, H3C 3J7.
ABSTRACT
The extreme helium-rich atmospheric composition determined for the halo whitedwarf WD 0346+246 is reexamined. This solution is shown to be improbable from anastrophysical point of view when accretion of hydrogen and metals from the interstellarmedium is taken into account. An alternate solution is proposed where hydrogen andhelium are present in the atmospheric regions in equal amounts. The best fit at Teff =3780 K, log g = 8.34, and N(He)/N(H) = 1.3 is achieved by including in the modelcalculations a bound-free opacity from the Lyman edge associated with the so-calleddissolved atomic levels of the hydrogen atom, or pseudo-continuum opacity.
Subject headings: stars: atmospheres — atomic processes — stars: individual (WD0346+246) — white dwarfs
1. Introduction
The luminosity function of cool white dwarfs determined from proper motion surveys (Liebertet al. 1988; Monet et al. 1992) or colorimetric surveys (Knox et al. 1999) exhibits a sharp peaknear log L/L�= −4.1, followed by a sudden drop towards lower luminosities. The paucity of whitedwarfs at low luminosities (log L/L�∼ −4.4) has been interpreted as a natural consequence of thefinite age of the local Galactic disk. These luminosity functions can be combined with theoreticalcooling sequences to derive an upper limit of 11 Gyr for the age of the local disk (?, see the reviewof )]fon01. Analyses of the coolest objects in these surveys have revealed no evidence for whitedwarfs cooler than Teff ∼ 4000 K (Bergeron et al. 1997; Knox et al. 1999; Bergeron et al. 2001).
A handful of cooler and thus older white dwarfs, most likely belonging to the thick disk or halopopulation, has recently been identified (Hambly et al. 1999; Harris et al. 1999; Ibata et al. 2000;Harris et al. 2001; Oppenheimer et al. 2001b). This small sample has been substantially increased bythe exciting discovery by Oppenheimer et al. (2001a) of 38 cool halo white dwarf candidates in theSuperCOSMOS Sky Survey, although the halo nature of these objects has recently been challengedby Reid et al. (2001). The energy distributions of the coolest white dwarfs in these samples arecharacterized by a strong infrared flux deficiency and blue optical colors which have been interpretedas the result of extremely strong collision-induced absorptions by molecular hydrogen (Hansen 1998;Saumon & Jacobson 1999).

– 2 –
Although the discovery of such faint and bluish white dwarfs confirms the qualitative trendsexpected from model atmosphere calculations, quantitative analyses of these objects have been lessthan successful, in contrast to the detailed analyses of hotter (Teff
>∼ 4000 K) white dwarfs in theGalactic disk (Bergeron et al. 1997, 2001). For instance, the energy distributions of LHS 3250and its almost identical twin SDSS 1337+00 show a maximum peak that is considerably broaderand bluer than predicted from pure hydrogen model atmospheres (Harris et al. 1999, 2001). Thediscrepancy between the models and the observations has been attributed to some missing opacity,most likely originating from collision-induced absorptions by molecular hydrogen due to collisionswith neutral helium, although this interpretation could not be confirmed quantitatively (Harris etal. 1999; Oppenheimer et al. 2001b). The temperature and composition of these two white dwarfsthus remain unknown.
Oppenheimer et al. (2001b) provided a detailed analysis of the halo white dwarf WD 0346+246,as well as a preliminary analysis of F351−50, discovered respectively by Hambly et al. (1997)and Ibata et al. (2000). For WD 0346+246, Oppenheimer et al. obtained an excellent fit to theobserved optical UBV RI and infrared JHK photometry (see their Fig. 8). Their solution suggestsa cool (Teff = 3750 K) and helium-rich atmospheric composition, with an extremely small hydrogenabundance of log N(H)/N(He) = −6.4.
In this paper, we reexamine the solution proposed by Oppenheimer et al. for WD 0346+246,and demonstrate from simple astrophysical considerations that such a low hydrogen abundance isvery unlikely. We first review in § 2 the importance of collision-induced opacities in cool whitedwarfs, and discuss the improvements to our model atmosphere grid in § 3. The low hydrogenabundance solution for WD 0346+246 is then critically reevaluated in § 4. A modified treatment ofthe pseudo-continuum opacity from the Lyman edge is introduced in § 5, while our alternate solutionusing this previously neglected source of opacity is discussed at length in § 6. Our conclusions followin § 7.
2. Collision-Induced Absorptions by H2 in Cool White Dwarfs
The energy distributions of cool white dwarfs are characterized by a strong infrared flux defi-ciency resulting from collision-induced absorptions by molecular hydrogen (H2 CIA). Hansen (1998)has recently demonstrated that the location of objects blueward of the white dwarf cooling sequencein the MV vs (V − I) color-magnitude diagram is actually the result of H2 CIA which extends wellinto the optical regions of the energy distribution of cool (Teff
<∼ 3000 K) and old (τ >∼ 11 Gyr)hydrogen atmosphere white dwarfs (?, see also)]saumon99,blr01. White dwarf stars thus becomeincreasingly redder as they cool down to Teff ∼ 4000 K, after which they evolve into bluer objectsagain. Recent papers reporting the discovery of extremely cool white dwarfs have perpetuated whathas now become a common belief that the CIA opacity is important only in this temperature range,however. It thus seems appropriate here to first review our current knowledge of the importance ofH2 CIA in cool white dwarf atmospheres.
– 3 –
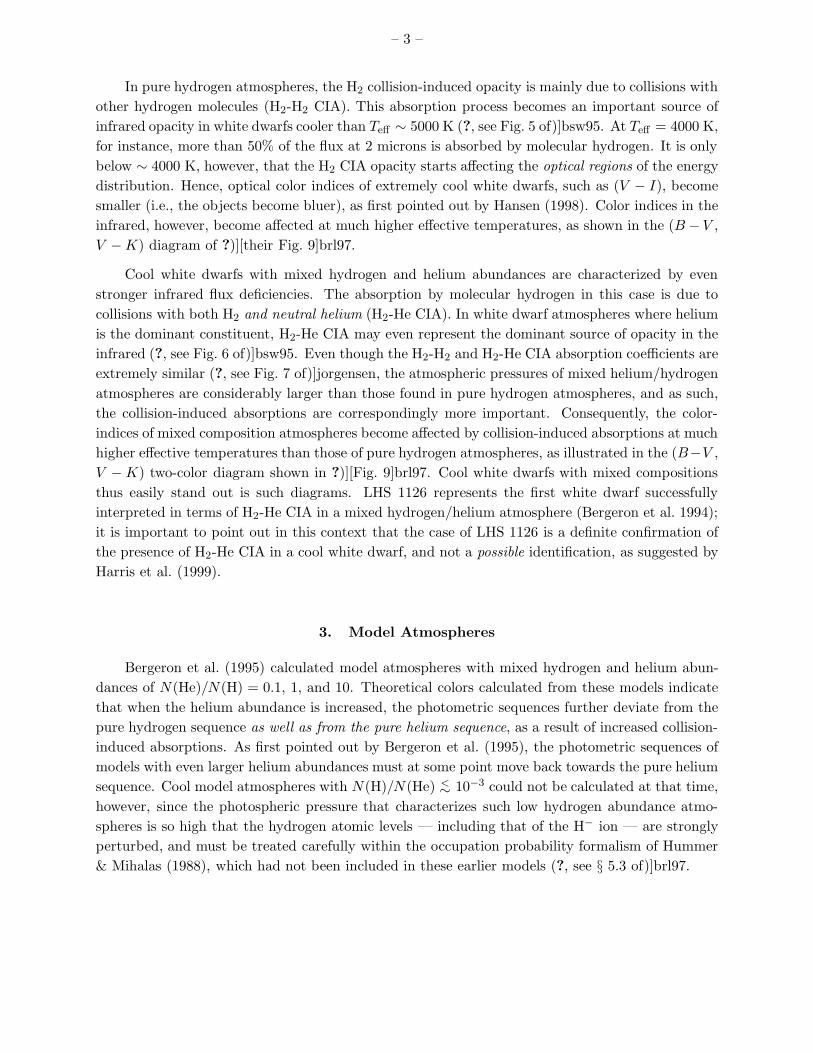
In pure hydrogen atmospheres, the H2 collision-induced opacity is mainly due to collisions withother hydrogen molecules (H2-H2 CIA). This absorption process becomes an important source ofinfrared opacity in white dwarfs cooler than Teff ∼ 5000 K (?, see Fig. 5 of)]bsw95. At Teff = 4000 K,for instance, more than 50% of the flux at 2 microns is absorbed by molecular hydrogen. It is onlybelow ∼ 4000 K, however, that the H2 CIA opacity starts affecting the optical regions of the energydistribution. Hence, optical color indices of extremely cool white dwarfs, such as (V − I), becomesmaller (i.e., the objects become bluer), as first pointed out by Hansen (1998). Color indices in theinfrared, however, become affected at much higher effective temperatures, as shown in the (B − V ,V −K) diagram of ?)][their Fig. 9]brl97.
Cool white dwarfs with mixed hydrogen and helium abundances are characterized by evenstronger infrared flux deficiencies. The absorption by molecular hydrogen in this case is due tocollisions with both H2 and neutral helium (H2-He CIA). In white dwarf atmospheres where heliumis the dominant constituent, H2-He CIA may even represent the dominant source of opacity in theinfrared (?, see Fig. 6 of)]bsw95. Even though the H2-H2 and H2-He CIA absorption coefficients areextremely similar (?, see Fig. 7 of)]jorgensen, the atmospheric pressures of mixed helium/hydrogenatmospheres are considerably larger than those found in pure hydrogen atmospheres, and as such,the collision-induced absorptions are correspondingly more important. Consequently, the color-indices of mixed composition atmospheres become affected by collision-induced absorptions at muchhigher effective temperatures than those of pure hydrogen atmospheres, as illustrated in the (B−V ,V −K) two-color diagram shown in ?)][Fig. 9]brl97. Cool white dwarfs with mixed compositionsthus easily stand out is such diagrams. LHS 1126 represents the first white dwarf successfullyinterpreted in terms of H2-He CIA in a mixed hydrogen/helium atmosphere (Bergeron et al. 1994);it is important to point out in this context that the case of LHS 1126 is a definite confirmation ofthe presence of H2-He CIA in a cool white dwarf, and not a possible identification, as suggested byHarris et al. (1999).
3. Model Atmospheres
Bergeron et al. (1995) calculated model atmospheres with mixed hydrogen and helium abun-dances of N(He)/N(H) = 0.1, 1, and 10. Theoretical colors calculated from these models indicatethat when the helium abundance is increased, the photometric sequences further deviate from thepure hydrogen sequence as well as from the pure helium sequence, as a result of increased collision-induced absorptions. As first pointed out by Bergeron et al. (1995), the photometric sequences ofmodels with even larger helium abundances must at some point move back towards the pure heliumsequence. Cool model atmospheres with N(H)/N(He) <∼ 10−3 could not be calculated at that time,however, since the photospheric pressure that characterizes such low hydrogen abundance atmo-spheres is so high that the hydrogen atomic levels — including that of the H− ion — are stronglyperturbed, and must be treated carefully within the occupation probability formalism of Hummer& Mihalas (1988), which had not been included in these earlier models (?, see § 5.3 of)]brl97.
– 4 –
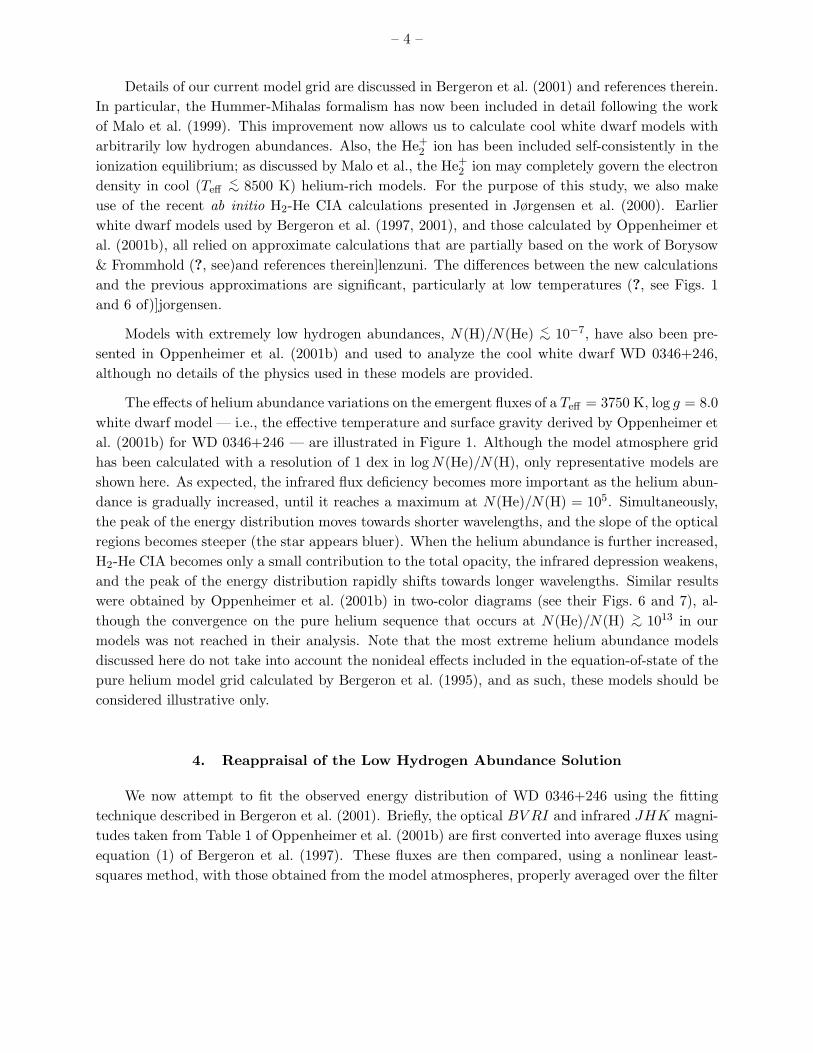
Details of our current model grid are discussed in Bergeron et al. (2001) and references therein.In particular, the Hummer-Mihalas formalism has now been included in detail following the workof Malo et al. (1999). This improvement now allows us to calculate cool white dwarf models witharbitrarily low hydrogen abundances. Also, the He+
2 ion has been included self-consistently in theionization equilibrium; as discussed by Malo et al., the He+
2 ion may completely govern the electrondensity in cool (Teff
<∼ 8500 K) helium-rich models. For the purpose of this study, we also makeuse of the recent ab initio H2-He CIA calculations presented in Jørgensen et al. (2000). Earlierwhite dwarf models used by Bergeron et al. (1997, 2001), and those calculated by Oppenheimer etal. (2001b), all relied on approximate calculations that are partially based on the work of Borysow& Frommhold (?, see)and references therein]lenzuni. The differences between the new calculationsand the previous approximations are significant, particularly at low temperatures (?, see Figs. 1and 6 of)]jorgensen.
Models with extremely low hydrogen abundances, N(H)/N(He) <∼ 10−7, have also been pre-sented in Oppenheimer et al. (2001b) and used to analyze the cool white dwarf WD 0346+246,although no details of the physics used in these models are provided.
The effects of helium abundance variations on the emergent fluxes of a Teff = 3750 K, log g = 8.0white dwarf model — i.e., the effective temperature and surface gravity derived by Oppenheimer etal. (2001b) for WD 0346+246 — are illustrated in Figure 1. Although the model atmosphere gridhas been calculated with a resolution of 1 dex in log N(He)/N(H), only representative models areshown here. As expected, the infrared flux deficiency becomes more important as the helium abun-dance is gradually increased, until it reaches a maximum at N(He)/N(H) = 105. Simultaneously,the peak of the energy distribution moves towards shorter wavelengths, and the slope of the opticalregions becomes steeper (the star appears bluer). When the helium abundance is further increased,H2-He CIA becomes only a small contribution to the total opacity, the infrared depression weakens,and the peak of the energy distribution rapidly shifts towards longer wavelengths. Similar resultswere obtained by Oppenheimer et al. (2001b) in two-color diagrams (see their Figs. 6 and 7), al-though the convergence on the pure helium sequence that occurs at N(He)/N(H) >∼ 1013 in ourmodels was not reached in their analysis. Note that the most extreme helium abundance modelsdiscussed here do not take into account the nonideal effects included in the equation-of-state of thepure helium model grid calculated by Bergeron et al. (1995), and as such, these models should beconsidered illustrative only.
4. Reappraisal of the Low Hydrogen Abundance Solution
We now attempt to fit the observed energy distribution of WD 0346+246 using the fittingtechnique described in Bergeron et al. (2001). Briefly, the optical BV RI and infrared JHK magni-tudes taken from Table 1 of Oppenheimer et al. (2001b) are first converted into average fluxes usingequation (1) of Bergeron et al. (1997). These fluxes are then compared, using a nonlinear least-squares method, with those obtained from the model atmospheres, properly averaged over the filter

– 5 –
bandpasses. Only Teff and the solid angle (R/D)2 are considered free parameters. The distanceD is obtained from the trigonometric parallax measurement, if available, and the stellar radius R
is converted into mass using C/O-core cooling sequences described in Bergeron et al. (2001) withthin or thick hydrogen layers, which are based on the calculations of Fontaine et al. (2001). Forcomparisons, however, we first adopt the temperature and surface gravity from Oppenheimer et al.(2001b).
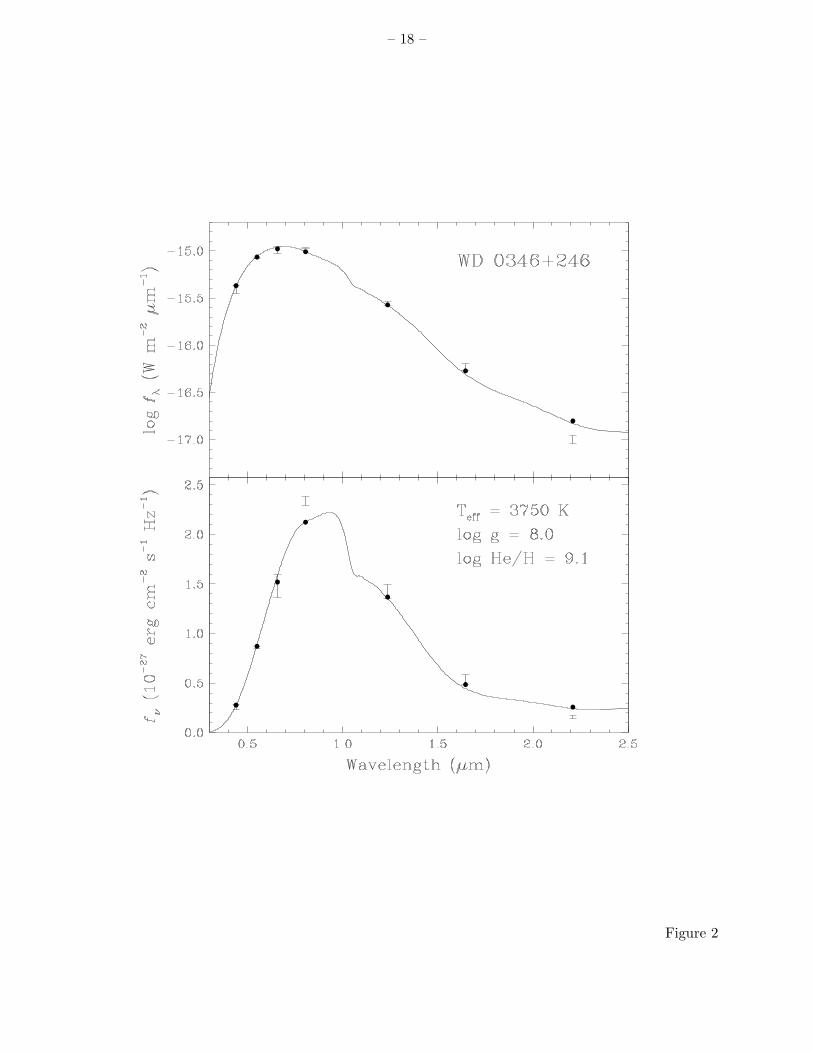
Our best fit is presented in Figure 2. The top panel shows the results in terms of log fλ, whichis the representation used by ?)][see their Fig. 8]opp01b, while the bottom panel is in terms offν , which is the way fits are displayed in Bergeron et al. (1997, 2001). Hence a good fit couldbe achieved with log N(He)/N(H) = 9.1, which is qualitatively similar to the best fit obtained inFigure 8 of Oppenheimer et al. Our fit could even perhaps be improved by allowing Teff and log g
to vary. We also note that the discrepancy observed for the I bandpass in the lower panel of Figure2 is also present in the solution of Oppenheimer et al., but this discrepancy becomes less apparentwhen the solution is presented in terms of log fλ (upper panel). Both solutions differ quantitativelyby nearly 3 orders of magnitude in helium abundance, however. The origin of this difference isunknown, but may stem from the differences in the input physics used in the two model sets. Theimportant aspect of both solutions nevertheless remains that an extremely high helium abundanceis required to fit the observed energy distribution of WD 0346+246.
Such a low hydrogen content of only N(H)/N(He) ∼ 10−9 is quite unrealistic, however. Indeed,the white dwarf cooling age of WD 0346+246 implied by our atmospheric parameter determinationis 9.6 Gyr (using the thick layer evolutionary models described above; thin layer models yield 8.9Gyr), during which the star has been traveling across the Galaxy, accreting material from the inter-stellar medium, including large amounts of hydrogen. Even though elements heavier than heliumwill rapidly sink below the photosphere because of the efficient gravitational chemical separationthat exists in white dwarf atmospheres, hydrogen will tend to float to the surface in the absenceof competing mechanisms. In other words, the hydrogen abundance can only increase with time.Since the superficial layers of cool white dwarfs are strongly convective, however, hydrogen accretedfrom the interstellar medium will be homogeneously mixed with the helium convective zone. BelowTeff ∼ 12, 000 K, the mass of this helium convection zone is almost constant at MHe−conv ∼ 10−6 M∗(Tassoul et al. 1990). The hydrogen abundance determined here for WD 0346+246 thus impliesa total mass of hydrogen accreted of 1.2 × 10⁻¹⁶ M�, and an accretion rate from the interstel-lar medium of 1.3 × 10⁻²⁶ M� yr−1 (or 6.3 × 10⁻²⁴ M� yr−1 if we use the abundance value ofOppenheimer et al.). Such low accretion rates are of course completely unrealistic and would re-quire extremely efficient screening mechanisms. For instance, the theoretical estimates of Wesemael(1979) suggest time-averaged accretion rates of ∼ 10−17 M� yr−1. Similarly, the two-phase accre-tion model invoked by Dupuis et al. (1993) to account for the presence of metals in cool helium-richwhite dwarfs assumes that accretion is most of the time small, typically 10−20 M� yr−1, but mayproceed at a much higher rate of 5 × 10⁻¹⁵ M� yr−1 during passages through dense interstellarclouds.
– 6 –
The extreme purity of the atmosphere suggested for WD 0346+246 also represents a problemif the presence of metals is considered. Even though elements heavier than helium will diffusedownward at the bottom of the helium convection zone with time scales much shorter than theevolutionary time scales (?, see)and references therein]dupuis92, magnesium, calcium, and ironlines are nevertheless often observed in the spectra of cool, helium-rich white dwarfs — the so-called DZ stars. The only viable explanation for the presence of these metals is provided by theaccretion-diffusion model in which a balance is achieved between the gravitational settling of metalsat the base of the helium convection zone and the accretion of these elements at the surface of thestar, most of the time through the low-density interstellar medium, but occasionally through denser“clouds” (?, see, e.g.,)]dupuis93.
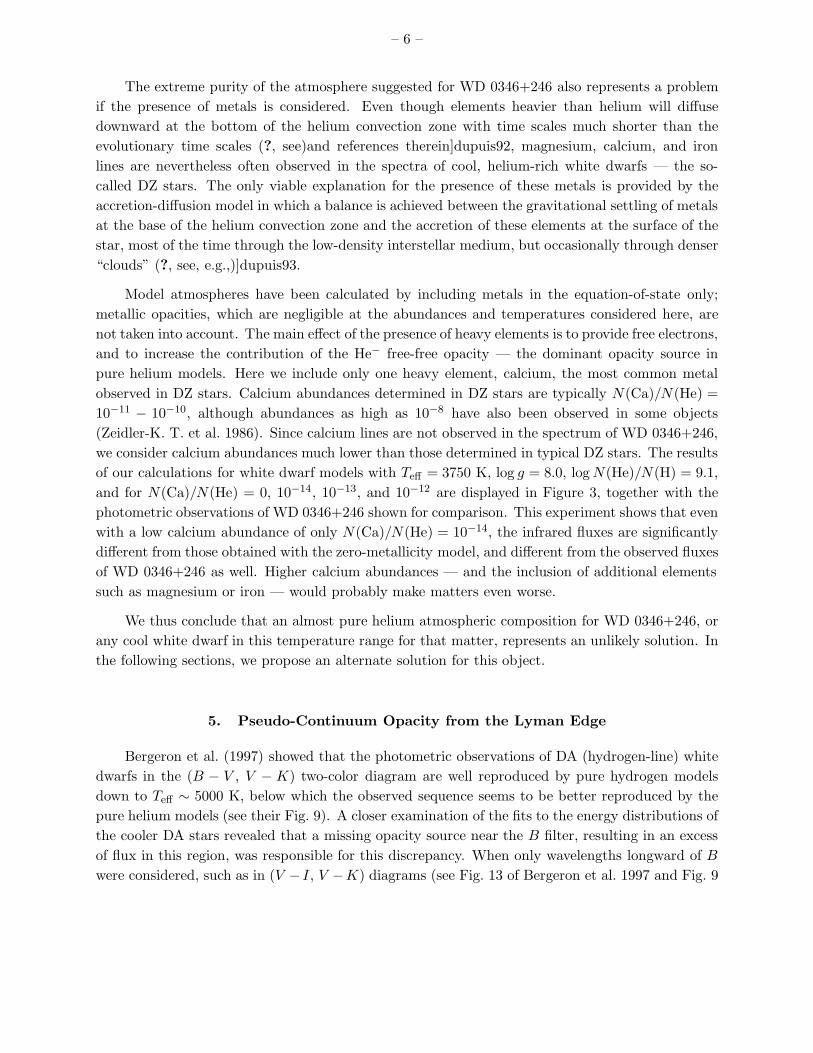
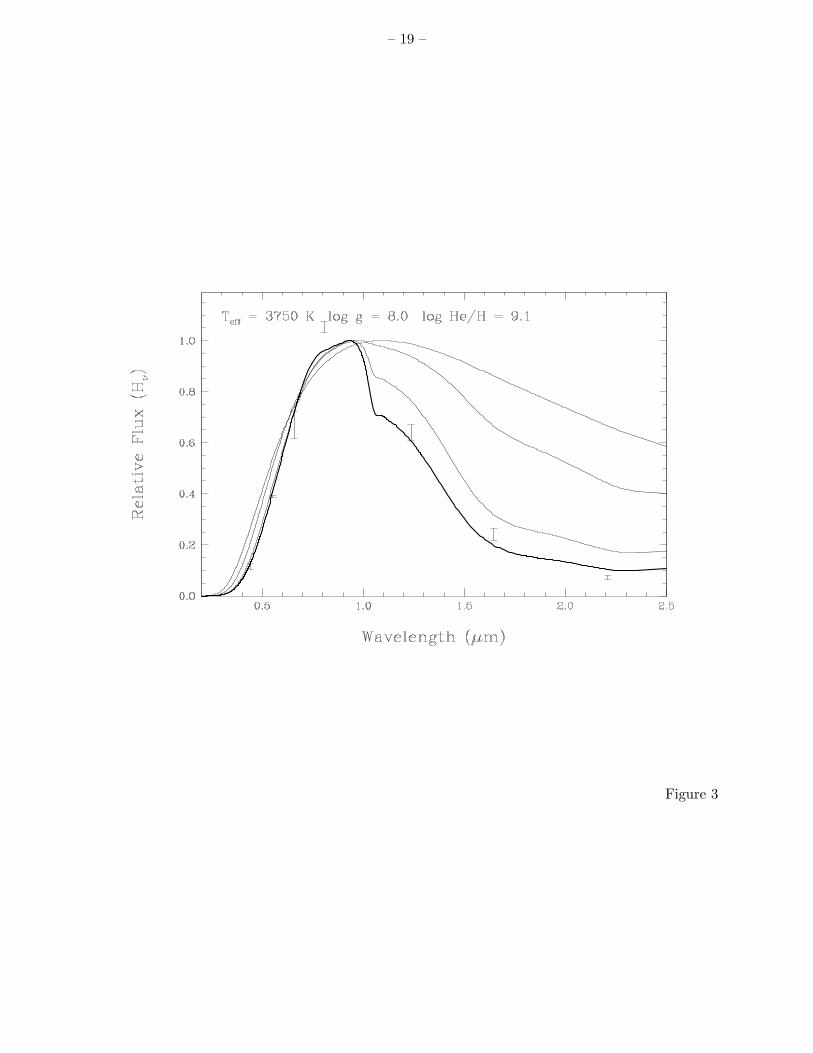
Model atmospheres have been calculated by including metals in the equation-of-state only;metallic opacities, which are negligible at the abundances and temperatures considered here, arenot taken into account. The main effect of the presence of heavy elements is to provide free electrons,and to increase the contribution of the He− free-free opacity — the dominant opacity source inpure helium models. Here we include only one heavy element, calcium, the most common metalobserved in DZ stars. Calcium abundances determined in DZ stars are typically N(Ca)/N(He) =10−11 − 10−10, although abundances as high as 10−8 have also been observed in some objects(Zeidler-K. T. et al. 1986). Since calcium lines are not observed in the spectrum of WD 0346+246,we consider calcium abundances much lower than those determined in typical DZ stars. The resultsof our calculations for white dwarf models with Teff = 3750 K, log g = 8.0, log N(He)/N(H) = 9.1,and for N(Ca)/N(He) = 0, 10−14, 10−13, and 10−12 are displayed in Figure 3, together with thephotometric observations of WD 0346+246 shown for comparison. This experiment shows that evenwith a low calcium abundance of only N(Ca)/N(He) = 10−14, the infrared fluxes are significantlydifferent from those obtained with the zero-metallicity model, and different from the observed fluxesof WD 0346+246 as well. Higher calcium abundances — and the inclusion of additional elementssuch as magnesium or iron — would probably make matters even worse.
We thus conclude that an almost pure helium atmospheric composition for WD 0346+246, orany cool white dwarf in this temperature range for that matter, represents an unlikely solution. Inthe following sections, we propose an alternate solution for this object.
5. Pseudo-Continuum Opacity from the Lyman Edge
Bergeron et al. (1997) showed that the photometric observations of DA (hydrogen-line) whitedwarfs in the (B − V , V − K) two-color diagram are well reproduced by pure hydrogen modelsdown to Teff ∼ 5000 K, below which the observed sequence seems to be better reproduced by thepure helium models (see their Fig. 9). A closer examination of the fits to the energy distributions ofthe cooler DA stars revealed that a missing opacity source near the B filter, resulting in an excessof flux in this region, was responsible for this discrepancy. When only wavelengths longward of B
were considered, such as in (V − I, V −K) diagrams (see Fig. 13 of Bergeron et al. 1997 and Fig. 9

– 7 –
of Bergeron et al. 2001), the pure hydrogen models followed perfectly the observed DA sequence.For this reason, the B magnitude was excluded in the fits of the hydrogen-rich stars cooler thanTeff ∼ 5500 K.
Bergeron et al. (1997) proposed that this missing opacity source in the pure hydrogen modelscould be due to the bound-free opacity associated with the so-called dissolved atomic levels of thehydrogen atom, or pseudo-continuum opacity. When an electron makes a bound-bound transitionfrom a lower level to an upper level, there is a finite probability that this upper level will besufficiently perturbed by surrounding particles (a dissolved level) such that the electron is no longerbound to the nucleus, leading instead to a bound-free transition. This pseudo-continuum opacitycan be treated within the Hummer-Mihalas formalism following the work of Hummer & Mihalas(1988) and Dappen et al. (1987), which we briefly describe for completeness.
The contribution of level i to the total monochromatic opacity is given in LTE by
χi(ν) = Ni
[∑j>i
wj
wiαij(ν) + Di(ν)αiκ(ν)
](1− e−hν/kT ), (1)
where the first term corresponds to the bound-bound opacities weighted by the occupation proba-bility of each level of the transition. The occupation probability wi of the atomic level i correspondsto the probability that an electron in this particular state is bound to the atom relative to a similaratomic state in a non-interacting environment. Correspondingly, (1−wi) is the probability that thisstate belongs to the continuum due to interactions with neighboring charged and neutral particles— the so-called dissolved levels.
The second term in equation (1) corresponds to the pseudo-continuum opacity, where αiκ(ν)is the photoionization cross-section from level i, and Di(ν) is the dissolved fraction of levels givenby the expression
Di(ν) =wi − wn∗
wi, (2)
where n∗ corresponds to the effective quantum number of the atomic level reached after the ab-sorption of a photon of energy hν, i.e.,
n∗ =(
1n2
i
− hν
χIH
)− 12
. (3)
The atomic level n∗ is of course fictitious unless n∗ has an integer value. An occupation probabilitywn∗ is assigned to that fictitious level by interpolating the value from the occupation probability ofthe real atomic levels. When n∗ is negative (ν > χI
H/hn2i ), we define wn∗ ≡ 0 (i.e., Di(ν) = 1), and
the transition becomes a true bound-free transition. For positive values of n∗, Di(ν) decreases with

– 8 –
increasing wavelength, and the product of this term with the photoionization cross-section αiκ(ν) —which is simply extrapolated below the frequency threshold — yields a pseudo-continuum opacitythat gradually fades away from the unperturbed bound-free threshold. The pseudo-continuumopacity for the Balmer jump in typical white dwarf atmosphere conditions is illustrated in Figures9 and 10 of Bergeron et al. (1991).
A problem arises if one considers the pseudo-continuum opacity originating from the Lymanedge. For instance, near 4000 A, the dissolved fraction at the photosphere of a cool (Teff ∼ 4500 K),hydrogen-rich white dwarf is typically 10−4. That is, electrons in the ground level of hydrogenmaking a corresponding transition to the fictitious level n∗ ∼ 1.14 (setting ni = 1 and λ = 4000 Ain equation [3]) have only a small 0.01% probability of going into the continuum, and to contributeto the bound-free opacity. However, since the pseudo-continuum opacity also depends on thepopulation of hydrogen in the ground state, which is typically 1020cm−3 under such conditions, itremains the dominant opacity source, even in the infrared!
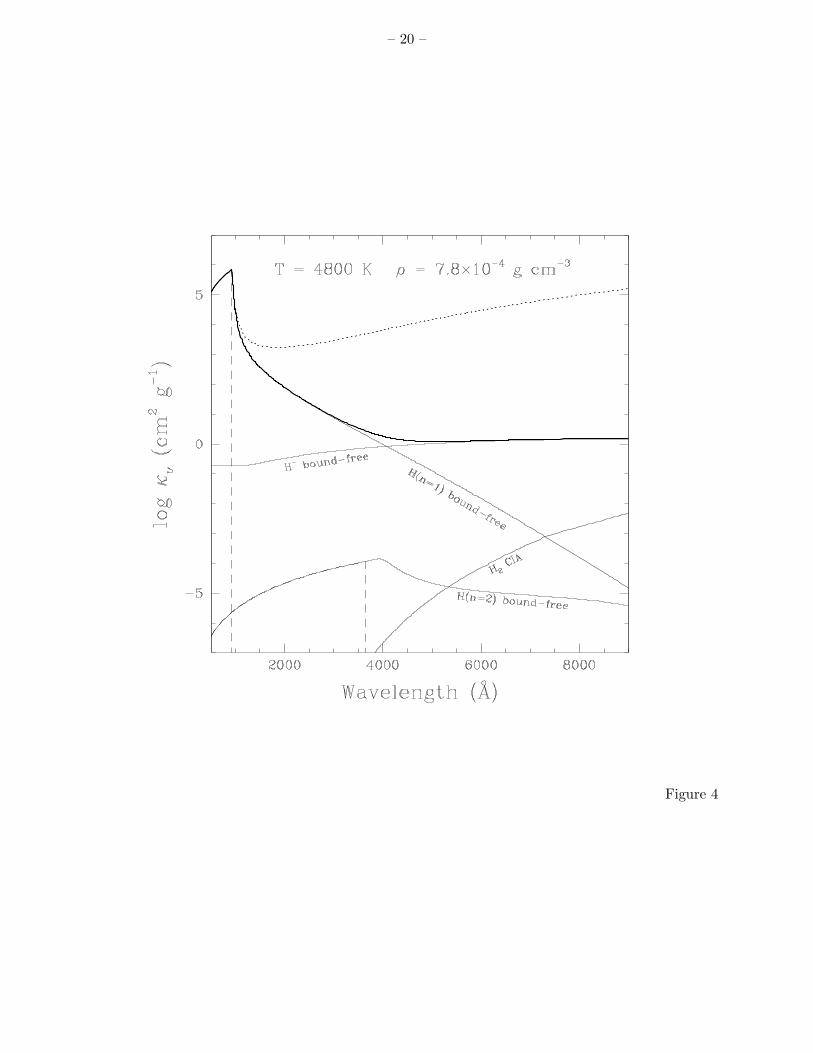
The problem is illustrated more quantitatively in Figure 4 where the contributions of the mostrelevant sources of opacity in a cool hydrogen-rich atmosphere are shown. The pseudo-continuumopacity from the n = 2 level shows the expected behavior: the bound-free cross section with anunperturbed threshold at 3644 A is extended towards longer wavelength, and is gradually attenuatedby the dissolved fraction factor (?, see also Fig. 2 of)]dappen. The behavior shown by the pseudo-continuum opacity from the n = 1 level (dotted line) is obviously unphysical, however. The resultswould imply that this continuum opacity dominate all other sources of opacity at all wavelengths!This is a familiar problem for those who have attempted to implement the occupation probabilityformalism of Hummer-Mihalas in white dwarfs cooler than Teff ∼ 17, 000 K, where most of thehydrogen lies in the ground state. To overcome this problem, an arbitrary cutoff is usually applied,or the pseudo-continuum opacity from the Lyman edge is omitted altogether.
The exact reason why the Hummer-Mihalas formalism breaks down in this particular situationis not known, and a detailed analysis of this problem is outside the scope of this paper. Wesimply mention, as discussed in Bergeron et al. (1997), that far away from the Lyman jump, thecalculation of the fraction of dissolved levels is probably unreliable. Indeed, Di(ν) is proportionalto the difference between the occupation probability of the ground level and that of the upper(fictitious) dissolved level which, away from the edge, is located slightly above the ground level.As such, D(ν) only approaches zero and its exact value is meaningless, and so is the value of thecorresponding pseudo-continuum opacity. The fact nevertheless remains that some form of pseudo-continuum opacity from the Lyman edge must exist in nature. This led Bergeron et al. (1997) tosuggest that perhaps this neglected opacity could be responsible for the observed discrepancy atthe blue end of the energy distribution of cool hydrogen-rich white dwarfs. After all, the ratio ofthe threshold opacity for the n = 1 level is more than 9 orders of magnitude larger than that of then = 2 level, and it is not too farfetched to expect some of this pseudo-continuum opacity to affectthe optical regions of the energy distribution.

– 9 –
Despite the lack of an accurate theory for calculating the fraction of dissolved levels far awayfrom the Lyman edge, we may still make a suitable approximation by including a “damping”function into the pseudo-continuum opacity. Here we apply a damping function of the form
Di(ν)′ = Di(ν) exp(− ∆λ
∆λD
)a
, (4)
where a and ∆λD are arbitrary damping factors that remain to be determined. The results of thecalculations with a = 1 and ∆λD = 350 A are shown in Figure 4. This particular choice remains ofcourse completely arbitrary but includes the two desired features, i.e. sufficient damping so that theoverall energy distribution is still dominated by H− in the optical and by H2 CIA in the infrared(not seen in Fig. 4), and not too much damping so that the pseudo-continuum opacity contributesto the total opacity near the blue end of the optical region.
6. Alternate Solution for WD 0346+246
Energy distributions calculated with this modified pseudo-continuum opacity are shown inFigure 5 for two cool white dwarfs taken from the analysis of ?)][note that for this comparison,the opacity has been included only in the calculation of the emergent fluxes but not in the modelstructure itself]blr01. LP 380−5 (WD 1345+238) is a DA white dwarf cooler than the temperaturethreshold at Teff = 5500 K below which the observed B magnitude of hydrogen-rich white dwarfsin the studies of Bergeron et al. (1997, 2001) is not well reproduced by the pure hydrogen models.The mismatch at B for this object is also illustrated in Figure 24 of Bergeron et al. (1997). LHS2522 (WD 1208+576) is another DA star with a temperature slightly above this 5500 K threshold,and for which the fit at B is excellent. For LHS 2522, the inclusion of the pseudo-continuumopacity from the Lyman edge has reduced the theoretical fluxes for wavelengths shorter than theB bandpass, and the fit to the energy distribution is thus not affected by this additional opacity.For LP 380−5, however, the flux is considerably reduced near the B bandpass, and models thatinclude the pseudo-continuum opacity reproduce the observed B magnitude quite well, as opposedto the model fluxes where this opacity is neglected.
Models were also calculated for mixed hydrogen and helium compositions in the temperaturerange of WD 0346+246. The pseudo-continuum opacity is more important in this object than in theother two DA white dwarfs discussed above, not only because of its lower effective temperature, butmainly because of the increased atmospheric pressure resulting from the presence of helium. Forthis particular experiment, it was thus necessary to include self-consistently the pseudo-continuumopacity in the calculations of the model structures. In contrast with our previous fit, we nowconsider Teff , log g, and N(He)/N(H) free parameters.
Our best fit for WD 0346+246 is shown in the top panel of Figure 5. Also shown for comparisonis the optical and infrared spectra from ?)][note that the fluxes from the optical spectrum have

– 10 –
been multiplied here by a factor of 1.08 in order to match with the observed photometry]opp01b.The results indicate that a good fit to the energy distribution of WD 0346+246 can be achievedwith a temperature of Teff = 3830 K, close to the previous solution at Teff = 3750 K, but witha helium-to-hydrogen abundance ratio close to unity. In particular, the fit at B and V is greatlyimproved by the inclusion of the pseudo-continuum opacity, with respect to the fit obtained whenthis opacity is neglected. Our fit can also be contrasted with that shown in Figure 15 of Fontaineet al. (2001) for the same object, based on slightly different photometric observations, and wherethe B and V magnitudes were simply omitted from the fit because of the suspected missing opacityin this region.
A more careful examination of the results shown in Figure 5 also reveals that even though theinclusion of a pseudo-continuum opacity from the Lyman edge provides on overall good fit to theobserved energy distribution of WD 0346+246, our approximate treatment could still be improved.If we take the observed spectrum at face value, the pseudo-continuum opacity seems to extend atmuch longer wavelengths, and to have the wrong frequency dependency. As an illustrative example,by using different factors a = 0.52 and ∆λD = 36 A in equation (4), and by repeating the completefitting procedure described above, we obtain the fit shown in Figure 6. The atmospheric parametersobtained with this modified damping function — Teff = 3780 K, log g = 8.34, N(He)/N(H) = 1.3 —are comparable to those given in Figure 5, but the resulting fit is significantly better. In particular,the slope and extent of the pseudo-continuum opacity are reproduced much better. The pseudo-contiuum opacity profile at the photosphere of the corresponding model atmosphere is shown inthe bottom panel of Figure 6 together with the other most relevant opacity sources.
We also note that the surface gravity inferred from our best fit has been constrained from themeasured trigonometric parallax π = 36 ± 5 mas (Hambly et al. 1999), which implies a radius ofR = 0.0100 R� and a mass of M = 0.80 M�. In contrast, the former solution shown in Figure2 as well as that of Oppenheimer et al. (2001b) both assumed log g = 8.0, which yields a radiusof R = 0.01256 R� and a distance of D = 35.5 pc, inconsistent with the measured distance ofD = 27.8 pc. Using the evolutionary models discussed in Bergeron et al. (2001) with C/O cores,helium envelopes of q(He) = 10−2, and “thick” outermost hydrogen layers of q(H) = 10−4, wederive an age for WD 0346+246 of τ = 11.0 Gyr; “thin” layer models with of q(H) = 10−10 yieldτ = 8.7 Gyr.
As discussed in § 4, the extreme helium-rich composition proposed by Oppenheimer et al.(2001b) for WD 0346+246 implies accretion rates from the interstellar medium that are unrealis-tically small. Adopting instead N(He)/N(H) = 1 as our best estimate, we derive a total hydrogenmass of 2 × 10⁻⁷ M�. If WD 0346+246 has evolved from an almost pure helium atmosphere —i.e. a DB star, the total amount of hydrogen accreted corresponds to a time-averaged accretionrate of ∼ 2× 10⁻¹⁷ M� yr−1, in good agreement with the theoretical estimates of Wesemael (1979)and Dupuis et al. (1993). Alternatively, WD 0346+246 may have evolved from a thin hydrogenlayer DA star that has been convectively mixed below Teff ∼ 12, 000 K. According to Figure 40 ofBergeron et al. (1997), the minimum helium-to-hydrogen abundance ratio that can be achieved for

– 11 –
a 0.8 M� white dwarf is when the hydrogen atmosphere with a mass of M(H) ∼ 2.5 × 10⁻⁸ M�is convectively mixed at Teff ∼ 5000 K. This yields an abundance of N(He)/N(H) ∼ 8. Hence, toarrive at an abundance of N(He)/N(H) = 1 by the time the star has cooled down to Teff = 3800 K,it must accrete an extra ∼ 1.8 × 10⁻⁷ M� of hydrogen over a period of ∼ 1.6 Gyr (assuming herethin hydrogen models), which corresponds to an accretion rate of ∼ 10−17 M� yr−1. Hence it isnot possible from these arguments alone to determine whether WD 0346+246 has evolved from athin hydrogen-layer DA white dwarf, or from a hot DB star.
We also discussed the fact that the extreme helium-rich composition solution for WD 0346+246was unlikely because of the effects the presence of even small amounts of elements heavier thanhelium have on the predicted fluxes (see Fig. 3). Our solutions presented in Figures 5 or 6are not sensitive to the presence of these additional elements since hydrogen remains the mostimportant contributor of free electrons. Additional calculations not shown here indicate that theemergent fluxes are not affected even when the calcium abundance is set to a value as high asN(Ca)/N(He) = 10−8. Our solution is thus robust against the presence of such additional elements.
7. Conclusions
In this paper we have reexamined the atmospheric parameters of the halo white dwarf WD0346+246. A solution at Teff ∼ 3750 K with an extremely low hydrogen abundance has beenfound, N(H)/N(He) = 10−9, in agreement with the conclusions of Oppenheimer et al. (2001b).We have showed, however, that such a low hydrogen content is very unlikely due to accretionfrom the interstellar medium over a cooling age of roughly 10 Gyr. Furthermore, this solution wasshown to be extremely volatile when even minute amounts of heavy elements were included in theatmosphere. We have proposed instead a solution where hydrogen and helium are present in theatmosphere of WD 0346+246 in nearly equal amounts. A good fit has been achieved by including apseudo-continuum opacity originating from the dissolved levels of hydrogen. This opacity has beenparameterized with an ad hoc damping function, however, and it is clear that a better physicaldescription must be sought before more quantitative results can be achieved.
The presence of this missing opacity source had already been foreseen in the study of coolhydrogen-rich white dwarfs by Bergeron et al. (1997, 2001) who refrained from interpreting two-color diagrams where one of the filters may be affected by this missing opacity, no matter whatits origin might be — (B − V , V − K) diagrams for instance. These studies have also shownthat for the coolest (Teff ∼ 4000 K) hydrogen-rich stars, even the V filter may be affected. Theresults presented in this paper also support this conclusion (see Fig. 5). It thus appears extremelydangerous to interpret these newly discovered ultracool white dwarfs in two-color or color magnitudediagrams which involve “blue” magnitudes (?, see, e.g.,)]harris99,harris01,opp01a,opp01b until thisproblem with the missing opacity has been properly dealt with, and included in the theoreticalmodels and colors.

– 12 –
It now remains to be seen whether this new opacity source, even when included with theapproximate treatment introduced in this paper, can help resolve the mystery surrounding severalultracool white dwarfs whose energy distributions have yet failed to be successfully explained interms of hydrogen or mixed hydrogen/helium compositions.
We are grateful to S. T. Hodgkin for providing us with the spectrum of WD 0346+246, andto G. Fontaine and F. Wesemael for a careful reading of the manuscript. This work was supportedin part by the NSERC Canada and by the Fund FCAR (Quebec).

– 13 –
REFERENCES
Bergeron, P., Leggett, S. K., & Ruiz, M. T. 2001, ApJS, 133, 413
Bergeron, P., Ruiz, M. T., & Leggett, S. K. 1997, ApJS, 108, 339
Bergeron, P., Ruiz, M. T., Leggett, S. K., Saumon, D., & Wesemael, F. 1994, ApJ, 423, 456
Bergeron, P., Saumon, D., & Weseamel, F. 1995, ApJ, 443, 764
Bergeron, P., Weseamel, F., & Fontaine, G. 1991, ApJ, 367, 253
Dappen, W., Anderson, L., & Mihalas, D. 1987, ApJ, 319, 195
Dupuis, J., Fontaine, G., Pelletier, C., & Wesemael, F. 1992, ApJS, 82, 505
Dupuis, J., Fontaine, G., & Wesemael, F. 1993, ApJS, 87, 345
Fontaine, G., Brassard, P., & Bergeron, P. 2001, PASP, 113, 409
Hambly, N. C., Smartt, S. J., & Hodgkin, S. T. 1997, ApJ, 489, L157
Hambly, N. C., Smartt, S. J., Hodgkin, S. T., Jameson, R. F., Kemp, S. N., Rolleston, W. R. J.,& Steele I. A. 1999, MNRAS, 309, L33
Hansen, B. M. S. 1998, Nature, 394, 860
Harris, H. C., Dahn, C. C., Vrba, F. J., Henden, A. A., Liebert, J., Schmidt, G. D., & Reid, I. N.1999, ApJ, 524, 1000
Harris, H. C., et al. 2001, ApJ, 549, L109
Hummer, D. G., & Mihalas, D. 1988, ApJ, 331, 794
Ibata, R., Irwin, M., Bienayme, O., Scholz, R., & Guibert, J. 2000, ApJ, 532, L41
Jørgensen, U. G., Hammer, D., Borysow, A., & Falkesgaard, J. 2000, A&A, 361, 283
Knox, R. A., Hawkins, M. R. S., & Hambly, N. C. 1999, MNRAS, 306, 736
Lenzuni, P., Chernoff, D. F., & Salpeter, E. E. 1991, ApJS, 76, 759
Liebert, J., Dahn, C. C., & Monet, D. G. 1988, ApJ, 332, 891
Malo, A., Wesemael, F., & Bergeron P. 1999, ApJ, 517, 901
Monet, D. G., Dahn, C. C., Vrba, F. J., Harris, H. C., Pier, J. R., Luginbuhl, C. B., & Ables, H.D. 1992, AJ, 103, 638

– 14 –
Oppenheimer, B. R., Hambly, N. C., Digby, A. P., Hodgkin, S. T., & Saumon, D. 2001a, Science,in press
Oppenheimer, B. R., Saumon, D., Hodgkin, S. T., Jameson, R. F., Hambly, N. C., Chabrier, G.,Filipenko, A. V., Coil, A. L., & Brown, M. E. 2001b, ApJ, 550, 448
Reid, I. N., Sahu, K. C., & Hawley, S. L. 2001, ApJ, submitted
Saumon, D., & Jacobson, S. B. 1999, ApJ, 511, L107
Tassoul, M., Fontaine, G., & Winget, D. E. 1990, ApJS, 72, 335
Wesemael, F. 1979, A&A, 72, 104
Zeidler-K. T., E.-M., Weidemann, V., & Koester, D. 1986, A&A, 155, 356
AAS LATEX macros v5.0.

– 15 –
Fig. 1.— Energy distribution of white dwarf model atmospheres with Teff = 3750 K, log g = 8.0,and various helium-to-hydrogen abundance ratios. All distributions are normalized to unity wherethe Eddington flux (Hν) is maximum. The thick solid and dashed lines represent respectivelythe pure hydrogen and pure helium atmospheric compositions. The thin solid lines correspond to(starting from the pure hydrogen model) N(He)/N(H) = 0.1, 1, 10, and 105, while the thin dashedlines correspond to (starting from the N(He)/N(H) = 105 model) N(He)/N(H) = 108, 1010, 1012,and 1013.
Fig. 2.— Our best fit to the energy distribution of WD 0346+246 in terms of log fλ (top panel)and fν (bottom panel); Teff and log g are taken from Oppenheimer et al. (2001b). The BV RI andJHK photometric observations are represented by error bars. The solid lines represent the modelmonochromatic fluxes, while the filled circles correspond to the model fluxes averaged over the filterbandpasses.
Fig. 3.— Energy distribution of white dwarf model atmospheres with Teff = 3750 K, log g = 8.0,log N(He)/N(H) = 9.1, and for various calcium-to-helium abundance ratios. All distributions arenormalized to unity where the Eddington flux (Hν) is maximum. The various models correspondto (starting from the thick line) N(Ca)/N(He) = 0, 10−14, 10−13, and 10−12. The observedphotometry of WD 0346+246, normalized with the scaling factor determined from the zero-metalsolution (see Fig. 2), is represented by error bars.
Fig. 4.— Most relevant sources of opacity at the photosphere (τR = 1) of a pure hydrogen modelatmosphere at Teff = 4600 K and log g = 7.75 (the atmospheric parameters of LP 380−5 shown inFig. 5). The local temperature and density are indicated in the figure, and each opacity source isidentified as well. The thick solid line represents the total opacity. The bound-free opacities fromthe n = 1 and n = 2 levels include the pseudo-continuum opacity from the dissolved levels, whilethe contributions from the unperturbed bound-free absorptions alone are represented by the dashedlines. The pseudo-continuum opacity from the n = 1 level calculated explicitly by equations (1) to(3) is shown as a dotted line, and that calculated with the damping function given by equation (4)with a = 1.0 and ∆λD = 350 A is shown by the solid line.
Fig. 5.— Our best fit to the energy distribution of WD 0346+246, as well as fits to LHS 2522and LP 380−5 taken from Bergeron et al. (2001). The BV RI and JHK photometric observationsare represented by error bars. The solid and dotted lines represent respectively the model fluxeswith and without the pseudo-continuum opacity from the Lyman edge, while the filled circlescorrespond to the model fluxes — with the pseudo-continuum opacity included — averaged overthe filter bandpasses. The upper panel also shows for comparison the optical and infrared spectrafrom Oppenheimer et al. (2001b).
Fig. 6.— Top panel: Our best fit to the energy distribution of WD 0346+246 using a pseudo-continuum opacity calculated with the damping function given by equation (4) with a = 0.52 and∆λD = 36 A. Bottom panel: Most important sources of opacity at the photosphere (τR = 1) of the

– 16 –
corresponding model atmosphere. The local temperature and density are indicated in the figure,and each opacity source is identified as well. The thick solid line represents the total opacity. Thebound-free opacity from the n = 1 level includes the pseudo-continuum opacity from the dissolvedlevels, while the contribution from the unperturbed bound-free absorptions alone is represented bythe dashed line. The feature near 0.05 µm is the ionization threshold from neutral helium.

– 17 –
Figure 1
– 18 –
Figure 2
– 19 –
Figure 3
– 20 –
Figure 4

– 21 –
Figure 5

– 22 –
Figure 6