the hierarchical structure of service quality: integration of … · the hierarchical structure of...
TRANSCRIPT

The hierarchical structure ofservice quality: integration oftechnical and functional quality
Gi-Du KangSchool of Business Administration, Soongsil University, Seoul, Korea
Abstract
Purpose – To extend understanding of service quality by empirically examining theconceptualisation of service quality (both technical and functional).
Design/methodology/approach – Because the popular service-quality instrument, SERVQUAL,concentrates on functional quality, a model incorporating both technical quality and functional qualityis employed here. Structural equation modeling (SEM) is utilised to examine empirically atwo-components model of service quality.
Findings – A two-component model yields better fit than a model concentrating on functional qualityalone (such as SERVQUAL).
Research limitations/implications – Because the present study tests the model using a singleservice industry, an exhaustive description of technical quality could not be provided. This could beovercome in future studies by employing multiple service industries.
Practical implications – A useful foundation whereby practitioners can appreciate the importanceof technical service quality (in addition to functional quality).
Originality/value – This paper fulfils an identified information and resources need, and offerspractical assistance to academics and practitioners in the field.
Keywords Service quality assurance, SERVQUAL
Paper type Research paper
IntroductionService quality has been frequently studied in the services-marketing literature, andmuch of the research has focused on measuring service quality using the SERVQUALinstrument (Parasuraman, Zeithaml, and Berry, 1985; 1988). Research on the instrumentis commonly cited in the literature, and it has been widely used in industry (Asubontenget al., 1996; Buttle, 1996). Although this work has improved understanding ofservice-quality measurement, a criticism of SERVQUAL has been that the instrumentfocuses on the service-delivery process, but excludes service-encounter outcomes(Mangold and Babakus, 1991; Richard and Allaway, 1993; Gronroos, 1990).
Gronroos (1982; 1990) noted that the quality of a service as perceived by customershas two dimensions: a functional (or process) dimension and a technical (or outcome)dimension. Functional quality focuses on “how”, and considers issues such as thebehaviour of customer-contact staff and the speed of service, whereas technical qualityfocuses on “what” and considers such issues as the end result of service provision.Several authors have suggested that evaluation of service quality should include bothsets of attributes (Baker and Lamb, 1993; Gronroos, 1982, 1990; Mangold and Babakus,1991). Indeed, Richard and Allaway (1993) argued that utilising only functional-quality
The current issue and full text archive of this journal is available at
www.emeraldinsight.com/0960-4529.htm
This work was supported by the Soongsil University Research Fund.
Hierarchicalstructure of
service quality
37
Managing Service QualityVol. 16 No. 1, 2006
pp. 37-50q Emerald Group Publishing Limited
0960-4529DOI 10.1108/09604520610639955

attributes to explain and/or predict consumers’ behaviour is a misspecification ofservice quality that has low predictive validity.
Despite these concerns, much of the previous service-quality research hasconcentrated on the SERVQUAL instrument, and has thus focused on thefunctional-quality dimension. Few, if any, efforts have been made to test atwo-components model of service quality that includes both technical quality andfunctional quality. The purpose of the present study is therefore to extendunderstanding of service quality by empirically examining a conceptualisation ofservice quality that includes both technical quality and functional quality.
Theoretical backgroundUnderstanding service qualityThe construct of quality in the services literature focuses on perceived quality, which isdefined as a consumer’s judgment about an entity’s overall excellence or superiority(Zeithaml, 1987). This approach differs from that of objective quality, which involves anobjective assessment of a thing or event. Perceived quality is a form of “attitude”,resulting from a comparison of expectations with perceptions of performance. However,despite the emphasis in the literature on this approach, perceived service quality hasremained an elusive concept (Brady and Cronin, 2001; Parasuraman et al., 1985).
Many have suggested that quality results from a comparison of perceivedperformance with expected performance – based on the so-called “disconfirmationparadigm”. Indeed, this notion was the basis for the SERVQUAL model, which viewsservice quality as the gap between the expected level of service and customerperceptions of the level received (Parasuraman et al., 1988). SERVQUAL identified fivedeterminants of service quality:
(1) reliability;
(2) assurance;
(3) tangibles;
(4) empathy; and
(5) responsiveness.
Conceptually, these constructs address, respectively, performance standards, expertiseand physical elements of the facility, employees’ willingness to assist in a timelymanner with their knowledge, and sensitivity. Although SERVQUAL has beenextensively used in assessing services quality, it has also been subject to criticism invarious respects – including its use of the “difference score”, its dimensionality, itsapplicability, and so on (Asubonteng et al., 1996; Buttle, 1996; Cronin and Taylor, 1992;Carman, 1990; Babakus and Boller, 1992).
In addition, SERVQUAL has also been criticised for focusing solely on theservice-delivery process (Gronroos, 1990; Mangold and Babakus, 1991; Richard andAllaway, 1993). In this respect, it is of interest that one of the underlying themes ofSERVQUAL was that: “Quality evaluations are not made solely on the outcome ofservice; they also involve evaluations of the service delivery process” (Parasuraman et al.,1985). However, despite this, it is difficult to find an explanation for their failure toaddress outcome (technical) quality in the SERVQUAL instrument. It would seem thattechnical quality has been neglected in SERVQUAL’s measurement of service quality.
MSQ16,1
38

Service-quality dimensionsAlthough there is general agreement that service quality has many dimensions(Gronroos, 1982, 1990; Berry et al., 1985; Parasuraman et al., 1985), there is no consensuson the exact nature and content of these dimensions (Brady and Cronin, 2001).
Lehtinen and Lehtinen (1982) defined service quality in terms of physical quality,interactive quality, and corporate (image) quality. Physical quality relates to thetangible aspects of a service. Interactive quality refers to the two-way interactionbetween a customer and a service provider (or the provider’s representative), includingboth automated and animated interactions. Corporate quality refers to the imageattributed to a service provider by its current and potential customers.
As noted above, Gronroos (1982) identified two service-quality dimensions – atechnical aspect (“what” service is provided) and a functional aspect (“how” the serviceis provided). Technical (outcome) quality involves what a customer actually receivesfrom a service or a service encounter. Functional (process) quality concerns the way aservice is delivered to a consumer – that is, the customer’s perception of the interactionthat takes place during service delivery. For some services, the “what” (or technicalquality) might be difficult to evaluate. For example, in health care, it might be difficultfor a patient to evaluate a service provider’s technical competence and the immediateresult of treatment. If they lack the ability to assess technical quality, consumers rely onother measures of quality – such as attributes associated with the process (“how”). Inthe case of health-care delivery, these attributes might include reliability and empathy.
Lehtinen (1983) viewed service quality in terms of “process quality” and “outputquality”. Process quality is judged by a customer during a service, whereas outputquality is judged by a customer after a service has been performed. For example, abarber’s conversation and apparent skill during a haircut involve process quality;whereas the appearance of the hair after the haircut involves output quality.
Berry et al. (1985) and Parasuraman et al. (1985) suggested that quality evaluationsare not made solely on the outcome of service, but also involve evaluations of theservice-delivery process. Although the dimensions of these evaluations are related, thedifference depends upon when the evaluation occurs. For process quality, the evaluationoccurs while the service is being performed; whereas, for outcome quality, evaluationoccurs after service performance, and focuses on “what” service has been delivered.
Swartz and Brown (1989) attempted to synthesise the dimensions of service qualityin the works of Lehtinen and Lehtinen (1982), Gronroos (1982), and Berry et al. (1985).On the basis of this literature review, Swartz and Brown (1989) categorised thedimensions into “what” (evaluated after performance) and “how” (evaluated duringperformance).
Figure 1 summarises the preceding discussion by schematically presenting acategorisation of the dimensions of service quality as suggested by various authors.
A more recent conceptualisation of service-quality dimensions has been proposedby Rust and Oliver (1994), who suggested a three-component model for a customer’sevaluation of a service encounter:
(1) the customer–employee interaction (functional or process quality);
(2) the service environment; and
(3) the outcome (technical quality).
Hierarchicalstructure of
service quality
39

Although Rust and Oliver (1994) did not test their conceptualisation for theservice-quality dimensions, Brady and Cronin (2001) later stated that support has beenfound for similar models in retail banking and offered empirical confirmation in theirresearch (2001).
A hierarchical structure of service qualityIn addition to the notion of a multidimensional perspective, Dabholkar et al. (1996)proposed that perceptions of service quality are also multilevel. They identified andtested a hierarchical conceptualisation of retail service quality that proposed threelevels:
(1) a customer’s overall perception of service quality;
(2) primary dimensions; and
(3) subdimensions.
Thus, under the higher-order concept of “overall perception of service quality”, theyproposed a level of five dimensions – “physical aspects”, “reliability”, “personalinteraction”, “problem-solving”, and “policy”. On the next level, they further proposedthat some dimensions are more complex in that they have subdimensions. Forexample, two subdimensions – “appearance” and “convenience” – were suggested forthe dimension of “physical aspects”.
The present study proposes a framework for service quality on the basis thatservice quality is multidimensional and has a hierarchical structure. Developing such aframework involves identification of the dimensions of service quality (both technicaland functional), and the components thought to make up each dimension.
Marketing scholars have yet to identify the attributes of technical quality, althoughit is accepted that technical quality significantly affects customers’ perceptions ofservice quality (Gronroos, 1982, 1990; Rust and Oliver, 1994). Attempts to measure
Figure 1.Dimensions of servicequality
MSQ16,1
40

technical quality have generally involved the use of qualitative methods (Richard andAllaway, 1993; Powpaka, 1996; Brady and Cronin, 2001). Brady and Cronin (2001)administered open-ended surveys that asked respondents to complete a questionnaireabout the specific attributes they perceived regarding the service experiences. Richardand Allaway (1993) and Powpaka (1996) employed in-depth interviews to discoverrelevant determinants of technical quality. Various studies have used different items tomeasure technical quality. The findings suggest that there is no underlying latentvariable associated with the technical-quality dimension.
With respect to measuring functional quality, several authors have utilisedSERVQUAL (Richard and Allaway, 1993; Powpaka, 1996). Brady and Cronin (2001, p.36) suggested that “ . . . the SERVQUAL model uses the terms that describe one ormore determinants of a quality service encounter” [emphasis added].
On the basis of the preceding discussion, a hierarchical structure of service qualityis proposed, as shown in Figure 2. While the Figure 2 only depicts the second-orderfactor structure, the full structure of higher-order factor model for service qualityshould be the three-order factor structure. In the full structure, there has to be a latentvariable (i.e. service quality perception) having a direct effect on both technical andfunctional quality dimension. Given that there is a lack of precedent for simultaneouslyanalyzing a third-order factor model and the technical difficulties accompanied by theanalysis, the current study does not attempt to fully analyze the third-order factormodel. Rather, an alternative method to estimate the relationship between servicequality perception and technical/functional quality dimension was employed.
MethodsSampleThe sample consisted of cell-phone (mobile-phone) users in Korea who were recruitedby direct interception in a shopping mall. A total of 19 undergraduatebusiness-administration students (13 male and six female) from a large university inSeoul were trained for data collection. Cell-phone (mobile-phone) users were selected asparticipants because the outcome quality of this service is easily discernible by
Figure 2.The proposed hierarchicalstructure of service quality
Hierarchicalstructure of
service quality
41
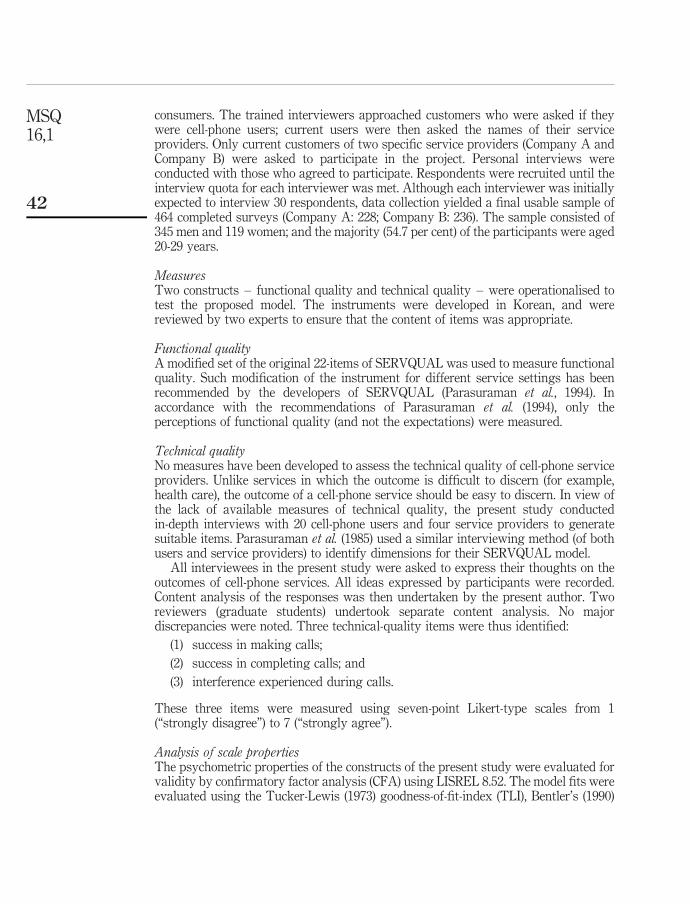
consumers. The trained interviewers approached customers who were asked if theywere cell-phone users; current users were then asked the names of their serviceproviders. Only current customers of two specific service providers (Company A andCompany B) were asked to participate in the project. Personal interviews wereconducted with those who agreed to participate. Respondents were recruited until theinterview quota for each interviewer was met. Although each interviewer was initiallyexpected to interview 30 respondents, data collection yielded a final usable sample of464 completed surveys (Company A: 228; Company B: 236). The sample consisted of345 men and 119 women; and the majority (54.7 per cent) of the participants were aged20-29 years.
MeasuresTwo constructs – functional quality and technical quality – were operationalised totest the proposed model. The instruments were developed in Korean, and werereviewed by two experts to ensure that the content of items was appropriate.
Functional qualityA modified set of the original 22-items of SERVQUAL was used to measure functionalquality. Such modification of the instrument for different service settings has beenrecommended by the developers of SERVQUAL (Parasuraman et al., 1994). Inaccordance with the recommendations of Parasuraman et al. (1994), only theperceptions of functional quality (and not the expectations) were measured.
Technical qualityNo measures have been developed to assess the technical quality of cell-phone serviceproviders. Unlike services in which the outcome is difficult to discern (for example,health care), the outcome of a cell-phone service should be easy to discern. In view ofthe lack of available measures of technical quality, the present study conductedin-depth interviews with 20 cell-phone users and four service providers to generatesuitable items. Parasuraman et al. (1985) used a similar interviewing method (of bothusers and service providers) to identify dimensions for their SERVQUAL model.
All interviewees in the present study were asked to express their thoughts on theoutcomes of cell-phone services. All ideas expressed by participants were recorded.Content analysis of the responses was then undertaken by the present author. Tworeviewers (graduate students) undertook separate content analysis. No majordiscrepancies were noted. Three technical-quality items were thus identified:
(1) success in making calls;
(2) success in completing calls; and
(3) interference experienced during calls.
These three items were measured using seven-point Likert-type scales from 1(“strongly disagree”) to 7 (“strongly agree”).
Analysis of scale propertiesThe psychometric properties of the constructs of the present study were evaluated forvalidity by confirmatory factor analysis (CFA) using LISREL 8.52. The model fits wereevaluated using the Tucker-Lewis (1973) goodness-of-fit-index (TLI), Bentler’s (1990)
MSQ16,1
42

comparative fit index (CFI), and the goodness-of-fit index (GFI). The root-mean-squareresidual (RMR) and the chi-square values were also calculated for model fit. Constructreliability was evaluated using the procedures suggested by Fornell and Larcker(1981), including parameter estimates and their associated t-values, and assessment ofthe average variance extracted for each construct. The coefficient alphas were alsocalculated to evaluate the reliability of each construct.
The individual items were also evaluated on the basis of error variance and residualvalue. McDonald (2002) has suggested that residual values lower than 0.10 are good,and that values ranging from 0.11 to 0.15 are acceptable.
Both Sample A (customers of Company A) and Sample B (customers of Company B)were used for analysis of the scale properties. Sample A was utilised to purify thescales; an initial CFA was computed to evaluate the model fit; modifications were thenmade on the basis of evaluation of the fit, and additional confirmatory analyses werecomputed with Sample A until satisfactory results (which included acceptable fitindices and no outstanding residual values) were obtained (see Figure 3). Sample B wasutilised to verify the psychometric properties of the purified scales. The items retainedfrom the final assessment of Sample A were analysed using a CFA with Sample B toconfirm the factorial structures (see Figure 3).
ResultsUnidimensionality – functional quality (SERVQUAL)Initial assessment of functional quality involved the validity and reliability of the22-item, five-factor structure of SERVQUAL.
The results of the initial CFA using Sample A indicated moderate data fit, but withroom for improvement. In all, six items that undermined the factorial structure wereeliminated – largely on the basis of the residual value associated with CFA andsemantic considerations among the items. With respect to semantics, the items thataddressed the reliability dimension (“providing service as promised”, and “providingservices at the promised time”) were found to have unacceptable residual values largerthan 0.16). Although these were presented as being distinct from each other in theoriginal SERVQUAL scale, there seems to be overlap in the meaning.
Accordingly, with the additional consideration of residual value and factor loading,it was decided to eliminate the item “providing service as promised”. Similar methodsfor item purification were applied to other items. Through several iterations for scalepurification using Sample A, the initial results of CFA retained 16 items. The final CFAcomputed with Sample A indicated that the data fitted the model reasonably well(GFI ¼ 0:92; CFI ¼ 0:94; TLI ¼ 0:93). The item loadings for functional quality basedon Sample A were significant, and ranged from 0.53 to 0.87. Evidence of internalconsistency was demonstrated through the composite reliability and coefficient alphascores, ranging from 0.69 to 0.87 (see Figure 3).
A second CFA was then undertaken using Sample B to confirm the results of theinitial CFA using the remaining 16 items. The results indicated that the data fitted themodel well (GFI ¼ 0:93; CFI ¼ 0:95; TLI ¼ 0:94). The item (indicator) loadings forfunctional quality using Sample B were significant, and ranged from 0.52 to 0.89.Evidence for internal consistency was also sought through the composite reliabilityand coefficient alpha scores – ranging from 0.69 to 0.85 (see Figure 3). The CFA withSample B confirmed that the SERVQUAL measure had a distinctive 5-factor structure.
Hierarchicalstructure of
service quality
43

In addition, a single-factorial structure composed of all five SERVQUAL componentswas analysed to assess the unidimensionality of functional quality. The single-factorialstructure provided a significantly poorer fit, indicating that the SERVQUALinstrument is not unidimensional. It is important to note that the assessment offunctional quality discussed to this point included only the five constructs (with thecorresponding manifest variables). The proposed hierarchical structure of servicequality (see Figure 2), suggests that the unidimensional nature of functional qualitymight be captured through a second-order latent variable. Support for a second-orderlatent variable was also found in the correlations among the SERVQUAL factors. Thecorrelations among the five factors were high-ranging from 0.62 to 0.85 for Sample Aand from 0.56 to 0.91 for Sample B. In view of the high correlations among the fivefactors it is reasonable to expect that functional quality is a unidimensional constructhaving several distinctive sub-components.
Figure 3.Summary statistics of theCFA for Sample A andSample B
MSQ16,1
44

Unidimensionality – technical qualityCFA was also used to assess the unidimensionality of technical quality. Because themodel for technical quality was saturated, the model was identified and no fit indiceswere provided. For sample A, the composite reliability and AVE for technical qualitywere 0.78 and 0.54 respectively. The item (indicator) loadings for technical quality weresignificant, and ranged from 0.68 to 0.79 for Sample A (see Figure 3). No problematicitems were found in the initial CFA using Sample A. Accordingly, no changes weredeemed necessary for the structure of technical quality. A second CFA was computedusing Sample B – for which the composite reliability and AVE were 0.72 and 0.46respectively. The item (indicator) loadings were significant and ranged from 0.61 to0.75 for this sample (see Figure 3).
Higher-order factor analysis for service qualityWhereas the unidimensionality for each construct was assessed in the previous section,that for functional quality was not fully assessed (although high correlation among thefive latent variables was suggested in the CFA). It was therefore necessary toundertake an additional analysis to ascertain the unidimensionality of thefunctional-quality dimension. At the same time, it was also necessary to confirm thestructure of technical quality and functional quality empirically to verify the completestructure of service quality. In assessing another higher-order factor for the twocomponents, it is possible to develop a third-order factor model. However, the presentstudy did not explore such a model because of its complexity. Nevertheless, it is stillpossible to capture the relationship between the second-order factors (technical andfunctional quality) and the third-order factor (service-quality perception) without a fullassessment of the third-order factor model. That is, the correlation between technicalquality and functional quality (f12) would offer a clue in understanding the pathbetween service-quality perception and construct of technical/functional quality.
Analysis of second-order factor model – functional quality onlyThe presence of distinct factors and high correlations among factors (at least 0.56)indicated that functional quality might be multilevel and multidimensional. That is,functional quality was believed to have a second-order factorial structure as shown inthe left part of Figure 1. To test this, a second-order factor model was tested usingSample B. The results indicated that the data provided an adequate fit to the model(GFI ¼ 0:91; CFI ¼ 0:97; TLI ¼ 0:97; RMR ¼ 0:05) (see Table I). The results show thatthe second-order factor model for functional quality provides better fit compared withthe results of the CFA for SERVQUAL (functional quality). These findings suggestthat functional quality is a unidimensional construct having several distinctivesub-components.
Analysis of second-order factor analysis – technical and functional qualityTo test empirically whether service quality does consist of two components, the modelshown in Figure 2 (which fully considers technical quality and functional quality) wasanalysed. The results indicated that the data fitted the model well (GFI ¼ 0:89;CFI ¼ 0:98; TLI ¼ 0:98) (see Table II). Although GFI was lower than the “rule ofthumb” (that is, acceptable at greater than 0.90), there is no reason to believe this modelis inadequate given that the other fit indices (CFI, TLI) satisfied the “rule of thumb” for
Hierarchicalstructure of
service quality
45

these indices (that is, good at greater than 0.90). In particular, Bentler (1990) hassuggested that the Tucker-Lewis (1973) goodness-fit-index (TLI) and Bentler’s (1990)comparative fit index (CFI) are appropriate to assess the fit of a model – given thatthey are the least sensitive to sample size. Considering the relatively large sample sizeemployed in the current study, it is appropriate to determine the model fit on the basisof TLI and CFI. For the current study, the values were both 0.98, indicating that the fitof model was adequate. It is therefore safe to say that service-quality perceptionconsists of two components, as depicted in Figure 2.
As noted earlier, rather than implementing a third-order factor model to address therelationship between service-quality perception and technical/functional quality, analternative method of assessing those relationships was employed. That is, using thecorrelation between technical and functional quality (f12), it is possible to estimate thepath between service-quality perception and technical/functional quality, even thoughthe relative influence of each dimension on the service quality perception could not beestimated. The results show that the magnitude of correlation (f12) was 0.61.
Parameter Coefficient * Uniqueness * Parameter Coefficient * Uniqueness *
lx11 0.74(0.07) 0.45(0.08) ly114 0.81(0.08) 0.34(0.05)lx21 0.59(0.07) 0.65(0.08) ly124 0.83(0.08) 0.31(0.04)lx31 0.68(0.07) 0.54(0.08) ly134 0.73(0.08) 0.47(0.06)ly11 0.76 0.42(0.06) ly145 0.66 0.57(0.08)ly21 0.81(0.08) 0.35(0.06) ly155 0.63(0.09) 0.61(0.08)ly31 0.68(0.08) 0.55(0.07) ly165 0.66(0.09) 0.57(0.08)ly42 0.53 0.72(0.08) g12 0.79(0.09) 0.38(0.09)ly52 0.86(0.11) 0.26(0.04) g22 0.87(0.12) 0.25(0.08)ly62 0.89(0.11) 0.22(0.04) g32 0.90(0.10) 0.19(0.08)ly73 0.67 0.55(0.07) g42 0.89(0.10) 0.21(0.06)ly83 0.66(0.08) 0.56(0.07) g52 0.78(0.10) 0.39(0.12)ly93 0.75(0.09) 0.44(0.06) f12 0.61(0.06)ly104 0.66 0.56(0.06)Fit indices Chi–square ¼ 249:60, d:f: ¼ 146, p ¼ 0:0000;
GFI ¼ 0:89, CFI ¼ 0:98, TLI ¼ 0:98, RMR ¼ 0:07
Note: * All significance p , 0:01
Table II.Second-order factormodel – technical andfunctional qualitydimension
Path Standardised loading Uniqueness
g11 Process quality ! Reliability 0.71(0.06) 0.49(0.07)g21 Process quality ! Responsiveness 0.84(0.08) 0.30(0.06)g31 Process quality ! Assurance 0.91(0.08) 0.18(0.05)g41 Process quality ! Empathy 0.96(0.06) 0.09(0.03)g51 Process quality ! Tangibles 0.86(0.07) 0.27(0.06)Fit indices Chi–square ¼ 378:17 d:f: ¼ 99 p ¼ 0:0001;
GFI ¼ 0:91, CFI ¼ 0:97, TLI ¼ 0:97, RMR ¼ 0:05
Note: * Significance p , 0:01
Table I.Second-order factormodel –functional-qualitydimension only
MSQ16,1
46

DiscussionAlthough debate regarding service quality continues in the literature, it is unusual tosee conceptual work on the nature of service quality. Indeed, most of the recentresearch in service quality has been dominated by measurement issues. Althoughseveral authors have published their perspectives on the nature of the service-qualitydimension (Lehtinen and Lehtinen, 1982; Gronroos, 1982; Parasuraman et al. 1985,1988; Rust and Oliver, 1994), it is unusual for these to be empirically tested – apartfrom Brady and Cronin’s (2001) study empirically testing Rust and Oliver’s (1994)three-component conceptualisation of service quality.
The present study took up the perspective suggested by European scholars indefining service quality in categorical terms (that is, technical quality and functionalquality) (e.g., Lehtinen and Lehtinen, 1982; Lehtinen, 1983; Gronroos, 1982; 1990).Indeed, the developers of SERVQUAL referred to these dimensions in their early study(Parasuraman et al. 1985). The present study also adopted the view of several scholarswho have suggested that SERVQUAL represents only the process dimension ofservice-quality perception (e.g., Mangold and Babakus, 1991; Powpaka, 1996; Richardand Allaway, 1993). On this basis, the present study empirically tested the twocomponents of service quality among users of cell-phone (mobile-phone) services inKorea. In so doing, several interesting results were revealed.
The data show that SERVQUAL has a distinctive five-factor structure, althoughonly 16 items (rather than the 22 SERVQUAL items) were utilised in the study. It wasalso found that the five latent variables of SERVQUAL are correlated. This resultsuggested that SERVQUAL is unidimensionsal; however, a check forunidimensionality did not support this inference.
As an alternative, a second-order factor model was implemented (see Figure 2), andthese results supported the model well. It was thus concluded that, although a structureof five distinctive factors was confirmed, this represented the functional-qualitydimension in the perception of service quality.
The study was thus able to provide evidence that customers form perceptions ofservice quality on the basis of their evaluations of two primary dimensions – technicaland functional. In this respect, the present study offers the first empirical evidence forthe European perspective of service quality consisting primarily of two components –technical quality and functional quality.
Managerial implicationsThe confirmation of two components in the service-quality model is of assistance tomanagers in gaining a clear understanding how customers assess the quality of theservice they provide.
First, although the relative influences of technical quality and functional quality onservice-quality perception is not clearly addressed here, attention still needs to be paidto their impact on the perception of service quality. By and large, technical quality hasbeen relatively disregarded because it was believed that customers would not be able todiscern the technical quality of services with accuracy, and that they would thereforerely on other measures of quality attributes – especially those associated with theprocess of service delivery (functional quality). Although this might be the case forservices that have high-credence properties (such as medical services and law services),the majority of services actually have “search-and-experience” properties. A technical
Hierarchicalstructure of
service quality
47

quality strategy is, therefore, likely to be successful if a firm achieves a technicalsolution that the competition cannot emulate. However, this is seldom the case; rather,there are usually several firms that can provide (more or less) the same outcome quality.Moreover, creating a technical advantage is difficult because competitors in manyindustries can introduce similar solutions rather quickly (Gronroos, 1990). Theimportant managerial implication is to recognise that, although it can be difficult for anorganization to be first in the delivery of an excellent technical service outcome,consumers will accept this as long as the service that is eventually offered is not inferior.
Secondly, even if an excellent solution is achieved, a firm can be unsuccessful if theexcellence in technical quality is negated by a badly managed buyer-seller interaction –that is, by unsatisfactory process quality (Gronroos, 1990). Even if it has a supplementaryrole to technical quality, functional quality has a significant effect on the perception ofoverall service quality. The evaluation of “how” the service is being performed is a criticalfactor in the perception of service quality. The current study has confirmed thatSERVQUAL can be used to assess functional quality in service delivery. This study didnot assess the individual influence of SERVQUAL’s five individual sub-constructs on theperception of service quality. However, the study has confirmed that a check of functionalquality should be undertaken by service firms, and that they should use SERVQUAL forthis purpose to ascertain the status of each quality subdimension.
Limitations and additional research directionsAs with any study, the present research has certain limitations.
First, the present study does not offer a full description of technical quality.Although the structure of functional quality has been extensively studied, and isrelatively well understood, the conceptualisation of technical quality appears to be inits early stages. In addressing the issue of technical quality, the present study merelyrefers to previous studies that have assessed this construct. However, in view of thelimited literature on the subject, it has been difficult to offer a full description of thenature of technical quality. Despite this, the study did undertake in-depth interviews toascertain the content of technical quality in the service being researched – because thiswas believed to be more useful than relying only on a literature review in this respect.However, the qualitative approach employed here was limited to an item configurationfor technical quality. The current study could not produce a multi-level factorialstructure for technical quality – although the study did note that service quality islikely to have a hierarchical structure. It might therefore be necessary to complementthe results of the qualitative interviews with exploratory factor analysis to discover theunderlying factors that constitute technical quality. Given that the current studysuggested three items of technical quality, this method was not relevant here; however,a future study could undertake the above-mentioned procedures to configure thefactors (dimensions) that underlie technical quality.
Secondly, because the dimensions of technical quality related to a particularservices, rather than being generic, the service-quality model proposed and tested hereis limited. Although the theoretical foundations for a hierarchical structure for servicequality are sound, it is apparent that a complete model for service quality has not beenachieved if the generic technical-quality and functional-quality dimensions have notbeen identified. Given that SERVQUAL (as used in the current study for functionalquality) is believed to be generic, greater emphasis needs to be given to identifying the
MSQ16,1
48

precise generic make-up of technical quality. Moreover, scholars could investigate therelative influence of technical quality and functional quality on service-qualityperception (Richard and Allaway, 1993; Powpaka, 1996).
Thirdly, the results from a single service industry might raise concerns aboutlimited generalisability – even though limiting the study to a single industry doeseliminate the problems associated with the effects of industry differences. Differentresults might have been obtained if the study had investigated different services thathad credence properties (for example, health-care services and legal services) and/orexperience-and-search properties (for example, banking services).
Finally, the present study simply adopted the findings of previous studiessuggesting SERVQUAL could be used to capture the functional dimension of servicequality. Although the study assumed that the five sub-dimensions of SERVQUALcould capture the whole picture during the service-delivery process, this might requiremore thorough scrutiny.
References
Asubonteng, P., McCleary, K.J. and Swan, J.E. (1996), “SERVQUAL revisited: a critical review ofservice quality”, Journal of Services Marketing, Vol. 10 No. 6, pp. 62-81.
Babakus, E. and Boller, G.W. (1992), “An empirical assessment of the SERVQUAL scale”, Journalof Business Research, Vol. 24, pp. 253-68.
Baker, J.A. and Lamb, C.W. Jr (1993), “Measuring architectural design service quality”, Journal ofProfessional Services Marketing, Vol. 10 No. 1, pp. 89-106.
Bentler, P.M. (1990), “Comparative fit indices in structural models”, Psychological Bulletin,Vol. 107, pp. 238-46.
Berry, L.L., Zeithaml, V.A. and Parasuraman, A. (1985), “Quality comes in services, too”,Business Horizon, Vol. 28, pp. 44-52.
Brady, M.K. and Cronin, J.J. Jr (2001), “Some new thoughts on conceptualizing perceived servicequality: a hierarchical approach”, Journal of Marketing, Vol. 65, July, pp. 34-49.
Buttle, F. (1996), “SERVQUAL: review, critique, research agenda”, European Journal ofMarketing, Vol. 30 No. 1, pp. 8-32.
Carman, J.M. (1990), “Consumer perceptions of service quality: an assessment of the SERVQUALdimensions”, Journal of Retailing, Vol. 66, Spring, pp. 33-55.
Cronin, J.J. Jr and Taylor, S.A. (1992), “Measuring service quality: a reexamination andextension”, Journal of Marketing, Vol. 56, pp. 55-68.
Dabholkar, P., Thorpe, D.I. and Rentz, J.O. (1996), “A measure of service quality for retail stores:scale development and validation”, Journal of the Academy of Marketing Science, Vol. 24No. 1, pp. 2-16.
Fornell, C. and Larcker, D.F. (1981), “Evaluating structural equation models with unobservableand measurement error”, Journal of Marketing Research, Vol. 18, February, pp. 39-80.
Gronroos, C. (1982), Strategic Management and Marketing in Service Sector, Marketing ScienceInstitute, Cambridge, MA.
Gronroos, C. (1990), Service Management and Marketing, Lexington Books, Lexington, MA.
Lehtinen, J. (1983), “Customer oriented service system”, working paper, Service ManagementInstitute, Helsinki.
Lehtinen, J.R. and Lehtinen, U. (1982), “Service quality: a study of quality dimensions”,unpublished working paper, Service Management Institute, Helsinki.
Hierarchicalstructure of
service quality
49
McDonald, R.P. (2002), “Structural model for the multivariate data”, Lawrence ErlbaumAssociates, Hillsdale, NJ.
Mangold, G.W. and Babakus, E. (1991), “Service quality: the front-stage perspective vs theback-stage perspective”, Journal of Services Marketing, Vol. 5 No. 4, pp. 59-70.
Parasuraman, A., Zeithaml, V.A. and Berry, L.L. (1985), “A conceptual model of service qualityand its implications for future research”, Journal of Marketing, Vol. 49, Fall, pp. 41-50.
Parasuraman, A., Zeithaml, V.A. and Berry, L.L. (1988), “SERVQUAL: a multiple item scale formeasuring customer perceptions of service quality”, Journal of Retailing, Vol. 64, pp. 12-40.
Parasuraman, A., Zeithaml, V.A. and Berry, L.L. (1994), “Moving forward in service qualityresearch: measuring different levels of customer expectations, comparing alternativescales, and examining the performance-behavioral intentions link”, Marketing ScienceInstitute Working Paper, Report No. 94-114, September 1994.
Powpaka, S. (1996), “The role of outcome quality as a determinant of overall service quality indifferent categories of services industries: an empirical investigation”, Journal of ServicesMarketing, Vol. 10 No. 2, pp. 5-25.
Richard, M.D. and Allaway, A.W. (1993), “Service quality attributes and choice behavior”,Journal of Services Marketing, Vol. 7 No. 1, pp. 59-68.
Rust, R.T. and Oliver, R.L. (1994), “Service quality: insights and managerial implications fromthe frontier”, in Rust, R.T. and Oliver, R.L. (Eds), Service Quality: New Directions in Theoryand Practice, Sage Publications, Thousand Oaks, CA, pp. 1-19.
Swartz, T.A. and Brown, S.W. (1989), “Consumer and provider expectations and experiencesevaluating professional service quality”, Journal of the Academy of Marketing Science,Vol. 17 No. 2, pp. 189-95.
Tucker, L.R. and Lewis, C. (1973), “A reliability co-efficient for maximum likelihood factoranalysis”, Psychometrika, Vol. 38 No. 1, pp. 1-10.
Zeithaml, V.A. (1987), Defining and Relating Prices, Perceived Quality and Perceived Value,Marketing Science Institute, Cambridge, MA.
Further reading
Joreskog, K.G. (1971), “Statistical analysis of sets of congeneric tests”, Psychometrika, Vol. 32,pp. 443-82.
Taylor, S.A. and Baker, T.L. (1994), “An assessment of the relationship between service qualityand customer satisfaction in the formation of consumers’ purchase intentions”, Journal ofRetailing, Vol. 70 No. 2, pp. 163-78.
About the authorGi-Du Kang is a full-time lecturer of marketing in the School of Business Administration atSoongsil University in Seoul, Korea. He received his first PhD in services marketing fromChung-Ang University and second PhD in sport marketing from the University of Illinois atUrbana-Champaign. His research interests include the issues related to service quality andcustomer satisfaction; and the application of those issues to various service industries. He is theauthor of three marketing textbooks and his work has been published in several journalsincluding the Managing Service Quality, the Journal of Korean Society for Quality Management;the Korean Management Review, and the Korean Marketing Journal.
MSQ16,1
50
To purchase reprints of this article please e-mail: [email protected] visit our web site for further details: www.emeraldinsight.com/reprints