the impact of cap on sustainable development of rural areas from the perspective of eu research
DESCRIPTION
The impact of CAP on sustainable development of rural areas from the perspective of EU research by Tomas Ratinger F. Handan Giray Ignacio Perez Dominguez Adriana Cristoiu. The presentation represents opinions of the authors, by no means the official opinion of the European Commission. - PowerPoint PPT PresentationTRANSCRIPT

1
19/04/23 Ratinger ey al. CAP for Rural Areas 1
The impact of CAP on sustainable development of rural areas from the perspective of EU research
by
Tomas Ratinger
F. Handan Giray
Ignacio Perez Dominguez
Adriana Cristoiu
The presentation represents opinions of the authors, by no means the official opinion of the European Commission
2
19/04/23 Ratinger ey al. CAP for Rural Areas 2
7 Institutes in 5 Member States 3000 staff 320 M€/y budget + 40 M€ income
IE – Petten, The Netherlands Institute for Energy
IRMM – Geel, Belgium Institute for Reference Materials and Measurements
ITU – Karlsruhe, Germany Institute for Transuranium Elements
IPSC / IHCP / IES – Ispra, Italy Institute for the Protection and Security of the Citizen Institute for Health and Consumer Protection Institute for Environment and Sustainability
IPTS – Sevilla, Spain Institute for Prospective Technological Studies
2
What is the JRCWhat is the JRC

3
19/04/23 Ratinger ey al. CAP for Rural Areas 3
IPTS->SUSTAG – Research agendaIPTS->SUSTAG – Research agenda
Institute for Prospective Technological Institute for Prospective Technological StudiesStudies
(Science based support to policy making (Science based support to policy making (EC))(EC))
– Agriculture and Life Sciences in the Economy UnitAgriculture and Life Sciences in the Economy Unit• (AGRITRADE Action)(AGRITRADE Action)• SUSTAG Action (department/research group/project SUSTAG Action (department/research group/project
(FPx))(FPx))– Three research areas:Three research areas:– Sustainable farming systemsSustainable farming systems– Value added of farm productsValue added of farm products– Rural developmentRural development

4
19/04/23 Ratinger ey al. CAP for Rural Areas 4
Structure of the Structure of the presentationpresentation
• Territorial impact assessmentTerritorial impact assessment
• ESPON studyESPON study
• IPTS study: Sustainability of farming IPTS study: Sustainability of farming systems in NMSsystems in NMS
• IPTS study: TIA of 2003 CAP reform IPTS study: TIA of 2003 CAP reform (Pillar I)(Pillar I)

5
19/04/23 Ratinger ey al. CAP for Rural Areas 5
CAP Impact on Rural CAP Impact on Rural DevelopmentDevelopment
• Spatial Impact Assessment in which Spatial Impact Assessment in which spatial units area classified as spatial units area classified as rural/urbanrural/urban
– Territorial IA – when spatial units are larger Territorial IA – when spatial units are larger autonomous territories like NUTS3, NUTS2autonomous territories like NUTS3, NUTS2
• Multi-sector Impact Assessment: Multi-sector Impact Assessment: interlinks between economic sectors interlinks between economic sectors
• Sustainability Impact Assessment: Sustainability Impact Assessment: environmental, economic, social, environmental, economic, social, institutional perspectivesinstitutional perspectives

6
19/04/23 Ratinger ey al. CAP for Rural Areas 6
Impact of CAP in the rural Impact of CAP in the rural development contextdevelopment context
• EU wide: ESPON (EU wide: ESPON (www.espon.euwww.espon.eu), ),
• Project 2.1.3: The Territorial Impact of CAP Project 2.1.3: The Territorial Impact of CAP and Rural Development Policy (2002-2003)and Rural Development Policy (2002-2003)
– NUTS3 levelNUTS3 level– statistical data (1999) and correlation, case studies, statistical data (1999) and correlation, case studies,
CAPRI modelCAPRI model
• Conclusion on CAP Pillar I:Conclusion on CAP Pillar I:
– Market supports distributed against cohesion objectivesMarket supports distributed against cohesion objectives– Direct payments in line with cohesion objectivesDirect payments in line with cohesion objectives
• Conclusions on CAP Pillar II:Conclusions on CAP Pillar II:
– LFA payments (surprisingly) to more prosperous regionsLFA payments (surprisingly) to more prosperous regions– Less accessible regions receive more from Pillar 2Less accessible regions receive more from Pillar 2

7
19/04/23 Ratinger ey al. CAP for Rural Areas 7
Sustainable Farming Systems in Sustainable Farming Systems in the New Member Statesthe New Member States
• IPTS study (conducted by DAP Cordoba) 2005-IPTS study (conducted by DAP Cordoba) 2005-20062006
• Case study approach, 2 NMS (CZ and LT)Case study approach, 2 NMS (CZ and LT)
• Spatial approach – regional farming systemsSpatial approach – regional farming systems
– an aggregation of farming practices and styles over a region an aggregation of farming practices and styles over a region (LAU1)(LAU1)
– distinctive criteria: land use, agro-environmental conditions, distinctive criteria: land use, agro-environmental conditions, production structure, demographic characteristics production structure, demographic characteristics
– economic performance of farmingeconomic performance of farming– environmental impact of farmingenvironmental impact of farming– social context of farmingsocial context of farming
• Policies: CAP Pillar I , Pillar 2 (particularly Policies: CAP Pillar I , Pillar 2 (particularly organic farming)organic farming)

8
19/04/23 Ratinger ey al. CAP for Rural Areas 8
Regional farming systemsRegional farming systems
• CZCZ
– Crop oriented - maizeCrop oriented - maize– Crop oriented - sugar Crop oriented - sugar
beetbeet– Livestock orientedLivestock oriented– Mixed oriented – potatoMixed oriented – potato– Mixed oriented - Mixed oriented -
grasslandgrassland
• LTLT
– Urban neighbourhoodUrban neighbourhood– Crop orientedCrop oriented– Livestock orientedLivestock oriented– IntermediateIntermediate– Crop marginalCrop marginal– Livestock marginalLivestock marginalLFA

9
19/04/23 Ratinger ey al. CAP for Rural Areas 9
Czech resultsCzech results
0
20
40
60
80
100environmental
socialeconomic
CROPS-ORIENTED MAIZE
CROPS-ORIENTED SUGAR BEET
LIVESTOCK-ORIENTEDMIXED-ORIENTED POTATO
MIXED-ORIENTED GRASSLAND
Sustainability RankSustainability Rank
CROPS-ORIENTED SUGAR CROPS-ORIENTED SUGAR BEETBEET 11
MIXED-ORIENTED POTATO MIXED-ORIENTED POTATO (LFA)(LFA) 22
LIVESTOCK-ORIENTEDLIVESTOCK-ORIENTED 33
MIXED-ORIENTED GRASSLAND MIXED-ORIENTED GRASSLAND (LFA)(LFA) 44
CROPS-ORIENTED MAIZECROPS-ORIENTED MAIZE 55

10
19/04/23 Ratinger ey al. CAP for Rural Areas 10
IPTS Study: TIA of CAP IPTS Study: TIA of CAP
• Objective of the study: impact of 2003 Objective of the study: impact of 2003 CAP reform on rural areasCAP reform on rural areas
– Are there differences of impacts among regions Are there differences of impacts among regions depending on “rural” characteristics?depending on “rural” characteristics?
• Methodology: Methodology:
– CAPRI model (World wide agricultural sector CAPRI model (World wide agricultural sector model with regionalised supply of the EU at model with regionalised supply of the EU at NUTS2 level)NUTS2 level)
– Regional typology at NUTS2Regional typology at NUTS2– Testing differences of income impact (ANOVA)Testing differences of income impact (ANOVA)

11
19/04/23 Ratinger ey al. CAP for Rural Areas 11
CAPRICAPRI
• Partial equilibrium, comparative staticPartial equilibrium, comparative static
– Detailed supply module of European Agriculture (NUTS2 Detailed supply module of European Agriculture (NUTS2 level, i.e. over 200 model blocks); [PMP method]level, i.e. over 200 model blocks); [PMP method]
– Market module covering agricultural trade world-wide. Market module covering agricultural trade world-wide. [econometric model][econometric model]
• Based on EAA and FADNBased on EAA and FADN
– annually updated (using most recent Eurostat data, annually updated (using most recent Eurostat data, FADN)FADN)
• Used by the Commission and in many projectsUsed by the Commission and in many projects
– incorporated into DG AGRI baseline modelling systemincorporated into DG AGRI baseline modelling system– used in SEAMLESS, SENSOR, etc.used in SEAMLESS, SENSOR, etc.– regional breakdown – appreciatedregional breakdown – appreciated
• In the study: 2002 base year, 2013 projection In the study: 2002 base year, 2013 projection (reform impacts)(reform impacts)

12
19/04/23 Ratinger ey al. CAP for Rural Areas 12
Regional TypologyRegional Typology
• NUTS 2 level typologyNUTS 2 level typology
– 210 regions for EU25, 169 for EU15210 regions for EU25, 169 for EU15– not the best – differences within regions, often this is not the best – differences within regions, often this is
more formal than actual regionmore formal than actual region• Several typologies (points of view) usedSeveral typologies (points of view) used
– OECD rural typology –> 3 categories: Predominantly OECD rural typology –> 3 categories: Predominantly Urban, Significantly Rural, Predominantly RuralUrban, Significantly Rural, Predominantly Rural
– RurXA: an index reflecting the area shares of NUTS3 RurXA: an index reflecting the area shares of NUTS3 regions according their “rurality” -> 4 categoriesregions according their “rurality” -> 4 categories
– RurXGDP: an index reflecting the GDP shares of NUTS3 RurXGDP: an index reflecting the GDP shares of NUTS3 regions according their “rurality” -> 4 categoriesregions according their “rurality” -> 4 categories
– LFA share -> 5 categoriesLFA share -> 5 categories– Primary sector employment -> 4 categoriesPrimary sector employment -> 4 categories– Long term unemployment rate -> 4 categoriesLong term unemployment rate -> 4 categories

13
19/04/23 Ratinger ey al. CAP for Rural Areas 13
Relationship between Relationship between typologiestypologies
• More or less More or less clear clear referencereference
• RurXA and RurXA and RurXGDP RurXGDP split the split the category category “Significantl“Significantly rural” y rural”
Urban Rural
RurXA < 0.25
RurXA < 0.4
RurXA < 0.6
RurXA < 0.75
Predominantly urban 41 4 2 1
Significantly rural 3 45 48 13
Predominatly rural 1 1 7 44
RurXA < 0.25
RurXA < 0.4
RurXA < 0.6
RurXA > 0.6
RurXGDP< 0.25 45 13 9 0
RurXGDP< 0.4 0 37 17 2
RurXGDP< 0.6 0 0 31 24
RurXGDP> 0.6 0 0 0 32

14
19/04/23 Ratinger ey al. CAP for Rural Areas 14
LFA and Rural typologiesLFA and Rural typologies
• More LFA in more More LFA in more rural regionrural region
• Significantly rural Significantly rural regions – any share regions – any share of LFAof LFA
Predominantly urban
Significantly rural
Predominantly rural
LFA< 0.2 26 27 1
LFA< 0.4 13 18 4
LFA< 0.6 4 23 9
LFA< 0.8 3 21 12
LFA< 1 2 20 27

15
19/04/23 Ratinger ey al. CAP for Rural Areas 15
Primary sector employmentPrimary sector employment
• Less primary sector employment in “urban” Less primary sector employment in “urban” economieseconomies
• If “rural” economies (NUTS3) dominate If “rural” economies (NUTS3) dominate regional economy (NUTS2) then all primary regional economy (NUTS2) then all primary sector employment levels represented equally.sector employment levels represented equally.
UrbanRurXGDP< 0.25 RurXGDP< 0.4 RurXGDP< 0.6
RuralRurXGDP > 0.6
PrimSEmpl< 0.05 60 33 11 6
PrimSEmpl< 0.1 3 14 29 10
PrimSEmpl< 0.15 2 2 3 9
PrimSEmpl> 0.15 2 7 12 7

16
19/04/23 Ratinger ey al. CAP for Rural Areas 16
Long term unemploymentLong term unemployment
• Not clear reference Not clear reference to rural areasto rural areas
• Slightly more Slightly more unemployment in unemployment in areas with more areas with more rural featuresrural features
Predominantly urban
Significantly rural
Predominatly rural
Unempl< 2% 19 33 18
Unempl< 4% 19 33 16
Unempl< 6% 7 19 5
Unempl< 8%
1 3 7
Unempl> 8% 2 21 7

17
19/04/23 Ratinger ey al. CAP for Rural Areas 17
Spatial distribution effects of CAPSpatial distribution effects of CAP
• Output value, Subsidies, Income (€/ha) Output value, Subsidies, Income (€/ha)
– farms in SR exhibit around 80% of PU (Predominantly Urban) figuresfarms in SR exhibit around 80% of PU (Predominantly Urban) figures– in PR around 70% of PUin PR around 70% of PU– Subsidies are proportional to Revenue Subsidies are proportional to Revenue – (all statistically significant, ANOVA); (all statistically significant, ANOVA); – (no difference EU25 and EU15 in relative figures)(no difference EU25 and EU15 in relative figures)
The ratio to The ratio to PU valuesPU values
Revenue 2002
Support 2002
Income 2002
Revenue 2013
Support 2013
Income 2013
Significantly rural (SR) 83% 87% 88% 84% 76% 82%
Predominantly rural (PR) 69% 71% 71% 68% 68% 67%

18
19/04/23 Ratinger ey al. CAP for Rural Areas 18
Spatial distribution effects of CAPSpatial distribution effects of CAP
• Farms in the regions of high unemployment Farms in the regions of high unemployment get less subsidies, but might earn more per get less subsidies, but might earn more per ha of UAA than farms in the regions of low ha of UAA than farms in the regions of low unemployment.unemployment.
• (not in line with ESPON)(not in line with ESPON)
Revenue 02 Support 02 Income 02
Revenue 13 Support 13 Income 13
Unempl< 0.02 100% 100% 100% 100% 100% 100%
Unempl< 0.04 99% 88% 111% 100% 100% 137%
Unempl< 0.06 94% 94% 123% 95% 94% 146%
Unempl< 0.08 100% 74% 140% 94% 93% 187%
Unempl> 0.08 63% 54% 69% 65% 79% 112%

19
19/04/23 Ratinger ey al. CAP for Rural Areas 19
Effects of reform (in 2013)Effects of reform (in 2013)
• Relative change Relative change (y13-y02)/y02(y13-y02)/y02
• Equal territorial Equal territorial impact on impact on income in EU15income in EU15
• Distribution of Distribution of support (a support (a change) in change) in favour PUfavour PU
• Effect of NMS on Effect of NMS on Rural/Urban Rural/Urban balance in EU25balance in EU25
• Increased Increased support in NMS support in NMS
Total regional change EU25 EU15
IncomeSupport Income
Support
RurXA < 0.25 (PU) -12% 4% -12% 3%
RurXA < 0.4 -10% 15% -10% -5%
RurXA < 0.6 -8% 8% -9% -3%
RurXA < 0.75 (PR) -7% 23% -9% 0%Average of per EU25 EU15
hectare changeshectare changes IncomeSupport Income
Support
RurXA < 0.25 (PU) -11% 81% -12% 12%
RurXA < 0.4 -6% 246% -10% 4%
RurXA < 0.6 -8% 136% -12% 2%
RurXA < 0.75 (PR) -7% 147% -11% 0%

20
19/04/23 Ratinger ey al. CAP for Rural Areas 20
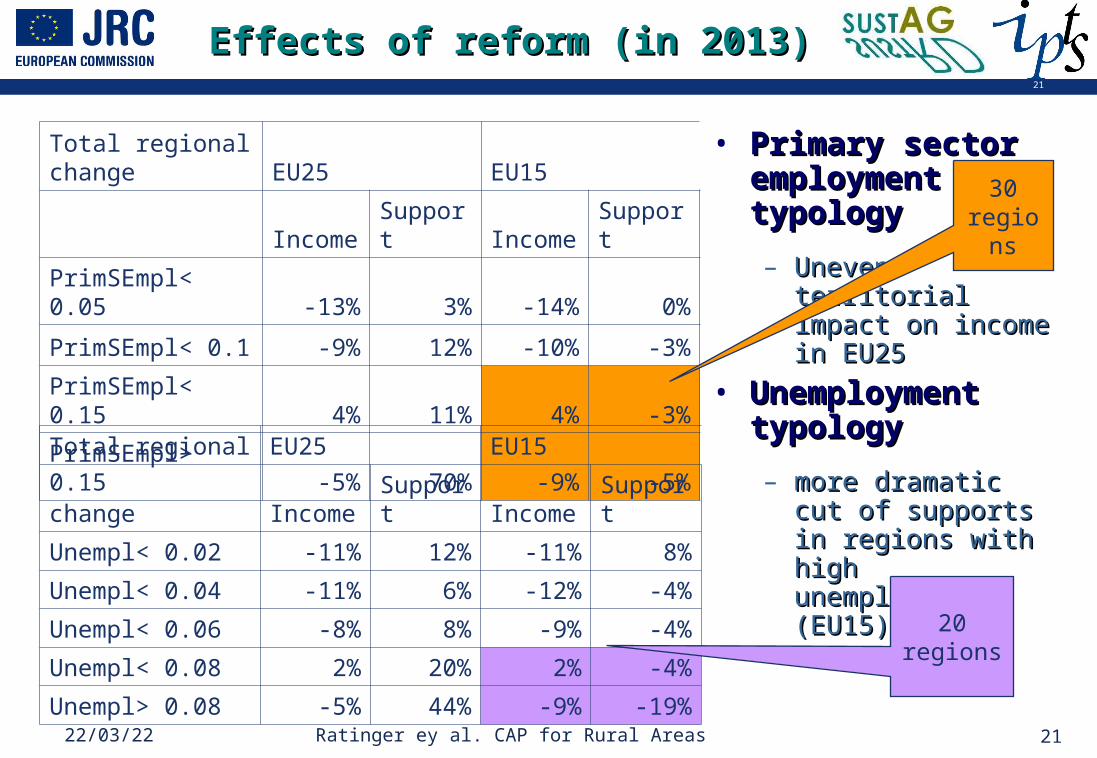
Effects of reform (in 2013)Effects of reform (in 2013)
• Primary sector Primary sector employment employment typologytypology
– Uneven territorial Uneven territorial impact on income impact on income in EU25in EU25
• Unemployment Unemployment typologytypology
– more dramatic cut more dramatic cut of supports in of supports in regions with high regions with high unemployment unemployment (EU15)(EU15)
Total regional change EU25 EU15
IncomeSupport Income
Support
PrimSEmpl< 0.05 -13% 3% -14% 0%
PrimSEmpl< 0.1 -9% 12% -10% -3%
PrimSEmpl< 0.15 4% 11% 4% -3%
PrimSEmpl> 0.15 -5% 70% -9% -5%Total regional EU25 EU15
change IncomeSupport Income
Support
Unempl< 0.02 -11% 12% -11% 8%
Unempl< 0.04 -11% 6% -12% -4%
Unempl< 0.06 -8% 8% -9% -4%
Unempl< 0.08 2% 20% 2% -4%
Unempl> 0.08 -5% 44% -9% -19%
21
19/04/23 Ratinger ey al. CAP for Rural Areas 21
Effects of reform (in 2013)Effects of reform (in 2013)
• Primary sector Primary sector employment employment typologytypology
– Uneven territorial Uneven territorial impact on income impact on income in EU25in EU25
• Unemployment Unemployment typologytypology
– more dramatic cut more dramatic cut of supports in of supports in regions with high regions with high unemployment unemployment (EU15)(EU15)
Total regional change EU25 EU15
IncomeSupport Income
Support
PrimSEmpl< 0.05 -13% 3% -14% 0%
PrimSEmpl< 0.1 -9% 12% -10% -3%
PrimSEmpl< 0.15 4% 11% 4% -3%
PrimSEmpl> 0.15 -5% 70% -9% -5%Total regional EU25 EU15
change IncomeSupport Income
Support
Unempl< 0.02 -11% 12% -11% 8%
Unempl< 0.04 -11% 6% -12% -4%
Unempl< 0.06 -8% 8% -9% -4%
Unempl< 0.08 2% 20% 2% -4%
Unempl> 0.08 -5% 44% -9% -19%
30 region
s
20 regions

22
19/04/23 Ratinger ey al. CAP for Rural Areas 22
Effects in respect of LFAEffects in respect of LFA
• Less income Less income impact in impact in regions with a regions with a high share of high share of LFALFA
• also smaller also smaller increase of increase of fallow landfallow land
Total regional change
EU25 EU15
Income Support Income Support
LFA< 0.2 -14% 12% -15% 3%
LFA< 0.4 -11% 22% -12% -2%
LFA< 0.6 -10% 24% -11% -10%
LFA< 0.8 -5% 7% -6% -3%
LFA< 1 -5% 2% -4% 0%
Total regional change
EU25 EU15
Fallow land Fallow land
LFA< 0.2 16% 16%
LFA< 0.4 23% 21%
LFA< 0.6 23% 11%
LFA< 0.8 9% 2%
LFA< 1 1% 1%

23
19/04/23 Ratinger ey al. CAP for Rural Areas 23
CAP reform income on fallow landCAP reform income on fallow land
• Increase of fallow Increase of fallow land due to reformland due to reform
– seemingly even seemingly even distribution if EU25 distribution if EU25 consideredconsidered
– but different (statistically but different (statistically significant) rates of significant) rates of change if only EU15 change if only EU15 consideredconsidered
– higher relative change in higher relative change in urban areas of EU15 and urban areas of EU15 and rural areas of EU10rural areas of EU10
Total regional change EU25 EU15
Fallow land Fallow land
RurXA < 0.25 (PU) 12% 13%
RurXA < 0.4 9% 5%
RurXA < 0.6 13% 8%
RurXA < 0.75 (PR) 13% 4%

24
19/04/23 Ratinger ey al. CAP for Rural Areas 24
ConclusionsConclusions
• Higher income, more supports in “urban” Higher income, more supports in “urban” regions regions
• For EU 15, the 2003 CAP reform is For EU 15, the 2003 CAP reform is territorially neutral (for income)territorially neutral (for income)
• Adoption of CAP increases income in EU10, Adoption of CAP increases income in EU10, more in “rural” regions.more in “rural” regions.
• Less income impact in regions with a high Less income impact in regions with a high share of LFA share of LFA
• Fallow land will increase (more in “urban” Fallow land will increase (more in “urban” regions and in agr. “favoured” areas)regions and in agr. “favoured” areas)