the impact of dmo websites - destination · pdf fileresearch conducted for the dma west...
TRANSCRIPT

Research conducted for the DMA West Education & Research Foundation by Destination Analysts, Inc.
THE IMPACT OF
DMO WEBSITES
DMO Website
User & Conversion Study

With You Today
Erin Francis-CummingsPresident & CEO
Kimberly Vince-CruzSenior Director of Research
David ReichbachDirector of Analytics & Data Security

Agenda
• Travelers’ Relationship to DMO Websites
• Research Overview & Methodology
• Who Uses DMO Websites
• How DMO Websites are Used
• Influence of DMO Websites
• Economic Impact

BACKGROUND:
TRAVELERS’ RELATIONSHIP TO DMO WEBSITES


36.2%

Background: Travelers’ Use of DMO Websites
American Leisure Travelers’ Use of DMO Websites—2009-2017
26.7%
33.9%
31.2%
33.9%
28.2%
30.4%
28.4%29.8%
33.8%
30.3%
31.0%
30.1%32.9%
36.4%
32.4%
36.2%
0%
5%
10%
15%
20%
25%
30%
35%
40%
*Source: Destination Analysts’ The State of the American TravelerTM , a quarterly national survey of 2,000+ American leisure travelers
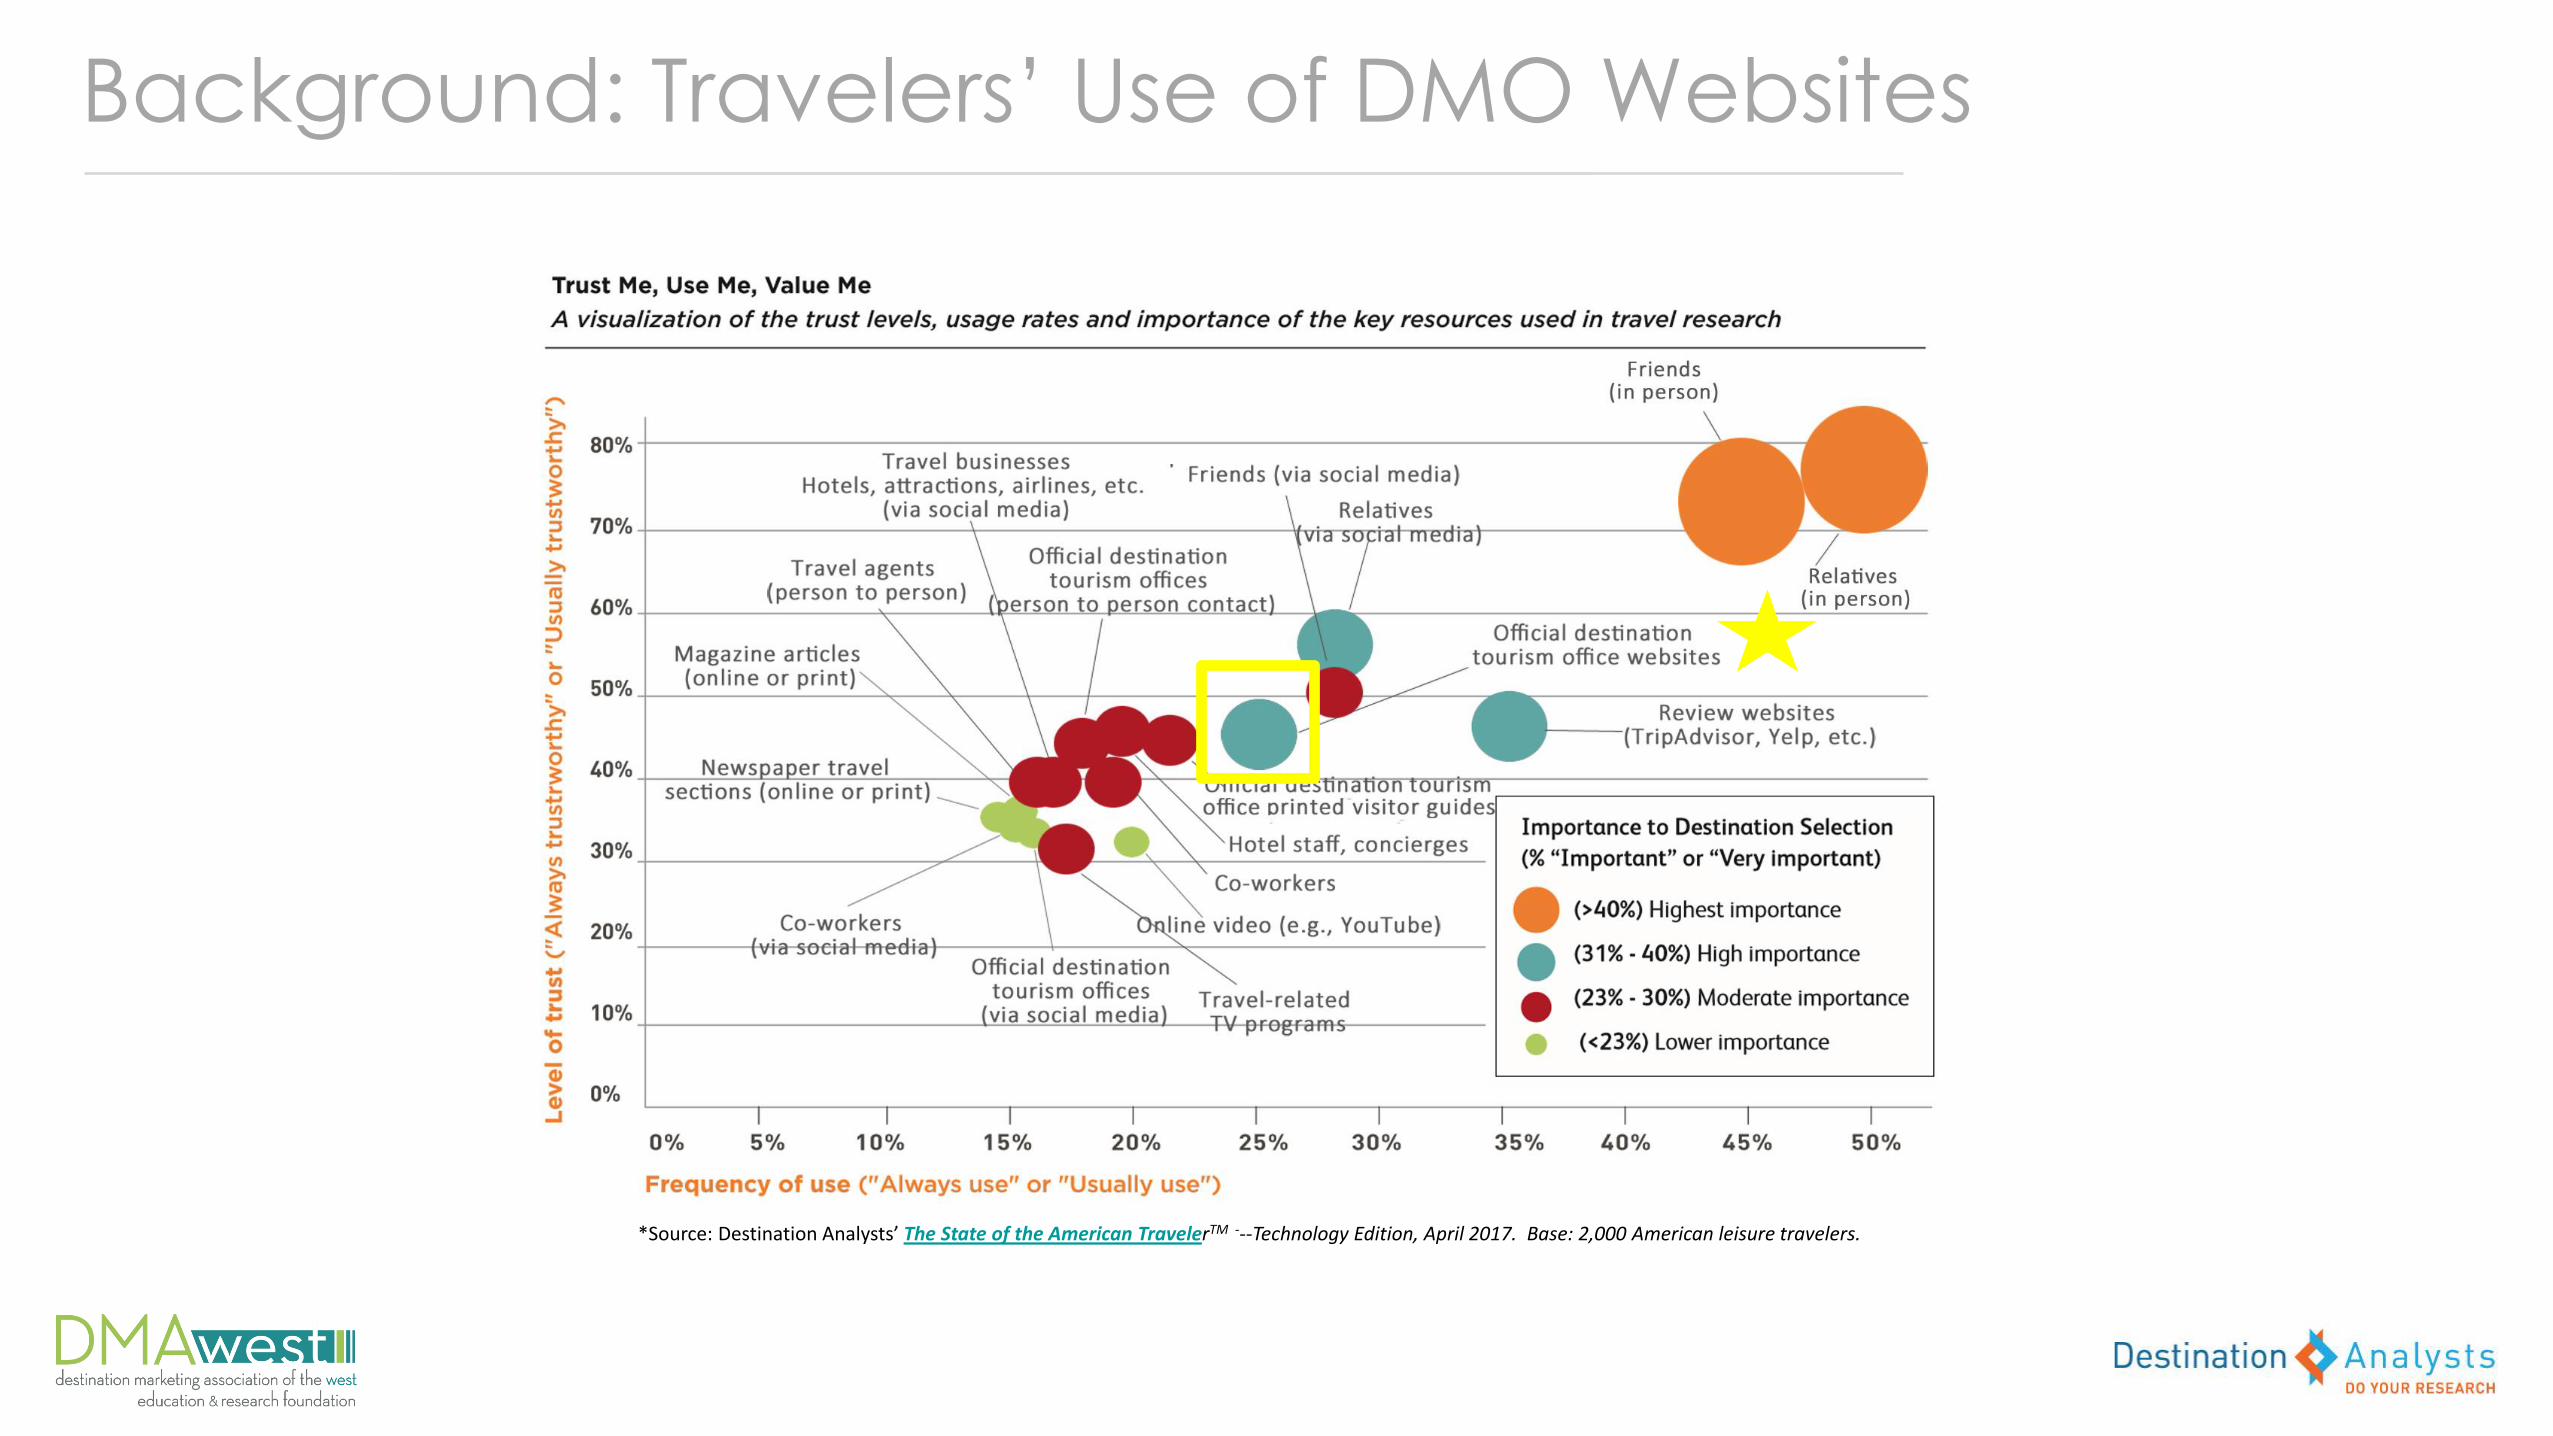
Background: Travelers’ Use of DMO Websites
*Source: Destination Analysts’ The State of the American TravelerTM ---Technology Edition, April 2017. Base: 2,000 American leisure travelers.

Source: Destination Analysts; Usability studies of 8 DMO websites, July 2016-March 2017.
Background—Users’ Perceptions of DMO Websites
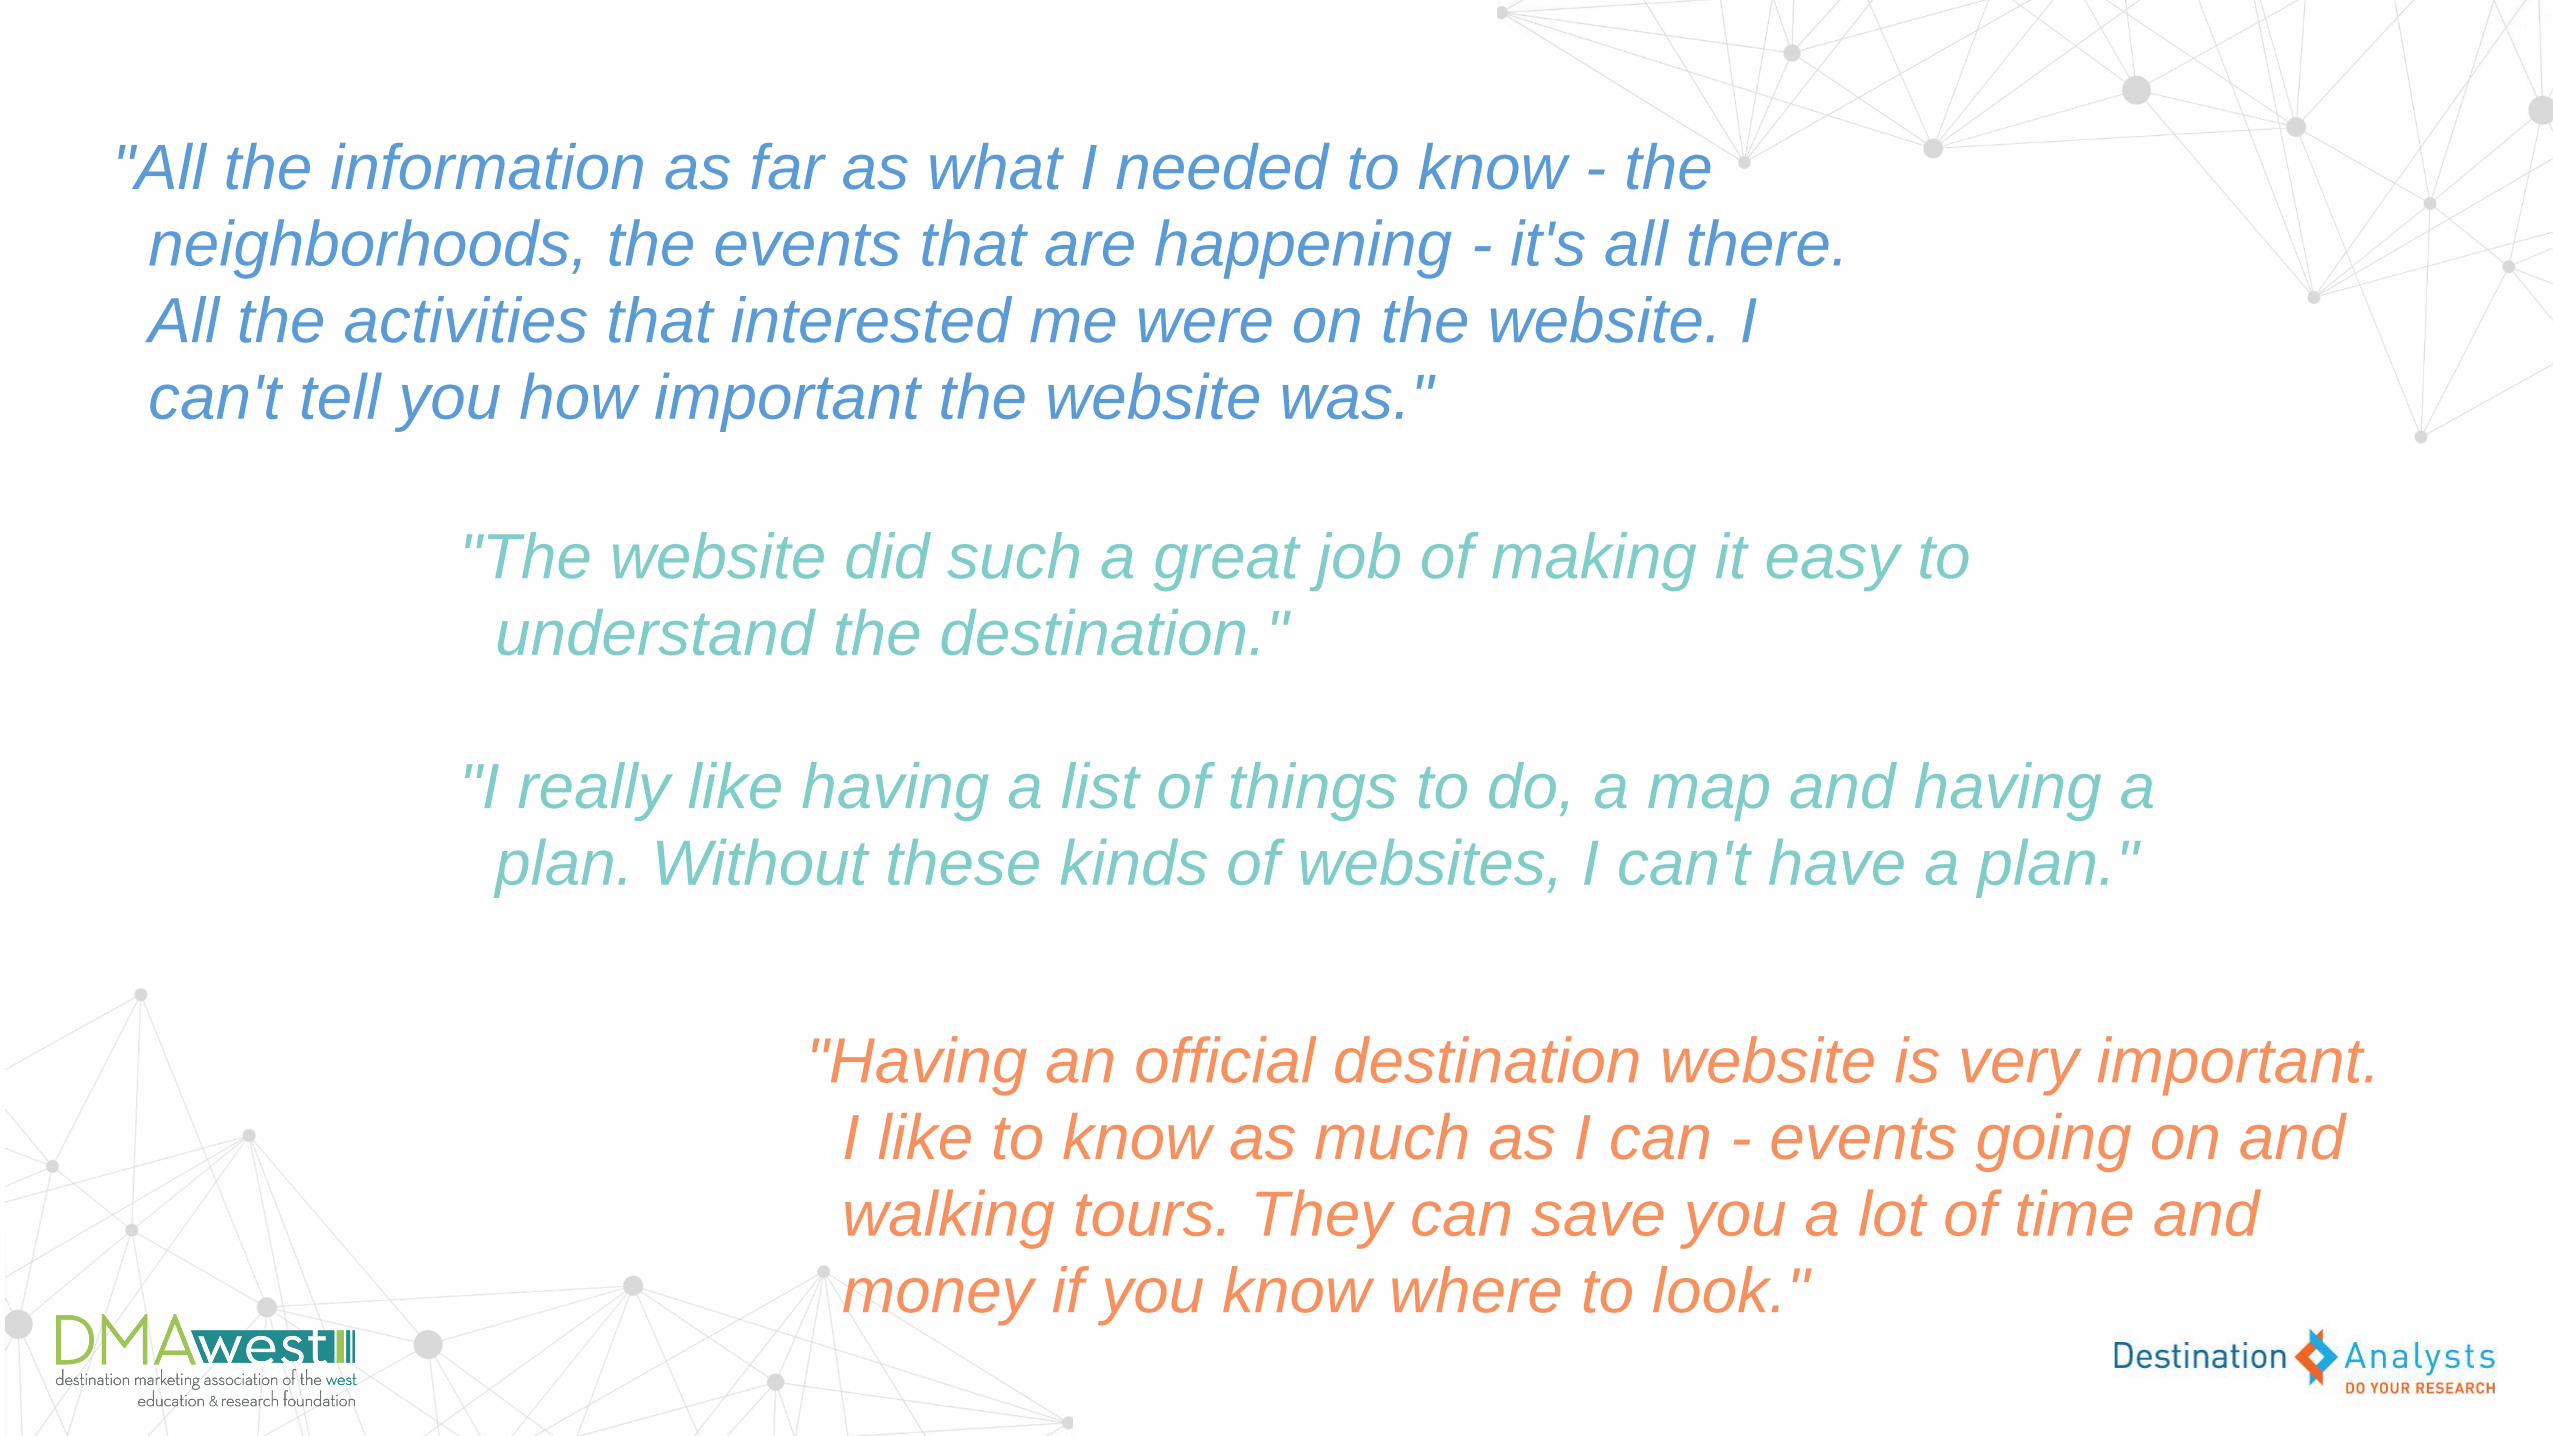
"All the information as far as what I needed to know - the
neighborhoods, the events that are happening - it's all there.
All the activities that interested me were on the website. I
can't tell you how important the website was."
"The website did such a great job of making it easy to
understand the destination."
"I really like having a list of things to do, a map and having a
plan. Without these kinds of websites, I can't have a plan."
"Having an official destination website is very important.
I like to know as much as I can - events going on and
walking tours. They can save you a lot of time and
money if you know where to look."


DMO WEBSITE USER & CONVERSION STUDY:
RESEARCH OVERVIEW & METHODOLOGY

Research Overview
Thank you:
Above: Logos of participating DMA West member DMO’s.

Research Objectives
This research was designed primarily to:
• Determine the Visitor Spending Impact and ROI DMO Websites
Produce for their Communities
• Develop Profiles of DMO Website Users
• Use the Voice of the User to Produce More In-Depth
Performance Metrics for DMO Websites

Methodology
Dual Survey Approach
• Website User Intercept Survey
• Website User Follow-Up Survey
Above: Screenshots of the Website Intercept Survey on participating DMO website homepages.
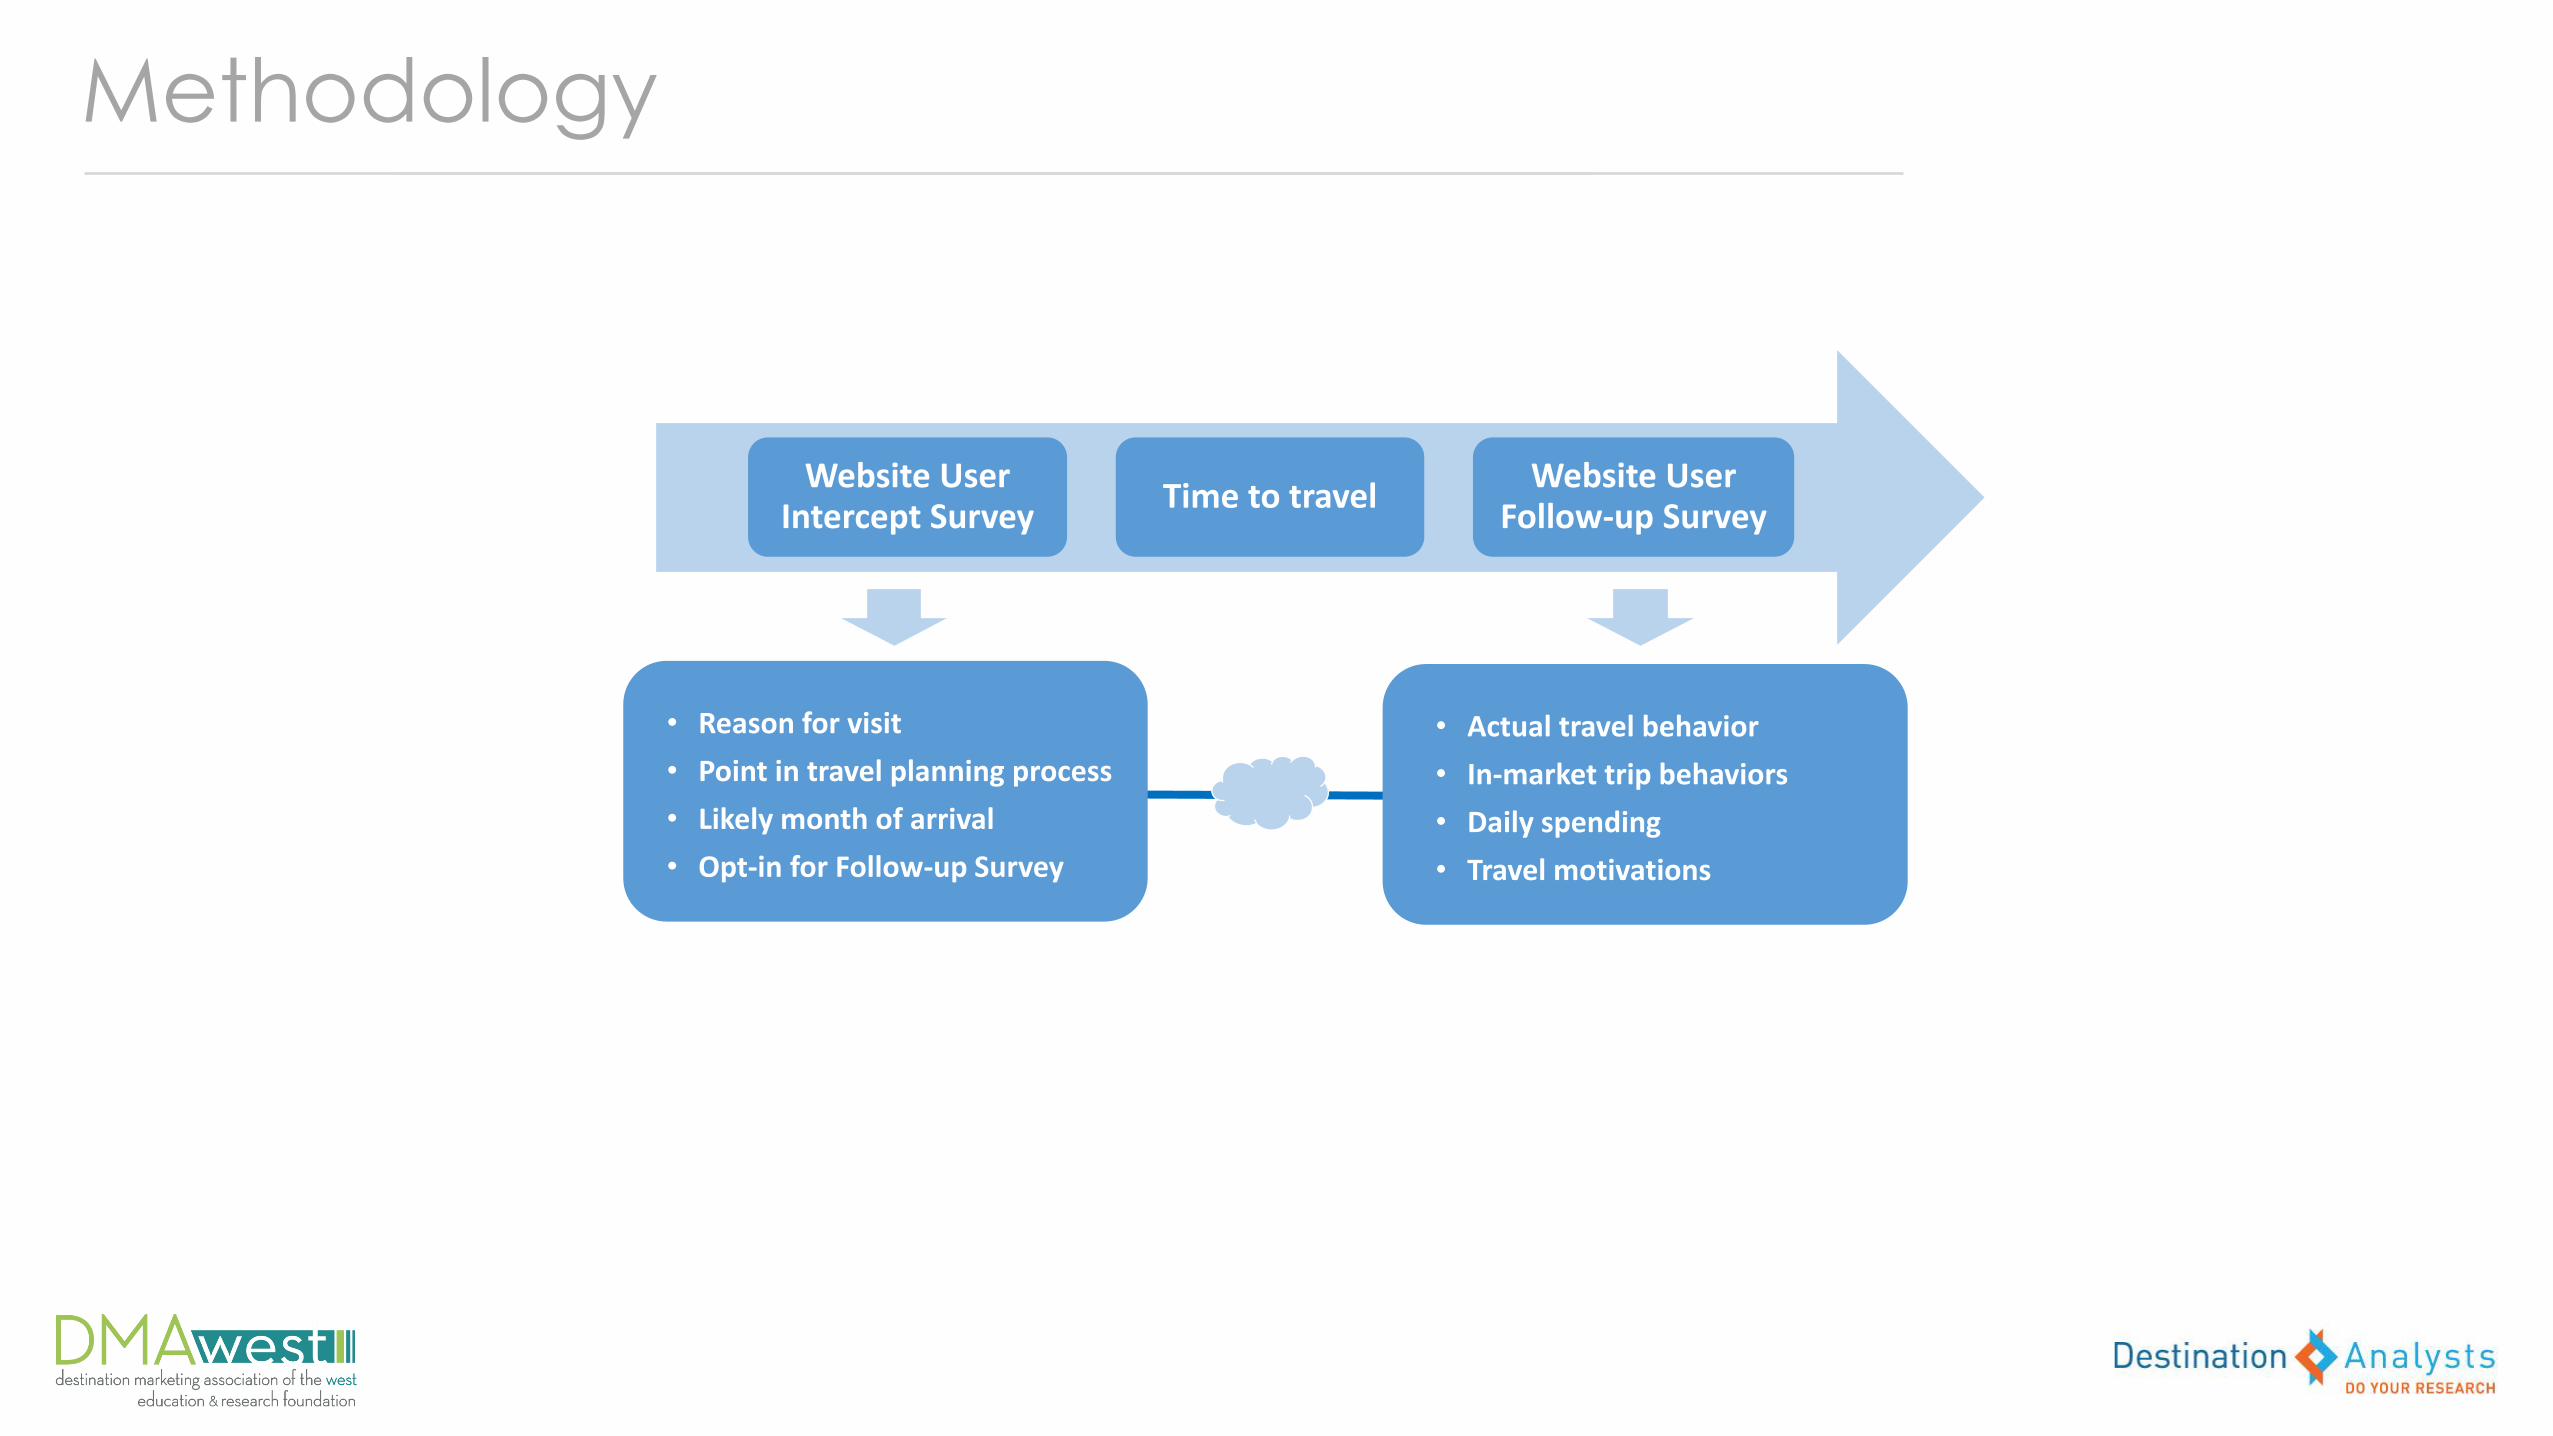
Methodology
Website User Intercept Survey
Time to travel Website User
Follow-up Survey
• Reason for visit
• Point in travel planning process
• Likely month of arrival
• Opt-in for Follow-up Survey
• Actual travel behavior
• In-market trip behaviors
• Daily spending
• Travel motivations

• Pages viewed
• KPIs
• Other site behaviors
• Device used to access site
• Type of user
• Point in travel decision process
• Age
• Content sought
Methodology
USER SURVEY

Economic Impact
Trips Generated
$$$$
Trips Extended
$$$$
Total ROI
$$$$
What we measure
• Incremental trips
• Additional days on extended stays
What we measure
• Direct visitor spending in the destination that is generated by the website
• Visitor spending in the destination that would not have occurred in the
absence of the website

DMO Website Users Surveyed
379,966

WHO USES DMO WEBSITES

Types of DMO Website Users
64.8%
13.7%
1.6% 0.7%0%
20%
40%
60%
80%
AverageType of Website User(All survey respondents)
Question: Which of the following best describes you? Base: All survey respondents. 379,966 completed surveys.

59.0%
28.6%
9.9%2.5%
0%
20%
40%
60%
80%
Average
Point in Travel Decision Process
Subject to influence in making the destination decision
38.5%
Point in Travel Decision Process (Respondents gathering information for a trip)
Question: Which best describes where you are in the trip planning process? (Select one)Base: Respondents gathering information for a trip. 231,789 completed surveys.
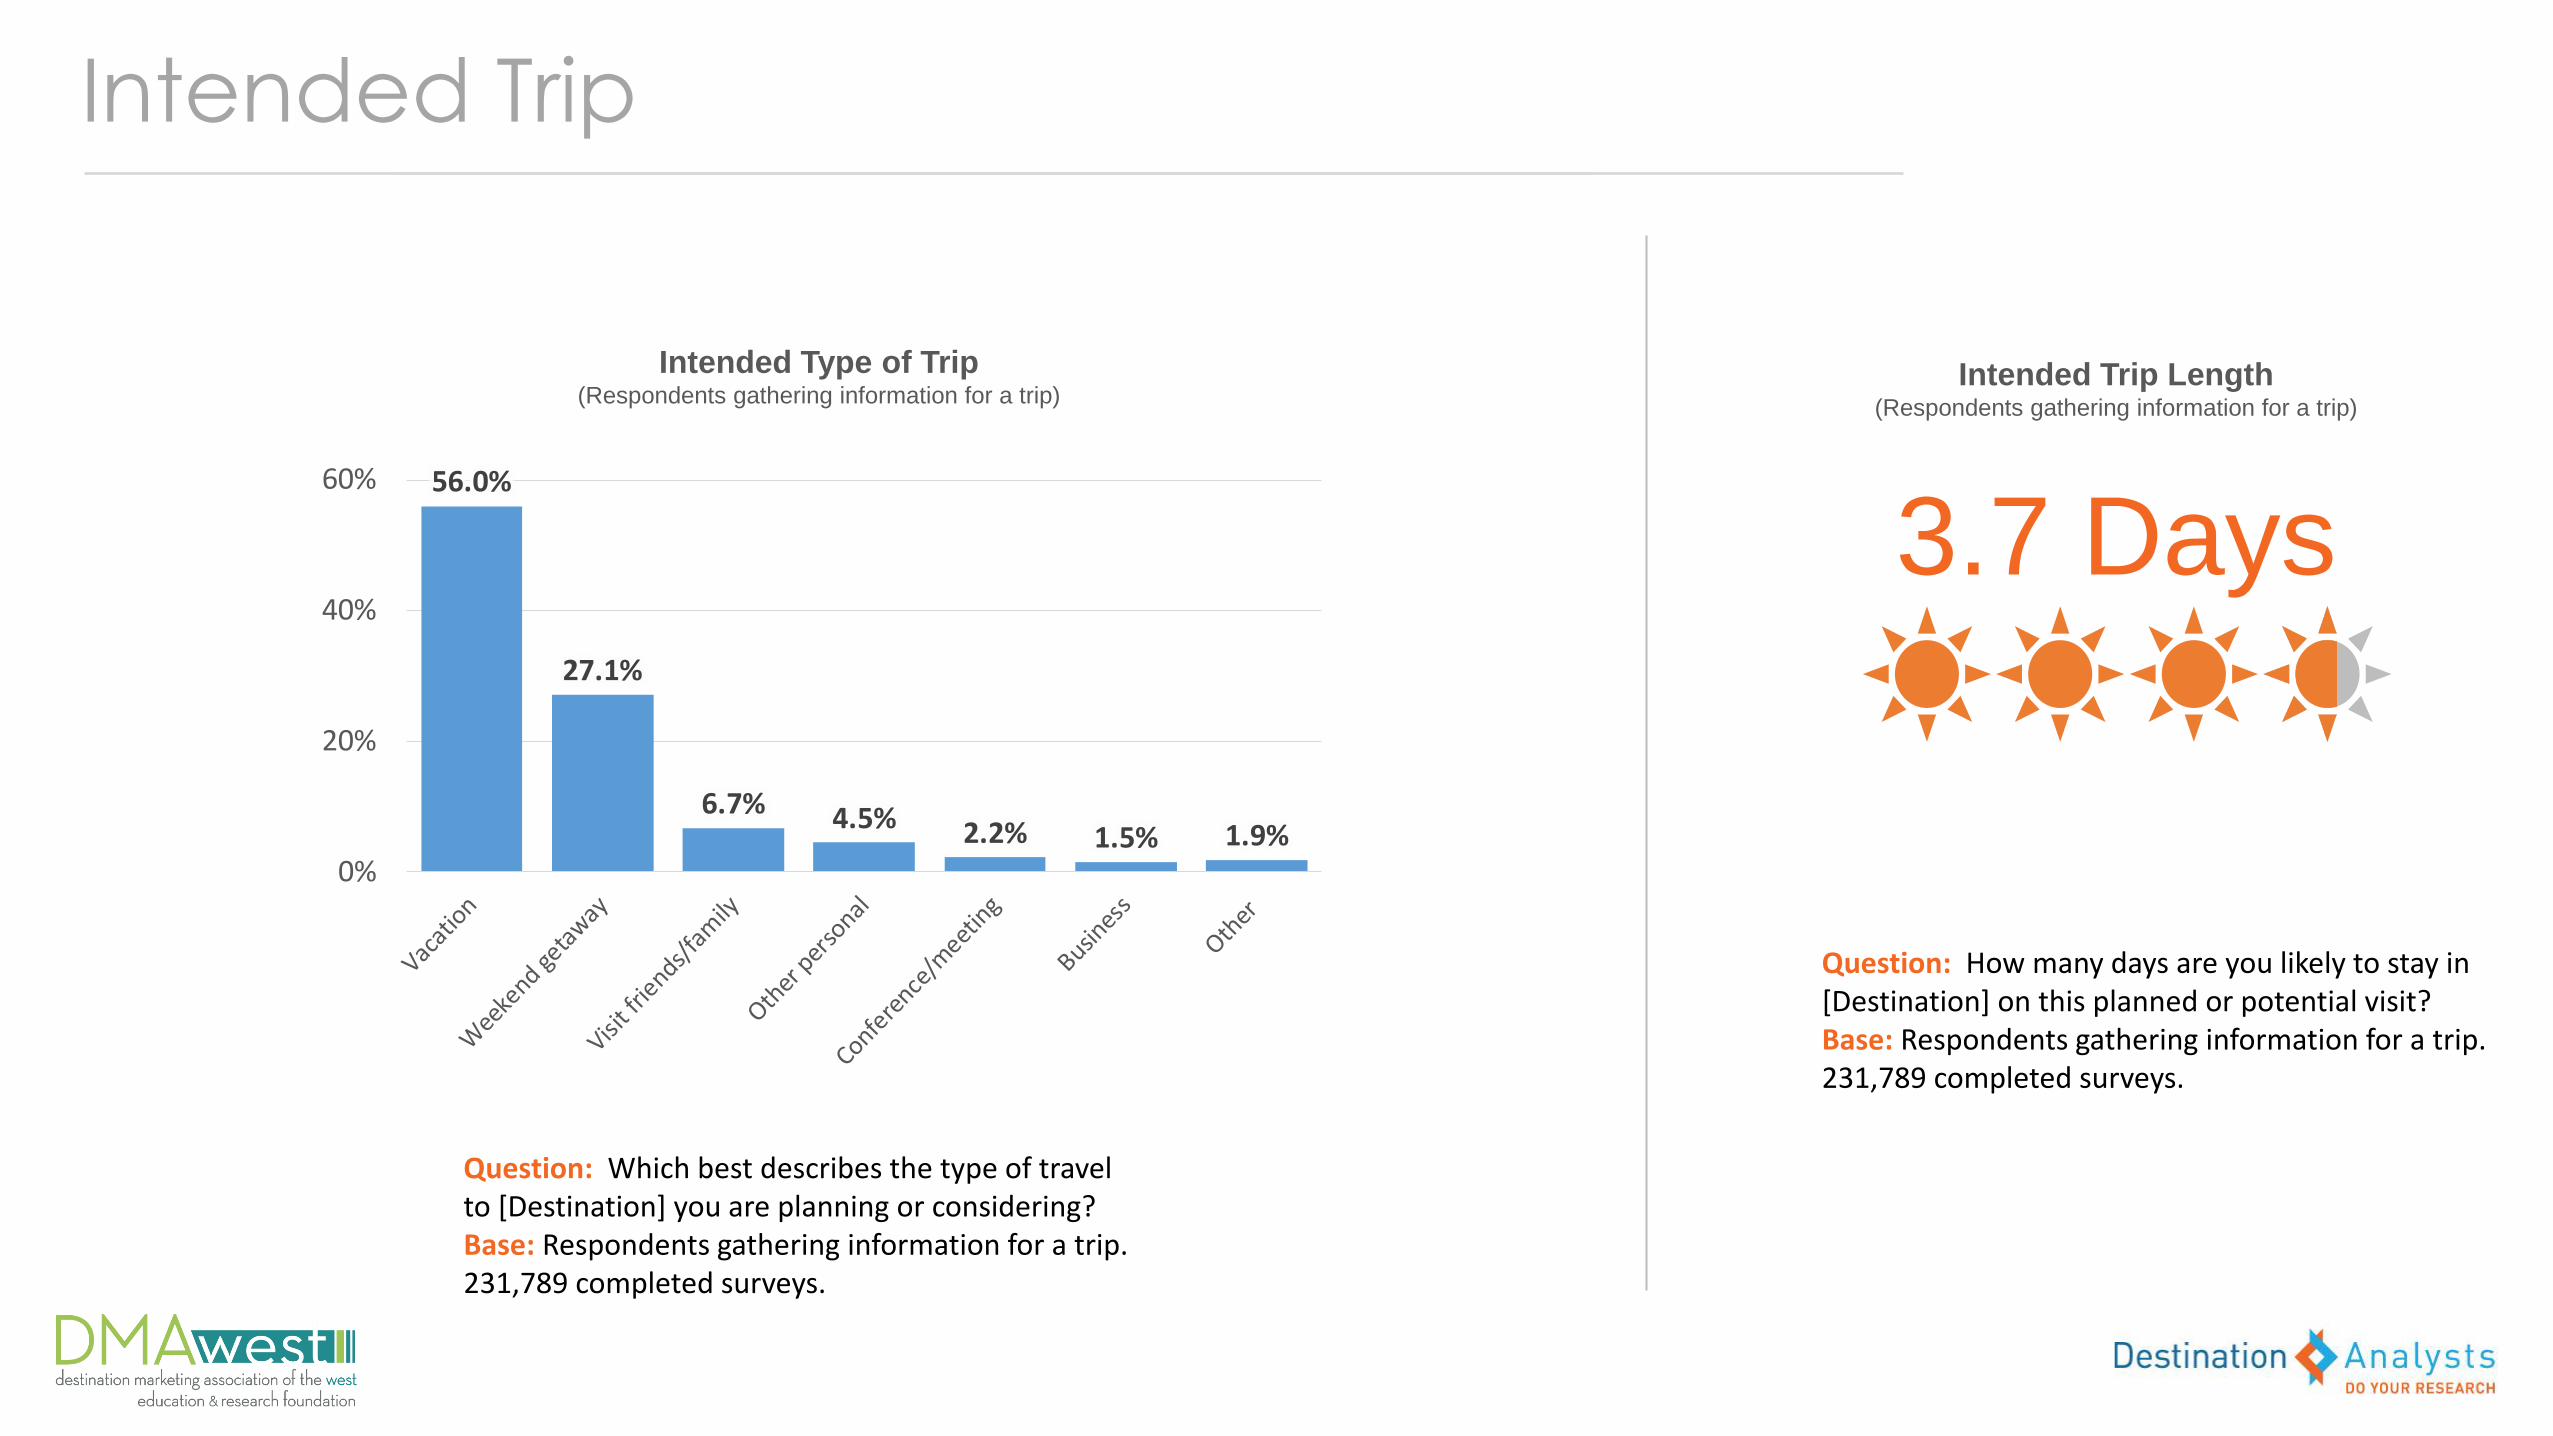
Intended Trip
56.0%
27.1%
6.7% 4.5% 2.2% 1.5% 1.9%0%
20%
40%
60%
Average
3.7 Days
Intended Type of Trip(Respondents gathering information for a trip)
Intended Trip Length(Respondents gathering information for a trip)
Question: Which best describes the type of travel to [Destination] you are planning or considering?Base: Respondents gathering information for a trip. 231,789 completed surveys.
Question: How many days are you likely to stay in [Destination] on this planned or potential visit?Base: Respondents gathering information for a trip. 231,789 completed surveys.

78.0% of site users who were potential visitors visited the destination after using the
DMO website
Visitation to the Destination after using the DMO Website
Visited the Destination(All follow-up survey respondents)
Question: Since visiting our website, have you visited [Destination]? Base: All follow-up survey respondents. 21,475 completed surveys.

Visiting DMO Website Users—Trip Profile
61.3%
15.9%10.9%
4.4% 3.7% 1.9% 1.8%0%
20%
40%
60%
80%
Average
4.23.5
2
4
6
AverageType of Trip(Respondents who visited after using the website)
Average Length of Stay(Respondents who visited after using the website)
Question: Which of the following best describes the reason for your most recent trip to [Destination]? Base: Respondents who visited after using the website. 16,756 completed surveys.
Question: How many total days and nights did you spend in [Destination] on this trip? Base: Respondents who visited after using the website. 16,756 completed surveys.

$136.69
$94.17
$62.26 $60.92
$30.45
$7.55$0
$50
$100
$150
$200
Average
Visiting DMO Website Users—Trip Detail
58.6%
10.0% 11.0%2.9%
7.8% 4.3% 4.9% 8.1%
0%
20%
40%
60%
80%
Average
Average Daily Spend = $392
Place of Stay(Respondents who visited after using the website)
Spending Per Travel Party, Per Day(Respondents who visited after using the website)
Question: While on this trip, where did you stay in [Destination]? (Select all that apply)Base: Respondents who visited after using the website. 16,756 completed surveys.
Question: While on this trip, approximately how much IN TOTAL did you spend PER DAY while in [Destination] on each of the following?Base: Respondents who visited after using the website. 16,756 completed surveys.

Digital Visitors Guide
Printed Visitors Guide
YouTube
0% 20% 40% 60%
50.9%
26.4%
10.4%
8.9%
3.7%
2.0%
1.7%
14.1% Also used at least one DMO social media asset
Visiting DMO Website Users—Other DMO Resources Used
Official DMO Resources Used(Respondents who visited after using the website)
Question: Which of these other resources did you use to plan your trip to [Destination]?Base: Respondents who visited after using the website. 16,756 completed surveys.

DMO Website Users—Demographics
Female – 65.0%Male – 34.3%
Mean age – 49.2
Mean household income – $95,664
College or graduate degree – 72.2%
Married/partnered – 72.9%
Single – 22.1%
Children under 18 – 21.9%
Caucasian ethnicity – 74.6%Non-Caucasian ethnicity – 25.4%
Base: Respondents who visited after using the website. 16,756 completed surveys.

HOW DMO WEBSITES ARE USED

DMO WEBSITE USE
BY TRAVEL PLANNING STAGE
Decided
Interested Considering

DECIDED
INTERESTED
CONSIDERING
5.6
4.2
00:09:10
00:07:15
Average Number of Page Views Average Session Duration Percent of New Users
Of potential visitors who already decided to visit are new users
Of potential visitors who are considering travel destinations are new users
85.8%
90.9%
4.9 00:08:24 94.5%Of potential visitors who are interested in visiting are new users
DMO WEBSITE USE—BY TRAVEL PLANNING STAGE
Source: Google Analytics & Destination Analysts’ DMO Website User Intercept Survey

DECIDED
INTERESTED
CONSIDERING
Site Acquisition Top 5 Page Types
Organic Search (64.1%) Paid Search (5.6%)
Direct (10.9%) Referral (8.5%)
Organic Search (56.3%) Paid Search (6.6%)
Direct (9.7%) Referral (10.6%)
Organic Search (55.7%) Paid Search (7.2%)
Direct (9.1%) Referral (10.3%)
Event CalendarThings to DoTravel Guide & Email Newsletter RequestDeals/PromotionsMaps/Map Request
Articles/Travel BlogTravel Guide & Email Newsletter RequestThings to DoMaps/Map RequestThings to Do—Specific
Articles/Travel BlogThings to DoTravel TipsEvent CalendarMaps/Maps Request
Source: Google Analytics & Destination Analysts’ DMO Website User Intercept Survey
DMO WEBSITE USE—BY TRAVEL PLANNING STAGE

DMO WEBSITE USE
BY GENERATIONMillennials
Gen Xers Baby Boomers
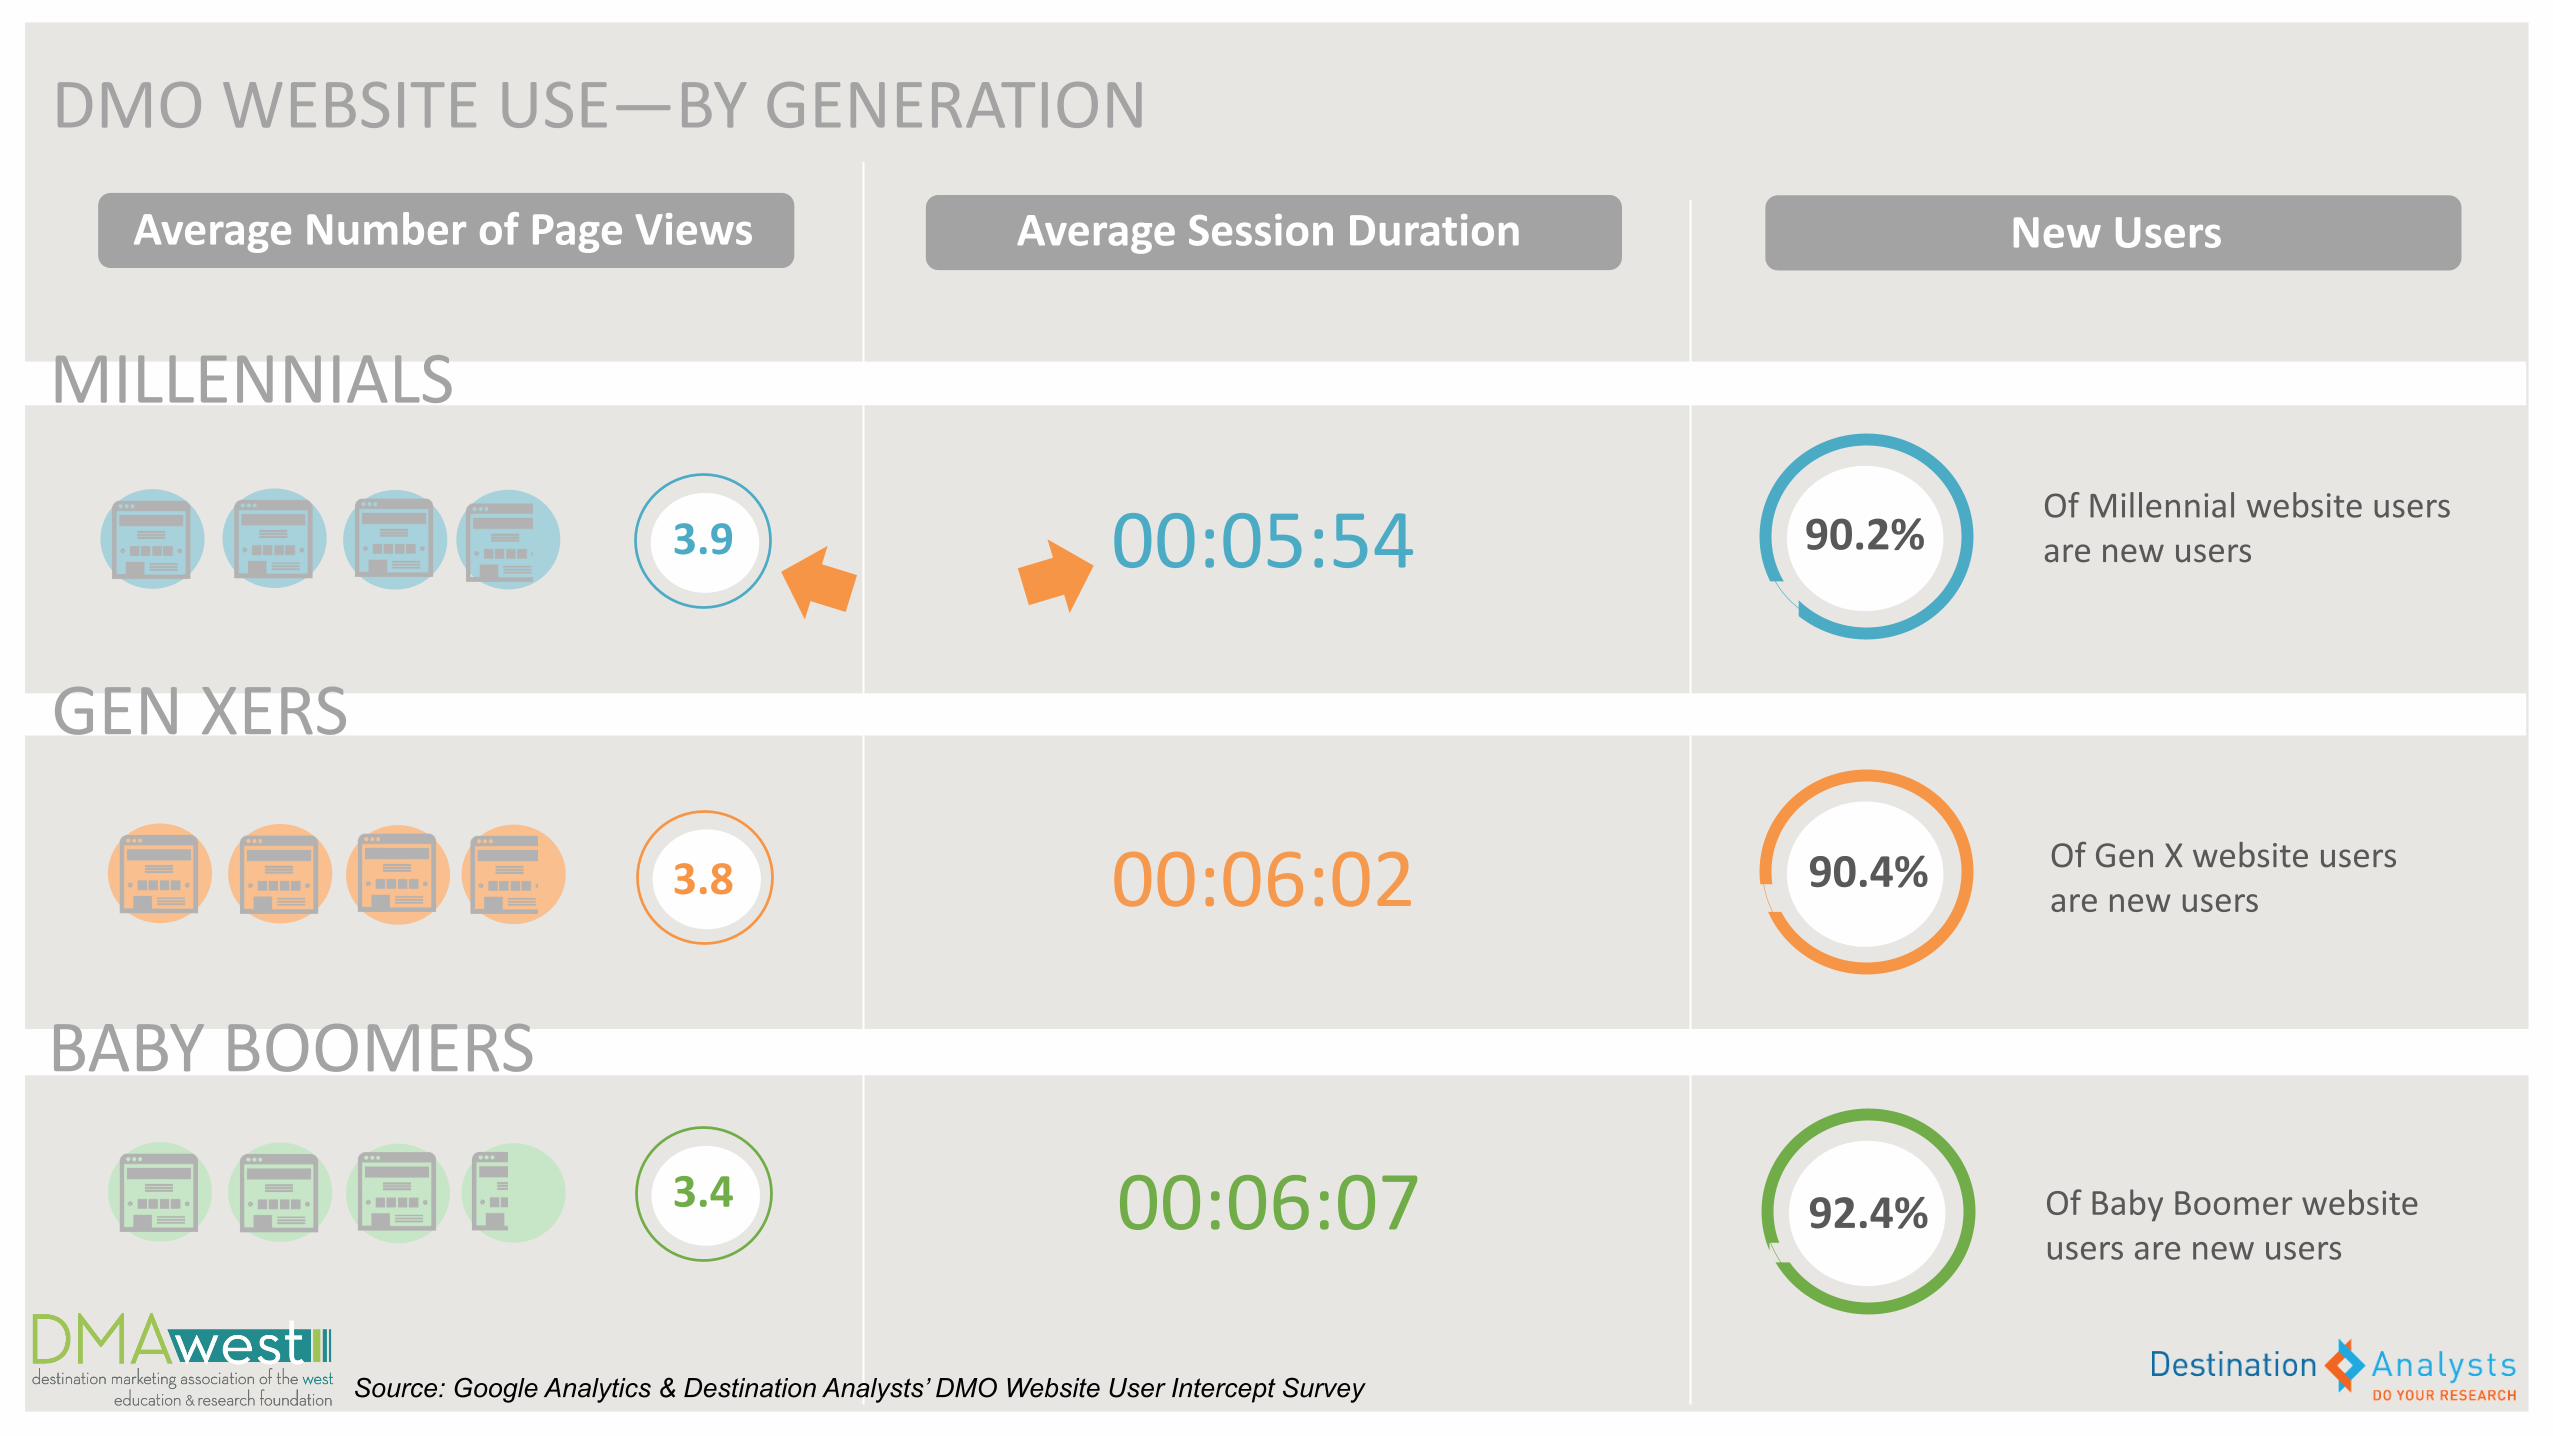
MILLENNIALS
GEN XERS
BABY BOOMERS
3.9
3.4
00:05:54
00:06:07
Average Number of Page Views Average Session Duration New Users
Of Millennial website users are new users
Of Baby Boomer website users are new users
90.2%
92.4%
3.8 00:06:02 90.4% Of Gen X website users are new users
DMO WEBSITE USE—BY GENERATION
Source: Google Analytics & Destination Analysts’ DMO Website User Intercept Survey

MILLENNIALS
GEN XERS
BABY BOOMERS
Site Acquisition
Organic Search (64.1%) Paid Search (6.9%)
Direct (11.1%) Referral (8.7%)
Organic Search (52.2%) Paid Search (10.8%)
Direct (13.3%) Referral (9.1%)
Organic Search (47.7%) Paid Search (8.8%)
Direct (15.8%) Referral (8.3%)
DMO WEBSITE USE—BY GENERATION
Top 5 Page Types
Event CalendarThings to DoThings to Do—SpecificEvent Calendar/Specific EventVisitor Information
Event CalendarThings to DoTravel Guide & Newsletter RequestItineraries/PlanningEvent Calendar—Specific Event
Event CalendarTravel Guide & Newsletter RequestThings to DoVisitor InformationMap Request
Source: Google Analytics & Destination Analysts’ DMO Website User Intercept Survey

DMO WEBSITE USE
BY DEVICE TYPE

51.7%
32.8%
11.5%4.0%
0%
20%
40%
60%
80%66.3%
24.3%
8.4%1.0%
0%
20%
40%
60%
80%
Point in Travel Decision Process
Point in Travel Decision Process—Mobile Users (Respondents gathering information for a trip on a mobile device)
Point in Travel Decision Process—Desktop Users (Respondents gathering information for a trip on a desktop)
44.3% 32.7%

DMO WEBSITE USE—BY DEVICE TYPE
MOBILE
Average Number of Page Views Average Session Duration New Users
00:03:40 92.3% Of mobile usersare new users
2.9
DESKTOP
4.8 00:06:40 90.0% Of desktop usersare new users
Source: Google Analytics & Destination Analysts’ DMO Website User Intercept Survey
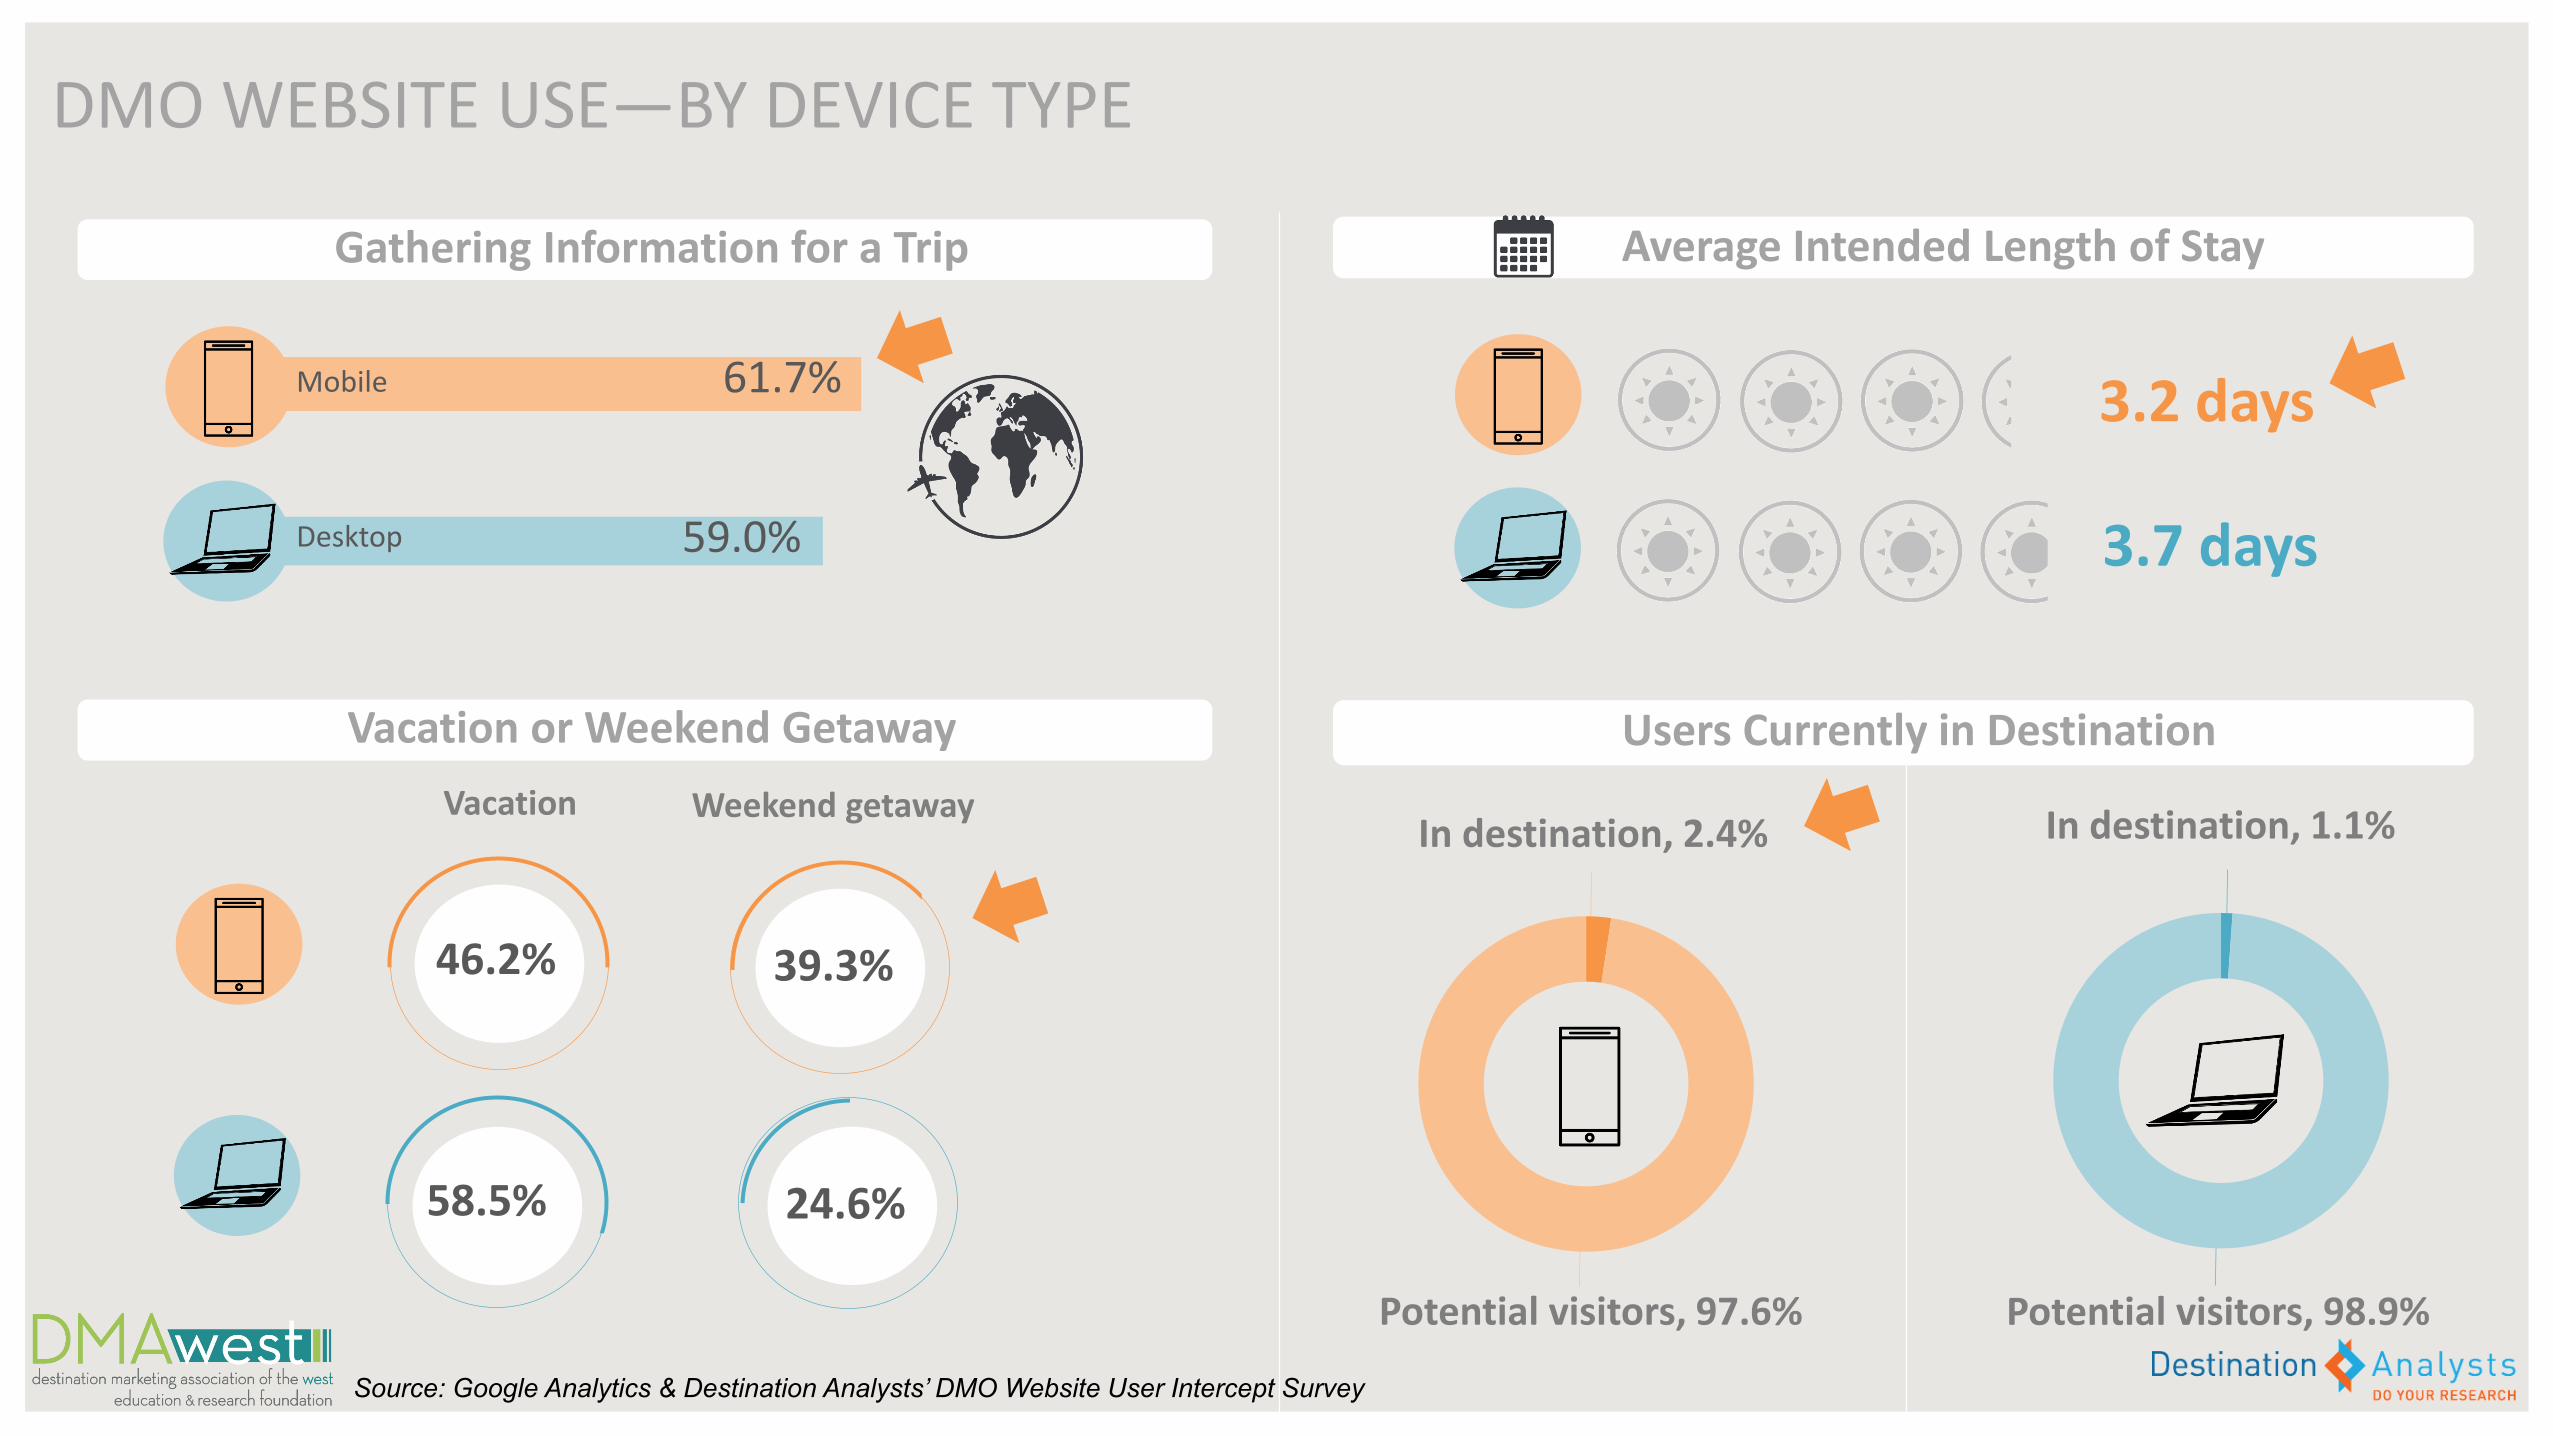
Gathering Information for a Trip
59.0%
61.7%Mobile
Desktop
Vacation Weekend getaway
46.2% 39.3%
24.6%58.5%
Average Intended Length of Stay
3.2 days
3.7 days
Vacation or Weekend Getaway
Potential visitors, 97.6%
Users Currently in Destination
In destination, 2.4%
Potential visitors, 98.9%
In destination, 1.1%
DMO WEBSITE USE—BY DEVICE TYPE
Source: Google Analytics & Destination Analysts’ DMO Website User Intercept Survey

DMO WEBSITE USE
BY USER TYPE
Potential Visitors
Meeting Planners Journalists

POTENTIAL VISITORS
MEETING PLANNERS
JOURNALISTS
DMO WEBSITE USE—BY USER TYPE
Top 5 Page Types
Event CalendarThings to DoTravel Guide & Newsletter RequestItineraries/PlanningMap Request
Event CalendarThings to DoWeddingsDiningEvent Calendar/Specific Event
Event CalendarPlaces to Stay Event Calendar/Specific Event General Destination InformationItineraries/Planning
Source: Google Analytics & Destination Analysts’ DMO Website User Intercept Survey
No Meetings Page
No Media/Press Page

THE INFLUENCE OF
DMO WEBSITES

16.5%
34.3%38.6%
7.5%3.1%
0%
20%
40%
60%
Average
Impact of DMO Website on Destination Decision
Impact of Website on Destination Decision – % Influenced(Visitors potentially influenced by the website in the destination decision)
Importance of Website on Destination Decision(Visitors who reported that the website influenced their destination decision)
50.8%
62.5%
Question: Do you feel that our website helped you make your decision to visit [Destination]?Base: Visitors potentially influenced by the website in the destination decision. 15,706 completed surveys.
Question: How important was our website to you in making the decision to visit [Destination]? Base: Visitors who reported that the website influenced their destination decision. 9,832 completed surveys.

Impact of DMO Website on Length of Stay
67.4%
31.0%
1.5%0%
20%
40%
60%
80%
Average
1.7 days
Average Increase on Length of Stay(Visitors who reported that the website influenced their length of stay)
Impact of Website on Length of Stay (Visitors potentially influenced by the website in their length of stay*)
Question: How did our website influence the number of days you spent in [Destination] on this trip?Base: Visitors potentially influenced by the website in their length of stay. 1,162 completed surveys.
Question: How many days did you increase the length of your stay in [Destination] as a result of using our website? Base: Visitors who reported that the website influenced their length of stay. 784 completed surveys.*Includes business or conference travelers, as well as leisure visitors, who reported that the
website did not influence their destination decision but did influence their length of stay.

Trip Decisions Influenced by DMO Website
Do more activities
Visit an attraction
Visit a neighborhood
Visit a restaurant
Attend an event
Stay in a hotel
56.0%
51.8%
41.4%
30.8%
15.5%
12.3%
0% 10% 20% 30% 40% 50% 60%
Trip Decisions Influenced by Website(Respondents who visited after using the website)
Question: Did [website] influence you to do any of the following? (Please select all that apply)Base: Respondents who visited after using the website. 16,756 completed surveys.
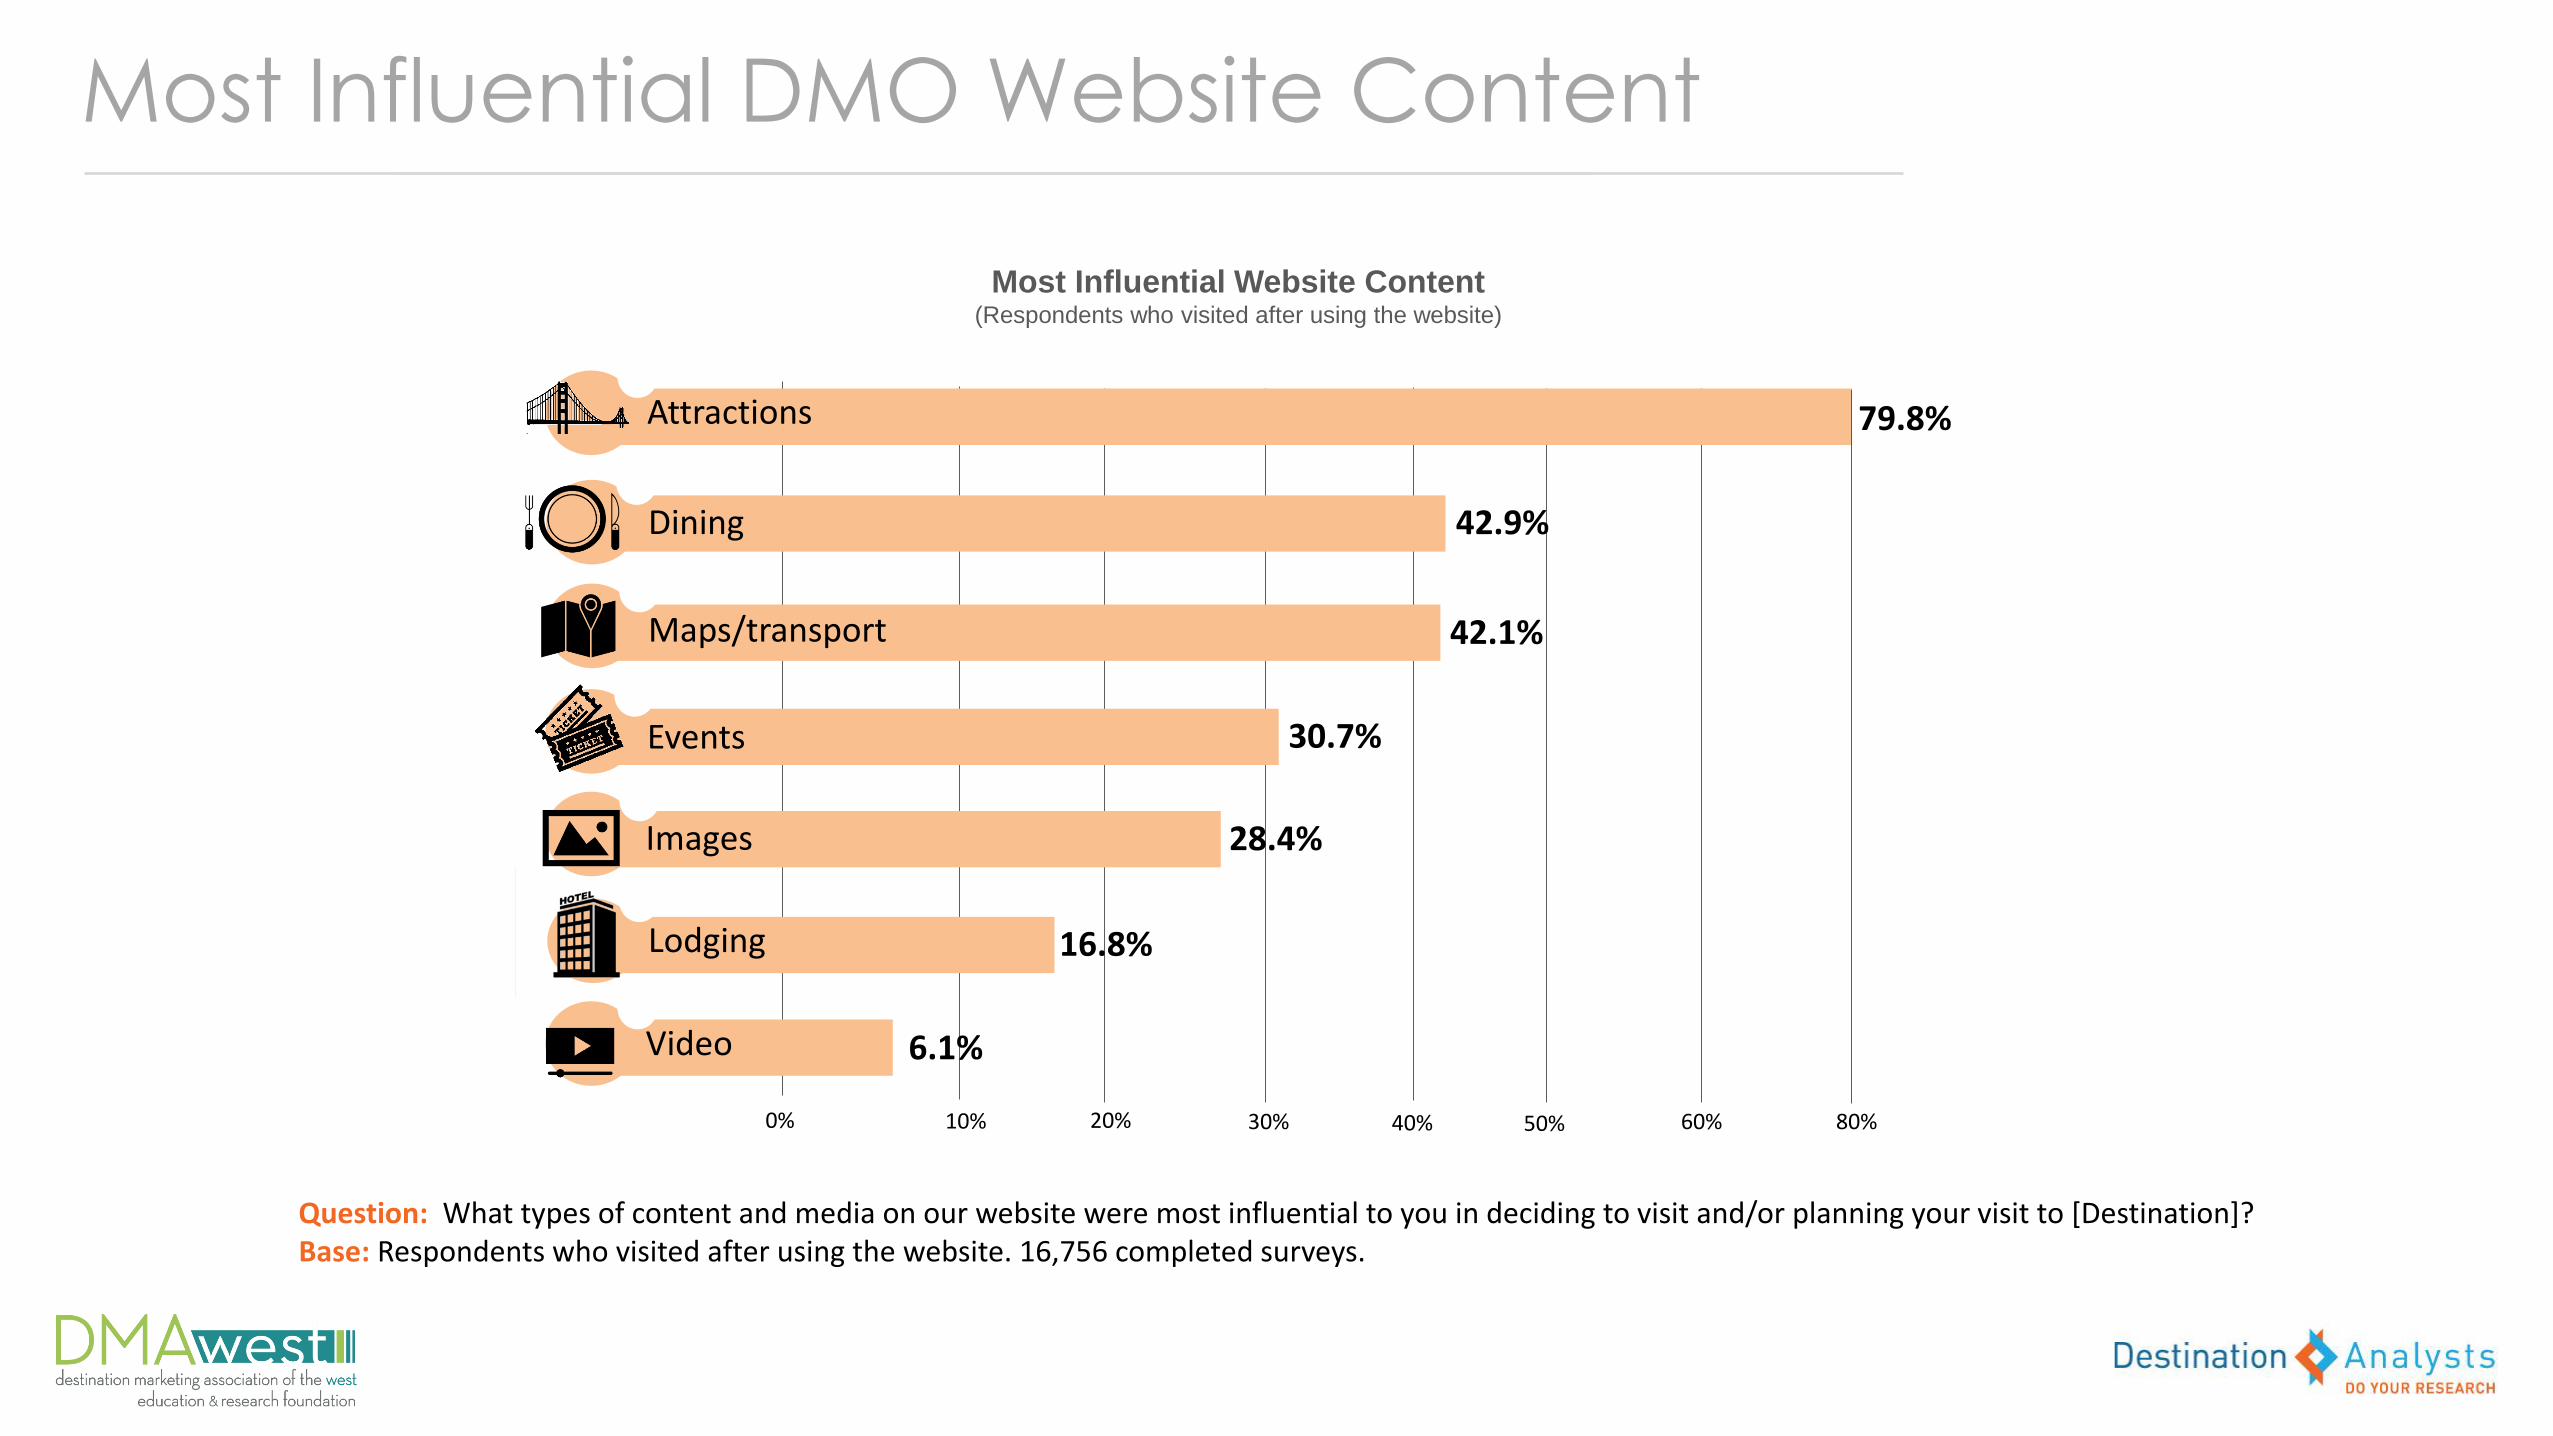
Most Influential DMO Website Content
Attractions
Dining
Maps/transport
Events
Images
Video
79.8%
42.9%
42.1%
30.7%
28.4%
6.1%
0% 10% 20% 30% 40% 50% 60% 80%
Lodging 16.8%
Most Influential Website Content(Respondents who visited after using the website)
Question: What types of content and media on our website were most influential to you in deciding to visit and/or planning your visit to [Destination]?Base: Respondents who visited after using the website. 16,756 completed surveys.
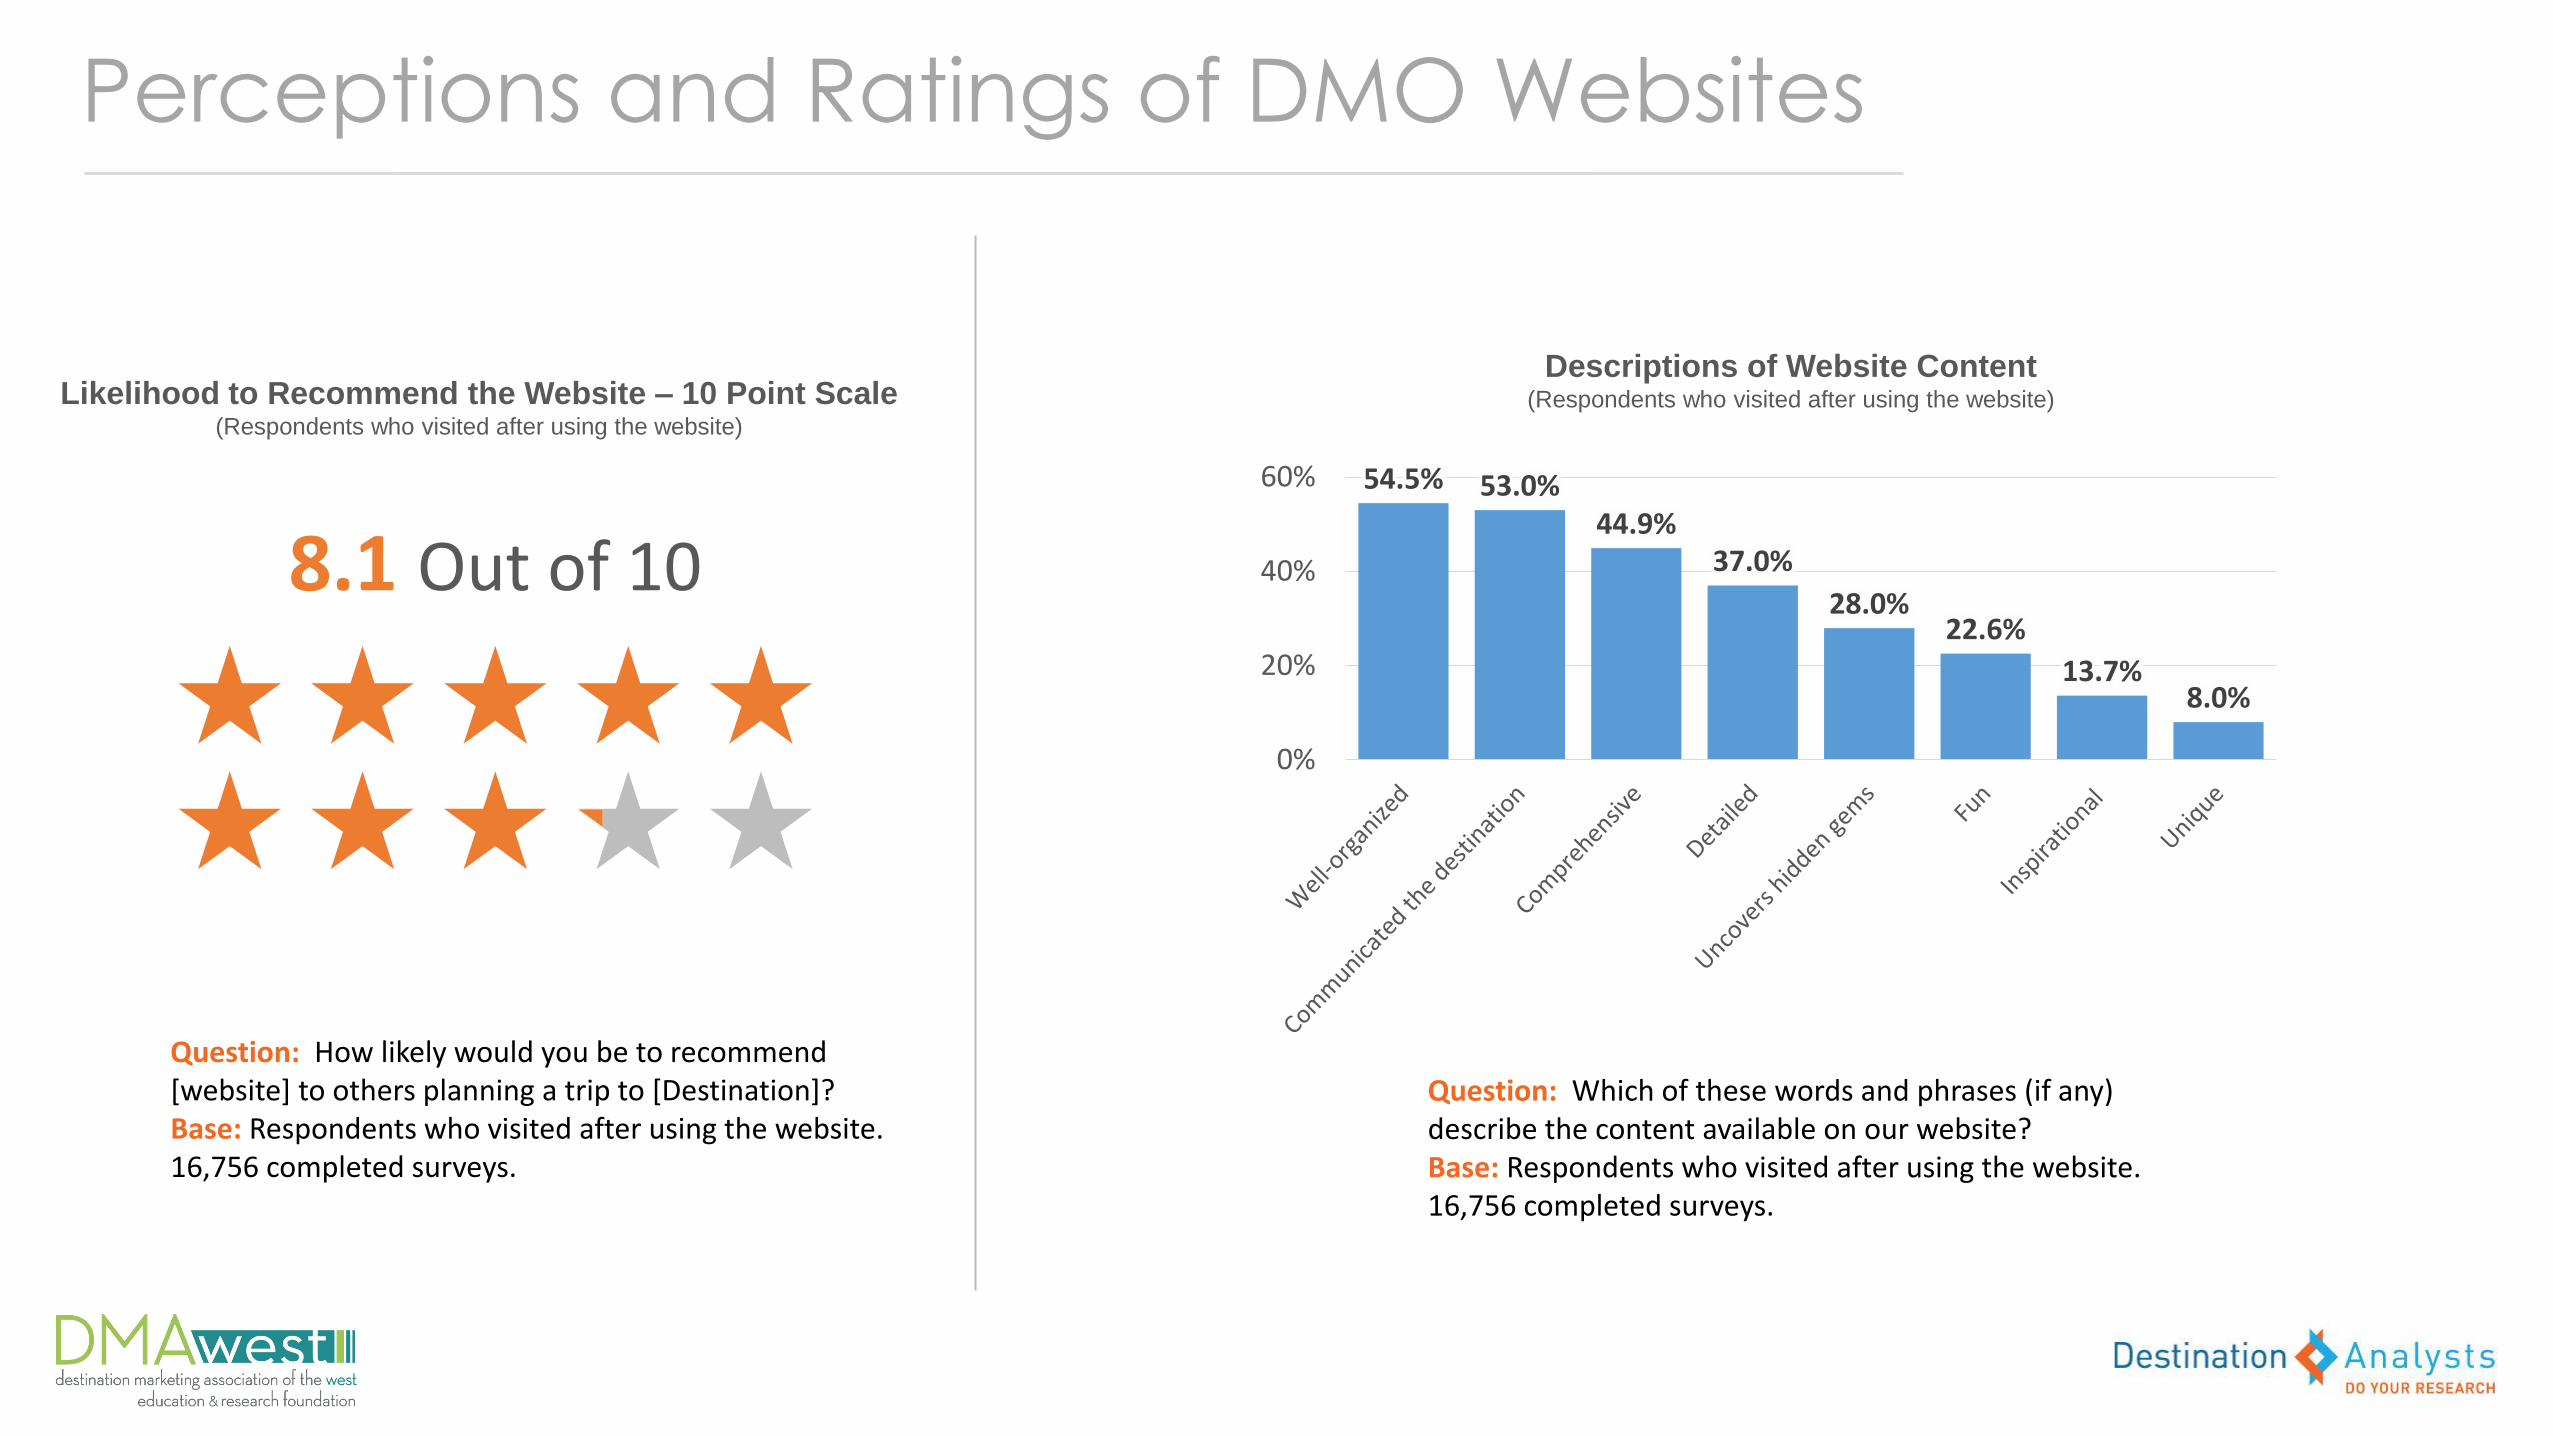
Perceptions and Ratings of DMO Websites
8.1 Out of 10
Likelihood to Recommend the Website – 10 Point Scale(Respondents who visited after using the website)
Descriptions of Website Content(Respondents who visited after using the website)
54.5% 53.0%44.9%
37.0%
28.0%22.6%
13.7%8.0%
0%
20%
40%
60%
Question: How likely would you be to recommend [website] to others planning a trip to [Destination]?Base: Respondents who visited after using the website. 16,756 completed surveys.
Question: Which of these words and phrases (if any) describe the content available on our website?Base: Respondents who visited after using the website. 16,756 completed surveys.

THE ECONOMIC IMPACT OF
DMO WEBSITES

Incremental Trips Generated in 2016
by DMO Websites Studied
304,425

Extended Trip Days Generated in 2016
by DMO Websites Studied
146,690

Incremental Roomnights Generated in 2016
by DMO Websites Studied
533,182

Economic Impact Generated in 2016
by DMO Websites Studied
$324,765,346

Average Economic Impact
Per Real, New User
$36.72In direct visitor spending
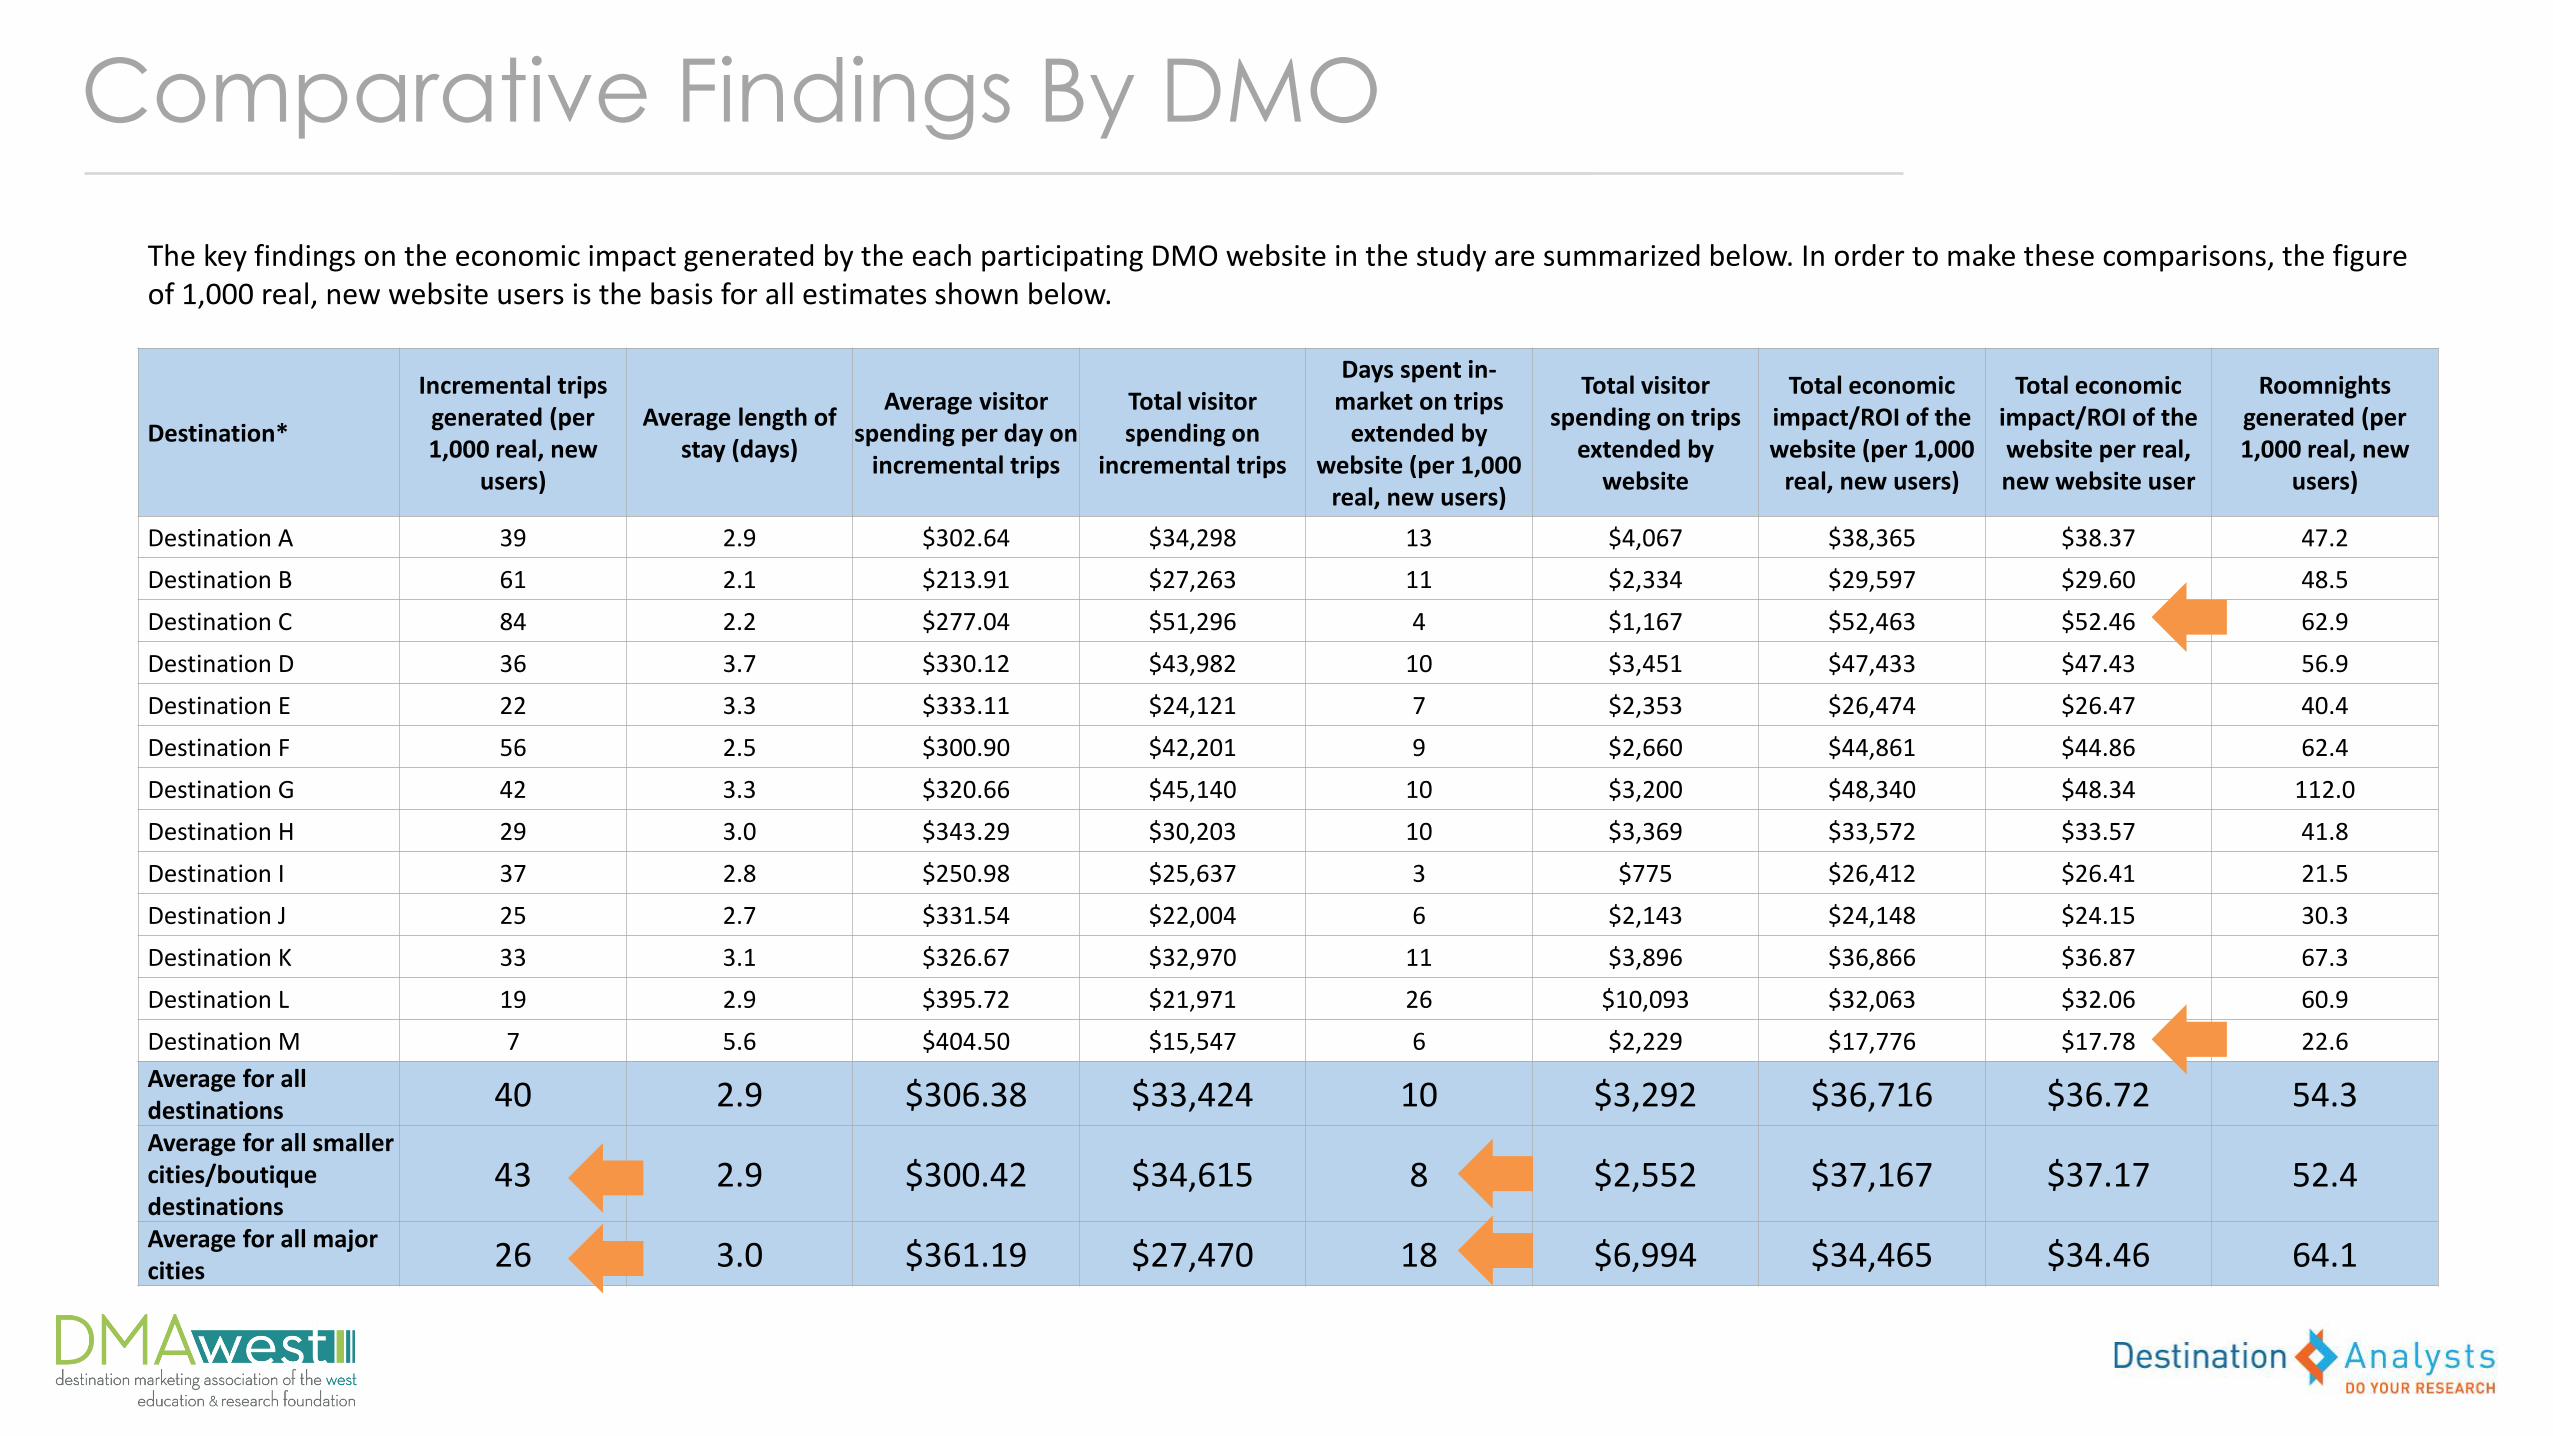
Destination*
Incremental trips generated (per 1,000 real, new
users)
Average length of stay (days)
Average visitor spending per day on
incremental trips
Total visitor spending on
incremental trips
Days spent in-market on trips
extended by website (per 1,000
real, new users)
Total visitor spending on trips
extended by website
Total economic impact/ROI of the website (per 1,000
real, new users)
Total economic impact/ROI of the website per real, new website user
Roomnightsgenerated (per 1,000 real, new
users)
Destination A 39 2.9 $302.64 $34,298 13 $4,067 $38,365 $38.37 47.2
Destination B 61 2.1 $213.91 $27,263 11 $2,334 $29,597 $29.60 48.5
Destination C 84 2.2 $277.04 $51,296 4 $1,167 $52,463 $52.46 62.9
Destination D 36 3.7 $330.12 $43,982 10 $3,451 $47,433 $47.43 56.9
Destination E 22 3.3 $333.11 $24,121 7 $2,353 $26,474 $26.47 40.4
Destination F 56 2.5 $300.90 $42,201 9 $2,660 $44,861 $44.86 62.4
Destination G 42 3.3 $320.66 $45,140 10 $3,200 $48,340 $48.34 112.0
Destination H 29 3.0 $343.29 $30,203 10 $3,369 $33,572 $33.57 41.8
Destination I 37 2.8 $250.98 $25,637 3 $775 $26,412 $26.41 21.5
Destination J 25 2.7 $331.54 $22,004 6 $2,143 $24,148 $24.15 30.3
Destination K 33 3.1 $326.67 $32,970 11 $3,896 $36,866 $36.87 67.3
Destination L 19 2.9 $395.72 $21,971 26 $10,093 $32,063 $32.06 60.9
Destination M 7 5.6 $404.50 $15,547 6 $2,229 $17,776 $17.78 22.6
Average for all destinations 40 2.9 $306.38 $33,424 10 $3,292 $36,716 $36.72 54.3Average for all smaller cities/boutique destinations
43 2.9 $300.42 $34,615 8 $2,552 $37,167 $37.17 52.4
Average for all major cities 26 3.0 $361.19 $27,470 18 $6,994 $34,465 $34.46 64.1
Comparative Findings By DMO
The key findings on the economic impact generated by the each participating DMO website in the study are summarized below. In order to make these comparisons, the figure of 1,000 real, new website users is the basis for all estimates shown below.

In Summary
Knowing Who Uses Your Site and How Can
Maximize Your Economic Impact
• Ensure efficiency in your advertising and
marketing strategies to drive valuable (high
funnel) audiences
• Optimize key pages for conversion
• Measure and report your site’s performance more
accurately
Thank you!
To read the report:www.dmawest.org/foundation/research/
