the impact of hydrocarbon waste from brass oil terminal on
TRANSCRIPT
Journal of Emerging Trends in Engineering and Applied Sciences (JETEAS) 2 (5): 729-733 (ISSN: 2141-7016)
729
The Impact of Hydrocarbon Waste from Brass Oil terminal on the Phytoplankton and Periphyton Communities of the Lower Brass
River, Niger Delta, Nigeria
1Asimiea, O. A. and 2Sam-Wobo, S. O
1Department of Crop and Soil Science, Faculty of Agriculture, University of Port Harcourt 2Department of Biological Sciences, University of Agriculture, Abeokuta
___________________________________________________________________________ Abstract The Physico-Chemical characteristics of surface water were determined for 15 locations in and around the Brass Oil terminal (Brass Island, Niger Delta Nigeria). Also Phytoplankton and Periphyton communities were assessed to determine the impact of oily wastes discharged from the terminal. Surface water pH values ranged from 7.2 - 7.7, Turbidity ranged between 0.40 - 3.20 NTU. While salinity was between 10.0 to 12.0ppm. TDS range was between 820 to 1070 mg/l and conductivity values ranged from 1630.0 to 2060 mg/l. Sulfate values ranged from 12.81 to 15.58 mg/l, Nitrate values varied from 0.30 – 1.39mg/l and Phosphate concentrations ranged from 0.05 – 0.91mg/l. Dissolved oxygen levels range from 0.2 to 3.9 mg/l and BOD5 ranged from 8.0 to 43.0mg/l. THC concentration averaged 10.71mg/l while TPH concentrations ranged from 2.0 to 13.0mg/l. Physico-Chemical characteristics of surface water suggest that the water in the area was polluted.The phytoplankton community recorded 86 species. Bacillariophyceae contributed 33% of phytoplankton community, followed by Cyanophyceae (32%), chlorophyceae 21%, Euglenophyceae 12%. The community structure pattern demonstrated disproportionate occurrence of Cyanophyceae in Stations 8, 9, 10, 11, 12, and 13 where THC and TPH concentrations were between high (9.39ppm and 15.58ppm and 6.37ppm and 12.85ppm respectively). Periphyton community structure exhibited similar trend. The dominance of Cyanophyceae (blue green algae) at these stations against the other stations indicates abnormality, which in this study was attributed to the presence of hydrocarbon in the environment. The aim of this study is to elucidate the importance of Phytoplankton and Periphyton as hydrocarbon pollution indicators and it will also provide information necessary for the determination of the quality and evaluation of the aquatic environments. __________________________________________________________________________________________ Keywords: hydrocarbon, impacts, phytoplankton, periphyton, brass oil terminal __________________________________________________________________________________________ INTRODUCTION Phytoplankton communities are the starters of the food chain in most brackish water ecosystem. They serve as food to a wide range of consumers including pelagic stages of bigger fishes. In fact most filter feeders depend on phytoplankton for food. The speciation and community structure of phytoplankton has been used to explain water quality of brackish water ecosystems (Ogamba et al 2004). The introduction of allocthonous material into brackish water is reported to be responsible in the opportunistic dominance of some groups over others (Ogamba et al 2005). In other studies Chindah and Braide (2001) reported the susceptibility and sensitivity of biological assemblages in various sediment substrate types and changes in the benthos communities of the Bonny River in the Niger delta in relation to oil spill impact. These studies underscore the concept of the importance of some organisms in this case phytoplankton, as indicator organisms. The facility receives crude oil produced from oil fields across four states in the Niger Delta namely, Delta, Bayelsa, Rivers and Imo States. The facility serves as the processing point for crude oil export. The major operations at the terminal include the dehydration of
formation water drained from crude oil coming from the oil wells. The Terminal has been in operation for about 36 years. The oily water and other terminal operation oily wastes are discharged through a man made canal into the Brass River (See plate 1). This may have impacted the lower section of the Brass River (Niger Delta Nigeria). The aim of this study is to evaluate the impact of Brass Oil terminal effluent on the Phytoplankton and Priphyton communities of the Lower Brass River, Niger Delta Nigeria. The information obtained from this study will further elucidate the importance of Phytoplankton and Periphyton as hydrocarbon pollution indicators. The periodic evaluation of the speciation and community structure of Phytoplankton and Periphyton will also provide the bases for the determination of the quality of the aquatic environment in and around the Brass Oil Terminal environment. STUDY AREA The Brass Oil Terminal is located on Brass Island, a town 113 km southwest of Port Harcourt, Nigeria. The location is within the geographic coordinates of N40 17’ 57’’ and 0060 14’ 35’’; N04o18.977’ and E006o15.043; N04o19.560’ and E006o14.969 and
Journal of Emerging Trends in Engineering and Applied Sciences (JETEAS) 2 (5): 729-733 © Scholarlink Research Institute Journals, 2011 (ISSN: 2141-7016) jeteas.scholarlinkresearch.org

Journal of Emerging Trends in Engineering and Applied Sciences (JETEAS) 2 (5): 729-733 (ISSN: 2141-7016)
730
N04017.857 and E0060 14.817. The project area is basically brackish water swamp that is tidally inundated with some fresh back swamps formed on the forest block, which the Brass Island. The freshwater swamps for most part are seasonally flooded and in some sections but are generally well drained in the dry season. The brass River is characterized by semi–diurnal tidal regimes with tidal amplitude of about 1.2 meters high (NEDECO, 1961) and ebb flow reaching higher velocities than flood flow. Generally, the tidal flows control drainage patterns in the mangrove marshes. The study area falls within the humid tropics with its lowest relative humidity in the range of 62-67% in the dry season months of January and February, which correspond with periods of highest temperature and lowest rainfall. The highest values of 90-91% occur in the wet season months of July to October. The ecosystems are characterized by high temperatures and bi-modal rainfall ranging from 2000mm-2500mm per annum. The rainy season lasts from March to November, with the peak in July and September. The mean annual minimum and maximum temperatures are about 20oC and 30oC respectively. METHODS A total of 15 locations were established in the study area – 3 locations in the sea at 1km intervals from the shoreline, 5 in the waste discharge canal, 4 in Okpoama creek ( off the Brass River), and 3 within the Brass River. Each study site was geo-referenced with a hand-held GPS – Garmin etrex model. In-situ measurements of surface water parameters were carried out with pre-calibrated field meter (Horiba U-10 model) for Temperature (oC), Salinity (ppt or %o), Conductivity (ms/cm), Dissolved oxygen (mg/1), pH, Total Dissolved Solids (TDS) and Turbidity. Water samples for physico-chemical analyses were collected in 1litre plastic container, those for heavy metal analysis were fixed with HNO3 to stabilize the pH. Total hydrocarbon (THC) samples were collected in glass bottles. THC concentration of surface water was determined by a spectrophotometer (Model HACH BR-2400); TPH was determined by gas chromatography (GC model HP 5890 Series II) and heavy metal concentrations by Atomic absorption spectrophotometer (AAS Model GBC Avanta PM-AAS A5600 Version 2.02). All the equipments were calibrated appropriately with various standards. Phytoplankton and Periphyton organisms were collected from natural water bodies within the study area. At each study site, water samples (1000 ml) were collected with the Ruthner water sampler from subsurface water (approximately 15-20cm below surface) and fixed with approximately 5ml of 4% formalin solution in containers pre-labelled with the study site code, date of sample collection and type of sample and stored in a cool box for onward
transmission to the laboratory for identification and counting under a stereo microscope. Periphyton samples were collected by scrapping the surfaces submerged substrates at sample locations where phytoplankton samples were collected. The samples were transferred into vials and transported in ice to the laboratory for analysis. RESULTS AND DISCUSSIONS Physico-chemical Characteristics of Surface Water Surface water temperature ranged in value from 26.3 to 27.4 ( C) while the pH values ranged from 7.2 - 7.7, the water was generally neutral to weakly alkaline. Turbidity values were low ranging from 0.40 - 3.20 NTU. Turbidity values were low as expected for such water bodies, this indicates that suspended particles are not attenuating light penetration for primary productivity. The range for salinity was 10.0 to 12.0ppm with an average of 12.0ppm. TDS range was between 820 to 1070 mg/l, while conductivity values ranged from 1630.0 to 2060 mg/l. Sulfate values ranged from 12.81 to 15.58 mg/l. Salinity, conductivity, TDS and sulfate exhibited similar trends. Salinity values agree with Conductivity and TDS values indicating seawater influence in the study area. TDS and conductivity values also indicate that the upper parts of the creeks in the study area are influenced by the fresh water from the swamp. Dissolved oxygen levels range from 0.2 to 3.9 mg/l while the BOD5 ranged from 8.0 to 43.0mg/l suggesting that surface water in the area was polluted. This is supported by the reasonably high values of phosphate. Phosphate concentrations ranged from 0.05 – 0.91mg/l. Phosphate concentration in flowing water is not expected to be more 0.10mg/l (Peirce et al. 1998). Nitrate values varied from 0.30 – 1.39mg/l. The average concentration of phosphate of 0.29mg/l reported for the area with the nitrate concentrations will elicit the increase in algae growth leading to eutrophication of the system. Total hydrocarbon concentration of the surface water averaged 10.71mg/l, Total Petroleum Hydrocarbon concentrations ranged from 2.0 to 13.0mg/l. Although the hydrocarbon results indicated moderately low hydrocarbon contamination of surface water in the area, the values obtained are high enough to cause damage to embryonic stages of aquatic life. This is because the fish recruitment potential in a water body can be adversely affected by the contamination of eggs and fish larvae exposed to such levels of hydrocarbon concentration. Concentrations as low as 50 ugl-1 of oil can cause such deformation (Ekweozor,1989). Phytoplankton The phytoplankton species assemblages observed in the area constituted of brackish and freshwater species which demonstrate the role of freshwater
Journal of Emerging Trends in Engineering and Applied Sciences (JETEAS) 2 (5): 729-733 (ISSN: 2141-7016)
731
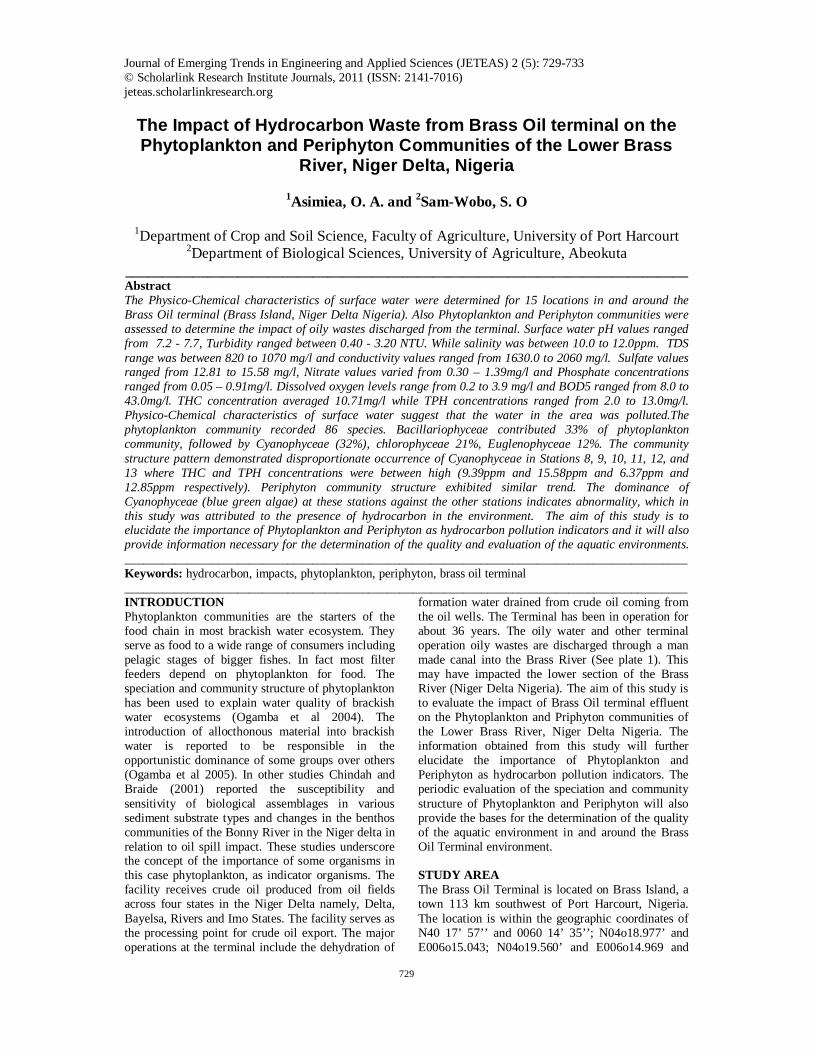
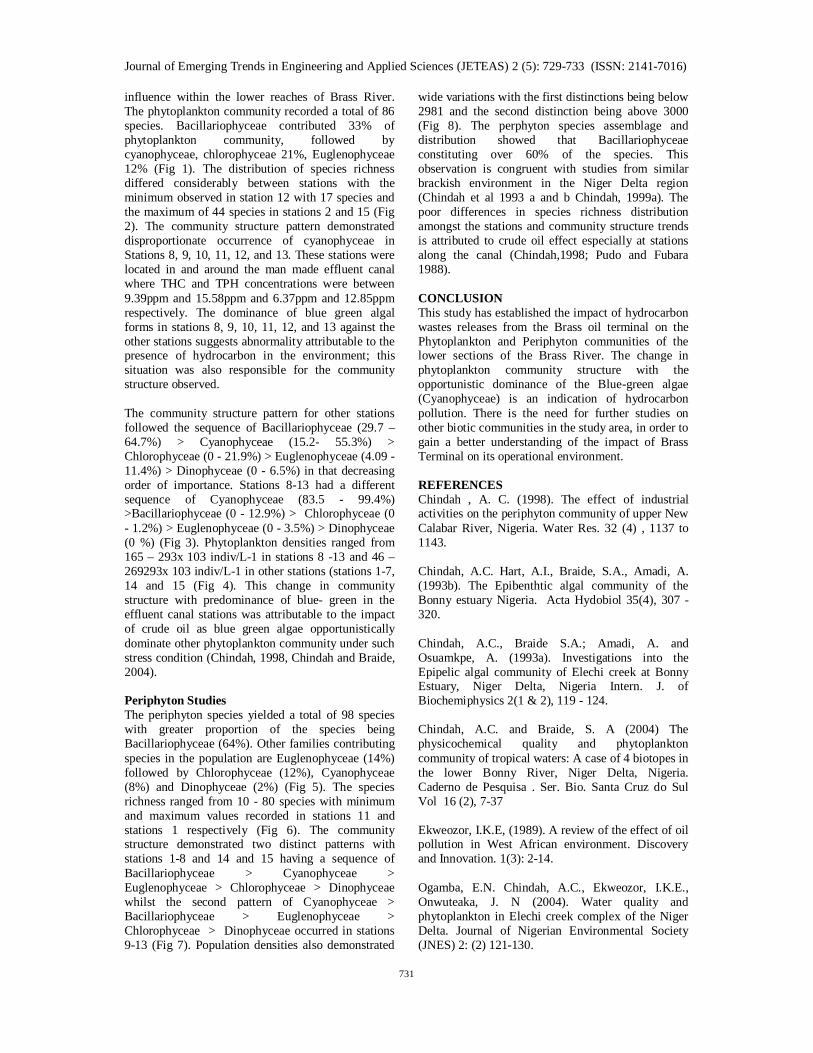
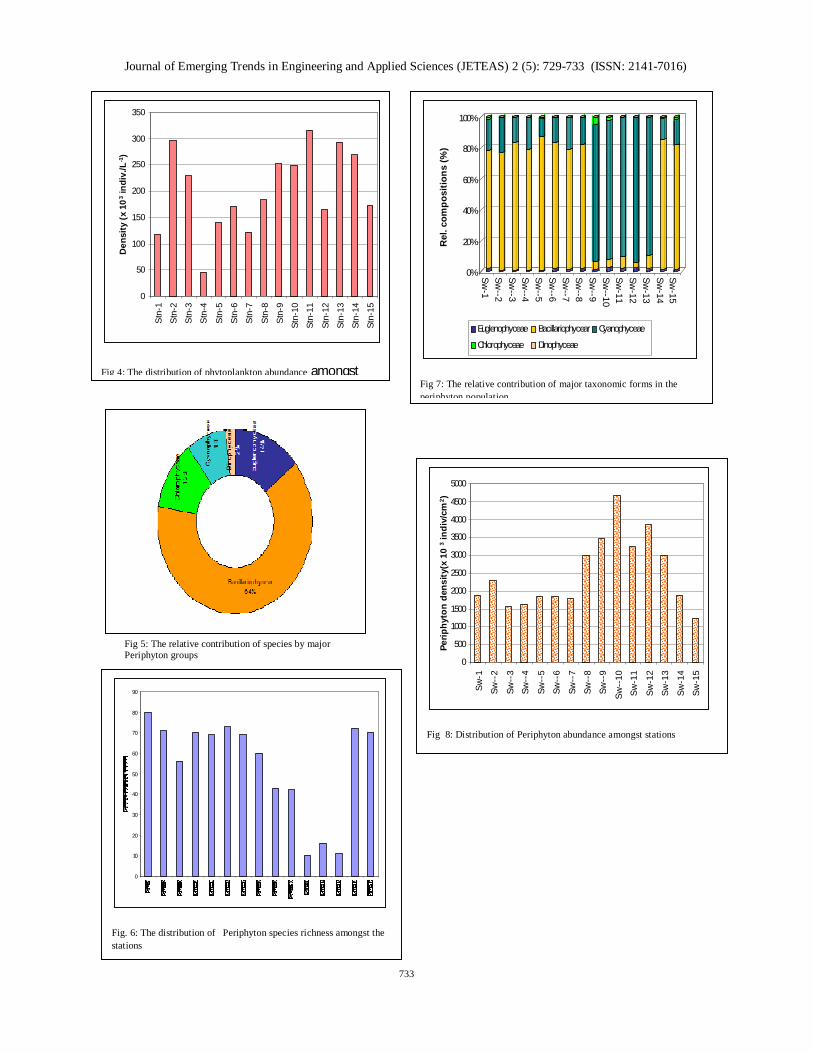
influence within the lower reaches of Brass River. The phytoplankton community recorded a total of 86 species. Bacillariophyceae contributed 33% of phytoplankton community, followed by cyanophyceae, chlorophyceae 21%, Euglenophyceae 12% (Fig 1). The distribution of species richness differed considerably between stations with the minimum observed in station 12 with 17 species and the maximum of 44 species in stations 2 and 15 (Fig 2). The community structure pattern demonstrated disproportionate occurrence of cyanophyceae in Stations 8, 9, 10, 11, 12, and 13. These stations were located in and around the man made effluent canal where THC and TPH concentrations were between 9.39ppm and 15.58ppm and 6.37ppm and 12.85ppm respectively. The dominance of blue green algal forms in stations 8, 9, 10, 11, 12, and 13 against the other stations suggests abnormality attributable to the presence of hydrocarbon in the environment; this situation was also responsible for the community structure observed. The community structure pattern for other stations followed the sequence of Bacillariophyceae (29.7 – 64.7%) > Cyanophyceae (15.2- 55.3%) > Chlorophyceae (0 - 21.9%) > Euglenophyceae (4.09 - 11.4%) > Dinophyceae (0 - 6.5%) in that decreasing order of importance. Stations 8-13 had a different sequence of Cyanophyceae (83.5 - 99.4%) >Bacillariophyceae (0 - 12.9%) > Chlorophyceae (0 - 1.2%) > Euglenophyceae (0 - 3.5%) > Dinophyceae (0 %) (Fig 3). Phytoplankton densities ranged from 165 – 293x 103 indiv/L-1 in stations 8 -13 and 46 – 269293x 103 indiv/L-1 in other stations (stations 1-7, 14 and 15 (Fig 4). This change in community structure with predominance of blue- green in the effluent canal stations was attributable to the impact of crude oil as blue green algae opportunistically dominate other phytoplankton community under such stress condition (Chindah, 1998, Chindah and Braide, 2004). Periphyton Studies The periphyton species yielded a total of 98 species with greater proportion of the species being Bacillariophyceae (64%). Other families contributing species in the population are Euglenophyceae (14%) followed by Chlorophyceae (12%), Cyanophyceae (8%) and Dinophyceae (2%) (Fig 5). The species richness ranged from 10 - 80 species with minimum and maximum values recorded in stations 11 and stations 1 respectively (Fig 6). The community structure demonstrated two distinct patterns with stations 1-8 and 14 and 15 having a sequence of Bacillariophyceae > Cyanophyceae > Euglenophyceae > Chlorophyceae > Dinophyceae whilst the second pattern of Cyanophyceae > Bacillariophyceae > Euglenophyceae > Chlorophyceae > Dinophyceae occurred in stations 9-13 (Fig 7). Population densities also demonstrated
wide variations with the first distinctions being below 2981 and the second distinction being above 3000 (Fig 8). The perphyton species assemblage and distribution showed that Bacillariophyceae constituting over 60% of the species. This observation is congruent with studies from similar brackish environment in the Niger Delta region (Chindah et al 1993 a and b Chindah, 1999a). The poor differences in species richness distribution amongst the stations and community structure trends is attributed to crude oil effect especially at stations along the canal (Chindah,1998; Pudo and Fubara 1988). CONCLUSION This study has established the impact of hydrocarbon wastes releases from the Brass oil terminal on the Phytoplankton and Periphyton communities of the lower sections of the Brass River. The change in phytoplankton community structure with the opportunistic dominance of the Blue-green algae (Cyanophyceae) is an indication of hydrocarbon pollution. There is the need for further studies on other biotic communities in the study area, in order to gain a better understanding of the impact of Brass Terminal on its operational environment. REFERENCES Chindah , A. C. (1998). The effect of industrial activities on the periphyton community of upper New Calabar River, Nigeria. Water Res. 32 (4) , 1137 to 1143. Chindah, A.C. Hart, A.I., Braide, S.A., Amadi, A. (1993b). The Epibenthtic algal community of the Bonny estuary Nigeria. Acta Hydobiol 35(4), 307 - 320. Chindah, A.C., Braide S.A.; Amadi, A. and Osuamkpe, A. (1993a). Investigations into the Epipelic algal community of Elechi creek at Bonny Estuary, Niger Delta, Nigeria Intern. J. of Biochemiphysics 2(1 & 2), 119 - 124. Chindah, A.C. and Braide, S. A (2004) The physicochemical quality and phytoplankton community of tropical waters: A case of 4 biotopes in the lower Bonny River, Niger Delta, Nigeria. Caderno de Pesquisa . Ser. Bio. Santa Cruz do Sul Vol 16 (2), 7-37 Ekweozor, I.K.E, (1989). A review of the effect of oil pollution in West African environment. Discovery and Innovation. 1(3): 2-14. Ogamba, E.N. Chindah, A.C., Ekweozor, I.K.E., Onwuteaka, J. N (2004). Water quality and phytoplankton in Elechi creek complex of the Niger Delta. Journal of Nigerian Environmental Society (JNES) 2: (2) 121-130.

Journal of Emerging Trends in Engineering and Applied Sciences (JETEAS) 2 (5): 729-733 (ISSN: 2141-7016)
732
Ogamba, E.N., Chindah, A.C., Ekweozor, I.K.E., Daka,E.R., Onwuteaka,J. and Bawo,D. (2005) Impact of human activities on the plankton communities of Elechi creek complex in the Niger Delta ,Nigeria. Delta Biologia 5(1)1-9. Peirce, J.; R.F. Weiner and P. A. Vesilind. (1998) Environmental Pollution and Control. 4th edition, Butterworth-Heinemann. Boston, USA Pudo J, and Fubara DMJ. (1988) Studies on Periphyton Algae in the Petroleum Oil Spillage Area of the Niger Delta aquatic System. Verh. Int. Ver. Limnol.; 23: 2259-2261. APPENDIX
0 %1 0 %2 0 %3 0 %4 0 %5 0 %6 0 %7 0 %8 0 %9 0 %
1 0 0 %
Rel
. com
posi
tion
(%)
Stn-
1
Stn-
3
Stn-
5
Stn-
7
Stn-
9
Stn-
11
Stn-
13
Stn-
15
C y a n o p h y c e a e E u g l e n o p h y t a ( E u g l e n i n ) B a c i l l a r i o p h y c e a e ( D i a t o m s )
C h l o r o p h y t a ( g r e e n a l g a e ) D i n o p h y c e a e
Fig 3: The relative proportion of the different taxonomic groups amongst the stations
0
5
10
15
20
25
30
35
40
45
50
Fig 2: The distribution of species richness at the different stations
Other23%
Euglenophyta (Euglenin)
12%
Cyanophyceae32%
Dinophyceae2%
Chlorophyta (green algae)21%
Bacillariophyceae (Diatoms)
33%
Fig 1: The relative contribution of species by major taxonomic groups in the phytoplankton community.
Plate 1: Satellite Imagery of Brass Island showing, Brass oil terminal with the Tank farm and the Effluent Canal, with a Bridge separating it into Parts A & B, Part B opens into the Brass River.
Effluent canal
Brass River
Brass terminal Tank
Journal of Emerging Trends in Engineering and Applied Sciences (JETEAS) 2 (5): 729-733 (ISSN: 2141-7016)
733
0
50
100
150
200
250
300
350
Stn-
1
Stn-
2
Stn-
3
Stn-
4
Stn-
5
Stn-
6
Stn-
7
Stn-
8
Stn-
9
Stn-
10
Stn-
11
Stn-
12
Stn-
13
Stn-
14
Stn-
15
Den
sity
(x 1
03 ind
iv./L
-1)
Fig 4: The distribution of phytoplankton abundance amongst
0
10
20
30
40
50
60
70
80
90
Fig. 6: The distribution of Periphyton species richness amongst the stations
Fig 5: The relative contribution of species by major Periphyton groups
0%
20%
40%
60%
80%
100%
Rel
. com
posi
tions
(%)
Sw-1
Sw--2
Sw--3
Sw--4
Sw--5
Sw--6
Sw--7
Sw--8
Sw--9
Sw--10
Sw-11
Sw-12
Sw-13
Sw-14
Sw-15
Euglenophyceae Bacillariophycear Cyanophyceae
Chlorophyceae Dinophyceae
Fig 7: The relative contribution of major taxonomic forms in the periphyton population
0
500
1000
1500
2000
2500
3000
3500
4000
4500
5000Sw
-1
Sw--
2
Sw--
3
Sw--
4
Sw--
5
Sw--
6
Sw--
7
Sw--
8
Sw--
9
Sw--
10
Sw-1
1
Sw-1
2
Sw-1
3
Sw-1
4
Sw-1
5
Perip
hyto
n de
nsity
(x 1
03 i
ndiv
/cm
2 )
Fig 8: Distribution of Periphyton abundance amongst stations