the impact of legal changes on land market activity in china - world...
TRANSCRIPT
THE IMPACT OF LEGAL CHANGES ON LAND MARKET ACTIVITY IN CHINA
Abstract
Using data from national surveys in the years 1999, 2001, 2005 and 2008 from 17 provinces in China, we analyze the changes in land market activity after the introduction of the Land Management Law in 1998 (LML), and the Rural Land Contracting Law in 2002 (RLCL). The lack of tenure security, measured by administrative readjustments of land use rights, was one of the impediments to the emergence of transfer markets in China. In the years since RLCL was implemented, we find increased incidence of compensated transfers. These findings provide evidence that secure land tenure rights with long term tenure, and written documentation, have encouraged land market activity for the transfer of land use rights in China.
Keywords: China, Land Markets, Land Tenure, Land Transfer, Rural Development
Jeffrey M. Riedinger, DeanInternational Studies & Programs
Michigan State University
Vandana YadavDepartment of Agriculture, Food and Resource Economics
Michigan State University
1

THE IMPACT OF LEGAL CHANGES ON LAND MARKET ACTIVITY IN CHINA
1. INTRODUCTION
The nature of the property rights has been shown to have an observable impact on a wide range
of economic outcomes. Thus, enforcement of property rights through legal or social structures is
a prerequisite for production, investment and exchange in the economy. Property rights require
governance institutions strong enough to enforce them, but at the same time these governance
institutions have to be constrained enough to limit expropriation (Levine, 2005).
In the absence of secure property rights cultivators are easily subject to eviction at the behest of
local government. In late 1970s, the land tenure system in China shifted from collective
organization to individual property (use) rights. However, the use rights provided under the
household responsibility system remained insecure and short term. Through legal reforms in
1998, 2003 and 2008 the Chinese government attempted to make more secure the rights to the
cultivable land in rural areas. Despite two decades of reform of rural land use rights, efficiency
and sustainability enhancing voluntary land transfers by farmers in rural China have, until
recently, been relatively rare. In this paper, we analyze the impact of the new laws and a policy
on the land market activity namely, transfers in and transfers out of land use rights.
2. BACKGROUND
Individual farmer households obtained land use rights in the late 1970’s with the introduction of
the Household Responsibility System. Ownership of the land remained with the collectivesi or
the state, so farmers still have no right to sell land. However, they do have the right to transfer
2

(lease or assign) their land use rights, sometimes subject to limitations and requirements
established by the villages.
Since the collective retains the ownership of land in rural China, land readjustments by village
collective officials are a major threat to security of farmers’ land rights. These adjustments entail
changing farmer’s land in size or location, with or without compensation. Re-contracting of land
use rights also poses a threat. Re-contracting involves expropriation of the farmer’s land by
village officials or the state, to assign it to a non villager. These land takings by the local
government are common in China, with an increasing percentage of farmers losing their lands
for non agricultural purposes.
Over the last three decades, successive legal reforms have attempted to enhance the security of
tenure of individual land use rights. In 1993, a directive set thirty-year rights for the farmer. This
thirty year policy was then embodied in 1998 as a formal law, in the revised Land Management
Law (LML). LML restricted land adjustments by requiring approval by 2/3s of village members.
For the implementation of LML, provinces adopted a set of regulations. In particular, with the
introduction of LML written contracts or certificates were issued to document household land
rights.
In 2002, China passed the Rural Land Contracting Law (RLCL). This law goes beyond previous
attempts to secure the land rights of farmers. RLCL required that the practice of administrative
readjustments be discontinued, except in very limited cases. This law also required that farmers
and collectives be issued written contracts and certificates to confirm their land use rights.
3

Document 1 of 1984 and LML in 1993 acknowledged the transferability of land rights; RLCL
detailed those rights. The right to lease, assign, exchange and carry out other transactions with
land contracts were outlined in RLCL. RLCL was expected to facilitate market transfers, as
written documentation of farmer’s rights improves transparency and improves marketability of
land rights, especially to would be transferors or transferees who live in a different village.
In addition to the policy reforms enacted in the last decade, there are other factors conducive to
land transfers in China. In some villages, administrative land readjustments have never been
conducted since the introduction of the Household Responsiblity System. Farmers in these
villages enjoy stable land use rights (Schwarzwalder, et al. 2002). In these villages RLCL
reinforces farmers' long-term land use rights and guarantees farmers the right to voluntarily
transfer land use rights in accordance with law.ii
Heterogeneity in household labor/land endowments and human capital also creates demand for
land transfers (Carter and Zimmerman 1994; Yao 2000). Increasing off-farm employment
opportunities in rural and urban areas induces labor re-allocation from farm to off-farm activities
(Zhao 2000). Households differ considerably in terms of their on-farm productivities and their
ability to access these off-farm opportunities. Where land markets are functional, households
with higher agricultural productivities or limited access to off-farm employment opportunities, or
both, may expand their land holdings in order to more fully utilize their available labor. At the
same time, households with easy access to off-farm jobs or low agricultural productivity are
more likely to lease out their land use rights and leave the farm sector.
4

The development of off-farm opportunities has drawn millions of rural laborers from their land
to non-agricultural sectors in China.iii Land transfers permit households with higher marginal
productivities of land to acquire land from households with lower marginal productivities and
induce a better allocation of the household labor endowments in response to outside employment
opportunities.iv An active land transfer market is thus desirable for enhancing efficiency in
resource allocation.
3. SURVEY DATA ON LAND TRANSFERS
Our data are drawn from the Survey of Implementation of 30-Year Rural Land Use Rights in
Chinav conducted in 1999, 2001, 2005 and 2008. These surveys are jointly conducted by the
Rural Development Institute (U.S.) and Renmin University (China). The 17 provinces covered
by the survey are Anhui, Fujian, Guangxi, Guizhou, Hebein, Heilongjiang, Henan, Hubei,
Hunan, Jiangsu, Jiangxi, Jilin, Shandong Shanxi, Sichuan, Yunnan, and Zhejiang. These 17
provinces cover every major region in China and include roughly 90% of China’s rural
households.vi
In each province, surveys were conducted in 100 randomly selected villages. In each village, one
random household was interviewed in 1999 and 2001. In the 2005 and 2008 surveys a second
random household was interviewed in selected villages. We have 1621 observations for the
sample obtained in 1999, 1612 observations for 2001, 1962 observations in the sample for year
2005 and 1740 observations in the 2008 survey sample.vii
5

The surveys include unique information on land transfer rights and land transfer practices, from
both the demand and supply sides, in more than 1,600 villages. The data include information on:
compensation, if any, for land transfers; the relationship between transferor and transferee;
whether or not tax and other obligations are attached to the transfers; the presence of a written
contract; and the length of the transfer.
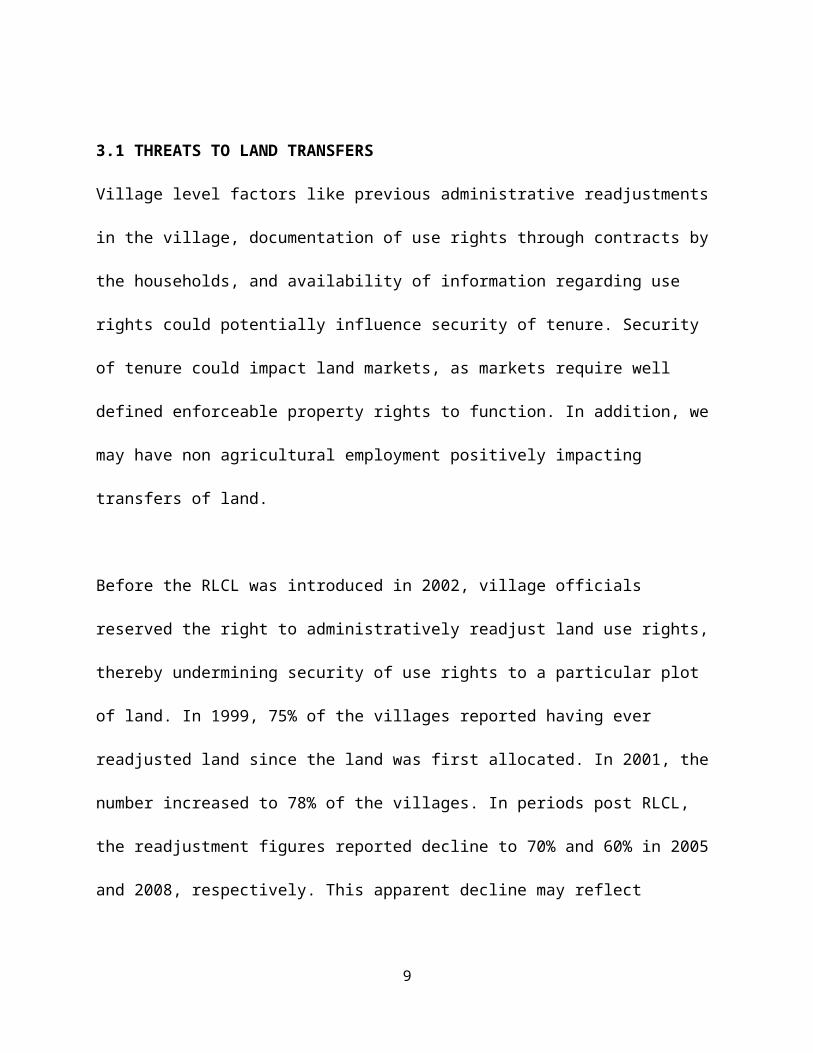
3.1 THREATS TO LAND TRANSFERS
Village level factors like previous administrative readjustments in the village, documentation of
use rights through contracts by the households, and availability of information regarding use
rights could potentially influence security of tenure. Security of tenure could impact land
markets, as markets require well defined enforceable property rights to function. In addition, we
may have non agricultural employment positively impacting transfers of land.
Before the RLCL was introduced in 2002, village officials reserved the right to administratively
readjust land use rights, thereby undermining security of use rights to a particular plot of land. In
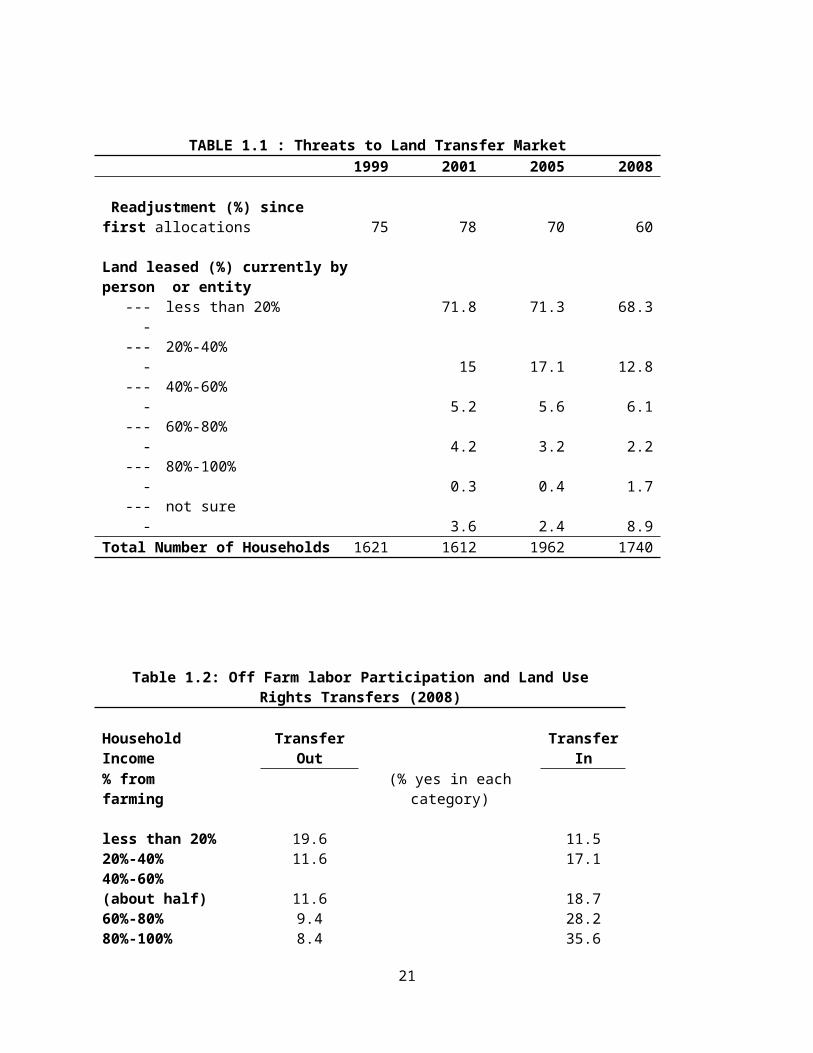
1999, 75% of the villages reported having ever readjusted land since the land was first allocated.
In 2001, the number increased to 78% of the villages. In periods post RLCL, the readjustment
figures reported decline to 70% and 60% in 2005 and 2008, respectively. This apparent decline
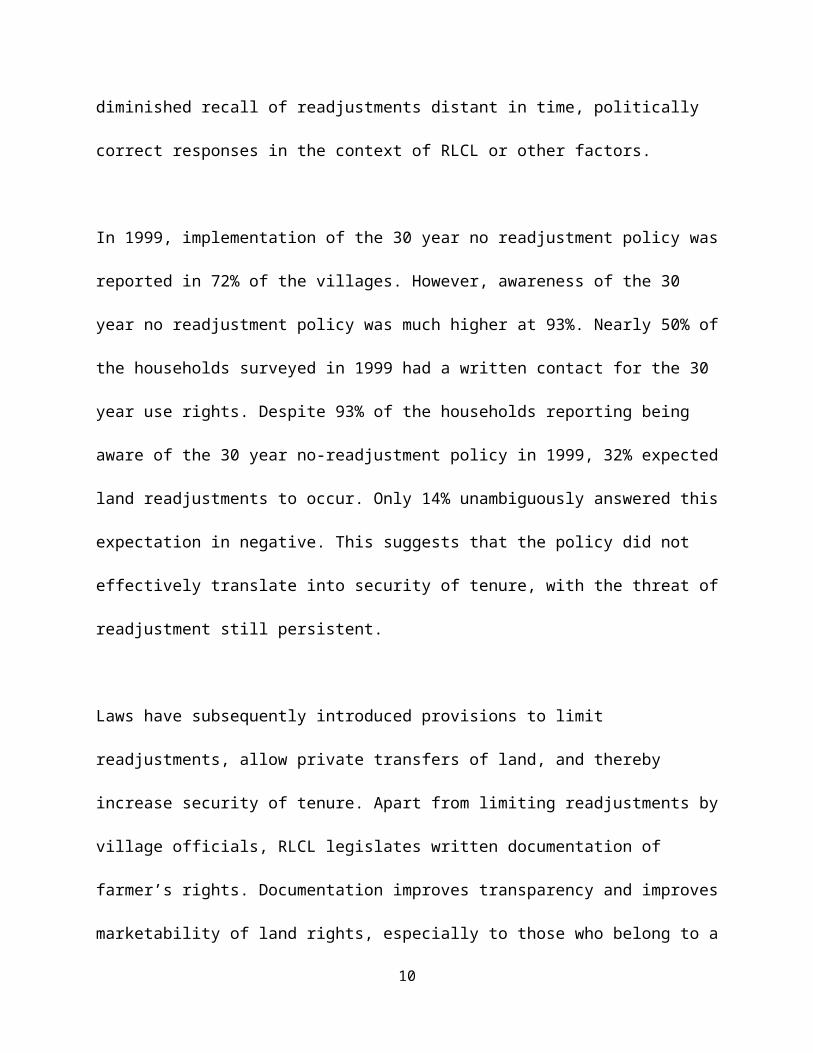
may reflect diminished recall of readjustments distant in time, politically correct responses in the
context of RLCL or other factors.
In 1999, implementation of the 30 year no readjustment policy was reported in 72% of the
villages. However, awareness of the 30 year no readjustment policy was much higher at 93%.
6

Nearly 50% of the households surveyed in 1999 had a written contact for the 30 year use rights.
Despite 93% of the households reporting being aware of the 30 year no-readjustment policy in
1999, 32% expected land readjustments to occur. Only 14% unambiguously answered this
expectation in negative. This suggests that the policy did not effectively translate into security of
tenure, with the threat of readjustment still persistent.
Laws have subsequently introduced provisions to limit readjustments, allow private transfers of
land, and thereby increase security of tenure. Apart from limiting readjustments by village
officials, RLCL legislates written documentation of farmer’s rights. Documentation improves
transparency and improves marketability of land rights, especially to those who belong to a
different village. This documentation is of two types: rural-land-use-right contract (contract) and
the rural land contracting and use right certificate (certificate). A contract is designed at any level
and is completed by the village officials. It is signed and sealed by both the village collective and
the farming household. The specific terms of such a contact may vary by village. On the other
hand, the certificate is typically designed by the provincial government and includes universal
content and format. It is sealed by the county government and does not require the farmer’s or
village official’s signatures.
Farmers can exert their land rights if they possess information about those rights. To assess
whether farmers have complete knowledge of their legal rights, the 2008 survey asks several
questions regarding their awareness of recent legal changes. By 2008, based on the survey, 89%
of respondents were aware of the 30 year no-readjustment policy, and 63% had heard for RLCL.
Also 55% were aware of a government campaign to issue certificates or contracts.
7

In 2001, before the introduction of RLCL, 46% of the households reported that the 30 year land
use rights contract had been issued to farmers and 90% of these households reported they were in
possession of a contract. The figure for issuance of a certificate was 45% and possession was
reported by 91% of the households. In 2008, 43% of the households reported that contacts had
been issued to farmers and 47% reported that certificates had been issued. Also, 61% of the
households surveyed reported possession of the land use contract, and 68% reported possession
of a certificate. Some households had both in their possession at the time of the interview: nearly
two thirds of those who possessed a contract also possessed a certificate.
3.2 OFF – FARM LABOUR PARTICIPATION AND LAND TRANSFERS
We can expect a higher incidence of land transfers for households where a member(s) of the
household is engaged in non agricultural employment. The efficiency hypothesis postulates that
a perfect labor market promotes land use transfers, whenever there are differences in marginal
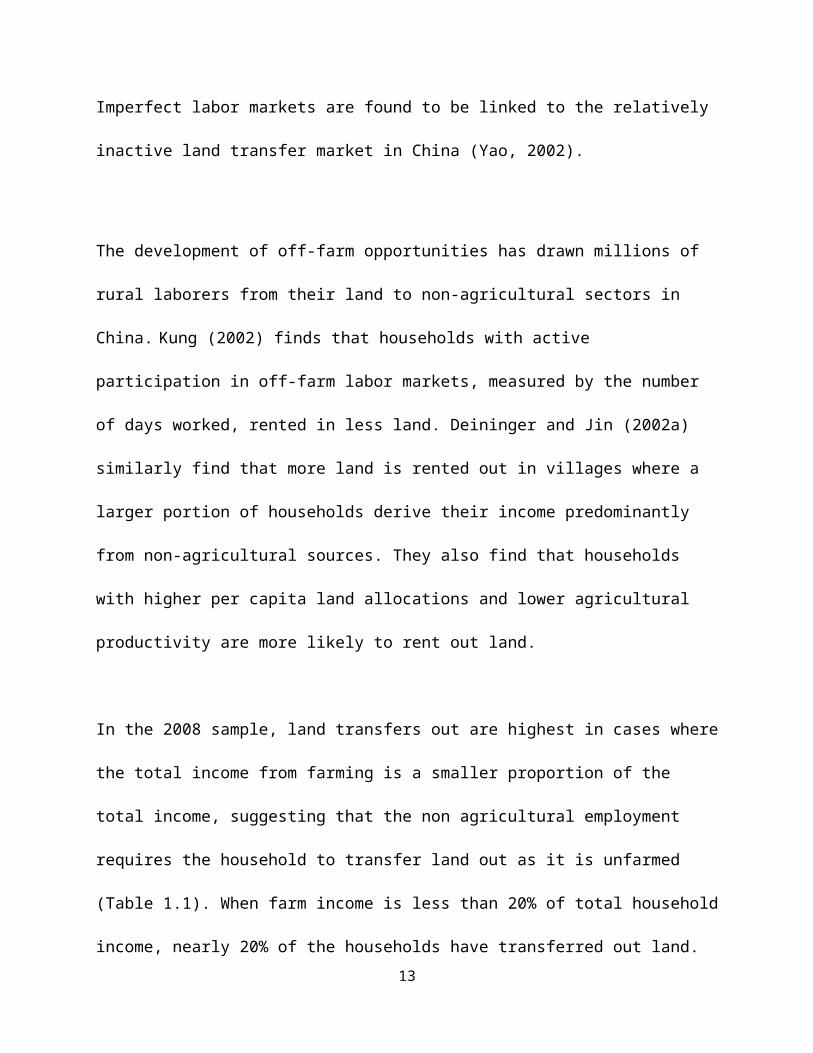
productivity of land across farmers. Imperfect labor markets are found to be linked to the
relatively inactive land transfer market in China (Yao, 2002).
The development of off-farm opportunities has drawn millions of rural laborers from their land
to non-agricultural sectors in China. Kung (2002) finds that households with active participation
in off-farm labor markets, measured by the number of days worked, rented in less land.
Deininger and Jin (2002a) similarly find that more land is rented out in villages where a larger
portion of households derive their income predominantly from non-agricultural sources. They
8
also find that households with higher per capita land allocations and lower agricultural
productivity are more likely to rent out land.
In the 2008 sample, land transfers out are highest in cases where the total income from farming is
a smaller proportion of the total income, suggesting that the non agricultural employment
requires the household to transfer land out as it is unfarmed (Table 1.1). When farm income is
less than 20% of total household income, nearly 20% of the households have transferred out
land. The incidence of land transfer out declines as the share of household income coming from
farm income increases. For households depending upon agricultural income for 80 to 100% of
their income, the incidence of transfer out is only 8%. Our data confirm that non agricultural
labor is positively correlated to a higher incidence of transfer outs.
The opposite trend is true for the incidence of transfers in (Table 1.2). The larger the share of
farm income in total income, the higher the incidence of transferring in land. For households
where farm income is 80-100% of their total household income, nearly 35% transfer in land.
Hence, the transfer in rate is highest in the group for which non-agricultural income is the
highest proportion of total income.
4. LAND TRANSFER MARKET
Despite land rights being theoretically transferable for agricultural use since the issuance of
Document 1 in 1984, we find that the market in such rights has been constrained. RLCL devoted
an entire chapter to provide the details of land market transfers. The surveys conducted in 2005
and 2008 provide detailed information on private transfers of land use rights.
9
In 2001, 19% of households reported having transferred out some or all of their land, and 18%
reported transferring land in. Amongst those households who transferred out land, 22% percent
executed a written contract and 72% also reported having obtained the permission of the
collective. Amongst the transfer out transactions in 2001, we noted the following features.
Notably, 50% of them were uncompensated transfers. Nearly 30% of the transfers were carried
out with a relative residing in the same village. A large number of these transfers were for an
unspecified length of time, with 41% recorded as “at will”. The uncompensated transfers could
arise if they occurred between the relatives for reasons such as income pooling, living
arrangements, or reasons other than monetary compensation. Given the non monetary nature of
these transfers, it is not surprising that nearly 78% of them were not officially registered.
In contrast to this, post implementation of RLCL, the 2008 survey finds 15% of the households
transferring some or all of their land out, and 17% transferring land in. 19% of the same had
executed a written contract. Notably, only 14% of these households obtained permission from
collective, with 82% stating that it was a private transfer and permission from the collective was
not needed or sought. However, the transfers were made for a short period, with 49% households
engaging in an “at will” transfer. The transfer outs are increasingly for one “year”, with a decline
in the incidence of “one season” transfers. In the 2008 survey, we also find that 9% transfers
were made for the remainder of the 30 year use rights period.
The percentage of transfer outs where compensation was received was recorded to be 37.3% in
the 2008 survey. In very few cases was reverse compensation observed. The instances of reverse
10

compensation may be explained by the fact that the households with migrant(s), or which
transfer out land rights for other reasons, risk losing land through subsequent illegal
administrative readjustments or being fined if they leave the land barren. If the land is of poor
quality, there may not be willing transferees available. If the cost of paying other cultivators is
lower than cultivating the land themselves, the households may engage in reverse compensation.
In such cases, transferring out land becomes similar to “hiring in” labor. From the 2008 survey
data (Table2), the foremost reason for transfer outs is lack of labor. Of all the households
surveyed, 8% cited lack of labor as the most important reason for transferring land out. The next
most important reason for transferring out land was high farming cost, cited by 5% of the total
households.
The partner for transferring land is predominantly a relative living in the same village, or a
fellow villager who is not a relative. Table 2 shows that the transactions with persons who are
neither relatives (in or outside the village) nor fellow villagers has increased between 2005 and
2008. In 2005, such transactions were only 10% of the total transfers. However, in 2008 14% of
all transactions were being arranged with non-relative outsiders: outside friends, outside
strangers, and others. This increase suggests confidence in the market transactions of land use
rights, as rights become more stable and written transfers are possible post - RLCL.
To further explore arms-length market activity -- where transfers are between unknown or
unrelated parties and compensation is paid -- we analyze the data from the 2008 survey. As
Table 4.1 illustrates, the documentation of the contract is more common when the transfer is
made with outside parties. Even though only 14% of the contracts between relatives are written,
11

35% of transfers between unknown, unrelated parties were recorded in writing in 2008. Also, for
these transactions there is an increased incidence of filing a contract officially with a village,
township or county government. A mere 3% of the contracts between relatives were filed with a
government organization. Finally, 35% of such transfers between strangers were recorded with a
government entity, indicating an important development in land transfer markets (Table 4.3).The
2008 survey also indicates (Table 4.4) that transfers between strangers were more likely to be
long term transfers.
5. RESULTS
The descriptive statistics presented in this paper suggest a maturation of the land transfer market
in China, especially following the Rural Land Contracting Law enacted in 2002 and
implemented in 2003. We find that the land transfers respond to a climate of secure property
rights and growth in non agricultural employment opportunities. The data also revealed that even
though the compensation for transfers in the 2008 survey was not universal, an increasing
incidence of transfers between unrelated parties was recorded. For such transfers we also
observed a relatively greater incidence of contracts being committed to in writing and filed with
a government entity.
12
References:
Croll, E. J. and P. Huang (1997). "Migration for and against agriculture in eight chinese villages." The China Quarterly
Deininger, K. and S. Jin (2002). "Journal of Development Economics." 78(1): 241-270.
Jalan, J. and M. Ravallion (1999). "Transient Poverty in Post-Reform China." Journal of Comparative Economics 26: 338-357.
Keliang, Z., R. Prosterman, et al. (2006). "The Rural Land Question in China: Analysis and recommendations based on a seventeen-province survey." Journal of International Law and Politics 38(4).
Kung, J. K.-s. (2002). "Off-Farm Labor Markets and the Emergence of Land Rental Markets in Rural China." Journal of Comparative Economics 30(2): 395-414.
Schwarzwalder, B., Roy Prosterman, Jianping Ye, Jeffrey Riedinger, and Ping Li (2002). "An update on China’s Rural Land Tenure Reforms: Analysis and Recommendations Based on a Seventeen-Province Survey." Columbia Journal of Asian Law 16(1): 141-225.
Yao, Y. (2000). "The development of the land lease market in rural China." Land Economics 76(2): 252-266
Zhao, Y. (2002). "Causes and consequences of return migration: recent evidence from China." Journal of Comparative Economics 30(2): 376-394
Zimmerman, F. J. and M. R. Carter (2003). "Asset smoothing, consumption smoothing and the reproduction of inequality under risk and subsistence constraints." Journal of Development Economics(71): 233-260.
13

TABLE 1.1 : Threats to Land Transfer Market 1999 2001 2005 2008
Readjustment (%) since first allocations 75 78 70 60
Land leased (%) currently by person or entity---- less than 20% 71.8 71.3 68.3---- 20%-40% 15 17.1 12.8---- 40%-60% 5.2 5.6 6.1---- 60%-80% 4.2 3.2 2.2---- 80%-100% 0.3 0.4 1.7---- not sure 3.6 2.4 8.9
Total Number of Households 1621 1612 1962 1740
Table 1.2: Off Farm labor Participation and Land Use Rights Transfers (2008)
Household Income Transfer Out Transfer In% from farming (% yes in each category)
less than 20% 19.6 11.520%-40% 11.6 17.140%-60% (about half) 11.6 18.760%-80% 9.4 28.280%-100% 8.4 35.6
Total 15.0 17.4
14
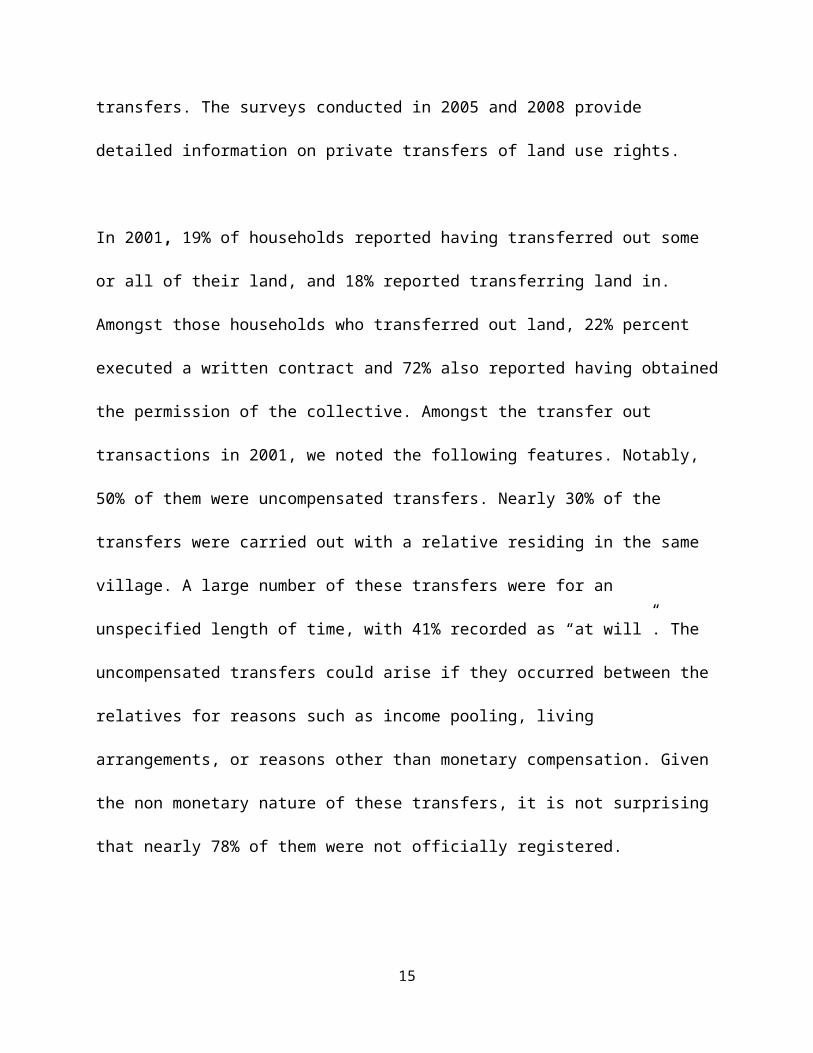
TABLE 2 : Land Transfers 1999 2001 2005 2008Transfer out (% of total households)
19.4 15.6 15
No. of transferes (%)---- Once
57 64.3
---- Two
19.2 15.6
---- Three
5.2 4.6
---- More
18.6 15.6
Reason for transfer out (%of total households)---- Lack of labor
8.4
---- High farming cost
5.1
---- Offers from transferee
1.3
---- No interest in farming
3.0
---- Moving to cities
1.8
---- Other reasons
2.3
Length of Transfer out (%)---- At will
40.6 44.948.7
---- One season
2.9 3.91.1
---- One year
21.7 22.123.8
---- Two years
7.2 5.95.7
---- Three Years
6.9 7.84.9
---- Longer than 3 years
7.2 11.16.8
---- Entire
13.5 4.29.1
15

Transferred to (%)---- A relative of the same village 29.6 44.0 31.1----Another fellow villager who is not relative 54.9 43 53.2
---- A relative who lives outside the village 4.8 3.3 1.8---- An outside friend
8.2
NA 8.4---- An outside stranger NA 3.0---- Others 2.5 9.8 2.7
Compensation received (%) 49.8 50.2 37.3Number of Housesholds 312 306 260
TABLE 3 : Land Transfers in 1999 2001 2005 2008Transfer in (% of total households) 18.3 17.3
No. of transferes (%)---- Once 45.7 53.4 ---- Two 21.7 18.7---- Three 6.7 4.6---- More 25.9 23.2
Reason for transfer in (% of total households)---- Surplus labor 3.9---- Increased Grain Prices 3.3---- Diversified production 5.5---- Non-Ag purposes 0.2---- Land readjustments or takings 1.5---- Other reasons 5.2
Length of Transfer in (%)---- At will 44.8 42.7---- One season 1.9 1.0---- One year 27.0 23.8---- Two years 7.8 5.3
16

---- Three Years 5.6 8.3---- Longer than 3 years 8.9 13.2---- Entire 3.9
Transferred to (%)---- A relative of the same village 44.7 31.1---- Another fellow villager who is not relative 43.8 53.2---- A relative who lives outside the village 4.5 1. 7---- An outside friend
25
8.3 ---- An outside stranger 3.0---- Others 2.7
Compensation received (%) 61.7 27.6Number of Housesholds 359 304
TABLE 4.1: Written Contract (2008)
Relative Villager
Relative outside village
Outside friend
Outside stranger Other Total
YES (%) 14.3 15.7 22.2 25 35 62.5 19.0NO (%) 85.1 84.3 77.8 75 65 37.5 80.1Total 84 108 9 12 20 8 241
TABLE4. 2: Private Transfer or Permission from Collective (2008)
Relative Villager
Relative outside village
Outside friend
Outside stranger Other Total
Between me and transferee (%) 94.1 86.1 77. 8 81.8 50 83.1Obtained permission from collective (%) 4.6 12.0 22.2 9.09 35 13.2Not Sure (%) 1.2 1.8 0 9.09 15 3.7Total 86 108 9 11 20 9 243
TABLE 4.3: Transfer filed with an organization (2008)
Relative Villager
Relative outside village
Outside friend
Outside stranger Other Total
17

Filed with village (%) 3.5 7.3 22.2 16.7 35 22.2 9.8Filed at township (%) 5.8 0.9 0 0 0 22.2 3.3Filed at county (%) 1.2 0 0 0 5 0 0.8
No (%) 89.5 91.7 77.8 83.3 60 55.6 86.1Total 86 109 9 12 20 9 245
TABLE 4.4: Transfer for longer than 10 years (2008)
Relative VillagerRelative
outside villageOutside friend
Outside stranger Other Total
Yes (%) 19.8 14.0 11.1 0 35 22.2 17.3No (%) 80.2 86.0 88.9 100 65 77.8 82.8Total 86 107 9 12 20 9 243
TABLE 5.1: Length of a transfer out (2008)
Relative Villager
Relative outside village
Outside friend
Outside stranger Other Total
At will (%) 55.7 52.5 50 30.8 31.8 20 49.4One Season (%) 2.3 0 0 0 4.5 0 1.1One Year (%) 18.2 28.8 10 38.5 18.2 10 23.4Two Years (%) 5.7 5.1 20 7.7 0 10 5.7Three Years (%) 3.4 5.1 10 0 13.6 0 5.0Longer Than Three (%) 5.7 2.5 10 15.4 9.1 30 6.1Entire Remaining Yrs (%) 9.1 5.9 0 7.7 22.7 30 9.2Total 88 118 10 13 22 10 261
TABLE 5.2: Length of a transfer out (2005)Relative within village
Villager/ not relative
Relative outside village Other Total
At will (%) 48.9 43.9 40 33.3 44.9One Season (%) 5.2 3.8 0 0 3.9One Year (%) 23.0 22.7 10 20 22.1Two Years (%) 5.2 3.0 20 16.7 5.9Three Years (%) 6.7 6.8 30 10 7.8Longer Than Three (%) 5.2 18.2 0 10 11.1Entire Remaining Years (%) 6.0 1.5 0 10 4.2
18

Total 135 132 10 30 307
TABLE 5.3: Length of a transfer out (2001)
Relative within village
Villager/ not relative
Relative outside village Non villager Other Total
At will (%) 37.2 45.4 40 26.9 25 40.7One Season (%) 4.3 1.1 0 11.5 0 2.8One Year (%) 29.8 19.5 13.3 15.4 0 21.4Two Years (%) 5.3 7.5 13.3 11.5 0 7.3Three Years (%) 5.3 5.7 13.3 19.2 0 6.9Longer Than Three (%) 4.3 7.5 6.7 7.7 37.5 7.3Entire Remaining Year (%) 13.8 13.2 13.3 7.7 37.5 13.6Total 94 174 15 26 8 317
TABLE 6.1: Length of a transfer in (2008)
Relative Villager
Relative outside village
Outside friend
Outside stranger Other Total
At will (%) 58.7 39.5 80 12.5 11.1 12.5 42.4One Season (%) 1.1 0.6 20 0 0 0 1.0One Year (%) 15.2 27.4 0 37.5 33.3 25 24.1Two Years (%) 5.4 6.4 0 4.2 0 0 5.4Three Years (%) 2.2 10.2 0 12.5 22.2 25 8.5Longer Than Three (%) 12.0 10.2 0 33.3 33.3 12.5 13.2Entire Remaining Year (%) 9.1 5.9 0 7.7 22.7 30 9.2Total 92 157 5 24 9 8 295
TABLE 6.2: Length of a transfer in (2005)
Relative
within villageVillager/ not relative
Relative outside village Other Total
At will (%) 48.4 44.2 62.5 20 45.2One Season (%) 1.3 1.9 6.2 0 1.7One Year (%) 29.6 24.4 6.2 40 27.0Two Years (%) 7.5 9.6 6.2 0 7.9Three Years (%) 3.8 6.4 0 16 5.6Longer Than Three (%) 5.1 10.9 12.5 16 8.7Entire Remaining Years (%) 4.4 2.6 6.2 8 3.9
19

Total 159 156 16 25 356
TABLE 6.3: Length of a transfer in (2001)
Relative within
villageVillager/ not relative
Relative outside village Other Total
At will (%) 42.3 38.2 50 31.2 39.5One Season (%) 6.2 1.3 0 0 2.9One Year (%) 26.8 23.6 0 12.5 23.5Two Years (%) 5.1 9.5 33.3 25 9.4Three Years (%) 5.1 9.0 0 6.2 7.2Longer Than Three (%) 14.4 18.5 16.7 25 17.4Entire Remaining Years (%) 97 157 6 16 276Total 159 156 16 25 356
20
i The collectives include villages and small groups.ii2 PRC Rural Land Contracting Law was adopted by the Standing Committee of the National People’s Congress in November 2002.
iii 3Based on a summary of surveys and field investigations, the Research Team on Rural Population Mobility of the China Population Information and Research Center and the Rural Development Institute of the Chinese Academy of Social Sciences conclude that the number of rural migrants leaving their villages for either short or long periods of work reached 120 million by the mid-1990s. See Croll and Huang (1997) iv4In the absence of social security in rural areas, households also may transfer land use rights to smooth consumption. Jalan and Ravallion (1999) document the greater vulnerability of poor farmers in China to income risks. Farmers, especially those facing credit constraints, may market their land use rights in times of income shock, caused by adverse weather, bad health or other unexpected events, to maintain consumption levels. Zimmerman and Carter (2002) found that in West Africa the strongest demand for a land market emanates from the desire of low wealth agents to use the market to buffer production risks after the demise of a number of social institutions, which traditionally managed risk in the region. In this case, the land transfer market functions as an option of risk management rather than simply as a means of enhancing efficiency.
v5In late 1998, the Standing Committee of the National People’s Congress revised the 1986 Land Management Law (LML) and enacted the 1994 policy statement, which extends the individual land use contracts to 30 years, into law. This series of survey was designed to evaluate the implementation of the 30-year land use rights policy. For more detail on the survey design and methodology, see Schwarzwalder et al. (2002).
vi6See 2000 Agricultural Statistical Yearbook.
vii7 In contrast to village-level surveys which rely on data from village officials, this household survey was designed to exclude cadre from the survey and from being present during the household interview. This design reflected concerns about possible bias in farmer responses to questions relating to the behavior of village cadre, particularly as relates to implementation of and adherence to the 30-year no-readjustment policy embodied in the 1994 policy and the 1998 amendments to the Land Management Law and the 2002 Rural Land Contracting Law