the impact of project delivery methods on dispute
TRANSCRIPT
Bowling Green State University Bowling Green State University
ScholarWorks@BGSU ScholarWorks@BGSU
Master of Technology Management Plan II Graduate Projects
College of Technology, Architecture and Applied Engineering
Winter 12-14-2016
The Impact of Project Delivery Methods on Dispute Occurrence in The Impact of Project Delivery Methods on Dispute Occurrence in
Public Highway Projects Public Highway Projects
Samaneh Nasrollahi Bowling Green State University
Ghada M. Gad University of Cal Poly Pomona
Alan Atalah Bowling Green State University
Follow this and additional works at: https://scholarworks.bgsu.edu/ms_tech_mngmt
Part of the Civil Engineering Commons, Construction Engineering Commons, Construction
Engineering and Management Commons, and the Transportation Engineering Commons
Recommended Citation Recommended Citation Nasrollahi, Samaneh; Gad, Ghada M.; and Atalah, Alan, "The Impact of Project Delivery Methods on Dispute Occurrence in Public Highway Projects" (2016). Master of Technology Management Plan II Graduate Projects. 24. https://scholarworks.bgsu.edu/ms_tech_mngmt/24
This Thesis is brought to you for free and open access by the College of Technology, Architecture and Applied Engineering at ScholarWorks@BGSU. It has been accepted for inclusion in Master of Technology Management Plan II Graduate Projects by an authorized administrator of ScholarWorks@BGSU.

Samaneh Nasrollahi
A Major Project
Submitted to the Graduate College of Bowling Green State University
in Partial Fulfillment of Requirements for the Degree of
Master of Technology Management
Construction Management
Committee:
Dr. Alan Atalah
Dr. Ghada M. Gad
December 2016
THE IMPACT OF PROJECT DELIVERY
METHODS ON DISPUTE OCCURANCE IN
PUBLIC HIGHWAY PROJECTS

© 2016
Samaneh Nasrollahi
All right reserved
2
Table of Contents
ACKNOWLEDGEMENT .......................................................................................................... 7
CHAPTER I: INTRODUCTION ............................................................................................... 8
1.1 Introduction ....................................................................................................................... 8
1.2 Statement of the problem ................................................................................................ 10
1.3 Significance of this study ................................................................................................ 10
1.4 Research methodology .................................................................................................... 11
CHAPTER II: REVIEW OF LITERATURE ........................................................................... 13
2.1 Introduction ..................................................................................................................... 13
2.2 Project delivery methods ................................................................................................ 14
2.3 Disputes and disputes resolution methods ...................................................................... 19
2.4 Point of departure ........................................................................................................... 24
CHAPTER III: RESEARCH METHODOLOGY .................................................................... 25
3.1 Introduction ..................................................................................................................... 25
3.2 Research methods ........................................................................................................... 25
3.2.1 Quantitative research ................................................................................................ 26
3.2.2 Qualitative research .................................................................................................. 26
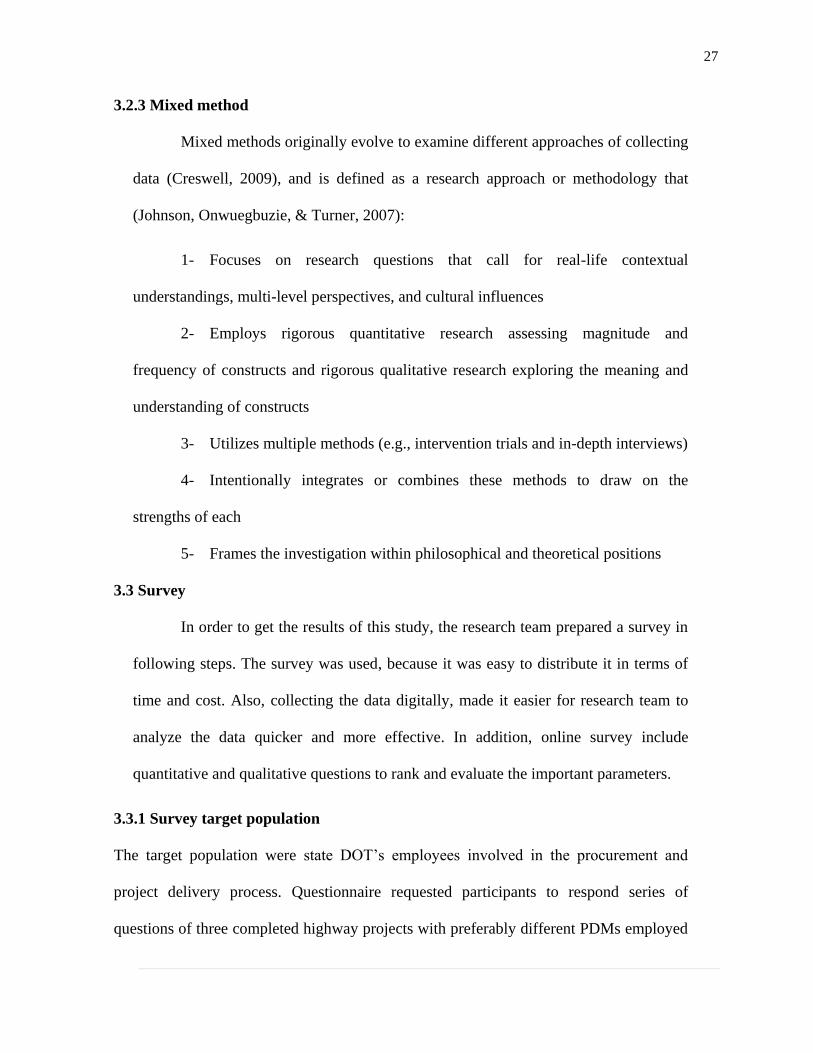
3.2.3 Mixed method .......................................................................................................... 27
3.3 Survey ............................................................................................................................. 27
3.3.1 Survey target population .......................................................................................... 27
3.3.2 Survey design and distribution ................................................................................. 28
CHAPTER IV: FINDINGS ...................................................................................................... 30
4.1 General data information and demographics .................................................................. 30
4.2 Normality Test ................................................................................................................ 39
4.3 One-way ANOVA Test among DBB, DB, and CM parameters ................................... 41
3
4.3.1 One-way ANOVA: Cost claim severity DBB, DB and CM/GC ............................. 42
4.3.2 One-way ANOVA: Time claim severity DBB, DB and CM/GC ............................ 42
4.3.3 One-way ANOVA: Time and cost claim frequency DBB, DB and CM/GC .......... 43
4.3.4 One-way ANOVA: Overall successful of DBB, DB and CM/GC .......................... 43
4.3.5 One-way ANOVA: Design satisfaction of DBB, DB and CM/GC ......................... 44
4.3.6 One-way ANOVA: Constriction satisfaction of DBB, DB and CM ....................... 44
4.3.7 One-way ANOVA: Cost growth of DBB, DB and CM/GC .................................... 45
4.3.8 One-way ANOVA: Schedule growth of DBB, DB and CM/GC ............................. 46
4.4 Two sample T-test, the difference between means of DBB and DB parameters ........... 48
4.4.1 Two sample T-test: Cost claim severity DBB and DB ............................................ 48
4.4.2 Two sample T-test: Time claim severity DBB and DB ........................................... 49
4.4.3. Two sample T-test: Time & cost claim frequency DBB and DB ........................... 49
4.4.4 Two sample T-test: Overall success of the DBB and DB ........................................ 50
4.4.5 Two sample T-test: Design satisfaction DBB and DB* .......................................... 50
4.4.6 Two sample T-test: Construction satisfaction DBB and DB ................................... 51
4.4.7 Two sample T-test: Cost growth DBB and DB* ..................................................... 52
4.4.8 Two sample T-test: Schedule growth DBB and DB ................................................ 52
4.5 T test, the difference between means of DBB and APDMs parameters ......................... 54
4.5.1 Two-sample T-test: Cost claim severity DBB and APDMs .................................... 54
4.5.2 Two-sample T-test: Time claim severity DBB and APDMs ................................... 54
4.5.3. Two-sample T-test: Time & cost claim frequency DBB and APDMs ................... 55
4.5.4 Two-sample T-test: Overall success DBB and APDMs .......................................... 56
4.5.5 Two-sample T-test: Design satisfaction DBB and APDMs ..................................... 56
4.5.6 Two-sample T-test: Construction satisfaction DBB and APDMs ........................... 57
4.5.7 Two-sample T-test: Cost Growth DBB and APDMs ............................................... 57

4
4.5.8 Two-sample T-test: Schedule growth DBB and APDMs ........................................ 58
4.6 Conclusion ...................................................................................................................... 59
4.7 Discussion ...................................................................................................................... 60
CHAPETR V: CONCLUSIONS AND FUTURE RECCOMENDATIONS ........................... 63
5.1 Conclusions ..................................................................................................................... 63
5.2 Limitations and future recommendations ....................................................................... 64
APPENDICES .......................................................................................................................... 66
Appendix A: Bibliography ................................................................................................... 67
Appendix B: Questionnaire .................................................................................................. 71
Appendix C: Raw data and graphs ....................................................................................... 81
5
List of figures
Figure 1: Design-bid- build diagram (Brookwood, 2015) ....................................................... 15
Figure 2: Design- build diagram (Brookwood, 2015) .............................................................. 16
Figure 3: Construction management/ general contractor diagram (FHWA, 2015) .................. 16
Figure 4: Comparison of different DRMs (Ghada G. M., 2012) .............................................. 24
Figure 5: States involved in the research .................................................................................. 31
Figure 6: Various department participation in the research ..................................................... 32
Figure 7: Number of PDM used in DOTs contracts ................................................................. 32
Figure 8: Project budgets and durations ................................................................................... 33
6
List of tables
Table 1: Participant involvement in different phases ............................................................... 34
Table 2: Design and construction complexity .......................................................................... 34
Table 3: Participant solicitation methods ................................................................................. 35
Table 4: Payment methods in each PDM ................................................................................. 35
Table 5: The owner and builders relationship .......................................................................... 36
Table 6: DRMs used in project ................................................................................................. 37
Table 7: Descriptive analysis of parameters ............................................................................. 39
Table 8: Normality test results ................................................................................................. 40
Table 9: The p-value definition ................................................................................................ 41
Table 10: The One-way ANOVA Test for Critical Parameters in PDMs ................................ 47
Table 11: The t-test for critical parameters compared DBB and DB means, p-value <0.05 is
considered as a significant difference ...................................................................................... 53
Table 12: T-test for critical parameters compared DBB and APDMS Means ......................... 59
Table 13: Summary report of results conducted ...................................................................... 60

7
ACKNOWLEDGEMENT
I would first like to thank my thesis advisor Dr. Ghada Gad of the
Construction, Engineering School at University of California State Polytechnic
University, Pomona. She was always open whenever I ran into a trouble spot or had a
question about my research or writing. She consistently allowed this paper to be my
own work, but steered me in the right direction whenever she thought I needed it.
I would also like to thank Dr. Alan Atalah of the Construction Management
School at Bowling Green State University as the second reader of this thesis, and I am
gratefully indebted to him for his valuable help during my Master’s studies.
I would also like to thank the experts who were involved in the validation
survey for this research project; the experts and engineers worked in DOT in all states
of the United States. Without their passionate participation and input, the validation
survey could not have been successfully conducted.
Finally, I must express my very profound gratitude to my parents and my
sisters, my brother, Massoud Nasrollahi, and my friend, Mouloud Messaoudi, for
providing me with unfailing support and continuous encouragement throughout my
years of study and through the process of researching and writing this thesis. This
accomplishment would not have been possible without them. Thank you.
Samaneh Nasrollahi
8
CHAPTER I: INTRODUCTION
1.1 Introduction
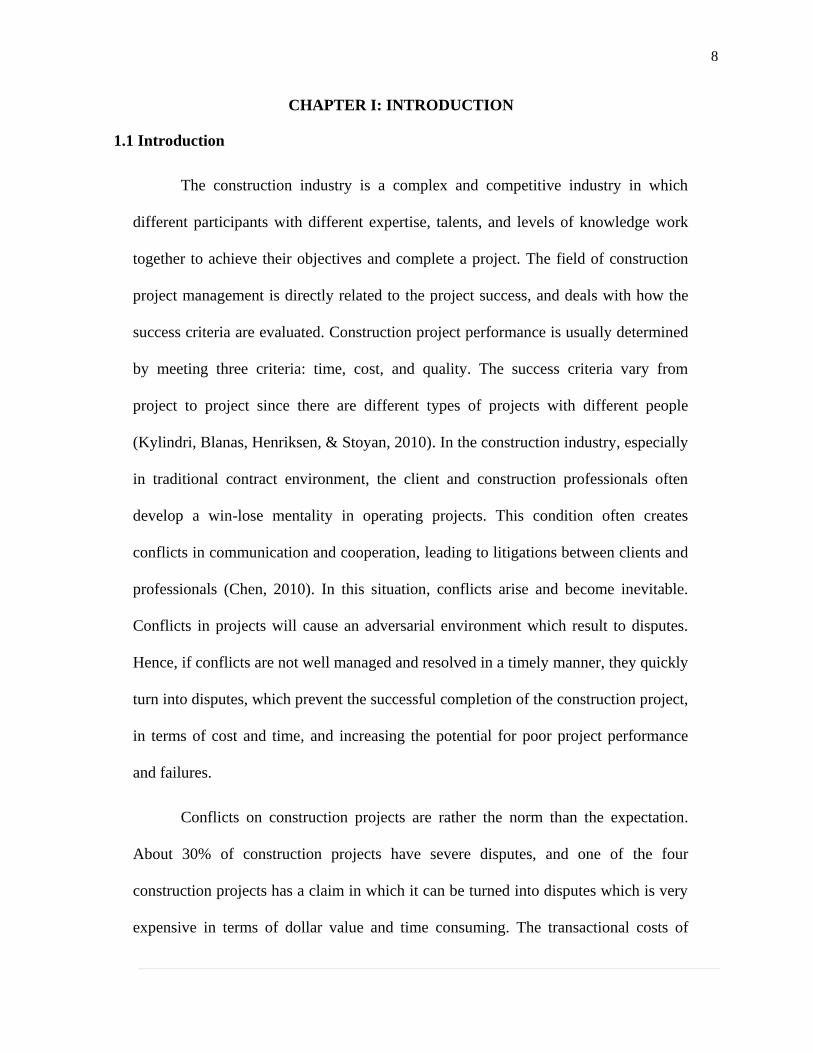
The construction industry is a complex and competitive industry in which
different participants with different expertise, talents, and levels of knowledge work
together to achieve their objectives and complete a project. The field of construction
project management is directly related to the project success, and deals with how the
success criteria are evaluated. Construction project performance is usually determined
by meeting three criteria: time, cost, and quality. The success criteria vary from
project to project since there are different types of projects with different people
(Kylindri, Blanas, Henriksen, & Stoyan, 2010). In the construction industry, especially
in traditional contract environment, the client and construction professionals often
develop a win-lose mentality in operating projects. This condition often creates
conflicts in communication and cooperation, leading to litigations between clients and
professionals (Chen, 2010). In this situation, conflicts arise and become inevitable.
Conflicts in projects will cause an adversarial environment which result to disputes.
Hence, if conflicts are not well managed and resolved in a timely manner, they quickly
turn into disputes, which prevent the successful completion of the construction project,
in terms of cost and time, and increasing the potential for poor project performance
and failures.
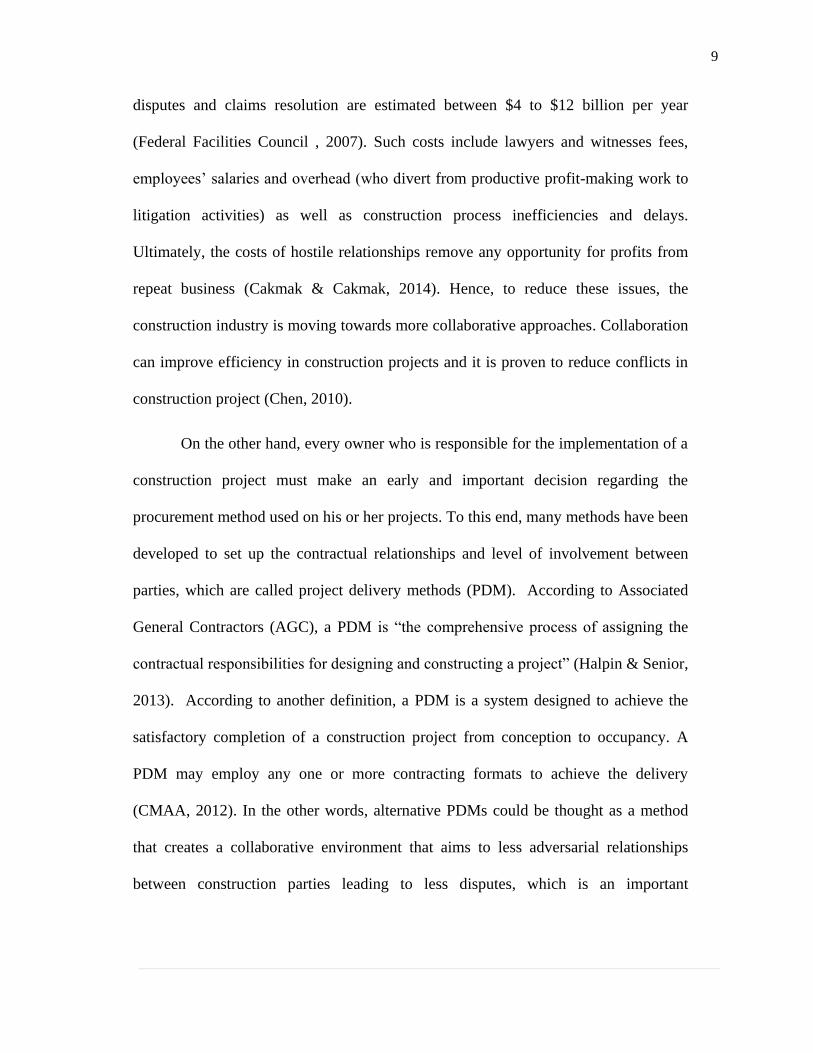
Conflicts on construction projects are rather the norm than the expectation.
About 30% of construction projects have severe disputes, and one of the four
construction projects has a claim in which it can be turned into disputes which is very
expensive in terms of dollar value and time consuming. The transactional costs of
9
disputes and claims resolution are estimated between $4 to $12 billion per year
(Federal Facilities Council , 2007). Such costs include lawyers and witnesses fees,
employees’ salaries and overhead (who divert from productive profit-making work to
litigation activities) as well as construction process inefficiencies and delays.
Ultimately, the costs of hostile relationships remove any opportunity for profits from
repeat business (Cakmak & Cakmak, 2014). Hence, to reduce these issues, the
construction industry is moving towards more collaborative approaches. Collaboration
can improve efficiency in construction projects and it is proven to reduce conflicts in
construction project (Chen, 2010).
On the other hand, every owner who is responsible for the implementation of a
construction project must make an early and important decision regarding the
procurement method used on his or her projects. To this end, many methods have been
developed to set up the contractual relationships and level of involvement between
parties, which are called project delivery methods (PDM). According to Associated
General Contractors (AGC), a PDM is “the comprehensive process of assigning the
contractual responsibilities for designing and constructing a project” (Halpin & Senior,
2013). According to another definition, a PDM is a system designed to achieve the
satisfactory completion of a construction project from conception to occupancy. A
PDM may employ any one or more contracting formats to achieve the delivery
(CMAA, 2012). In the other words, alternative PDMs could be thought as a method
that creates a collaborative environment that aims to less adversarial relationships
between construction parties leading to less disputes, which is an important
10
consideration prior to starting a project, since it significantly affects budget, quality,
design, project scheduling, risk sharing, payment method, and relationships.
1.2 Statement of the problem
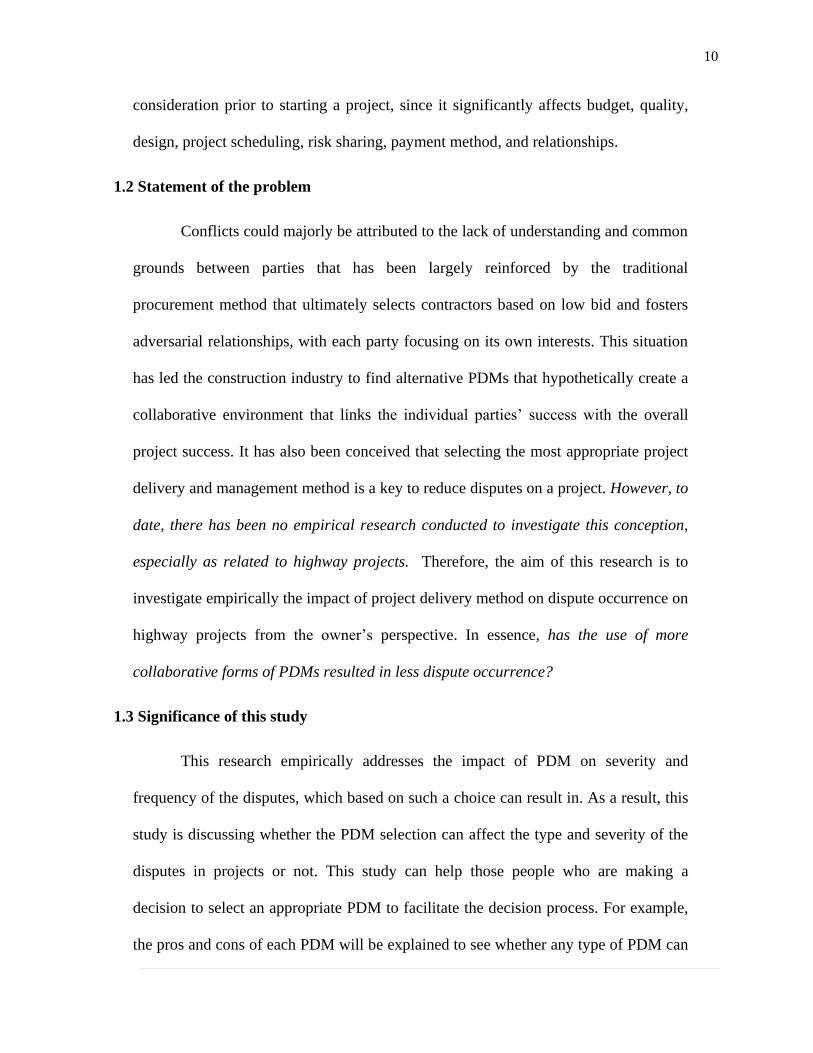
Conflicts could majorly be attributed to the lack of understanding and common
grounds between parties that has been largely reinforced by the traditional
procurement method that ultimately selects contractors based on low bid and fosters
adversarial relationships, with each party focusing on its own interests. This situation
has led the construction industry to find alternative PDMs that hypothetically create a
collaborative environment that links the individual parties’ success with the overall
project success. It has also been conceived that selecting the most appropriate project
delivery and management method is a key to reduce disputes on a project. However, to
date, there has been no empirical research conducted to investigate this conception,
especially as related to highway projects. Therefore, the aim of this research is to
investigate empirically the impact of project delivery method on dispute occurrence on
highway projects from the owner’s perspective. In essence, has the use of more
collaborative forms of PDMs resulted in less dispute occurrence?
1.3 Significance of this study
This research empirically addresses the impact of PDM on severity and
frequency of the disputes, which based on such a choice can result in. As a result, this
study is discussing whether the PDM selection can affect the type and severity of the
disputes in projects or not. This study can help those people who are making a
decision to select an appropriate PDM to facilitate the decision process. For example,
the pros and cons of each PDM will be explained to see whether any type of PDM can
11
reduce or share the risk between parties in order to reduce the disputes or to see other
positive and negative impacts on outputs. Since disputes lead to project delays and
failure to meet the contract specifications and building standards (Tolson, 2013),
hence, significant amount of time, effort, funds, and energy can be saved and allocated
towards providing more benefits to the project users.
Many research studies, scholars, and practitioners started investigating the
alternative PDMs’ impact on cost, schedule, quality, party’s relationship, and
sustainability; however, there is still limited research to investigate empirically the
impact of the PDM on the dispute resolution process and the choice to resolve disputes
outside of the litigation and arbitration. Due to the lack of understanding regarding the
theory and practice of how PDMs, contract types, procurement, and team behavior can
affect disputes, the aim of this study is to conduct a close investigation on how PDMs’
choice has affected disputes in construction contracts. Accordingly, this research
attempts to answer the following questions: “What is the effect of PDM selection on
the frequency and severity of dispute occurrence in highway construction projects
from the owner’s perspective?”
1.4 Research methodology
To answer the research question and achieve the objective of this study, the
researchers designed a web-based survey questionnaire. The respondents answered
series of questions on the procurement process and dispute occurrence of three
recently completed highway projects with preferably different PDMs employed (such
as design-build, construction manager/ general contractor (CM/GC), and design-bid-
build). The survey target respondents were experts in 50 state departments of

12
transportation who have been involved in the procurement/innovative contract
delivery process.

13
CHAPTER II: REVIEW OF LITERATURE
2.1 Introduction
There are numerous construction projects taking place around the world and
contracts are signed for each project. The client parties shall quote their objective in
the contract and expect parties to abide by their agreement for mutual benefits
(Dhanushkdi, 2012). In the construction process, there are so many parties involved
like suppliers, buyers and builders. The relationships among these parties are
maintained by forming a contract. A contract is a legal agreement made between two
or more parties for a delivery of certain services in return for money or any other
value. The main function of a contract is to (Dhanushkdi, 2012):
1) To specify the work to be done.
2) The amount to be paid.
3) To assign the responsibilities to the parties to finish the work.
4) Decide who takes charge for unexpected events if they occur.
The success of a construction project may depend on how well factors such as
procurement methods, payment types, organizational and contractual policies, change
orders mechanism, scheduling, budget, level of design, level of the trust in
organization and etc. are going to be managed and addressed.
Therefore, this chapter will be discussing about following categories as
relevant to the study.
The first section of this chapter will be a history of the studies conducted in
PDMs; and the second section will be discussing about the disputes and disputes

14
resolution methods used in construction industry, and give the readers a
comprehensive understanding of different types of resolving methods for disputes
along with the advantages and disadvantages of each method.
2.2 Project delivery methods
With the many causes of disputes and continuously emerging conception that
alternative project delivery methods reflect the collaborative-based approach of project
delivery compared to traditional project delivery, which is viewed as more adversarial,
the question becomes whether the alternative PDMs used in public highway projects
have been able to reduce dispute occurrence on highway projects. According to AGC
(Associate General Contractors) a Project Delivery Method is “the comprehensive
process of assigning the contractual responsibilities for designing and constructing a
project” (Halpin & Senior, 2013). This method is an important consideration prior to
starting of a project, since it has a significant impact on budget, quality, design, risk,
and project scheduling. The most common PDMs used in the construction industry are
design-bid-build (DBB), design-build (DB), and Construction Manager/General
Contractor (CM/GC).
DBB, the traditional form of PDM, typically involves three sequential phases:
design, bid, and construction. The owner hires an engineer to design the project and
develop the plans and specifications. The project is then put up for a competitive bid
when a contractor is procured, who builds the project. Project award is usually based
on the lowest responsive bid with fixed price contracts (Figure 1). DBB are challenged
by creating adversarial relationships among project participants and lacking of
contractor’s input during design which eventually leads to potential change orders. In

15
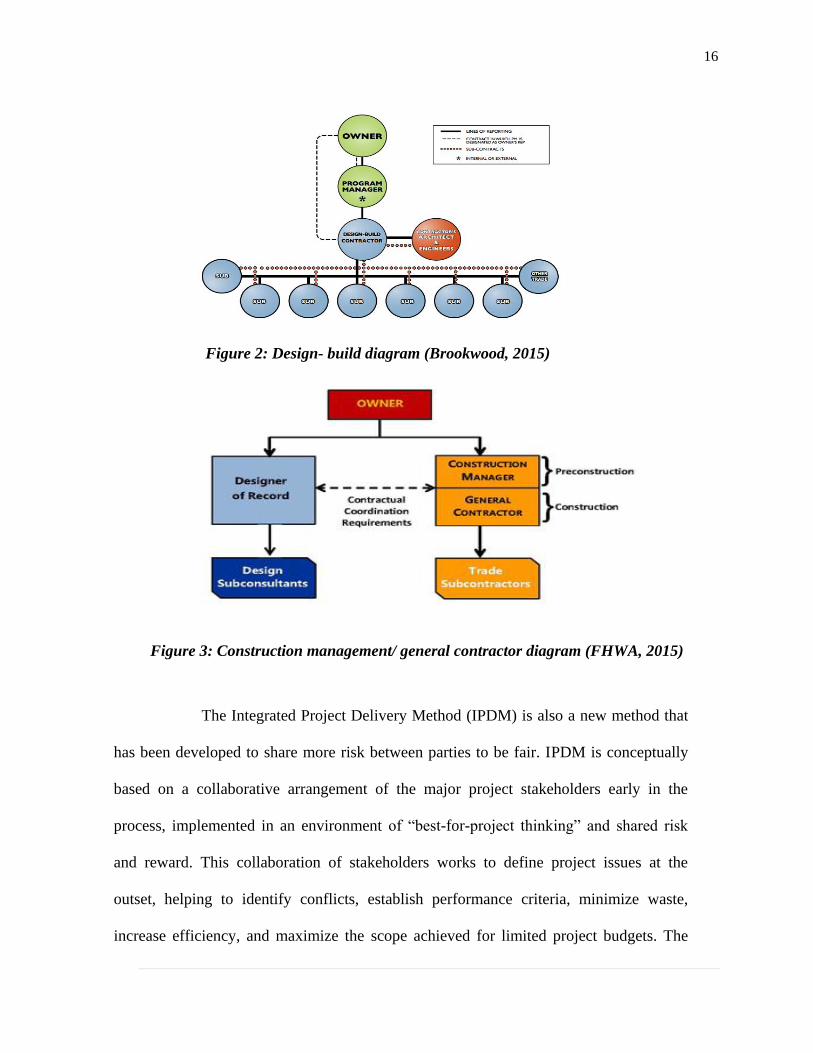
case of DB PDM, the owner hires one entity to serve as both the engineer and the
contractor (Figure 2). This set-up allows contractor’s input during design, single point
of responsibility for construction and design, and fast-track delivery. In addition,
construction can start before the design completion and thus saves time. The owner
can also use the contractor’s expertise during the design phase of the project and the
architect/engineer’s expertise during the construction phase. In recent years, the use of
DB has considerably increased in the U.S, and it is making this delivery method one of
the most significant methods in design and construction today. Research has found
that the DB is more effective in large and complex projects (Konchar & Sanvido,
1998). The last most popular method discussed in this paper is CM/GC which is a
PDM that implicates a commitment by the CM for construction performance to hand
over the project through a defined schedule and price either a fixed price or
Guaranteed Maximum Price (GMP). This method features a cohesive three-party team
of owner, separate architect-designer, and the construction firm serving as
construction manager (Figure 3). The advantages of this method is that the selection is
usually qualification-based and the owner can save time and money by reducing
change orders that can result in disputes.
Figure 1: Design-bid- build diagram (Brookwood, 2015)
16
Figure 2: Design- build diagram (Brookwood, 2015)
Figure 3: Construction management/ general contractor diagram (FHWA, 2015)
The Integrated Project Delivery Method (IPDM) is also a new method that
has been developed to share more risk between parties to be fair. IPDM is conceptually
based on a collaborative arrangement of the major project stakeholders early in the
process, implemented in an environment of “best-for-project thinking” and shared risk
and reward. This collaboration of stakeholders works to define project issues at the
outset, helping to identify conflicts, establish performance criteria, minimize waste,
increase efficiency, and maximize the scope achieved for limited project budgets. The
17
ultimate goal is to create a project environment that produces a positive outcome for all
stakeholders. Although not exclusive to the IPDM, multi-party agreements can include
incentive clauses based on the idea of shared savings among the project team (The
American Institute of Architects & The Associated General Contractors of America,
2011).
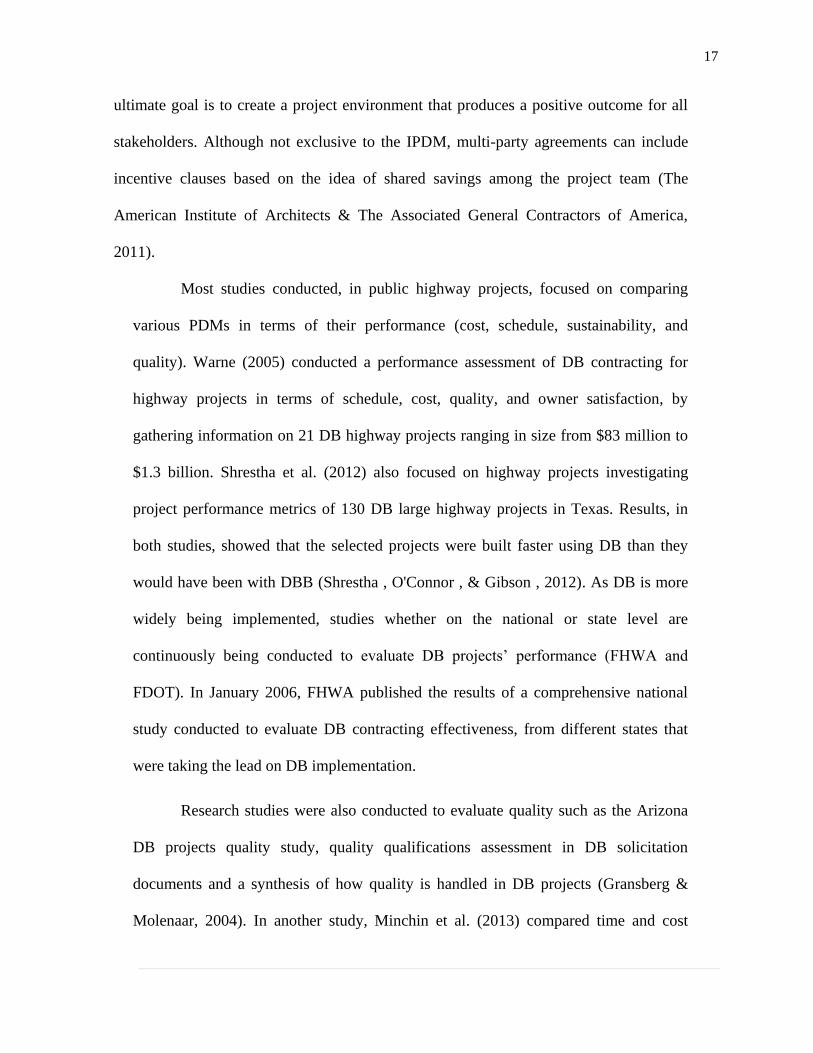
Most studies conducted, in public highway projects, focused on comparing
various PDMs in terms of their performance (cost, schedule, sustainability, and
quality). Warne (2005) conducted a performance assessment of DB contracting for
highway projects in terms of schedule, cost, quality, and owner satisfaction, by
gathering information on 21 DB highway projects ranging in size from $83 million to
$1.3 billion. Shrestha et al. (2012) also focused on highway projects investigating
project performance metrics of 130 DB large highway projects in Texas. Results, in
both studies, showed that the selected projects were built faster using DB than they
would have been with DBB (Shrestha , O'Connor , & Gibson , 2012). As DB is more
widely being implemented, studies whether on the national or state level are
continuously being conducted to evaluate DB projects’ performance (FHWA and
FDOT). In January 2006, FHWA published the results of a comprehensive national
study conducted to evaluate DB contracting effectiveness, from different states that
were taking the lead on DB implementation.
Research studies were also conducted to evaluate quality such as the Arizona
DB projects quality study, quality qualifications assessment in DB solicitation
documents and a synthesis of how quality is handled in DB projects (Gransberg &
Molenaar, 2004). In another study, Minchin et al. (2013) compared time and cost
18
performance of 60 projects from Florida DOT (FDOT) and found that DBB projects
outperform DB projects in terms of cost (Minchin, Li, Issa, & Vargas, 2013). As can
be seen, most research discussed earlier have considered cost, time, and quality but
there hasn’t been any major work that directly addresses the relationship between
PDM used and disputes occurrence, especially as related to highway projects.
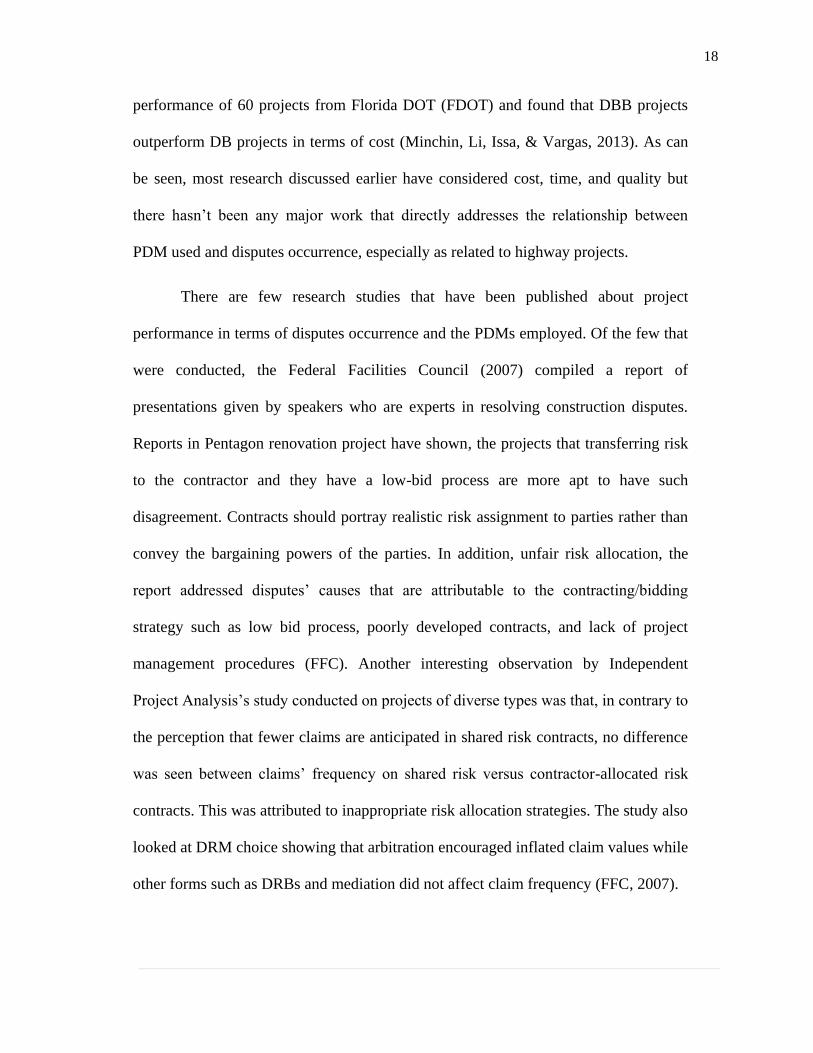
There are few research studies that have been published about project
performance in terms of disputes occurrence and the PDMs employed. Of the few that
were conducted, the Federal Facilities Council (2007) compiled a report of
presentations given by speakers who are experts in resolving construction disputes.
Reports in Pentagon renovation project have shown, the projects that transferring risk
to the contractor and they have a low-bid process are more apt to have such
disagreement. Contracts should portray realistic risk assignment to parties rather than
convey the bargaining powers of the parties. In addition, unfair risk allocation, the
report addressed disputes’ causes that are attributable to the contracting/bidding
strategy such as low bid process, poorly developed contracts, and lack of project
management procedures (FFC). Another interesting observation by Independent
Project Analysis’s study conducted on projects of diverse types was that, in contrary to
the perception that fewer claims are anticipated in shared risk contracts, no difference
was seen between claims’ frequency on shared risk versus contractor-allocated risk
contracts. This was attributed to inappropriate risk allocation strategies. The study also
looked at DRM choice showing that arbitration encouraged inflated claim values while
other forms such as DRBs and mediation did not affect claim frequency (FFC, 2007).

19
Two other studies, one in Malaysia and the other in UK reported that
alternative PDMs reduced disputes frequency (Ndekugri & Turner, 1994). Mante et al.
(2012) conducted a preliminary study on dispute resolution by analyzing DRM
provisions in standard contract forms showing that regardless of the PDM, the same
dispute resolution provisions were used (Mante, Ndekugri , Ankrah , & Hammond ,
2012). The paper also reinforced our literature review that the amount of research
done related to PDM and dispute occurrence is limited.
2.3 Disputes and disputes resolution methods
The topics of disputes and claims have been extensively researched in
construction, mostly focus on identifying the causes of disputes/claims and the
different forms of dispute resolution methods used. The substantial issue springs from
when the world is experiencing economic troubles and money is tight, disputes often
arise, because construction project participants are not willing/able to compromise.
Disputes over actual or implied variations and scope of work, are the most common
concerns during construction of a project. Hereby, when conflicts do not get resolved
in a timely manner, they become very expensive – in terms of finances, personnel,
time, and opportunity costs. The visible expenses (e.g., attorneys, expert witnesses, the
dispute resolution process itself) alone are significant. The less visible costs (e.g.,
company resources assigned to the dispute, lost business opportunities) and the
intangible costs (e.g., damage to business relationships, potential value lost due to
inefficient dispute resolution) are also considerable, although difficult or impossible to
quantify. It is estimated that construction litigation expenditures in the United States

20
have increased at an average rate of 10 percent per year during 1988-1998, and now
total nearly $5 billion annually (Michel, 1998).
As a result, many of these disputes ultimately must be resolved in the legal
system (Klinger, 2009). There are many causes of disputes on construction projects.
The most problematic issues in construction projects are as follows: first, are plans and
specifications/scope of work, in this situation when there is no detail and clear
information attached or when it is ambiguous, owner, contractor, designer, and
engineering interpret different description, and ultimately it could result in a conflict.
Second, are shop drawings and submittals that they are not fully followed, and then
they cause delays, either in the timeliness of the contractor/subcontractor submitting
shop drawings and submittals or in the design professionals responding back in a
timely fashion. Third, Change orders/extra or out-of-scope work in which disputes
start due to whether or not the contractor/ subcontractor is entitled to extra time. The
forth is differing site condition, with two different approaches. The common approach
is that the owner has the duty to disclose information, even if the owner does not have
any knowledge about the construction phases (Klinger, 2009).
Acharya and Lee (2006) also identified almost similar issues which confirms
the effects of the above issues in construction disputes. They have determined six
critical conflicts in construction industry: site conditions, local people obstruction,
errors and omissions in design, double meaning in specifications, excessive quantity of
works, and difference in change order evaluation (Acharya, Lee , & Im, 2006). Sigitas
and Tomas (2013) hypothesize that the true cause of construction-related conflicts is
unsuccessful communication among the construction project participants (Neuendorf,
21
2002). Cheng. S and Peng. K (2013) in their research showed that disputes are an
epidemic factor of the construction industry with inadequate contract documents
(contract incompleteness) and behavioral factors being the notable sources of disputes.
In the transportation sector, Mahany. H and Grigg. N (2014) used data
collected from Colorado Department of Transportation projects to test the causes of
potential claims; of the 780 projects reported that were completed between 1997 to
2012, 213 claims in 62 projects showed that delays were the main reason for claims
and were even more significant compared to change orders. This study also showed
that the project with fixed completion date are more prone to claims than the flexible
completion dates (Mehany & Grigg, 2014). On the other side, Ibbs. W and Chen. C
showed that the primary reason of claims are changes that stem from schedule delays
and cost overruns. To avoid changes, they developed a tool named Proactive Project
Change - Prediction Tool based on empirical formulation which attempts to improve
change management and accordingly project performance (Ibbs & Chen , 2015). With
late deliverables being an inevitable factor resulting in claims as well, the Construction
Industry Institute (CII), in collaboration with Construction User Roundtable and the
Commissioned Research Team investigated the different types of late deliverables that
affect cost, quality, safety, and organizational performance, in an attempt to help
reduce disputes (Barry & Leite, 2015).
Thus, all of the research studies done showed that disputes frequently stop the
project’s progress, causing major conflicts that affect project performance (Schieg,
2008). If not properly managed, disputes may lead to delays in projects, lower team
spirit, increase project costs, and damage business relationships (Chan & Suen, 2005).
22
In addition to the court route –litigation- of dispute resolution, the construction
industry has been on the innovative edge of dispute resolution with many forms of
Alternative DRMs (ADRMs) such as negotiation, dispute review boards (DRBs),
arbitration. According to the American bar, ADRMs are increasingly used in the
construction industry in lieu of or as a step preceding litigation, as they can handle
disputes quicker and are relatively inexpensive. Gad et al (2015) mentioned that these
alternative DRMs could be binding to assure parties that they will not have to resort to
outside litigation to settle disputes (Gad, Momoh, Esmaeili, & Gransberg, 2015).
The most common form of ADRM is negotiation which is usually the first step
towards any dispute resolution. There are many advantages to negotiation as it is
private and confidential, quick and inexpensive with parties having full control of the
process (Safinia , 2014). As for mediation, Texas Civil Practice and remedies code
154.023 defines mediation as “a forum in which an impartial person, the mediator,
facilitates communication between parties to promote reconciliation, settlement, or
understanding among them.” In a simple language, mediators are neutral third parties,
but a good listener for both parties to find an overall solution by suggesting and urging
two parties to solve their issues. It can occur as early in the process as the parties are
able to organize mediation and identify a mutually agreeable mediator (Klinger, 2009).
One of the increasingly used forms of DRM in the highway public sector are
DRBs. DRBs involves three neutral experts who visit the site periodically and monitor
progress and potential problems that might lead to disputes. Once a dispute occurs, it
is brought to the board who conducts an informal hearing and issues an advisory
opinion that could be either binding or non-binding. DRB cost is far less than using
23
arbitration or litigation. Finally, arbitration is a non-judicial form of dispute resolution.
Its main advantage emerges from the fact that construction disputes usually require the
third party to be well-versed not only in legal issues but also in technical and industrial
matters (Yates & Smith, 2007). Though similar to litigation, it has many advantages
over litigation, as it is less formal alternative, less expensive and time consuming,
private, and not subject to the public disclosure. Other than the previously discussed
ADRs, litigation comes as the traditional method employed in courts; it is based on
law; a doctrine that requires a court follow-up (County Court, High Court or
Technology and Construction Court), in which parties are represented by attorneys
(Safinia , 2014).
Litigation in construction is known for its many disadvantages, as it is the most
adversarial of all DRMs, it is a long expensive process, and public. In the public
sector, there are often requirements that contractors must go through a ‘Government
Claims Procedure’ by filing a government claim and going through an administrative
hearing procedure before they can proceed to arbitrate or litigate their claims (Klinger,
2009).
Another dispute resolution method is known as adjudication. Adjudication is a
legal process in which judges investigate the evidences and the proofs, and make a
decision to determine the rights and obligation between the parties involved.
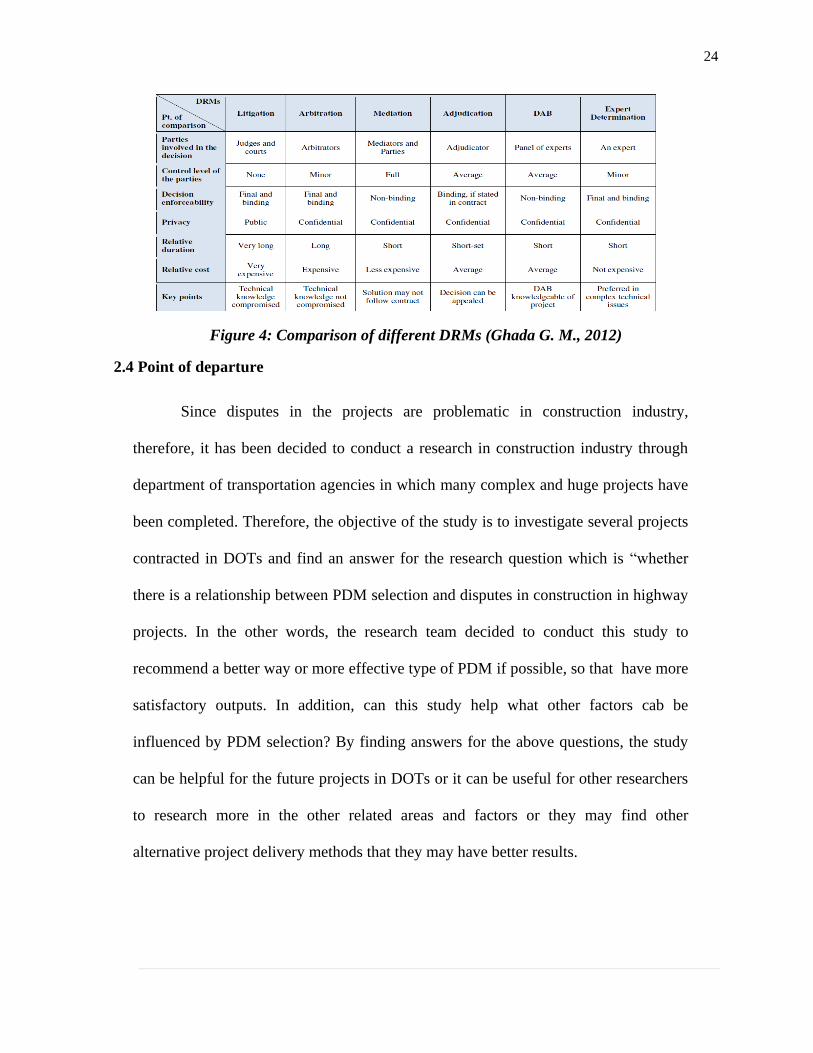
Figure 4 shows a comparison between the Dispute Resolution Methods in
terms of the parties involved, control level of the parties, decision enforceability,
privacy, and cost.
24
Figure 4: Comparison of different DRMs (Ghada G. M., 2012)
2.4 Point of departure
Since disputes in the projects are problematic in construction industry,
therefore, it has been decided to conduct a research in construction industry through
department of transportation agencies in which many complex and huge projects have
been completed. Therefore, the objective of the study is to investigate several projects
contracted in DOTs and find an answer for the research question which is “whether
there is a relationship between PDM selection and disputes in construction in highway
projects. In the other words, the research team decided to conduct this study to
recommend a better way or more effective type of PDM if possible, so that have more
satisfactory outputs. In addition, can this study help what other factors cab be
influenced by PDM selection? By finding answers for the above questions, the study
can be helpful for the future projects in DOTs or it can be useful for other researchers
to research more in the other related areas and factors or they may find other
alternative project delivery methods that they may have better results.

25
CHAPTER III: RESEARCH METHODOLOGY
3.1 Introduction
This chapter provides an overview of the different types of research methods,
and then describes the research methodology adapted to conduct this study. The
chapter also explains each stage of the research design, outlines, distribution, data
collection and analysis mechanism applied in addition to the validation techniques
utilized. This section presents the restatement of the problem, research design, and
general characteristic of the study population. Hence, before discussing the
methodology of the study, the research topic, objectives, and questions are restated. To
this end, this research discusses the impact of PDM selection on disputes occurrence
on highway projects in the United States. In this regard, following question is going to
be answered:
What is the effect of PDM selection on the frequency and severity of dispute
occurrence in highway construction projects?
3.2 Research methods
Common research methodologies used for studies are interviews, observations,
questionnaires, documentary analysis, surveys, and experiments. All these types of the
methodologies are trying to answer the research question, and finally to achieve the
objectives. Each has its specific problems of validity and reliability, and limits to
generalizability. There are three types of research methods used in this study including
quantitative research, qualitative research and mixed method which will be explaining
in the following sections.

26
3.2.1 Quantitative research
Quantitative research is used to quantify the problem by way of generating
numerical data or data that can be transformed into useable statistics. It is used to
quantify attitudes, opinions, behaviors, and other defined variables – and generalize
results from a larger sample population. Quantitative research uses measurable data to
formulate facts and uncover patterns in research (Wyse, 2011).Using this type of
research method is preferred when researching a fact about a concept or a question by
collecting factual evidence and studying the relationships between those facts (Naoum,
2007).
3.2.2 Qualitative research
Qualitative research focuses on attitudes, behaviors, meanings and experiences
through getting an in-depth opinion from the respondents. Since it involves a deeper
look at people’s opinions, it involves less number of people compared to the
quantitative method and is subjective in nature (Dawson, 2002). Additionally, it seeks
to understand a given research problem or topic from the perspectives of the local
population. Qualitative research is especially effective in obtaining culturally specific
information about the values, opinions, behaviors, and social contexts of particular
populations.
Since construction engineering research involves studying aspects that involve
people, it becomes not surprising to inherent social science research methodologies
(Abowitz & Toole, 2010). For example, the team behavior and the spirit of a team-
working environment in construction project are parts of this study that needs to be
addressed through the qualitative method.
27
3.2.3 Mixed method
Mixed methods originally evolve to examine different approaches of collecting
data (Creswell, 2009), and is defined as a research approach or methodology that
(Johnson, Onwuegbuzie, & Turner, 2007):
1- Focuses on research questions that call for real-life contextual
understandings, multi-level perspectives, and cultural influences
2- Employs rigorous quantitative research assessing magnitude and
frequency of constructs and rigorous qualitative research exploring the meaning and
understanding of constructs
3- Utilizes multiple methods (e.g., intervention trials and in-depth interviews)
4- Intentionally integrates or combines these methods to draw on the
strengths of each
5- Frames the investigation within philosophical and theoretical positions
3.3 Survey
In order to get the results of this study, the research team prepared a survey in
following steps. The survey was used, because it was easy to distribute it in terms of
time and cost. Also, collecting the data digitally, made it easier for research team to
analyze the data quicker and more effective. In addition, online survey include
quantitative and qualitative questions to rank and evaluate the important parameters.
3.3.1 Survey target population
The target population were state DOT’s employees involved in the procurement and
project delivery process. Questionnaire requested participants to respond series of
questions of three completed highway projects with preferably different PDMs employed
28
(such as DBB, DB, and CM/GC), and based on the literature review, the survey
encompassed questions on factors reported by previous studies to affect disputes/claims
such as partnering, type of relationship (first or repeat), agreement types, trust, team
behavior and communication. As it has been investigated, the relationship between all
mentioned factors can affect dispute occurrence. Therefore, in this study the research
team as trying to see all sensitive factors and finally achieve any results related to those
critical factors.
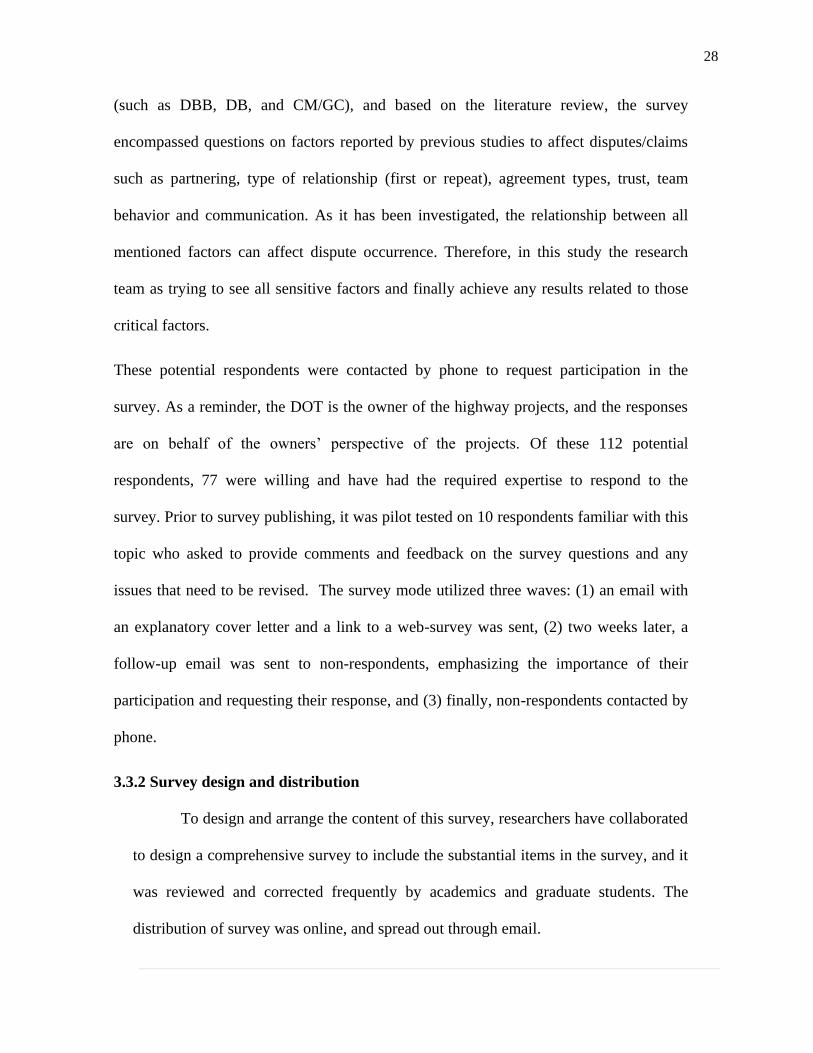
These potential respondents were contacted by phone to request participation in the
survey. As a reminder, the DOT is the owner of the highway projects, and the responses
are on behalf of the owners’ perspective of the projects. Of these 112 potential
respondents, 77 were willing and have had the required expertise to respond to the
survey. Prior to survey publishing, it was pilot tested on 10 respondents familiar with this
topic who asked to provide comments and feedback on the survey questions and any
issues that need to be revised. The survey mode utilized three waves: (1) an email with
an explanatory cover letter and a link to a web-survey was sent, (2) two weeks later, a
follow-up email was sent to non-respondents, emphasizing the importance of their
participation and requesting their response, and (3) finally, non-respondents contacted by
phone.
3.3.2 Survey design and distribution
To design and arrange the content of this survey, researchers have collaborated
to design a comprehensive survey to include the substantial items in the survey, and it
was reviewed and corrected frequently by academics and graduate students. The
distribution of survey was online, and spread out through email.
29
In general, the survey is divided into six main sections. The first section asks
for general information such as the respondents’ demographic information, number of
years’ experience, the state of the residency, and the particular section of DOT. The
second and third sections seek information about the level of complexity, type of
PDM, and involvement level in the recent three projects. The fourth section asks
questions on team procurement and contract’s types. Fifth section focuses on change
orders and disputes frequency and severity. The last section focuses on team behaviour
and communication, and the partnering process characteristics. All of the mentioned
sections can influence on the results of the disputes. This research focuses on the
disputes occurrence and PDM results.
30
CHAPTER IV: FINDINGS
The inherence of this study is to analyze the collected data and explore the answer of the
question of this research which is “the relationship between the PDMs used in highway
projects and its impact on disputes occurrence”. In this chapter, we will be reporting the
data to present some recommendations based on the collected information. The study has
been created to analyze each question inferentially and descriptively, and eventually see
the conclusion based on the results gained from the experts of DOTs.
Statistical methods are conducted to compare, result, describe, discuss and
finally make decision based on some definitions, terms and calculations. It is a way of
analyzing data in a more objective manner. Statistical analysis could be done
descriptively and inferentially. Descriptive analysis is the simple way of analyzing
data based on the basic features. They provide simple summaries about the sample and
the measures. We use inferential statistics to try to infer the sample data in order to
understand what the population might think or, we use inferential statistics to make
judgments of the probability that an observed difference between groups is a
dependable one or one that might have happened by chance in this study. Thus, we use
inferential statistics to make inferences from our data to more general conditions
(William, 2006).
4.1 General data information and demographics
The data gathered came from 50 States in the United State with the collaboration of
Department of Transportation. According to the demographic data, more than 83 % of
participants are experienced more than 10 years. Each respondent was asked to provide up
31
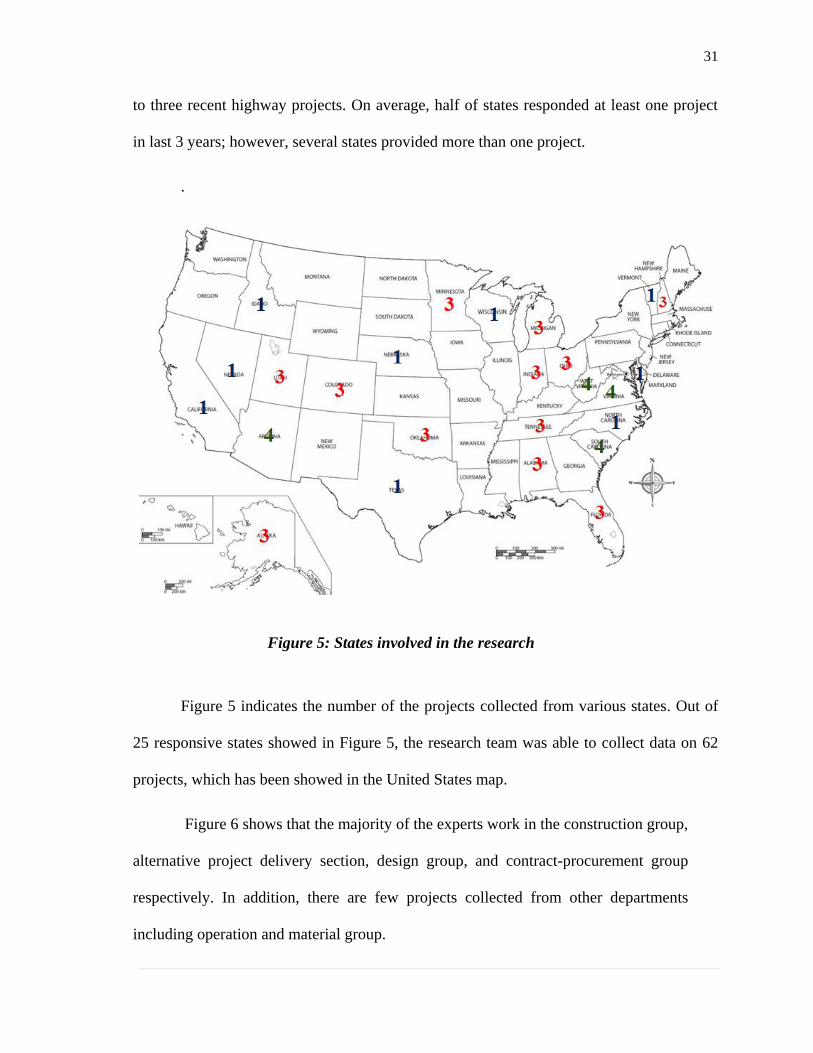
to three recent highway projects. On average, half of states responded at least one project
in last 3 years; however, several states provided more than one project.
.
Figure 5: States involved in the research
Figure 5 indicates the number of the projects collected from various states. Out of
25 responsive states showed in Figure 5, the research team was able to collect data on 62
projects, which has been showed in the United States map.
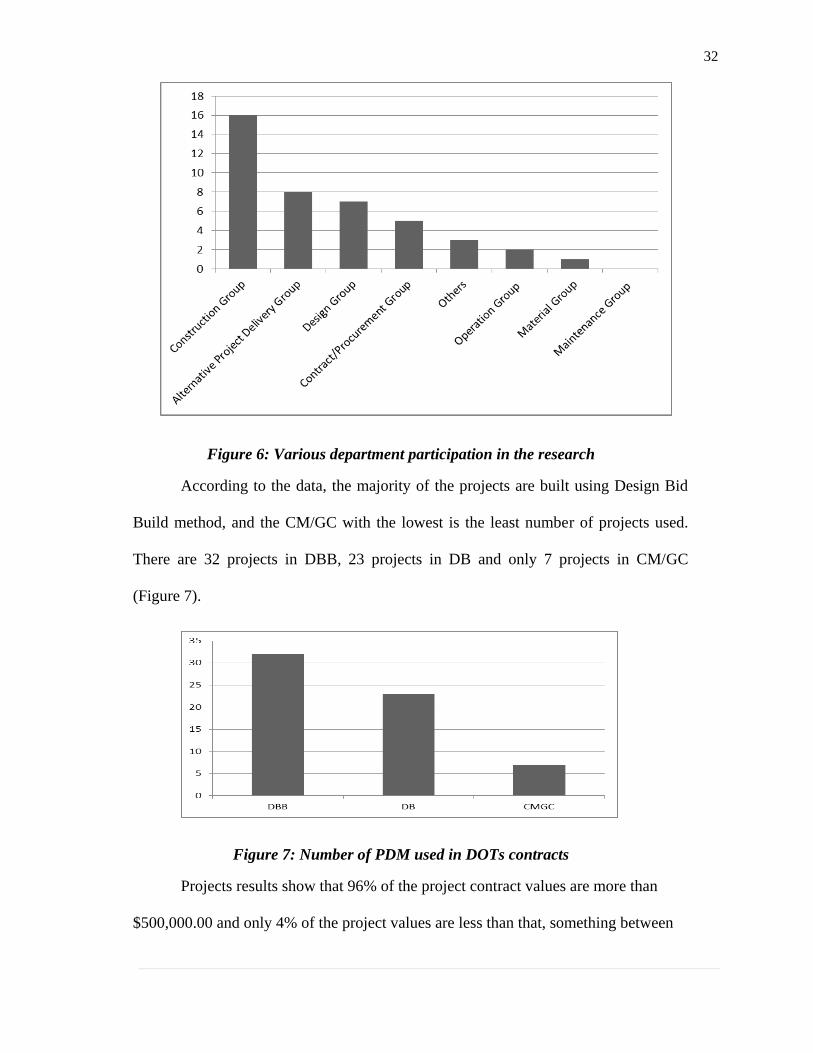
Figure 6 shows that the majority of the experts work in the construction group,
alternative project delivery section, design group, and contract-procurement group
respectively. In addition, there are few projects collected from other departments
including operation and material group.
32
Figure 6: Various department participation in the research
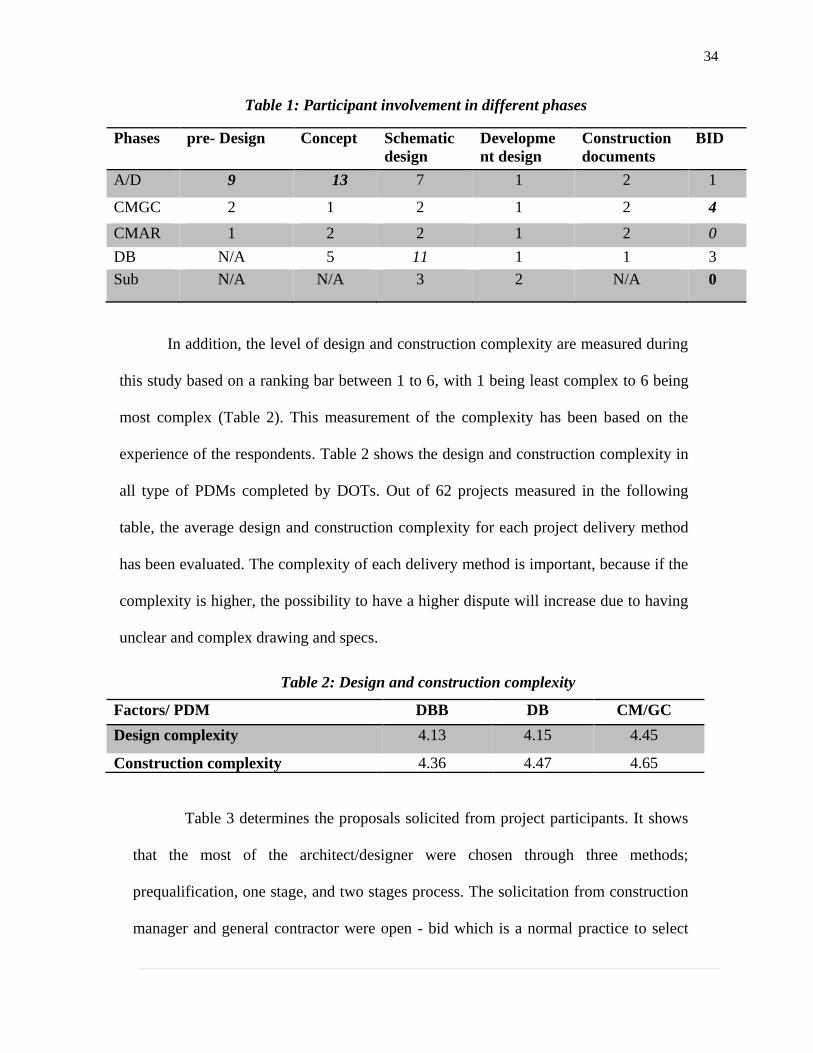
According to the data, the majority of the projects are built using Design Bid
Build method, and the CM/GC with the lowest is the least number of projects used.
There are 32 projects in DBB, 23 projects in DB and only 7 projects in CM/GC
(Figure 7).
Figure 7: Number of PDM used in DOTs contracts
Projects results show that 96% of the project contract values are more than
$500,000.00 and only 4% of the project values are less than that, something between

33
$100,000.00 and $300,000.00. Moreover, it is estimated that around 50% of the
project durations are more than 2 years, 30% are between 1 and 2 years; and 8% are
less than 6 months in highway projects (Figure 8).
Figure 8: Project budgets and durations
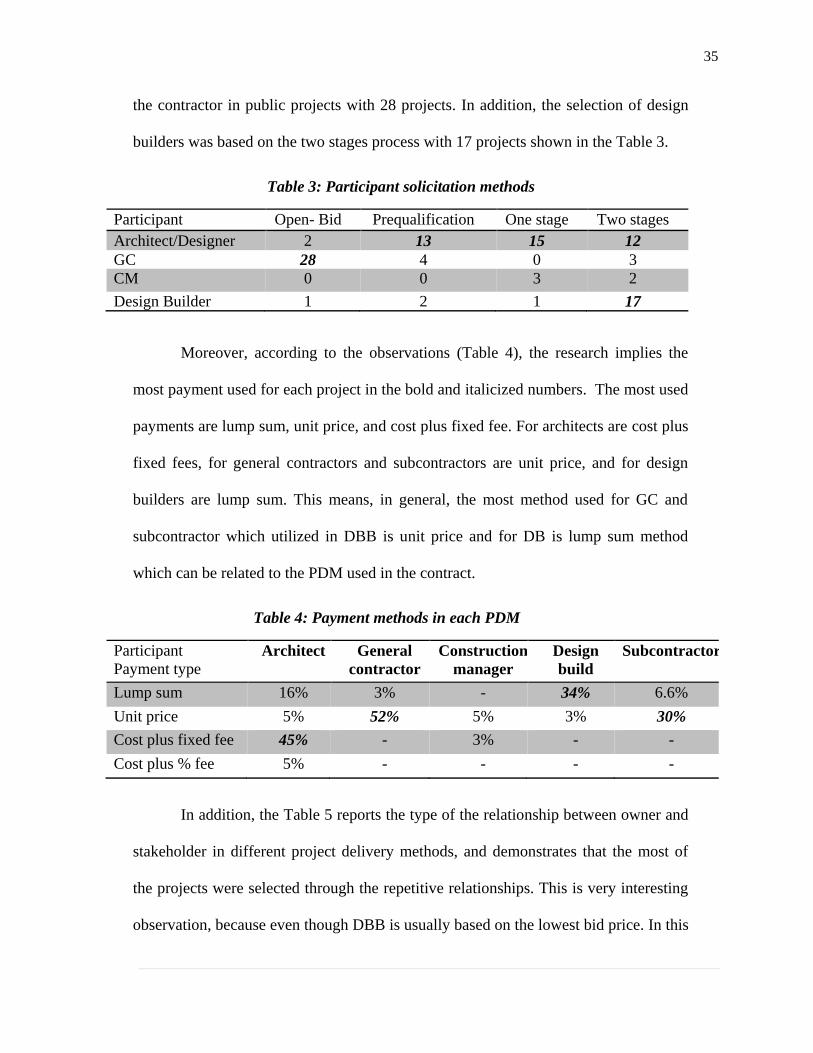
Table 1 shows the number of the projects with the participant involvement,
including Architect/Designer (A/D), Construction Manager/ General Contractor
(CM/GC), Construction Manager At Risk (CMAR), Design Builder (DB) and Sub-
contractor, during the different phases. These phases include Pre-design Phase (PD),
Concept (CO), Schematic Design (SD), Design Development phase (DD),
Construction Document (CD), or during the bidding process (full design). As the
Table 1 shows, architects and designers are involved more in first stages including the
pre-design phase and concept phase which is almost 30 % of the completed project.
Design builders are involved in schematic design while general contractor collaborates
in last phase, which is the bidding process. Subcontractor’s function is also similar to
general contractor role with participating in the very last stage in bidding process.
34
Table 1: Participant involvement in different phases
Phases pre- Design Concept Schematic
design
Developme
nt design
Construction
documents
BID
A/D 9 13 7 1 2 1
CMGC 2 1 2 1 2 4
CMAR 1 2 2 1 2 0
DB N/A 5 11 1 1 3
Sub N/A N/A 3 2 N/A 0
In addition, the level of design and construction complexity are measured during
this study based on a ranking bar between 1 to 6, with 1 being least complex to 6 being
most complex (Table 2). This measurement of the complexity has been based on the
experience of the respondents. Table 2 shows the design and construction complexity in
all type of PDMs completed by DOTs. Out of 62 projects measured in the following
table, the average design and construction complexity for each project delivery method
has been evaluated. The complexity of each delivery method is important, because if the
complexity is higher, the possibility to have a higher dispute will increase due to having
unclear and complex drawing and specs.
Table 2: Design and construction complexity
Factors/ PDM DBB DB CM/GC
Design complexity 4.13 4.15 4.45
Construction complexity 4.36 4.47 4.65
Table 3 determines the proposals solicited from project participants. It shows
that the most of the architect/designer were chosen through three methods;
prequalification, one stage, and two stages process. The solicitation from construction
manager and general contractor were open - bid which is a normal practice to select
35
the contractor in public projects with 28 projects. In addition, the selection of design
builders was based on the two stages process with 17 projects shown in the Table 3.
Table 3: Participant solicitation methods
Participant Open- Bid Prequalification One stage Two stages
Architect/Designer 2 13 15 12
GC 28 4 0 3
CM 0 0 3 2
Design Builder 1 2 1 17
Moreover, according to the observations (Table 4), the research implies the
most payment used for each project in the bold and italicized numbers. The most used
payments are lump sum, unit price, and cost plus fixed fee. For architects are cost plus
fixed fees, for general contractors and subcontractors are unit price, and for design
builders are lump sum. This means, in general, the most method used for GC and
subcontractor which utilized in DBB is unit price and for DB is lump sum method
which can be related to the PDM used in the contract.
Table 4: Payment methods in each PDM
Participant
Payment type
Architect General
contractor
Construction
manager
Design
build
Subcontractor
Lump sum 16% 3% - 34% 6.6%
Unit price 5% 52% 5% 3% 30%
Cost plus fixed fee 45% - 3% - -
Cost plus % fee 5% - - - -
In addition, the Table 5 reports the type of the relationship between owner and
stakeholder in different project delivery methods, and demonstrates that the most of
the projects were selected through the repetitive relationships. This is very interesting
observation, because even though DBB is usually based on the lowest bid price. In this
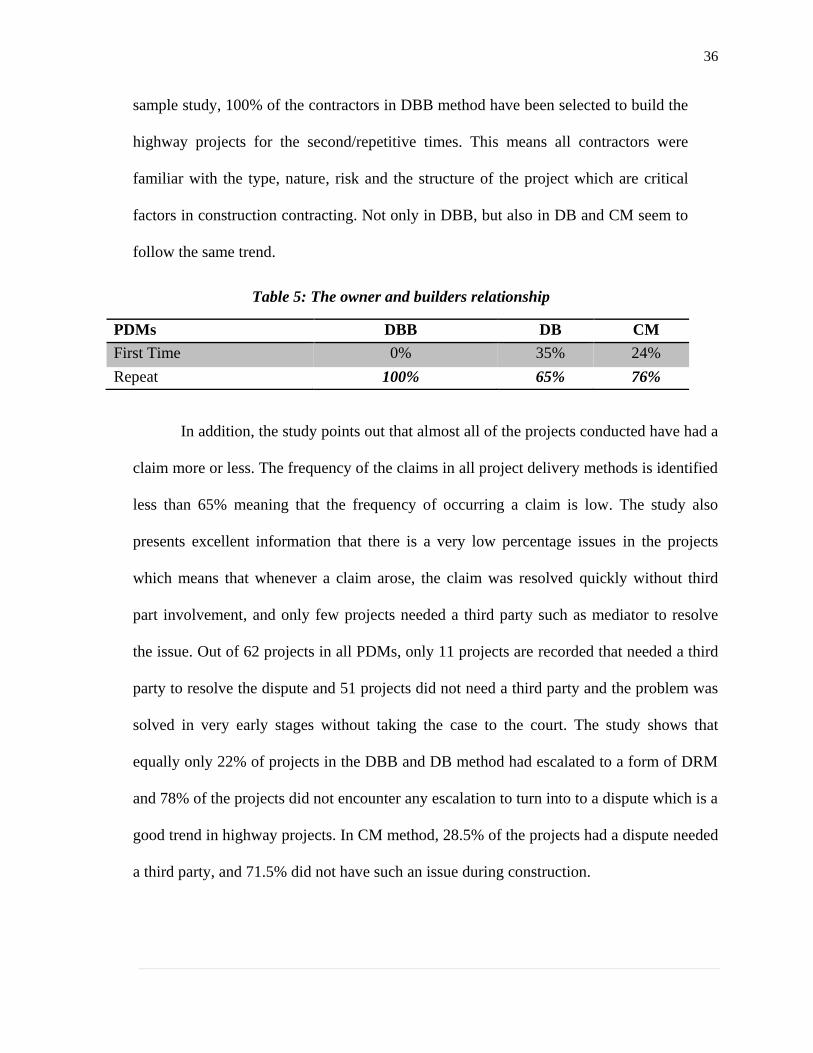
36
sample study, 100% of the contractors in DBB method have been selected to build the
highway projects for the second/repetitive times. This means all contractors were
familiar with the type, nature, risk and the structure of the project which are critical
factors in construction contracting. Not only in DBB, but also in DB and CM seem to
follow the same trend.
Table 5: The owner and builders relationship
PDMs DBB DB CM
First Time 0% 35% 24%
Repeat 100% 65% 76%
In addition, the study points out that almost all of the projects conducted have had a
claim more or less. The frequency of the claims in all project delivery methods is identified
less than 65% meaning that the frequency of occurring a claim is low. The study also
presents excellent information that there is a very low percentage issues in the projects
which means that whenever a claim arose, the claim was resolved quickly without third
part involvement, and only few projects needed a third party such as mediator to resolve
the issue. Out of 62 projects in all PDMs, only 11 projects are recorded that needed a third
party to resolve the dispute and 51 projects did not need a third party and the problem was
solved in very early stages without taking the case to the court. The study shows that
equally only 22% of projects in the DBB and DB method had escalated to a form of DRM
and 78% of the projects did not encounter any escalation to turn into to a dispute which is a
good trend in highway projects. In CM method, 28.5% of the projects had a dispute needed
a third party, and 71.5% did not have such an issue during construction.
37
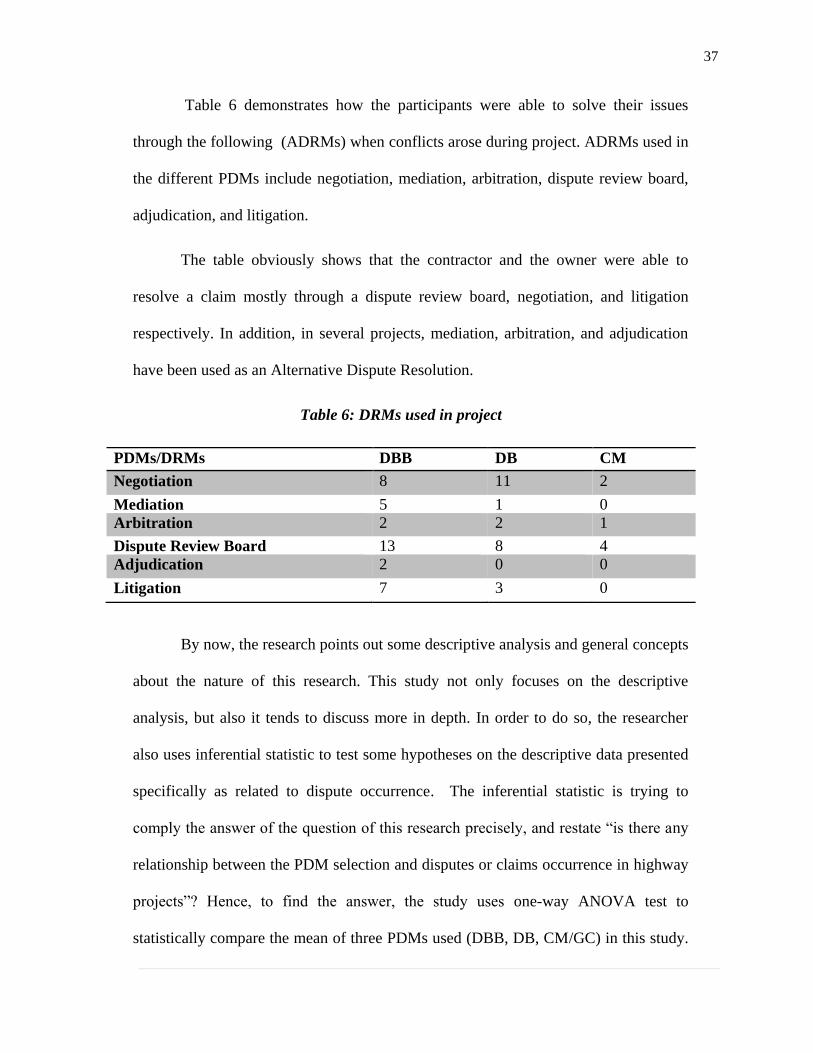
Table 6 demonstrates how the participants were able to solve their issues
through the following (ADRMs) when conflicts arose during project. ADRMs used in
the different PDMs include negotiation, mediation, arbitration, dispute review board,
adjudication, and litigation.
The table obviously shows that the contractor and the owner were able to
resolve a claim mostly through a dispute review board, negotiation, and litigation
respectively. In addition, in several projects, mediation, arbitration, and adjudication
have been used as an Alternative Dispute Resolution.
Table 6: DRMs used in project
By now, the research points out some descriptive analysis and general concepts
about the nature of this research. This study not only focuses on the descriptive
analysis, but also it tends to discuss more in depth. In order to do so, the researcher
also uses inferential statistic to test some hypotheses on the descriptive data presented
specifically as related to dispute occurrence. The inferential statistic is trying to
comply the answer of the question of this research precisely, and restate “is there any
relationship between the PDM selection and disputes or claims occurrence in highway
projects”? Hence, to find the answer, the study uses one-way ANOVA test to
statistically compare the mean of three PDMs used (DBB, DB, CM/GC) in this study.
PDMs/DRMs DBB DB CM
Negotiation 8 11 2
Mediation 5 1 0
Arbitration 2 2 1
Dispute Review Board 13 8 4
Adjudication 2 0 0
Litigation 7 3 0
38
Also, a two- sample t test used for the comparison between DBB and DB as well as a
comparison between DBB and the other two alternative PDMs (DB and CM/GC).
Again, remember that the objective of this study is to discover whether there is
a relationship between PDMs selection and dispute occurrence in highway projects.
To do so, the research points out the most critical factors in each PDM that may affect
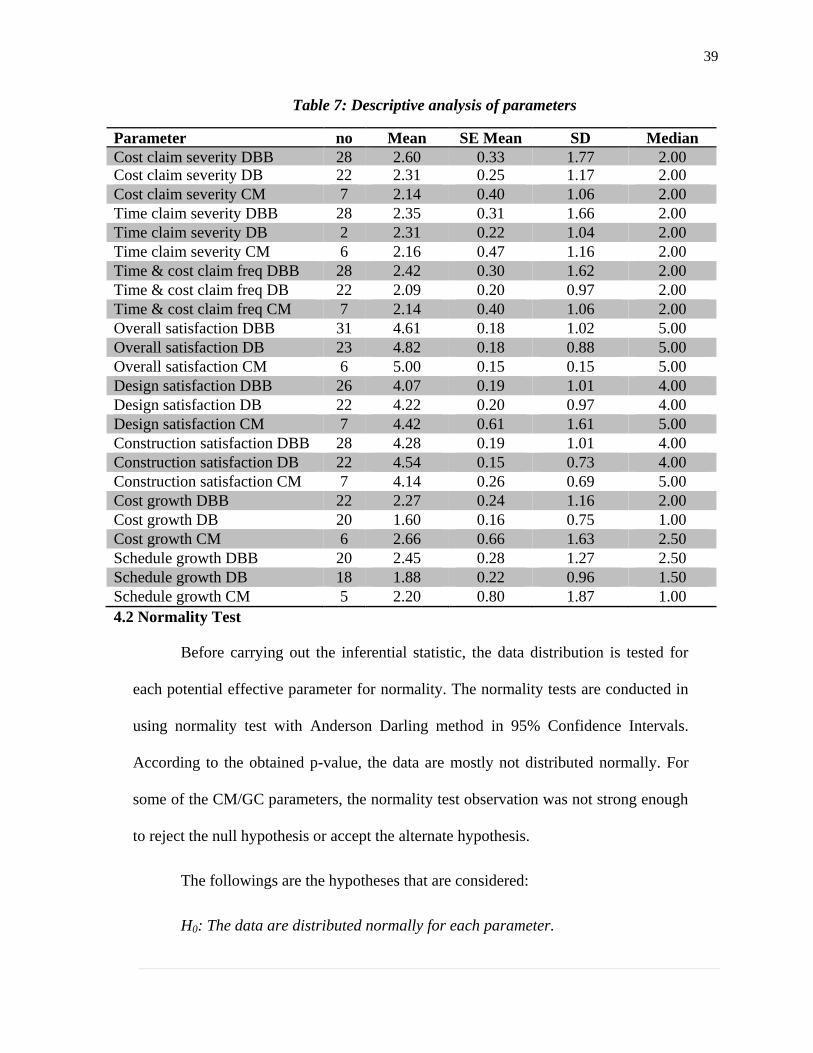
disputes directly or indirectly. Table 7 shows a descriptive analysis of those factors
that are going to be discussed in the rest of the research. As mentioned, since a PDM is
a complex of the cost, design, schedule and design and construction process, we are
trying to have a comprehensive analysis of all influenced items in PDMs. Parameters
such as cost claim severity, time claim severity, time and cost claim frequency, overall
satisfaction, design satisfaction, construction satisfaction, cost growth and schedule
growth. Cost and time claim severity means those claims that were related to the cost
and the time during project. Time and cost claim frequency refers to the frequency of
the time and cost claims relevant to the project. For the time and cost claim frequency
and severity the ranking bars were between 1 to 6; from least to most. If there number
is close to 1, the severity and frequency were at least, and if gets close to the 6, the
severity and frequency were high. Overall satisfaction, design and construction
satisfaction were related to the satisfaction of the projects; and show how satisfied
were the projects with a ranking form 1 to 6. 1 is the less satisfaction and 6 is a very
satisfied result. The cost growth is the actual cost and the percentage change
compared to the original cost with a ranking from 1 to 6. 1 is the less difference and 6
is a bigger gap between the actual cost and the original cost. Table 7 shows the
descriptive analysis of the parameters including mean, median standard deviation.
39
Table 7: Descriptive analysis of parameters
Parameter no Mean SE Mean SD Median
Cost claim severity DBB 28 2.60 0.33 1.77 2.00 Cost claim severity DB 22 2.31 0.25 1.17 2.00
Cost claim severity CM 7 2.14 0.40 1.06 2.00
Time claim severity DBB 28 2.35 0.31 1.66 2.00
Time claim severity DB 2 2.31 0.22 1.04 2.00
Time claim severity CM 6 2.16 0.47 1.16 2.00
Time & cost claim freq DBB 28 2.42 0.30 1.62 2.00
Time & cost claim freq DB 22 2.09 0.20 0.97 2.00
Time & cost claim freq CM 7 2.14 0.40 1.06 2.00
Overall satisfaction DBB 31 4.61 0.18 1.02 5.00
Overall satisfaction DB 23 4.82 0.18 0.88 5.00
Overall satisfaction CM 6 5.00 0.15 0.15 5.00
Design satisfaction DBB 26 4.07 0.19 1.01 4.00
Design satisfaction DB 22 4.22 0.20 0.97 4.00
Design satisfaction CM 7 4.42 0.61 1.61 5.00
Construction satisfaction DBB 28 4.28 0.19 1.01 4.00
Construction satisfaction DB 22 4.54 0.15 0.73 4.00
Construction satisfaction CM 7 4.14 0.26 0.69 5.00
Cost growth DBB 22 2.27 0.24 1.16 2.00
Cost growth DB 20 1.60 0.16 0.75 1.00
Cost growth CM 6 2.66 0.66 1.63 2.50
Schedule growth DBB 20 2.45 0.28 1.27 2.50
Schedule growth DB 18 1.88 0.22 0.96 1.50
Schedule growth CM 5 2.20 0.80 1.87 1.00
4.2 Normality Test
Before carrying out the inferential statistic, the data distribution is tested for
each potential effective parameter for normality. The normality tests are conducted in
using normality test with Anderson Darling method in 95% Confidence Intervals.
According to the obtained p-value, the data are mostly not distributed normally. For
some of the CM/GC parameters, the normality test observation was not strong enough
to reject the null hypothesis or accept the alternate hypothesis.
The followings are the hypotheses that are considered:
H0: The data are distributed normally for each parameter.
40
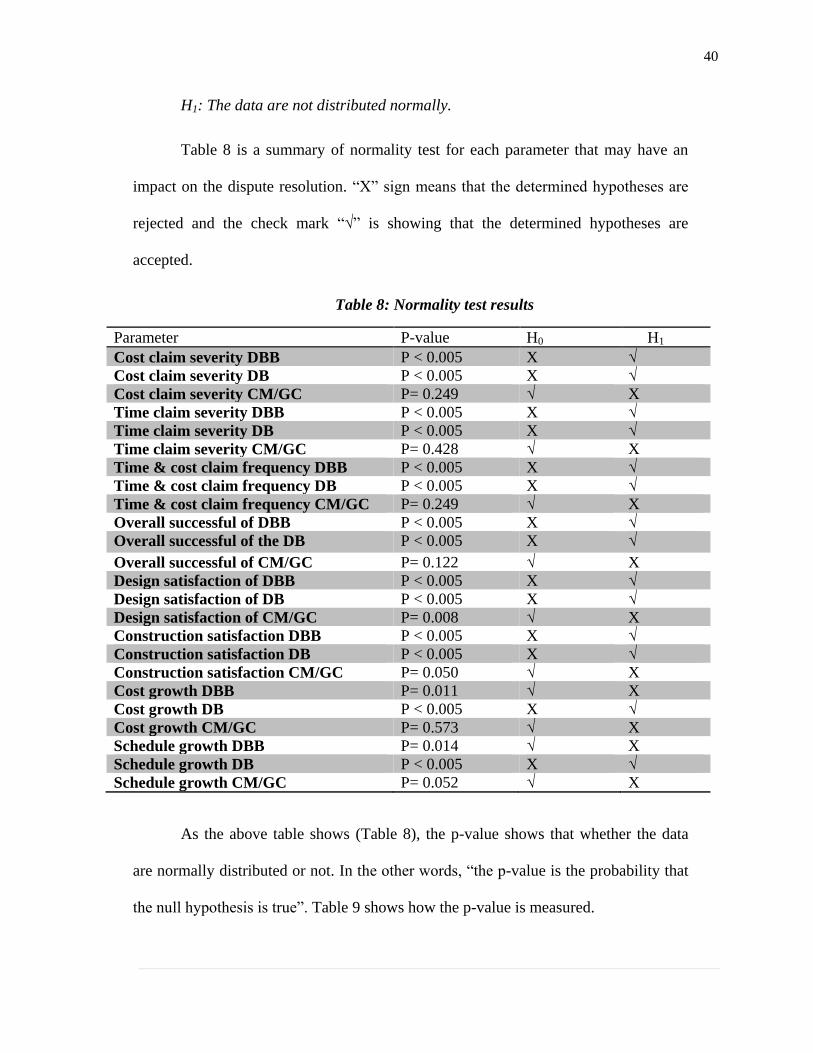
H1: The data are not distributed normally.
Table 8 is a summary of normality test for each parameter that may have an
impact on the dispute resolution. “X” sign means that the determined hypotheses are
rejected and the check mark “√” is showing that the determined hypotheses are
accepted.
Table 8: Normality test results
Parameter P-value H0 H1
Cost claim severity DBB P < 0.005 X √
Cost claim severity DB P < 0.005 X √
Cost claim severity CM/GC P= 0.249 √ X
Time claim severity DBB P < 0.005 X √
Time claim severity DB P < 0.005 X √
Time claim severity CM/GC P= 0.428 √ X
Time & cost claim frequency DBB P < 0.005 X √
Time & cost claim frequency DB P < 0.005 X √
Time & cost claim frequency CM/GC P= 0.249 √ X
Overall successful of DBB P < 0.005 X √
Overall successful of the DB P < 0.005 X √
Overall successful of CM/GC P= 0.122 √ X
Design satisfaction of DBB P < 0.005 X √
Design satisfaction of DB P < 0.005 X √
Design satisfaction of CM/GC P= 0.008 √ X
Construction satisfaction DBB P < 0.005 X √
Construction satisfaction DB P < 0.005 X √
Construction satisfaction CM/GC P= 0.050 √ X
Cost growth DBB P= 0.011 √ X
Cost growth DB P < 0.005 X √
Cost growth CM/GC P= 0.573 √ X
Schedule growth DBB P= 0.014 √ X
Schedule growth DB P < 0.005 X √
Schedule growth CM/GC P= 0.052 √ X
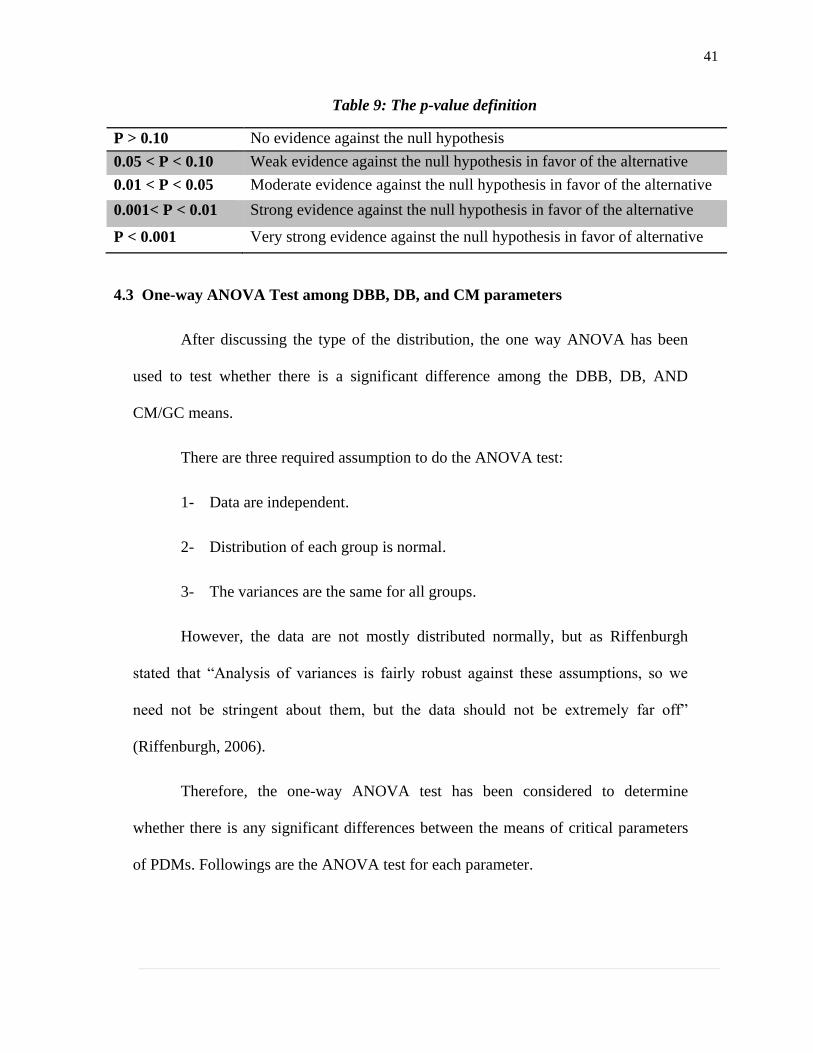
As the above table shows (Table 8), the p-value shows that whether the data
are normally distributed or not. In the other words, “the p-value is the probability that
the null hypothesis is true”. Table 9 shows how the p-value is measured.
41
Table 9: The p-value definition
P > 0.10 No evidence against the null hypothesis
0.05 < P < 0.10 Weak evidence against the null hypothesis in favor of the alternative
0.01 < P < 0.05 Moderate evidence against the null hypothesis in favor of the alternative
0.001< P < 0.01 Strong evidence against the null hypothesis in favor of the alternative
P < 0.001 Very strong evidence against the null hypothesis in favor of alternative
4.3 One-way ANOVA Test among DBB, DB, and CM parameters
After discussing the type of the distribution, the one way ANOVA has been
used to test whether there is a significant difference among the DBB, DB, AND
CM/GC means.
There are three required assumption to do the ANOVA test:
1- Data are independent.
2- Distribution of each group is normal.
3- The variances are the same for all groups.
However, the data are not mostly distributed normally, but as Riffenburgh
stated that “Analysis of variances is fairly robust against these assumptions, so we
need not be stringent about them, but the data should not be extremely far off”
(Riffenburgh, 2006).
Therefore, the one-way ANOVA test has been considered to determine
whether there is any significant differences between the means of critical parameters
of PDMs. Followings are the ANOVA test for each parameter.
42
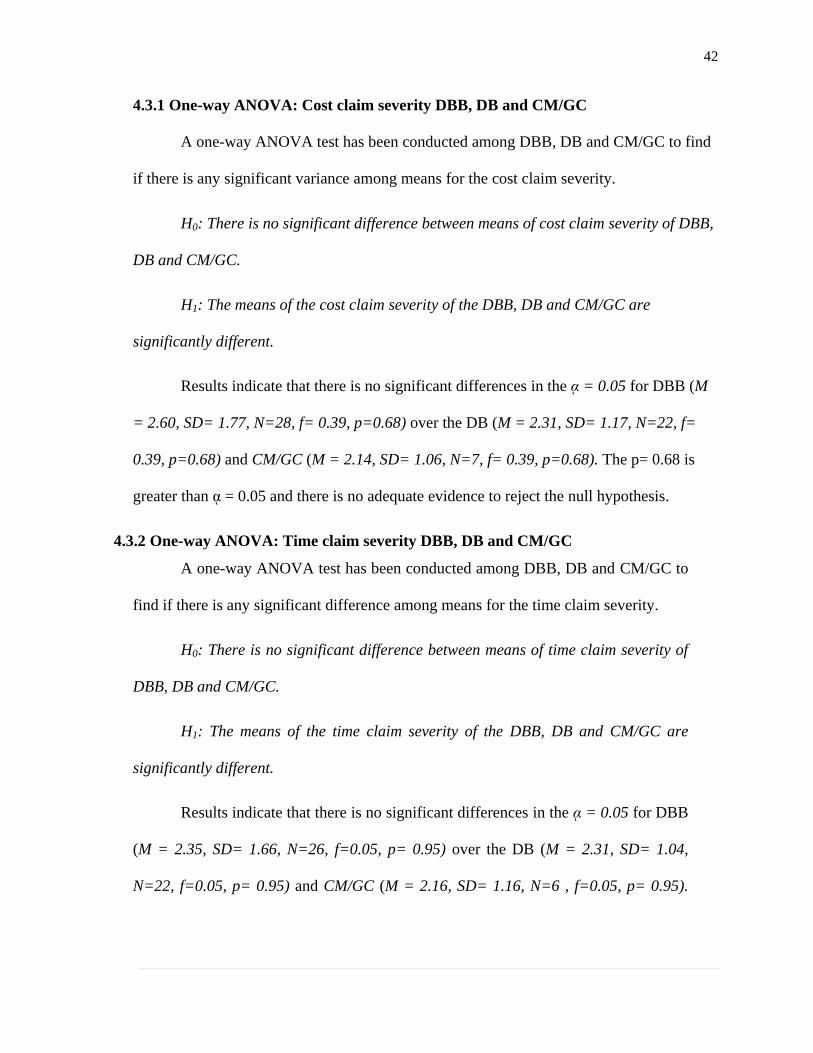
4.3.1 One-way ANOVA: Cost claim severity DBB, DB and CM/GC
A one-way ANOVA test has been conducted among DBB, DB and CM/GC to find
if there is any significant variance among means for the cost claim severity.
H0: There is no significant difference between means of cost claim severity of DBB,
DB and CM/GC.
H1: The means of the cost claim severity of the DBB, DB and CM/GC are
significantly different.
Results indicate that there is no significant differences in the ᾳ = 0.05 for DBB (M
= 2.60, SD= 1.77, N=28, f= 0.39, p=0.68) over the DB (M = 2.31, SD= 1.17, N=22, f=
0.39, p=0.68) and CM/GC (M = 2.14, SD= 1.06, N=7, f= 0.39, p=0.68). The p= 0.68 is
greater than ᾳ = 0.05 and there is no adequate evidence to reject the null hypothesis.
4.3.2 One-way ANOVA: Time claim severity DBB, DB and CM/GC
A one-way ANOVA test has been conducted among DBB, DB and CM/GC to
find if there is any significant difference among means for the time claim severity.
H0: There is no significant difference between means of time claim severity of
DBB, DB and CM/GC.
H1: The means of the time claim severity of the DBB, DB and CM/GC are
significantly different.
Results indicate that there is no significant differences in the ᾳ = 0.05 for DBB
(M = 2.35, SD= 1.66, N=26, f=0.05, p= 0.95) over the DB (M = 2.31, SD= 1.04,
N=22, f=0.05, p= 0.95) and CM/GC (M = 2.16, SD= 1.16, N=6 , f=0.05, p= 0.95).

43
The p= 0.95 is greater than ᾳ = 0.05 and there is no adequate evidence to reject the
null hypothesis.
4.3.3 One-way ANOVA: Time and cost claim frequency DBB, DB and CM/GC
A one-way ANOVA test has been conducted among DBB, DB and CM/GC to
find if there is any significant difference among means for the time and cost claim
frequency.
H0: There is no significant difference between means of time and cost claim
frequency of DBB, DB and CM/GC.
H1: The means of the time and cost claim frequency of the DBB, DB and
CM/GC are significantly different.
Results indicate that there is no significant differences in the ᾳ = 0.05 for DBB
(M = 2.42, SD= 1.62, N=28, f= 0.42, p=0.65) over the DB (M = 2.09, SD= 0.97,
N=22, f= 0.42, p=0.65) and CM/GC (M = 2.14, SD= 1.06, N=7, f= 0.42, p=0.65).
The p=0.65 is greater than ᾳ = 0.05 and there is no adequate evidence to reject the null
hypothesis.
4.3.4 One-way ANOVA: Overall successful of DBB, DB and CM/GC
A one-way ANOVA test has been conducted among DBB, DB and CM/GC to
find if there is any significant difference among means for the overall successful of the
project.
H0: There is no significant difference between means of overall satisfaction of
DBB, DB and CM/GC.
H1: The means of the overall successful of the DBB, DB and CM/GC are
significantly different.

44
Results indicate that there is no significant differences in the ᾳ = 0.05 for DBB
(M = 4.61, SD= 1.02, N=31, f = 0.54, p=0.58) over the DB (M = 4.82, SD= 0.88,
N=23, f = 0.54, p=0.58) and CM/GC (M = 5.00, SD= 1.26, N=6, f = 0.54, p=0.58).
The p= 0.58 is greater than ᾳ = 0.05 and there is no adequate evidence to reject the
null hypothesis.
4.3.5 One-way ANOVA: Design satisfaction of DBB, DB and CM/GC
A one-way ANOVA test has been conducted among DBB, DB and CM/GC to
find if there is any significant difference among means for the design satisfaction.
H0: There is no significant difference between means of design satisfaction of
DBB, DB and CM/GC.
H1: The means of the design satisfaction of the DBB, DB and CM/GC are
significantly different.
Results indicate that there is no significant differences in the ᾳ = 0.05 for DBB
(M = 4.07, SD= 1.01, N=26, f = 0.32, p=0.72) over the DB (M = 4.22, SD= 0.97,
N=22, f = 0.32, p=0.72) and CM/GC (M = 4.42, SD= 1.61, N=7, f = 0.32, p=0.72).
The p=0.72is greater than ᾳ = 0.05 and there is no adequate evidence to reject the null
hypothesis.
4.3.6 One-way ANOVA: Constriction satisfaction of DBB, DB and CM
A one-way ANOVA test has been conducted among DBB, DB and CM/GC to
find if there is any significant difference among means for the construction
satisfaction.
H0: There is no significant difference between means of construction
satisfaction of DBB, DB and CM/GC.
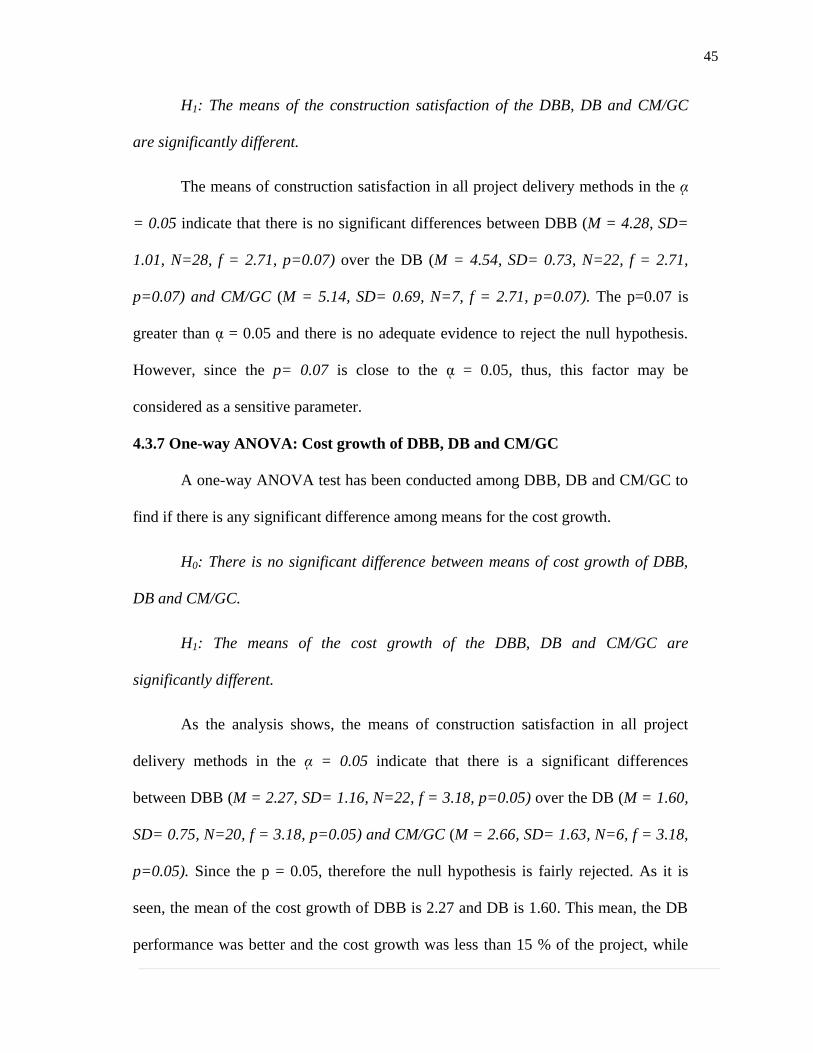
45
H1: The means of the construction satisfaction of the DBB, DB and CM/GC
are significantly different.
The means of construction satisfaction in all project delivery methods in the ᾳ
= 0.05 indicate that there is no significant differences between DBB (M = 4.28, SD=
1.01, N=28, f = 2.71, p=0.07) over the DB (M = 4.54, SD= 0.73, N=22, f = 2.71,
p=0.07) and CM/GC (M = 5.14, SD= 0.69, N=7, f = 2.71, p=0.07). The p=0.07 is
greater than ᾳ = 0.05 and there is no adequate evidence to reject the null hypothesis.
However, since the p= 0.07 is close to the ᾳ = 0.05, thus, this factor may be
considered as a sensitive parameter.
4.3.7 One-way ANOVA: Cost growth of DBB, DB and CM/GC
A one-way ANOVA test has been conducted among DBB, DB and CM/GC to
find if there is any significant difference among means for the cost growth.
H0: There is no significant difference between means of cost growth of DBB,
DB and CM/GC.
H1: The means of the cost growth of the DBB, DB and CM/GC are
significantly different.
As the analysis shows, the means of construction satisfaction in all project
delivery methods in the ᾳ = 0.05 indicate that there is a significant differences
between DBB (M = 2.27, SD= 1.16, N=22, f = 3.18, p=0.05) over the DB (M = 1.60,
SD= 0.75, N=20, f = 3.18, p=0.05) and CM/GC (M = 2.66, SD= 1.63, N=6, f = 3.18,
p=0.05). Since the p = 0.05, therefore the null hypothesis is fairly rejected. As it is
seen, the mean of the cost growth of DBB is 2.27 and DB is 1.60. This mean, the DB
performance was better and the cost growth was less than 15 % of the project, while
46
the DBB cost growth was more and approximately close to 25% which is a huge dollar
value for highway projects.
4.3.8 One-way ANOVA: Schedule growth of DBB, DB and CM/GC
A one-way ANOVA test has been conducted among DBB, DB and CM/GC to
find if there is any significant difference among means for the schedule growth.
H0: There is no significant difference between means of schedule growth of
DBB, DB and CM/GC.
H1: The means of the schedule growth of the DBB, DB and CM/GC are
significantly different.
Results indicate that there is no significant differences in the ᾳ = 0.05 for DBB
(M = 2.45, SD= 1.26, N=20, f = 1.00, p=0.37) over the DB (M = 1.88, SD= 0.97,
N=18, f = 1.00, p=0.37) and CM/GC (M = 2.20, SD= 1.78, N=5, f = 1.00, p=0.37).
As the p = 0.37, and it is greater than 0.05, therefore there is no significant different
between the means of all PDMs.
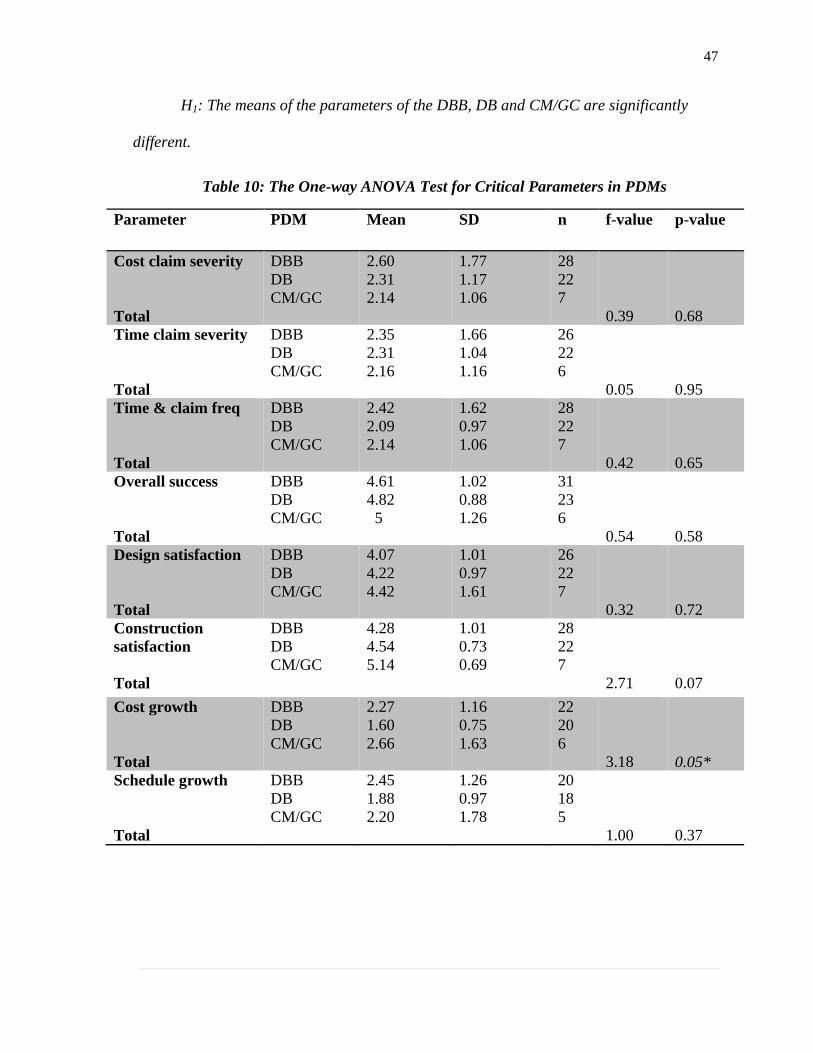
Table 10 shows the one-way ANOVA test summary report for all parameters
stated above. This table expresses a summary of the results and shows that only cost
growth with the p= 0.05 is the most significant parameter among the other parameters.
As it was stated before, the cost growth in DBB is higher than the DB method.
Therefore, it seems that the performance of the DB has been better in comparison to
the DBB method. Again, the null hypothesis and alternative hypothesis for all the
parameters are stated as follows:
H0: There is no significant difference between means of parameters of DBB,
DB and CM/GC.
47
H1: The means of the parameters of the DBB, DB and CM/GC are significantly
different.
Table 10: The One-way ANOVA Test for Critical Parameters in PDMs
Parameter PDM Mean SD n f-value p-value
Cost claim severity
Total
DBB
DB
CM/GC
2.60
2.31
2.14
1.77
1.17
1.06
28
22
7
0.39
0.68
Time claim severity
Total
DBB
DB
CM/GC
2.35
2.31
2.16
1.66
1.04
1.16
26
22
6
0.05
0.95
Time & claim freq
Total
DBB
DB
CM/GC
2.42
2.09
2.14
1.62
0.97
1.06
28
22
7
0.42
0.65
Overall success
Total
DBB
DB
CM/GC
4.61
4.82
5
1.02
0.88
1.26
31
23
6
0.54
0.58
Design satisfaction
Total
DBB
DB
CM/GC
4.07
4.22
4.42
1.01
0.97
1.61
26
22
7
0.32
0.72
Construction
satisfaction
Total
DBB
DB
CM/GC
4.28
4.54
5.14
1.01
0.73
0.69
28
22
7
2.71
0.07
Cost growth
Total
DBB
DB
CM/GC
2.27
1.60
2.66
1.16
0.75
1.63
22
20
6
3.18
0.05*
Schedule growth
Total
DBB
DB
CM/GC
2.45
1.88
2.20
1.26
0.97
1.78
20
18
5
1.00
0.37
48
4.4 Two sample T-test, the difference between means of DBB and DB parameters
In addition to the ANOVA test conducted for all project delivery methods, the
t-test is used to find the differences between two major groups of the contract types.
Since, the majority of the project contracts were either DBB or DB delivery methods,
therefore, the research team chose to compare whether there is a significant difference
between the mean of DBB and DB delivery methods or not. T is simply calculated
difference represented in units of standard error. The t test also developed under the
following assumption (Riffenburgh, 2006):
1- The sample observations are independent.
2- They are normally distributed.
3- They have equal standard deviation.
The Riffenburg stated, “these assumptions usually are not satisfied exactly,
however the robustness of the test allows it to be valid if the assumption are roughly
approximated.” Since the data are not too far off, therefore, with the assumption of the
normal distribution, the t test has been conducted to obtain a fair result. The greater the
magnitude of T (it can be either positive or negative), the greater the
evidence against the null hypothesis that there is no significant difference. In addition,
if the p value is less than 0.05, then the mean difference will be significantly different.
4.4.1 Two sample T-test: Cost claim severity DBB and DB
A two sample t- test has been conducted between DBB and DB to find if there
is any significant difference between means of cost claim severity of DBB and DB.
H0: There is no significant difference between means of cost claim severity DBB and
DB.
49
H1: The means of the cost claim severity of the DBB and DB are significantly
different.
Results indicate that there is no significant differences in the ᾳ = 0.05 for DBB
(M = 2.61, SD= 1.77, N=28, t = 0.69, p=0.49) over the DB (M = 2.32, SD= 1.77,
N=22, t= 0.69, p=0.49). Since the p=0.49 is greater than ᾳ = 0.05, it can be concluded
that there is no difference between the means.
4.4.2 Two sample T-test: Time claim severity DBB and DB
A two sample t- test has been conducted between DBB and DB to find if there
is any significant difference between means of time claim severity of DBB and DB.
H0: There is no significant difference between means of time claim severity
DBB and DB.
H1: The means of the time claim severity of the DBB and DB are significantly
different.
Results indicate that there is no significant differences in the ᾳ = 0.05 for DBB
(M = 2.36, SD= 1.66, N=28, t = 0.10, p=0.92) over the DB (M = 2.32, SD= 1.04,
N=22, t= 0.1, p=0.92). Since the p=0.92 is greater than ᾳ = 0.05, it can be concluded
that there is no difference between the means.
4.4.3. Two sample T-test: Time & cost claim frequency DBB and DB
A two sample t- test has been conducted between DBB and DB to find if there
is any significant difference between means of time and cost claim frequency of DBB
and DB.
50
H0: There is no significant difference between means of time and claim
frequency DBB and DB.
H1: The means of the time and cost claim frequency of the DBB and DB are
significantly different.
Results indicate that there is no significant differences in the ᾳ = 0.05 for DBB
(M = 2.43, SD= 1.62, N=28, t = 0.91, p=0.36) over the DB (M = 2.09, SD= 0.97,
N=22, t= 0.91, p=0.36). Since the p=0.36 is greater than ᾳ = 0.05, it can be concluded
that there is no difference between the means.
4.4.4 Two sample T-test: Overall success of the DBB and DB
A two sample t- test has been conducted between DBB and DB to find if there
is any significant difference between means of overall success of DBB and DB.
H0: There is no significant difference between means of overall success of DBB
and DB.
H1: The means of the overall success of the DBB and DB are significantly
different.
Results indicate that there is no significant differences in the ᾳ = 0.05 for DBB
(M = 4.61, SD= 1.02, N=31, t = -0.82, p=0.41) over the DB (M = 4.82, SD= 0.88,
N=23, t = -0.82, p=0.41). Since the p=0.41 is greater than ᾳ = 0.05, it can be
concluded that there is no difference between the means.
4.4.5 Two sample T-test: Design satisfaction DBB and DB*
A two sample t- test has been conducted between DBB and DB to find if there
is any significant difference between means of design satisfaction of DBB and DB.
51
H0: There is no significant difference between means of design satisfaction of
DBB and DB.
H1: The means of the design satisfaction of the DBB and DB are significantly
different.
Results indicate that there is no significant differences in the ᾳ = 0.05 for DBB
(M = 4.08, SD= 1.02, N=26, t = -6.91, p=0.73) over the DB (M = 4.22, SD= 0.97,
N=22, t = -6.91, p=0.73). Since the p=0.73 is greater than ᾳ = 0.05, therefore it can
be concluded that there is no a significant difference between the means.
4.4.6 Two sample T-test: Construction satisfaction DBB and DB
A two sample t- test has been conducted between DBB and DB to find if there
is any significant difference between means of construction satisfaction of DBB and
DB.
H0: There is no significant difference between means of construction
satisfaction of DBB and DB.
H1: The means of the construction satisfaction of the DBB and DB are
significantly different.
Results indicate that there is no significant differences in the ᾳ = 0.05 for DBB
(M = 4.29, SD= 1.01, N=28, t = -1.05, p=0.30) over the DB (M = 4.54, SD= 0.73,
N=22, t = -1.05, p=0.30). Since the p=0.30 is greater than ᾳ = 0.05, it can be
concluded that there is no significant difference between the means.

52
4.4.7 Two sample T-test: Cost growth DBB and DB*
A two sample t- test has been conducted between DBB and DB to find if there
is any significant difference between means of cost growth of DBB and DB.
H0: There is no significant difference between means of cost growth of DBB
and DB.
H1: The means of the cost growth of the DBB and DB are significantly
different.
Results indicate that there is a significant differences in the ᾳ = 0.05 for DBB
(M = 2.27, SD= 1.16, N=22, t = 2.24, p=0.03) over the DB (M = 1.60, SD= 0.75,
N=22, t = 2.24, p=0.03). Since the p=0.03 is smaller than ᾳ = 0.05, therefore, it can
be concluded that there is a significant difference between the means. Hence, the null
hypothesis is rejected in favor of alternative hypothesis.
4.4.8 Two sample T-test: Schedule growth DBB and DB
A two sample t- test has been conducted between DBB and DB to find if there
is any significant difference between means of schedule growth of DBB and DB.
H0: There is no significant difference between means of schedule growth of
DBB and DB.
H1: The means of the schedule growth of the DBB and DB are significantly
different.
Results indicate that there is no significant differences in the ᾳ = 0.05 for DBB
(M = 2.45, SD= 1.28, N=20, t = 1.54, p=0.13) over the DB (M = 1.88, SD= 0.96,

53
N=18, t = 1.54, p=0.13). Since the p=0.13 is greater than ᾳ = 0.05, it can be
concluded that there is no difference between the means.
Table 11 is a summary report of the test between DBB and DB parameters.
Again, the null hypothesis and alternative hypothesis for all the parameters are
stated as follows:
H0: There is no significant difference between means of parameters of DBB,
DB and CM/GC.
H1: The means of the parameters of the DBB, DB and CM/GC are significantly
different.
Table 11: The t-test for critical parameters compared DBB and DB means,
p-value <0.05 is considered as a significant difference
Parameters PDMs Mean SD n df t-value p-value
Cost Claim Severity
Total
DBB
DB
2.61
2.32
1.77
1.77
28
22
46
0.69
0.49
Time Claim Severity
Total
DBB
DB
2.36
2.32
1.66
1.04
28
22
45
0.1
0.92
Time & Cost Claim Freq
Total
DBB
DB
2.43
2.09
1.62
0.97
28
22
45
0.91
0.36
Overall success
Total
DBB
DB
4.61
4.82
1.02
0.88
31
23
50
-0.82
0.41
Design satisfaction
Total
DBB
DB
4.08
2.09
1.02
0.97
26
22
-6.91
0.00*
Construction satisfaction
Total
DBB
DB
4.29
4.54
1.01
0.73
28
22
47
-1.05
0.30
Cost growth
Total
DBB
DB
2.27
1.60
1.16
0.75
22
22
36
2.24
0.03*
Schedule growth
DBB
DB
2.45
1.88
1.28
0.96
20
18

54
Total 34 1.54 0.13
4.5 T test, the difference between means of DBB and APDMs parameters
Another test has been done through the t-test between the traditional delivery
method DBB and other alternative project delivery methods (APDM) including DB
and CM/GC. This test has been conducted to find if there is any significant difference
between means.
4.5.1 Two-sample T-test: Cost claim severity DBB and APDMs
A two sample t- test has been conducted between DBB and APDMs to find if
there is any significant difference between means of cost claim severity of DBB and
APDMs.
H0: There is no significant difference between means of cost claim severity
DBB and APDMs.
H1: The means of the cost claim severity of the DBB and APDMsare
significantly different.
Results indicate that there is no significant differences in the ᾳ = 0.05 for DBB
(M = 2.61, SD= 1.77, N=28, t = 0.84, p=0.40) over the APDMs (M = 2.28, SD=
1.13, N=29, t= 0.84, p=0.40). Since the p=0.40 is greater than ᾳ = 0.05, it can be
concluded that there is no difference between the means.
4.5.2 Two-sample T-test: Time claim severity DBB and APDMs
A two sample t- test has been conducted between DBB and APDMs to find if
there is any significant difference between means of time claim severity of DBB and
APDMs.
55
H0: There is no significant difference between means of time claim severity
DBB and APDMs.
H1: The means of the time claim severity of the DBB and APDMsare
significantly different.
Results indicate that there is no significant differences in the ᾳ = 0.05 for DBB
(M = 2.36, SD= 1.66, N=28, t = 0.19, p=0.84) over the APDMs (M = 2.29, SD= 1.05,
N=28, t= 0.19, p=0.84). Since the p=0.84 is greater than ᾳ = 0.05, it can be concluded
that there is no difference between the means.
4.5.3. Two-sample T-test: Time & cost claim frequency DBB and APDMs
A two sample t- test has been conducted between DBB and APDMs to find if
there is any significant difference between means of time and cost claim severity of
DBB and APDMs.
H0: There is no significant difference between means of time and claim frequency DBB
and APDMs.
H1: The means of the time and cost claim frequency of the DBB and APDMsare
significantly different.
Results indicate that there is no significant differences in the ᾳ = 0.05 for DBB
(M = 2.43, SD= 1.62, N=28, t = 0.91, p=0.36) over the APDMs (M = 2.10, SD=
0.97, N=29, t= 0.91, p=0.36). Since the p=0.36 is greater than ᾳ = 0.05, it can be
concluded that there is no difference between the means.

56
4.5.4 Two-sample T-test: Overall success DBB and APDMs
A two sample t- test has been conducted between DBB and APDMs to find if
there is any significant difference between means of overall success of DBB and
APDMs.
H0: There is no significant difference between means of overall success of DBB
and APDMs.
H1: The means of the overall success of the DBB and APDMs are significantly
different.
Results indicate that there is no significant differences in the ᾳ = 0.05 for DBB
(M = 4.61, SD= 1.02, N=31, t = -0.98, p=0.33) over the APDMs (M = 4.86, SD=
0.95, N=29, t = -0.98, p=0.33). Since the p=0.33 is greater than ᾳ = 0.05, it can be
concluded that there is no difference between the means.
4.5.5 Two-sample T-test: Design satisfaction DBB and APDMs
A two sample t- test has been conducted between DBB and APDMs to find if
there is any significant difference between means of design satisfaction of DBB and
APDMs.
H0: There is no significant difference between means of design satisfaction of
DBB and APDMs
H1: The means of the design satisfaction of the DBB and APDMs are
significantly different.
Results indicate that there is no significant differences in the ᾳ = 0.05 for DBB
(M = 4.08, SD= 1.02, N=26, t = -0.69, p=0.49) over the APDMs (M = 4.28, SD=
1.13, N=29, t = -0.69, p=0.49). Since the p=0.49 and it is greater than ᾳ = 0.05,

57
therefore, it can be concluded that there is no significant difference between the
means.
4.5.6 Two-sample T-test: Construction satisfaction DBB and APDMs
A two sample t- test has been conducted between DBB and APDMs to find if
there is any significant difference between means of construction satisfaction of DBB
and APDMs.
H0: There is no significant difference between means of construction satisfaction
of DBB and APDMs.
H1: The means of the construction satisfaction of the DBB and APDMs are
significantly different.
Results indicate that there is no significant differences in the ᾳ = 0.05 for DBB
(M = 4.29, SD= 1.01, N=28, t = -1.70, p=0.09) over the APDMs (M = 4.69, SD=
0.76, N=29, t = -1.70, p=0.09). Since the p=0.09 is greater than ᾳ = 0.05 it can be
concluded that there is no significant difference between the means.
4.5.7 Two-sample T-test: Cost Growth DBB and APDMs
A two sample t- test has been conducted between DBB and APDMs to find if
there is any significant difference between means of cost growth of DBB and APDMs.
H0: There is no significant difference between means of cost growth of DBB
and APDMs.
H1: The means of the cost growth of the DBB and APDMs are significantly
different.
Results indicate that there is no significant differences in the ᾳ = 0.05 for DBB
(M = 2.27, SD= 1.16, N=22, t = 1.31, p=0.19) over the APDMs (M = 1.85, SD=

58
1.08, N=26, t = 1.31, p=0.19). Since the p=0.19 is greater than ᾳ = 0.05, therefore, it
can be concluded that there is no significant difference between the means.
4.5.8 Two-sample T-test: Schedule growth DBB and APDMs
A two sample t- test has been conducted between DBB and APDMs to find if
there is any significant difference between means of schedule growth of DBB and
APDMs.
H0: There is no significant difference between means of schedule growth of
DBB and APDMs
H1: The means of the schedule growth of the DBB and APDMs are
significantly different.
Results indicate that there is no significant differences in the ᾳ = 0.05 for DBB
(M = 2.45, SD= 1.28, N=20, t = 1.33, p=0.19) over the APDMs (M = 1.96, SD=
1.15, N=23, t = 1.33, p=0.19). Since the p=0.19 is greater than ᾳ = 0.05, it can be
concluded that there is no difference between the means
Table 12 is a summary report of the test between DBB and APDMs
parameters. Again, the null hypothesis and alternative hypothesis for all the
parameters are stated as follows:
H0: There is no significant difference between means of parameters of DBB,
APDMs
H1: The means of the parameters of the DBB and APDMs are significantly
different.
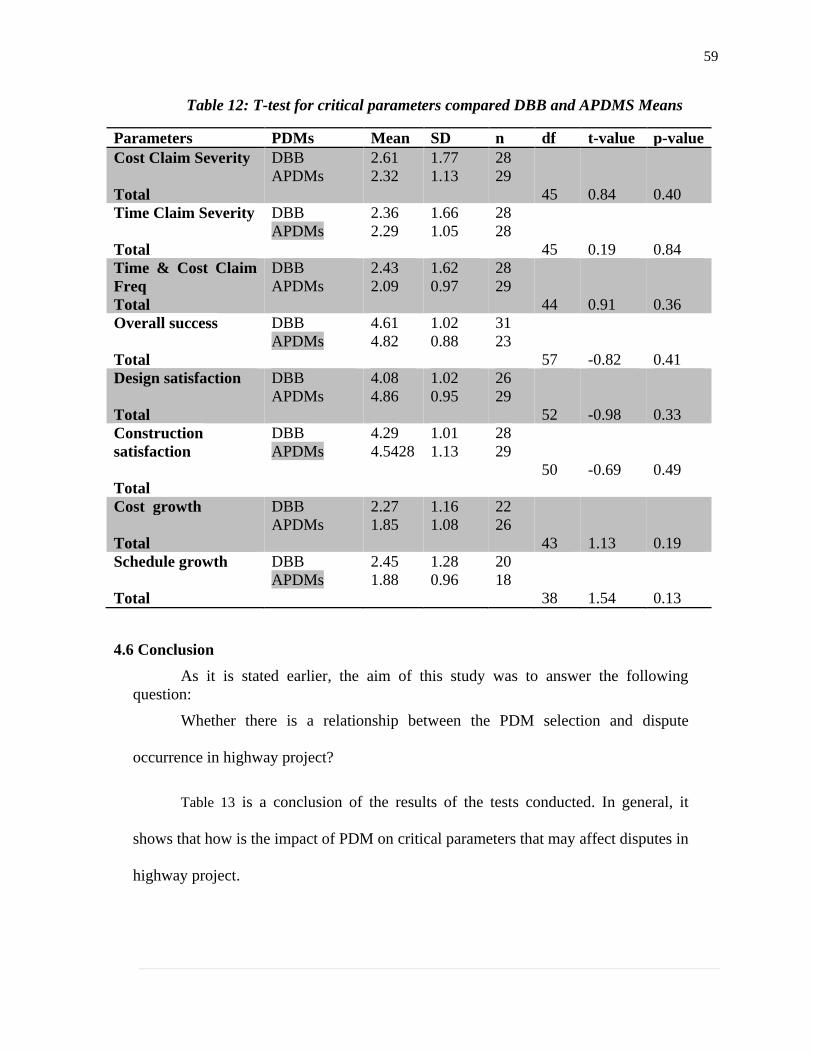
59
Table 12: T-test for critical parameters compared DBB and APDMS Means
Parameters PDMs Mean SD n df t-value p-value
Cost Claim Severity
Total
DBB
APDMs
2.61
2.32
1.77
1.13
28
29
45
0.84
0.40
Time Claim Severity
Total
DBB
APDMs
2.36
2.29
1.66
1.05
28
28
45
0.19
0.84
Time & Cost Claim
Freq
Total
DBB
APDMs
2.43
2.09
1.62
0.97
28
29
44
0.91
0.36
Overall success
Total
DBB
APDMs
4.61
4.82
1.02
0.88
31
23
57
-0.82
0.41
Design satisfaction
Total
DBB
APDMs
4.08
4.86
1.02
0.95
26
29
52
-0.98
0.33
Construction
satisfaction
Total
DBB
APDMs
4.29
4.5428
1.01
1.13
28
29
50
-0.69
0.49
Cost growth
Total
DBB
APDMs
2.27
1.85
1.16
1.08
22
26
43
1.13
0.19
Schedule growth
Total
DBB
APDMs
2.45
1.88
1.28
0.96
20
18
38
1.54
0.13
4.6 Conclusion
As it is stated earlier, the aim of this study was to answer the following
question:
Whether there is a relationship between the PDM selection and dispute
occurrence in highway project?
Table 13 is a conclusion of the results of the tests conducted. In general, it
shows that how is the impact of PDM on critical parameters that may affect disputes in
highway project.
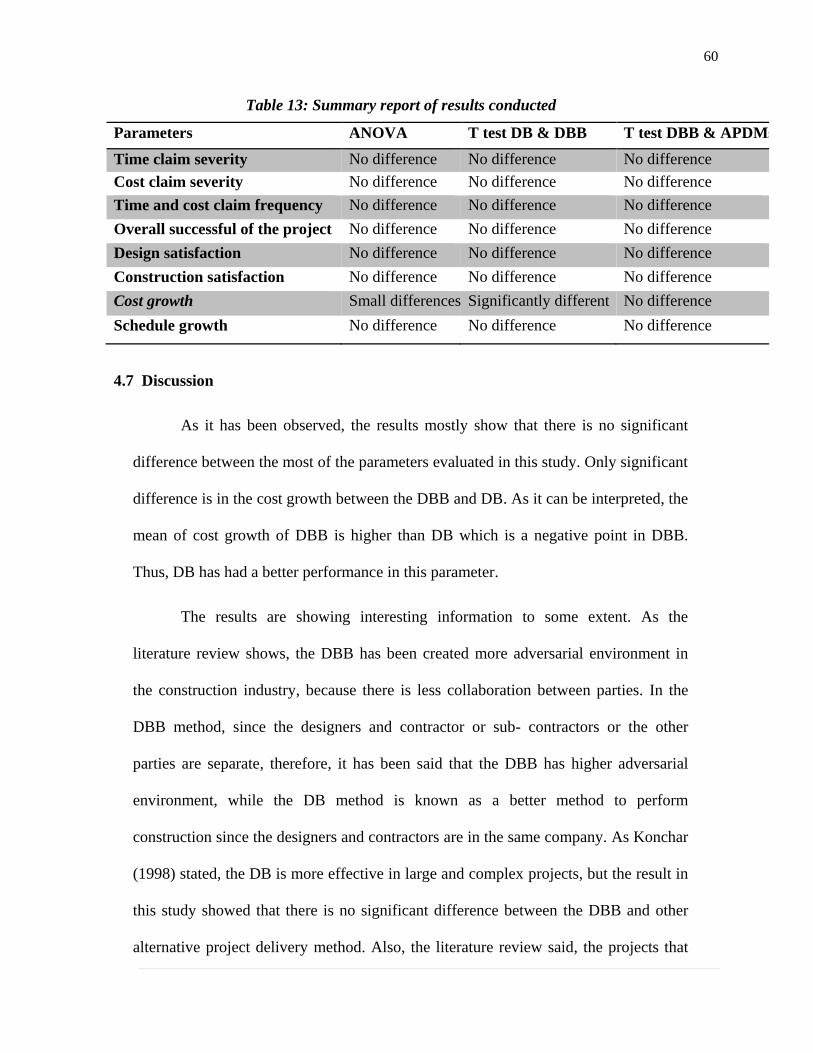
60
Table 13: Summary report of results conducted
Parameters ANOVA T test DB & DBB T test DBB & APDMs
Time claim severity No difference No difference No difference
Cost claim severity No difference No difference No difference
Time and cost claim frequency No difference No difference No difference
Overall successful of the project No difference No difference No difference
Design satisfaction No difference No difference No difference
Construction satisfaction No difference No difference No difference
Cost growth Small differences Significantly different No difference
Schedule growth No difference No difference No difference
4.7 Discussion
As it has been observed, the results mostly show that there is no significant
difference between the most of the parameters evaluated in this study. Only significant
difference is in the cost growth between the DBB and DB. As it can be interpreted, the
mean of cost growth of DBB is higher than DB which is a negative point in DBB.
Thus, DB has had a better performance in this parameter.
The results are showing interesting information to some extent. As the
literature review shows, the DBB has been created more adversarial environment in
the construction industry, because there is less collaboration between parties. In the
DBB method, since the designers and contractor or sub- contractors or the other
parties are separate, therefore, it has been said that the DBB has higher adversarial
environment, while the DB method is known as a better method to perform
construction since the designers and contractors are in the same company. As Konchar
(1998) stated, the DB is more effective in large and complex projects, but the result in
this study showed that there is no significant difference between the DBB and other
alternative project delivery method. Also, the literature review said, the projects that
61
transferring risk to the contractor and they have a low-bid process are more apt to have
such disagreement. While this study inferentially claims that there are no significant
differences between the three PDMs that have been reviewed here. Therefore, it can be
said that there is no significant difference between DBB, DB and CMGC based on this
study for the studied parameters, except in cost growth. In addition, the DB history
shows that those projects that have use DB method have been built faster than the
other methods. In this study, as we studied, the schedule growth remained the same for
both DBB and DB.
The other researches may focus on the other parameters that can be
significantly different. However, the only significant difference is the cost growth of
DB which has had a better performance; while the cost growth is lower than DBB.
The other parameters such as overall success of the project design and construction
satisfaction, time and cost claim severity and frequency are evaluated and finally
reached the same results for all studied PDMs.
The cost growth parameter has not been studied in literature review and we did
not find any information in previous studies regarding that in PDMs which can be very
helpful for the future researchers relevant to the PDM selection and DRMs.
Additionally, in the literature review, we studied that the conflicts on
construction projects are rather the norm than the expectation; and was emphasized
that about 30% of construction projects have severe disputes, and one of the four
construction projects has a claim in which it can be turned into disputes. Also, in this
study we reviewed that out of 62 projects, all of the project had disputes to some
62
extent, but only 11 projects used litigation which is the sever form of dispute
resolution in court.
In summary, as we discussed in literature review, the common belief is that the
DBB has the highest adversarial environment which is not statistically different based
on our results showed in this study.
63
CHAPETR V: CONCLUSIONS AND FUTURE RECCOMENDATIONS
5.1 Conclusions
Since the conflicts are common in construction industry and there are multiple
parties including owner, architect, engineer, contractor, subcontractor, supplier etc.,
are involved with different interests, therefore, the disputes and claims make the
construction industry to be a very risky industry, and claims are known as an
inventible part of the construction in general. Hence, this study was conducted to
empirically find a response for the important question of this study whether the PDM
selection affects the dispute occurrence. There is a common belief that DBB projects
have higher number of claims than DB project (Pishdad Bozorgi & J. de la , 2012).
However, the result of this study demonstrates that the mean of the time and cost
claim severity and frequency in all project delivery methods demonstrate that there are
no significant differences between contract parameters. This thesis study statistically
shows that that there is no significant differences between DBB, DB, CM/GC in terms
of dispute occurrence, while the literature review said that DBB has been proved for
higher adversarial environment.
There are several reasons that might have contributed to the results of this
study based on the responses which could be explained through the other factors
contributing to claim/dispute reduction incorporated in this survey. As it has been
proved, in DBB projects, owners and contractors had a history of working together on
all the projects studied. Hence, this might have additionally helped them to establish a
collaborative team environment, regardless of the PDM selected. Moreover, as far as
the study shows, more than 80 % of the project managers of all those projects were
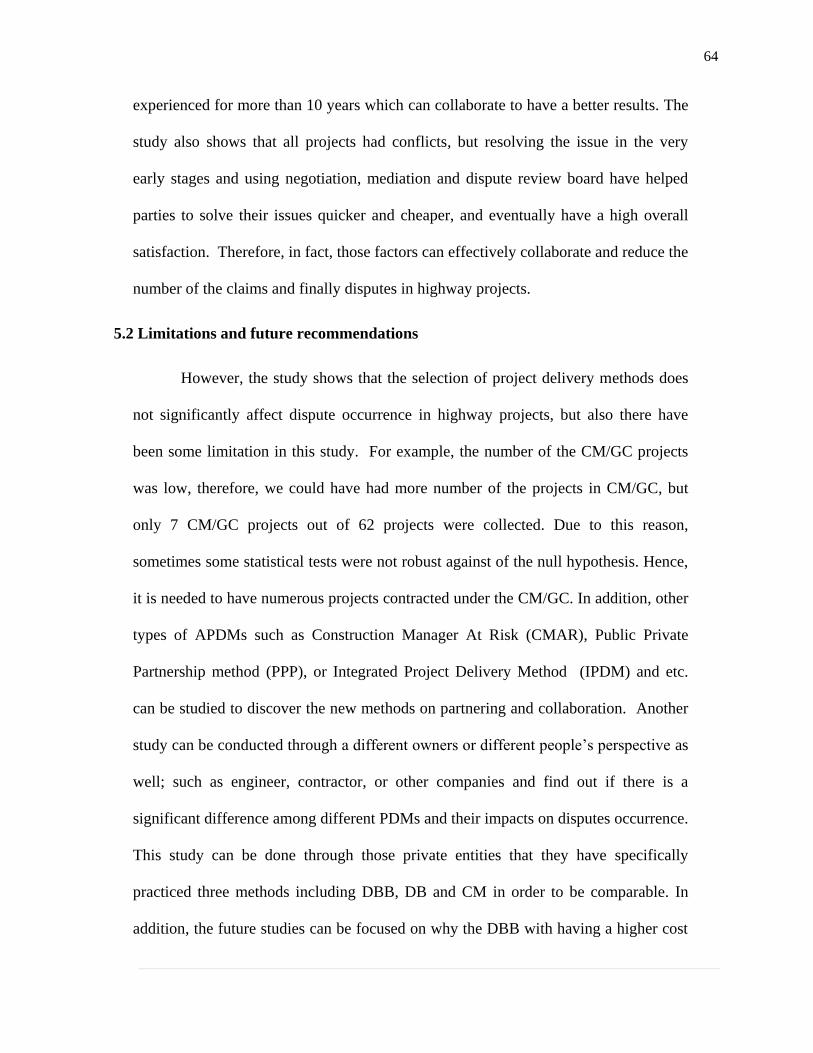
64
experienced for more than 10 years which can collaborate to have a better results. The
study also shows that all projects had conflicts, but resolving the issue in the very
early stages and using negotiation, mediation and dispute review board have helped
parties to solve their issues quicker and cheaper, and eventually have a high overall
satisfaction. Therefore, in fact, those factors can effectively collaborate and reduce the
number of the claims and finally disputes in highway projects.
5.2 Limitations and future recommendations
However, the study shows that the selection of project delivery methods does
not significantly affect dispute occurrence in highway projects, but also there have
been some limitation in this study. For example, the number of the CM/GC projects
was low, therefore, we could have had more number of the projects in CM/GC, but
only 7 CM/GC projects out of 62 projects were collected. Due to this reason,
sometimes some statistical tests were not robust against of the null hypothesis. Hence,
it is needed to have numerous projects contracted under the CM/GC. In addition, other
types of APDMs such as Construction Manager At Risk (CMAR), Public Private
Partnership method (PPP), or Integrated Project Delivery Method (IPDM) and etc.
can be studied to discover the new methods on partnering and collaboration. Another
study can be conducted through a different owners or different people’s perspective as
well; such as engineer, contractor, or other companies and find out if there is a
significant difference among different PDMs and their impacts on disputes occurrence.
This study can be done through those private entities that they have specifically
practiced three methods including DBB, DB and CM in order to be comparable. In
addition, the future studies can be focused on why the DBB with having a higher cost

65
growth or an increased in actual cost still is in the same ranking with DB. As it has
been observed, the cost growth can be a factor for increasing the unsatisfactory of the
projects, but in this study, the overall success of the projects, the time and cost claim
frequency and severity have the same results for all PDMs. In addition, for the farther
studies, the researchers can find how impressive the collaboration between parties is.
Whether having a more collaborative environment in specific phases can increase the
satisfaction of a project or in the other words, whether it can help to reduce the
disputes in construction projects.

66
APPENDICES

67
Appendix A: Bibliography
Abowitz , D. A., & Toole, T. M. (2010). Mixed method research: Fundamental issues of design,
validity, and reliability in construction research. Journal of Construction Engineering and
Management, 108-116.
Acharya, K. N., Lee , D. Y., & Im, M. H. (2006). Conflicting factors in construction projects: Korean
perspective. Engineering, Construction and Architectural Management, (pp. 543 – 566).
America, D. B. (n.d.). History of DBIA State Advocacy. Retrieved from
http://www.dbia.org/advocacy/state/Pages/default.aspx
Barry, W., & Leite, F. (2015). Late Deliverables in Construction: How Understanding the Impactc Can
Benefit Dispute Prevention and Resolution. Journal Of Legal Affair, Dispute Resolution
Engineering Construction.
Brookwood Group. (2010). 7 Project Delivery Methods. Atlanta, Los Angeles, San Francisco:
Brookwood Group.
Cakmak, E., & Cakmak, P. (2014). An Analysis of Causes of Disputes in the Construction Industry
Using Analytical Network Process. Procedia - Social and Behavioral Sciences (pp. 183–187).
Elsevier B.V.
Chan, H. E., & Suen, H. C. (2005). Dispute and Dispute Resolution System in Sino-Foreign joint
Venture Construction Project in China. Journal of Professional issues of Engineering
Education and Practice, ASCE, 141.
Chen, T.-T. (2010). Partnerships among different participants in construction industry of Taiwan:
Critical success and failure factors. Industrial Engineering and Engineering Management
(IE&EM) (pp. 1912 - 1917). Xiamen: IEEE.
Cheng , S., & Pang, K. (2013). Anatomy of Construction Disputes. Construction Dispute Resolution
Research.
Cheung, S. O. (1999). Critical factors affecting the use of alternative dispute resolution. International
Journal of Project Management, 189-194.
CMAA. (2012, August). AN OWNER'S GUIDE TOPROJECT DELIVERY METHODS. United
State. Retrieved from
https://cmaanet.org/files/Owners%20Guide%20to%20Project%20Delivery%20Methods%20Fi
nal.pdf

68
Creswell, J. W. (2009). Research design: Qualitative, quantitative, and mixed methods approaches.
Sage Publications, Inc.
Dawson, C. (2002). Practical research methods: a user-friendly guide to mastering research
techniques and projects. How To Books Ltd.
Dettman, K. L. (2008). Mediators as Settlement Process Chaperones: A New Approach to 38
Resolving Complex, Multi-Party Disputes . ADR Quarterly: ADR Section of the State Bar of
39 Michigan.
Dhanushkdi, U. (2012). CONTRACT STRATEGY FOR CONSTRUCTIONPROJECTS. Manchester.
Farooqui, R. U., Azhar, S., & Umer, M. (2014). Key Causes of Disputes in the Pakistani Construction.
Associated Schools of Construction. ASC Annual International Conference.
Federal Facilities Council . (2007).
Gad, G. M. (2012). Effect of culture, risk, and trust on the selection of dispute resolution methods in.
Iowa: UMI-Dssertation Publishing.
Gad, G. M., Momoh, A., Esmaeili, B., & Gransberg, D. G. (2015). Preliminary Investigation of the
Impact of Project Delivery Method. Construction Conference. United State.
Golafshani, N. (2003). Understanding reliability and validity in qualitative research. The Qualitative
Report, 597-606.
Gransberg, D. D., & Molenaar, K. R. (2004). Analysis of Owner’s Design and Construction Quality
Management Approaches in Design/Build Projects. Managemnt of Engineering, 162–169.
Halpin, D. W., & Senior, B. A. (2013). Construction Management. United State: Don Fowlay.
Ibbs , W., & Chen , C. (2015). Proactive Project- Prediction Tool. American Society of civil Engineers.
Johnson, R. B., Onwuegbuzie, A. J., & Turner, L. A. (2007). Toward a definition of mixed methods
research. Journal of Mixed Methods Research, 112-133.
Klinger, M. (2009). Confronting Construction Conflicts. Electrical Construction & Maintenance. 14.
Konchar, M., & Sanvido, V. (1998). Comparison of U.S. Project Delivery Systems. Construction
Engineering Management, 435-444.
Kylindri, S., Blanas, G., Henriksen, L., & Stoyan, T. (2010). Measuring Project Outcomes: A Review
of Success Effectiveness Variables. MIBES, (pp. 212-223).
69
Mante, J., Ndekugri , I., Ankrah , N., & Hammond , F. (2012). The influence of procurement methods
on dispute resolution mechanism choice in construction. Association of Researchers in
Construction Management, (pp. 979-988). Edinburgh, UK.
Mehany, H. M., & Grigg, N. (2014). Causes of Road and Bridge construction claims, Analysis of
Colorado Department of Transportation Project. ASCE.
Michel, H. L. (1998). The Next 25 Years: ,The Future of the Construction Industry. Journal of
Management in Engineeirng, 26-31.
Minchin, R., Li, X., Issa, R., & Vargas, G. (2013). Comparison of Cost and Time Performance of DB
and DBB Delivery Systems in Florida. Construction Engineering Management.
Moskal, B. &. (2000). Scoring rubric development: Validity and Reliability,reliability. Practical
Assessment, Research & Evaluation. Retrieved from
http://pareonline.net/getvn.asp?v=7&n=10
Naoum, S. G. (2007). Dissertation research and writing for construction students . Hungary: Elsevier
Ltd.
Ndekugri, I., & Turner, A. (1994). Building Procurement by Design and Build Approach. Constructin
Engineering Management, 243–256.
Neuendorf, K. (2002). The Content Analysis Guidebook. Thousand Oaks, California: Sage
Publications.
Pakkala, P. (2002). Innovative Project Delivery Methods for Infrastructure-An International
Perspective. Helsinki: Finnish Road Enterprise.
Participants in the Construction Project. (2010). Retrieved from Pro Builders Design & Construction:
http://www.probuildersslo.com/conintro/42-constructionparticipants
Peña-Mora, F. C. (2003). Introduction to Construction Dispute Resolution. Upper Saddle River, NJ:
Prentice Hall .
Pishdad Bozorgi , P., & J. de la , G. (2012). Comparative Analysis of Design-Bid-Build and Design-
Build 27 from the Standpoint of Claims. Construction Research Congress, (pp. 21-30).
Pocock,, J., Hyun, C., Liu, L., & Kim, M. (1996). Relationship between project interaction and
performance indicators. Journal of construction engineering and management., 165–176.
Qualitative Research Methods:A Data Collector’s Field Guide. (n.d.). Familiy Helth International, 2-4.
Riffenburgh, R. H. (2006). Statistic in Medicine. Elsevier Inc.
70
Safinia , S. (2014). A Review on Dispute Resolution Methods in UK Construction Industry .
Construction Engineering and Management.
Schieg, M. (2008). Modeling For Integrated Project Management. Journal of Business Economics and
Management.
Shrestha , P. P., O'Connor , J. T., & Gibson , G. (2012). Performance Comparison of Large Design-
Build and Design-Bid-Build Highway Projects. Construction Engineering Management, 1-13.
Skills You Need. (n.d.). Retrieved from Writing your Dessertation, Methodology:
http://www.skillsyouneed.com/learn/dissertation-methodology.html
The American Institute of Architects, & The Associated General Contractors of America. (2011).
Primer on Project Delivery. AIA, and AGC of America.
Tolson, S. (2013). Disputes in the UK Construction Industry. London.
Warne, T. R. (2005). Design build contracting for highway projects: A performance assessment. Tom
Warne & Associates.
William, M. K. (2006, 10 20). Research Method Knowledge Base. Retrieved from Social Research
Method: http://www.socialresearchmethods.net/kb/statinf.php
Wong, W. K. (2008). A framework for trust in construction contracting. International Journal of
Project Management, 821-829.
Wren, J., & Phelan, C. (2005-6). EXPLORING RELIABILITY IN ACADEMIC ASSESSMENT.
Retrieved from UNI Office of Academic Assessment:
https://www.uni.edu/chfasoa/reliabilityandvalidity.htm
Wyse, S. E. (2011, September 16). Retrieved from Snap Surveys:
http://www.snapsurveys.com/blog/what-is-the-difference-between-qualitative-research-and-
quantitative-research/
Yates, J. K., & Smith, J. A. (2007). Global legal issues for engineers and constructors. Journal of
Professional Issues in enginerring Education and Practice, 199.

71
Appendix B: Questionnaire
The Impact of Project Delivery Method on Dispute Occurrence in Public
Highway Projects
Purpose: Bowling Green State University, University of Nebraska-Lincoln,
and Iowa State University are conducting a survey to investigate the impact of (1)
project delivery methods, (2) contract type, (3) procurement, and (4) team behavior on
construction contract dispute. Please help us by completing the survey for 3 highway
projects you have completed. If possible, please select projects that employed different
project delivery methods (such as design-build, CM/GC, and design-bid-build) that
were completed during the last 5 years. The questionnaire should take about 30
minutes to complete. Please return it within three weeks <04/29/15>
Confidentiality: The project information you provide will be kept in strict
confidentiality, within a password protected database. Only the primary investigators
and their research assistants will see and have access to your information. Your
participation in this survey is completely voluntary. Please note that you may skip any
question at any time that you feel uncomfortable answering. In the event of a
publication or presentation based on the results of this study, no personal identifiable
information will be shared.
Participation: Your decision to participate in this research is voluntary and
you may withdraw at any time. There is no direct compensation; however, participants
may request a copy of the final analysis. If you have any questions, complaints or
concerns regarding this research, you may contact Samaneh Nasrollahi at
[email protected] or419-819-1565 and Dr. Ghada M. Gad at [email protected] or
419-372-5437.
Definitions
CM/GC or CM@Risk: Project delivery method in which a contract between
an owner and a Construction manager who will be at risk for the final cost and time of
construction is set up. In this agreement, the owner authorizes the construction
manager to make input during project design. The contractor acts a GC and CM during
the construction phase.
Design Bid Build: In this project delivery method, the owner first completes
the design using either an in house or consultant designer, and upon the completion of
the design, will solicit a contractor. Generally, the contractor is chosen on a basis of
the lowest, responsive bid.
Design Build: A project delivery method where a single entity executes both
engineering and construction services. The design builder may be a single integrated
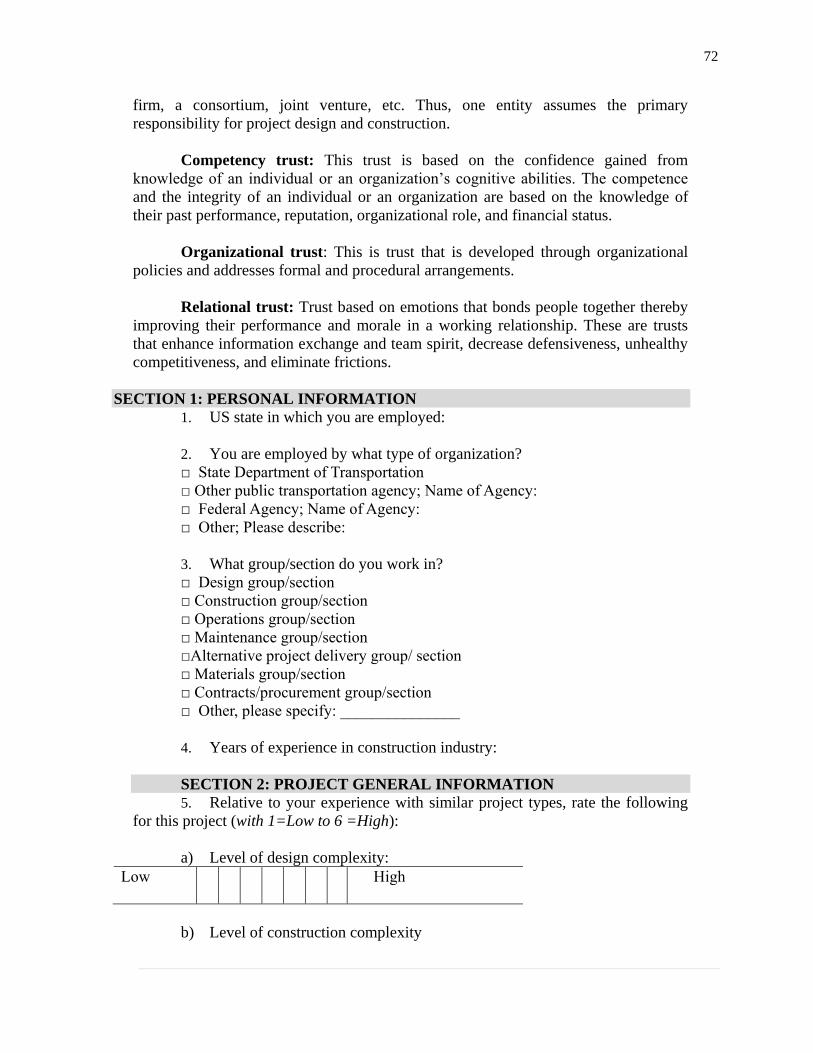
72
firm, a consortium, joint venture, etc. Thus, one entity assumes the primary
responsibility for project design and construction.
Competency trust: This trust is based on the confidence gained from
knowledge of an individual or an organization’s cognitive abilities. The competence
and the integrity of an individual or an organization are based on the knowledge of
their past performance, reputation, organizational role, and financial status.
Organizational trust: This is trust that is developed through organizational
policies and addresses formal and procedural arrangements.
Relational trust: Trust based on emotions that bonds people together thereby
improving their performance and morale in a working relationship. These are trusts
that enhance information exchange and team spirit, decrease defensiveness, unhealthy
competitiveness, and eliminate frictions.
SECTION 1: PERSONAL INFORMATION
1. US state in which you are employed:
2. You are employed by what type of organization?
□ State Department of Transportation
□ Other public transportation agency; Name of Agency:
□ Federal Agency; Name of Agency:
□ Other; Please describe:
3. What group/section do you work in?
□ Design group/section
□ Construction group/section
□ Operations group/section
□ Maintenance group/section
□Alternative project delivery group/ section
□ Materials group/section
□ Contracts/procurement group/section
□ Other, please specify: _______________
4. Years of experience in construction industry:
SECTION 2: PROJECT GENERAL INFORMATION
5. Relative to your experience with similar project types, rate the following
for this project (with 1=Low to 6 =High):
a) Level of design complexity:
Low 1
O
2
O
3
O
4
O
5
O
6
O
High
b) Level of construction complexity
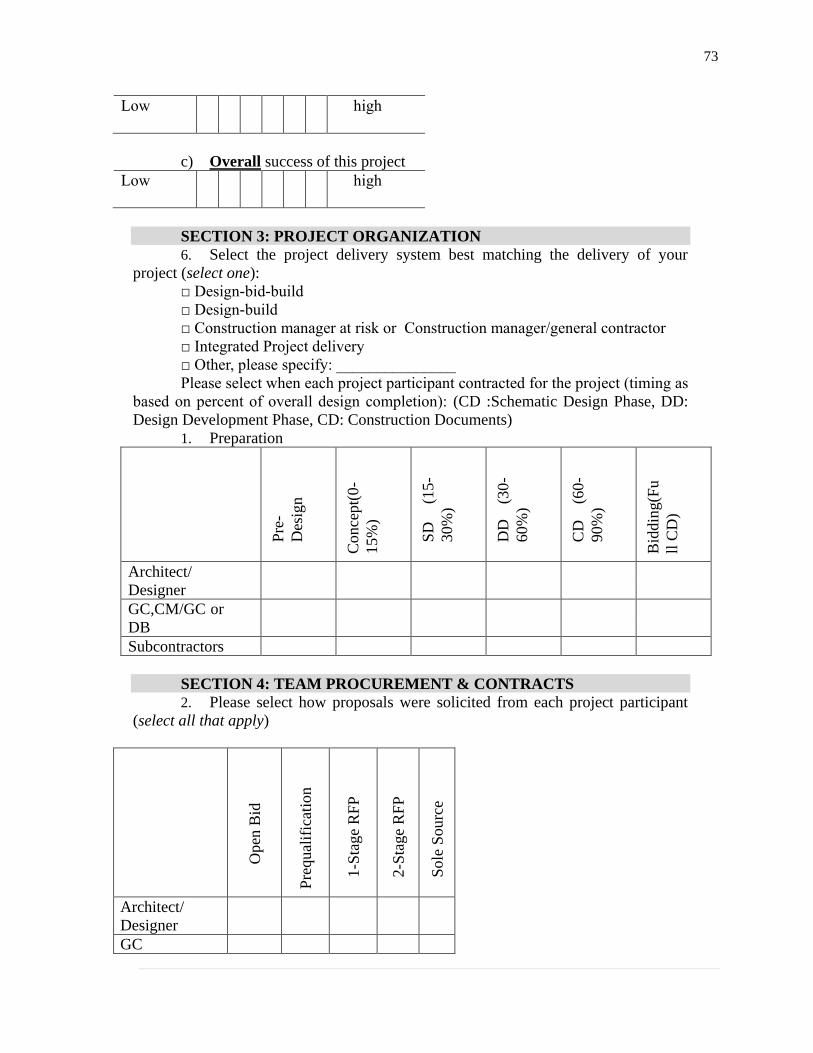
73
Low 1
O
2
O
3
O
4
O
5
O
6
O
high
c) Overall success of this project
Low 1
O
2
O
3
O
4
O
5
O
6
O
high
SECTION 3: PROJECT ORGANIZATION
6. Select the project delivery system best matching the delivery of your
project (select one):
□ Design-bid-build
□ Design-build
□ Construction manager at risk or Construction manager/general contractor
□ Integrated Project delivery
□ Other, please specify: _______________
Please select when each project participant contracted for the project (timing as
based on percent of overall design completion): (CD :Schematic Design Phase, DD:
Design Development Phase, CD: Construction Documents)
1. Preparation
Pre
-
Des
ign
Conce
pt(
0-
15%
)
SD
(1
5-
30%
)
DD
(3
0-
60%
)
CD
(6
0-
90%
)
Bid
din
g(F
u
ll C
D)
Architect/
Designer O O O O O O
GC,CM/GC or
DB O O O O O O
Subcontractors O O O O O O
SECTION 4: TEAM PROCUREMENT & CONTRACTS
2. Please select how proposals were solicited from each project participant
(select all that apply)
Open
Bid
Pre
qual
ific
atio
n
1-S
tage
RF
P
2-S
tage
RF
P
Sole
Sourc
e
Architect/
Designer
O O O O O
GC O O O O O
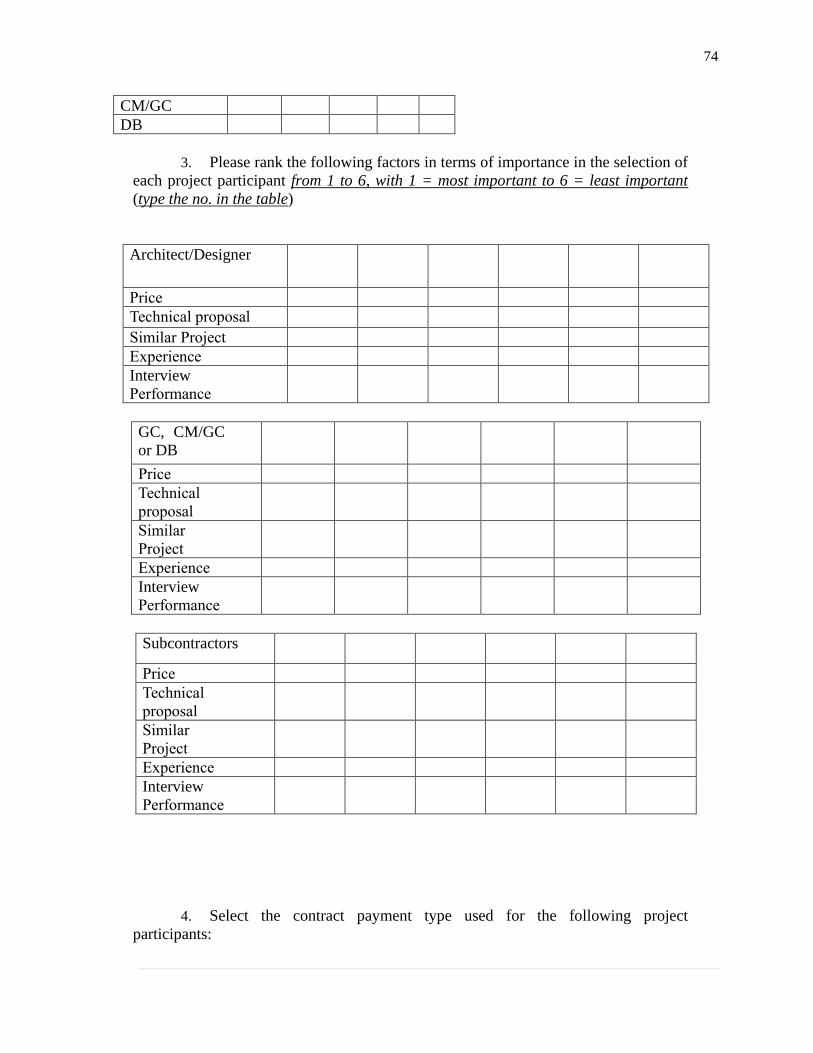
74
CM/GC
DB O O O O O
3. Please rank the following factors in terms of importance in the selection of
each project participant from 1 to 6, with 1 = most important to 6 = least important
(type the no. in the table)
Architect/Designer
1
2
3
4
5
6
Price o o o o o o
Technical proposal o o o o o o
Similar Project o o o o o o
Experience o o o o o o
Interview
Performance
o o o o o o
GC, CM/GC
or DB
1
2
3
4
5
6
Price o o o o o o
Technical
proposal
o o o o o o
Similar
Project
o o o o o o
Experience o o o o o o
Interview
Performance
o o o o o o
Subcontractors
1
2
3
4
5
6
Price o o o o o o
Technical
proposal
o o o o o o
Similar
Project
o o o o o o
Experience o o o o o o
Interview
Performance
o o o o o o
4. Select the contract payment type used for the following project
participants:

75
lum
p
Sum
unit
Pri
ce
GM
P
Fix
ed
Fee
cost
Plu
s
Architect/Designer O O O O O
GC, CM/GC O O O O O
Subcontractors O O O O O
Design Builder in
DB Project O O O O O
5. Rate your overall satisfaction with the following (with 1=Not satisfied to
6=Exceed expectations):
a) Design process
Not
satisfi
ed
1
O
2
O
3
O
4
O
5
O
6
O
Exceed
expectat
ions
b) Construction process
Not
satisfi
ed
1
O
2
O
3
O
4
O
5
O
6
O
Exceed
expectat
ions
SECTION 5: CHANGE ORDER/DISPUTES
6. Based on your experience, how would you rate the following (with 1= low
to 6=High):
a) Frequency of claims which arose at the field level
Low 1
O
2
O
3
O
4
O
5
O
6
O
high
b) Severity of claims which arose on project (in terms of TIME to resolve)
Low 1
O
2
O
3
O
4
O
5
O
6
O
high
c) Severity of claims which arose on project (in terms of COST impact)
Low
1
O
2
O
3
O
4
O
5
O
6
O
high
d) Severity (in terms of cost impact and time to resolve) of largest dispute
which arose on project
Low 1
O
2
O
3
O
4
O
5
O
6
O
high
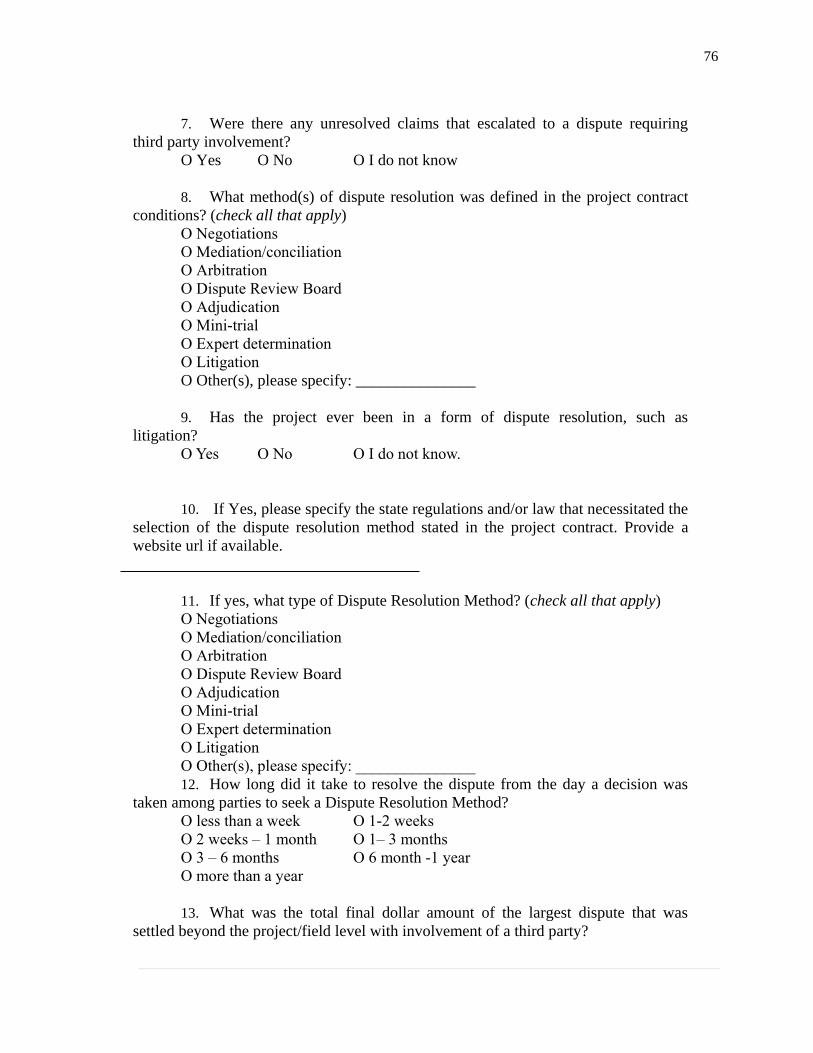
76
7. Were there any unresolved claims that escalated to a dispute requiring
third party involvement?
O Yes O No O I do not know
8. What method(s) of dispute resolution was defined in the project contract
conditions? (check all that apply)
O Negotiations
O Mediation/conciliation
O Arbitration
O Dispute Review Board
O Adjudication
O Mini-trial
O Expert determination
O Litigation
O Other(s), please specify: _______________
9. Has the project ever been in a form of dispute resolution, such as
litigation?
O Yes O No O I do not know.
10. If Yes, please specify the state regulations and/or law that necessitated the
selection of the dispute resolution method stated in the project contract. Provide a
website url if available.
11. If yes, what type of Dispute Resolution Method? (check all that apply)
O Negotiations
O Mediation/conciliation
O Arbitration
O Dispute Review Board
O Adjudication
O Mini-trial
O Expert determination
O Litigation
O Other(s), please specify: _______________
12. How long did it take to resolve the dispute from the day a decision was
taken among parties to seek a Dispute Resolution Method?
O less than a week O 1-2 weeks
O 2 weeks – 1 month O 1– 3 months
O 3 – 6 months O 6 month -1 year
O more than a year
13. What was the total final dollar amount of the largest dispute that was
settled beyond the project/field level with involvement of a third party?
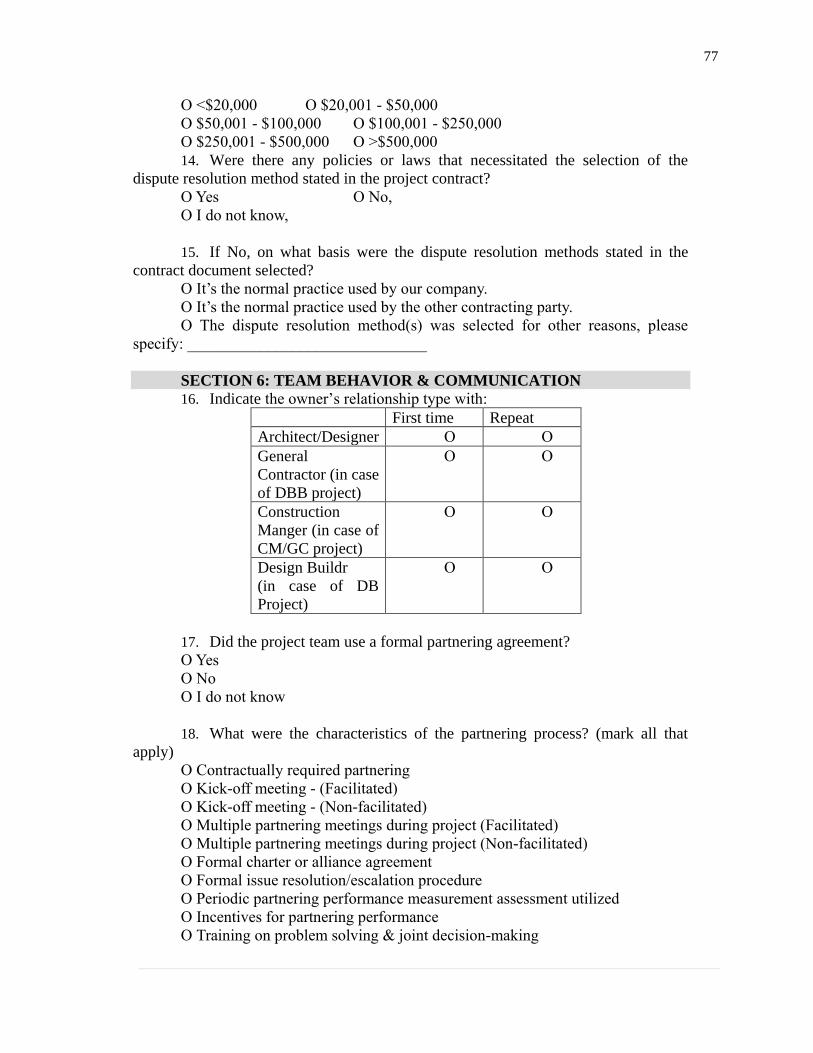
77
O <$20,000 O $20,001 - $50,000
O $50,001 - $100,000 O $100,001 - $250,000
O $250,001 - $500,000 O >$500,000
14. Were there any policies or laws that necessitated the selection of the
dispute resolution method stated in the project contract?
O Yes O No,
O I do not know,
15. If No, on what basis were the dispute resolution methods stated in the
contract document selected?
O It’s the normal practice used by our company.
O It’s the normal practice used by the other contracting party.
O The dispute resolution method(s) was selected for other reasons, please
specify: ______________________________
SECTION 6: TEAM BEHAVIOR & COMMUNICATION
16. Indicate the owner’s relationship type with:
First time Repeat
Architect/Designer O O
General
Contractor (in case
of DBB project)
O O
Construction
Manger (in case of
CM/GC project)
O O
Design Buildr
(in case of DB
Project)
O O
17. Did the project team use a formal partnering agreement?
O Yes
O No
O I do not know
18. What were the characteristics of the partnering process? (mark all that
apply)
O Contractually required partnering
O Kick-off meeting - (Facilitated)
O Kick-off meeting - (Non-facilitated)
O Multiple partnering meetings during project (Facilitated)
O Multiple partnering meetings during project (Non-facilitated)
O Formal charter or alliance agreement
O Formal issue resolution/escalation procedure
O Periodic partnering performance measurement assessment utilized
O Incentives for partnering performance
O Training on problem solving & joint decision-making
78
O Other, please specify: _______________
19. Please rate the following from 1 to 6:
a. Contractor’s upper
managerial support and responses
Ineff
ectiv
e
1
O
2
O
3
O
4
O
5
O
6
O
V-
effectiv
e
b. Contractor’s organization
experience with this type of project
None 1
O
2
O
3
O
4
O
5
O
6
O
A lot
c. Experience and
competence level of the contractor’s
project individuals
Low 1
O
2
O
3
O
4
O
5
O
6
O
High
d. Quality of the input shared
during pre-construction phase of
project
Low 1
O
2
O
3
O
4
O
5
O
6
O
High
e. Level of experience and
effort of financial planners, and
adequacy of financial plan
Low 1
O
2
O
3
O
4
O
5
O
6
O
High
f. Team’s prior experience
as a unit
low 1
O
2
O
3
O
4
O
5
O
6
O
High
g. Formality of
communication among team members
Informal 1
O
2
O
3
O
4
O
5
O
6
O
Formal
h. Timeliness of
communication
Never on
time
1
O
2
O
3
O
4
O
5
O
6
O
Always on
time
79
i. Electronic file &
information sharing used by project
team
Primarily
paper-
based
1
O
2
O
3
O
4
O
5
O
6
O
All
electronic
j. Risks identification and
allocation
Poor 1
O
2
O
3
O
4
O
5
O
6
O
Excellent
k. Adequacy of technical
plans/specs
Poor 1
O
2
O
3
O
4
O
5
O
6
O
Excellent
20. Please evaluate trust between your organization and contractor
(GC/DB/CMR):
a) Competency trust
Low 1
O
2
O
3
O
4
O
5
O
6
O
high
b) Organizational trust
Low 1
O
2
O
3
O
4
O
5
O
6
O
high
c) Relational trust
Low 1
O
2
O
3
O
4
O
5
O
6
O
high
SECTION 7: COST AND SCHEDULE
21. What was the original contract price?
a) <$100,000
b) $100,001 - $200,000
c) $200,001 - $300,000
d) $300,001 - $400,000
e) $400,001 - $500,000
f) >$500,001
80
22. What was the original duration of the project?
a) <2 months
b) 2 months – 6 months
c) 6 months – 1 year
d) 1 year – 1.5 years
e) 1.5 years – 2 years
f) > 2 years
23. What was the percentage of cost growth?
a) <10%
b) 0-10%
c) 10% - 20%
d) 20% - 30%
e) 30% - 40%
f) >40%
24. What was the percentage of schedule growth?
a) <10%
b) 0-10%
c) 10% - 20%
d) 20% - 30%
e) 30% - 40%
f) >40%
25. Would you be willing to be contacted for an interview to discuss
additional information regarding the projects you provided:
O Yes
O No
26. Please provide contact information:
a. Contact name:
b. Phone number:
c. Email address
Thank you very much for your time and consideration to provide information.
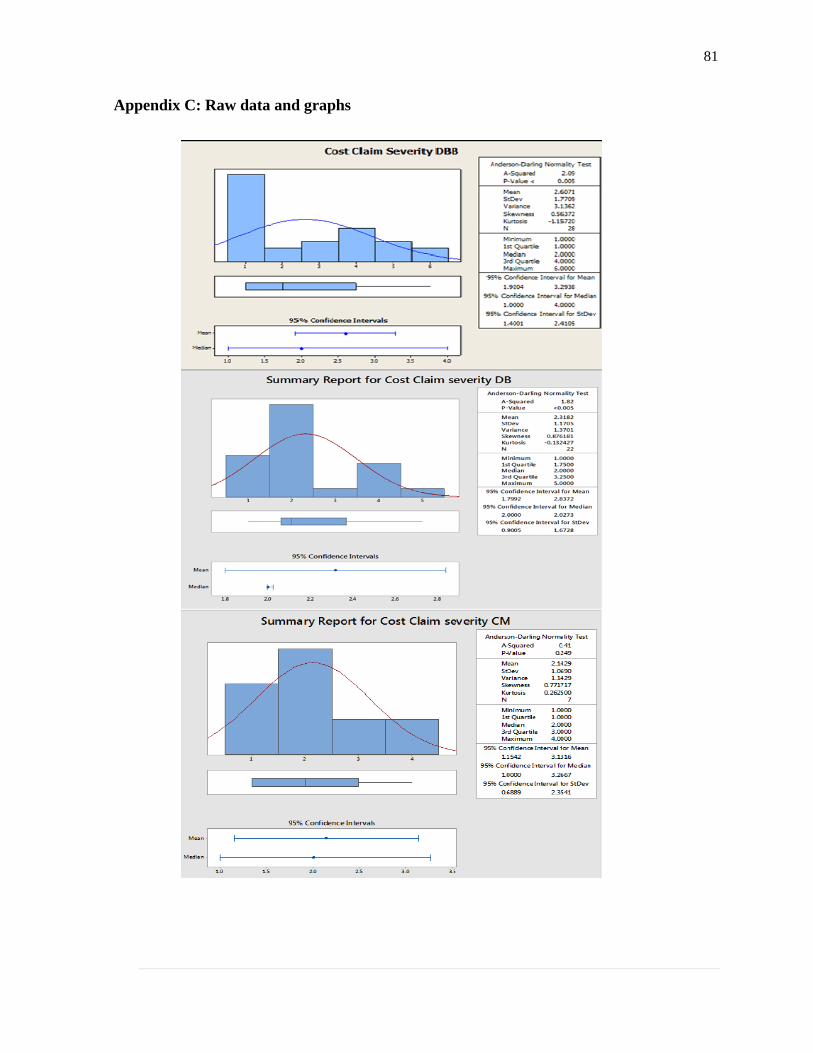
81
Appendix C: Raw data and graphs
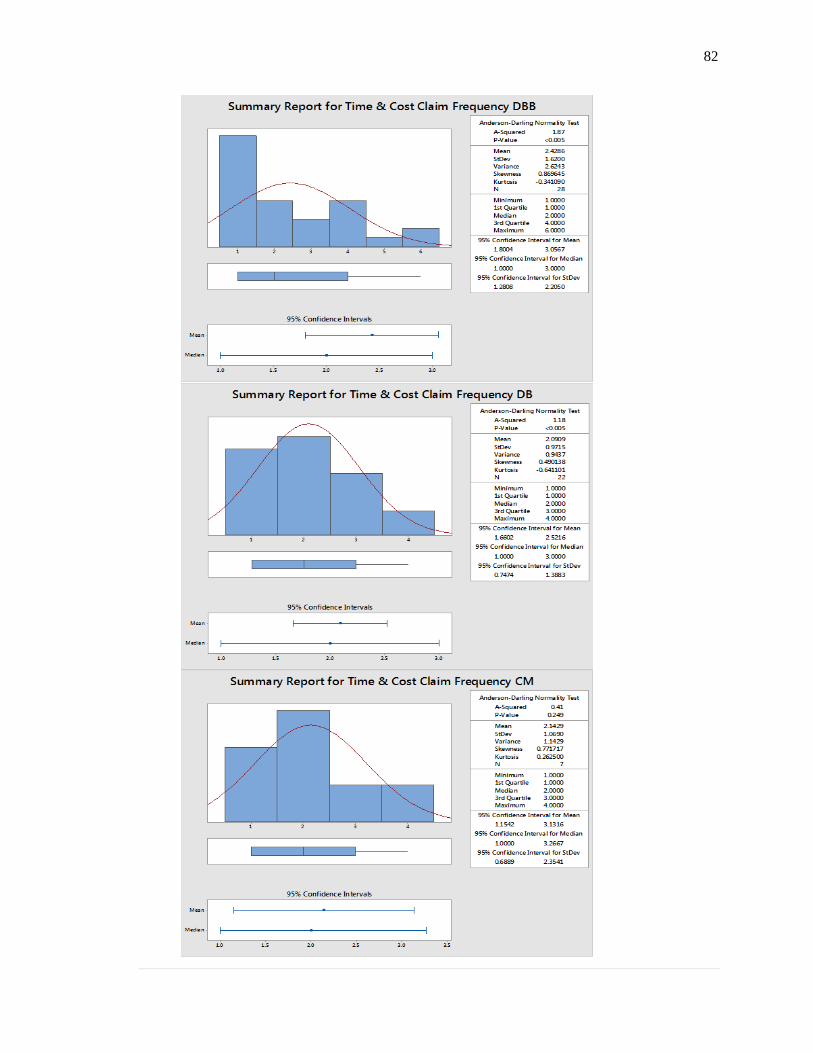
82

83
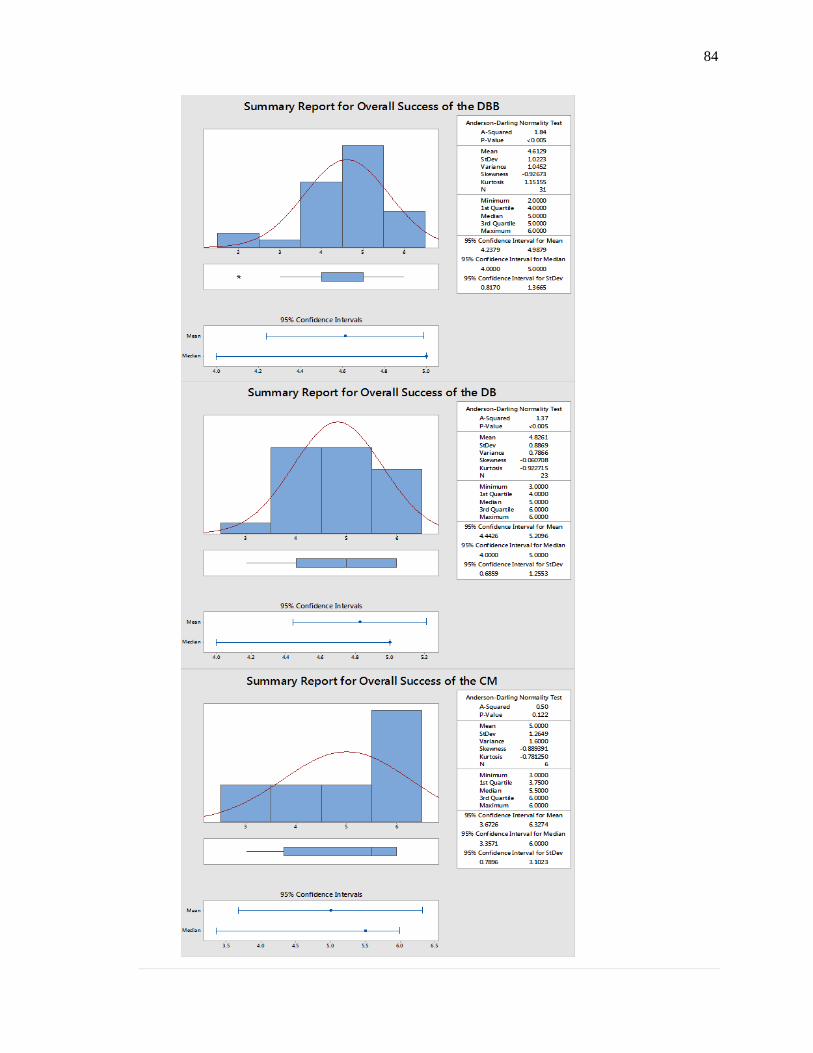
84

85

86
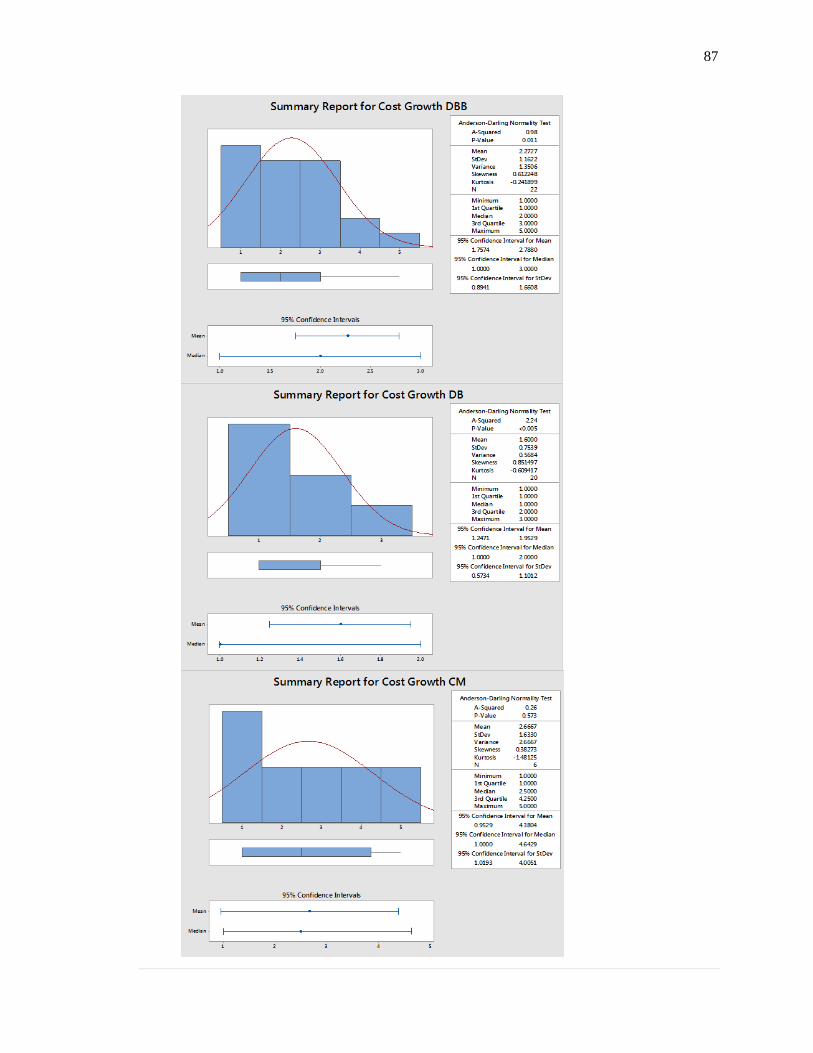
87
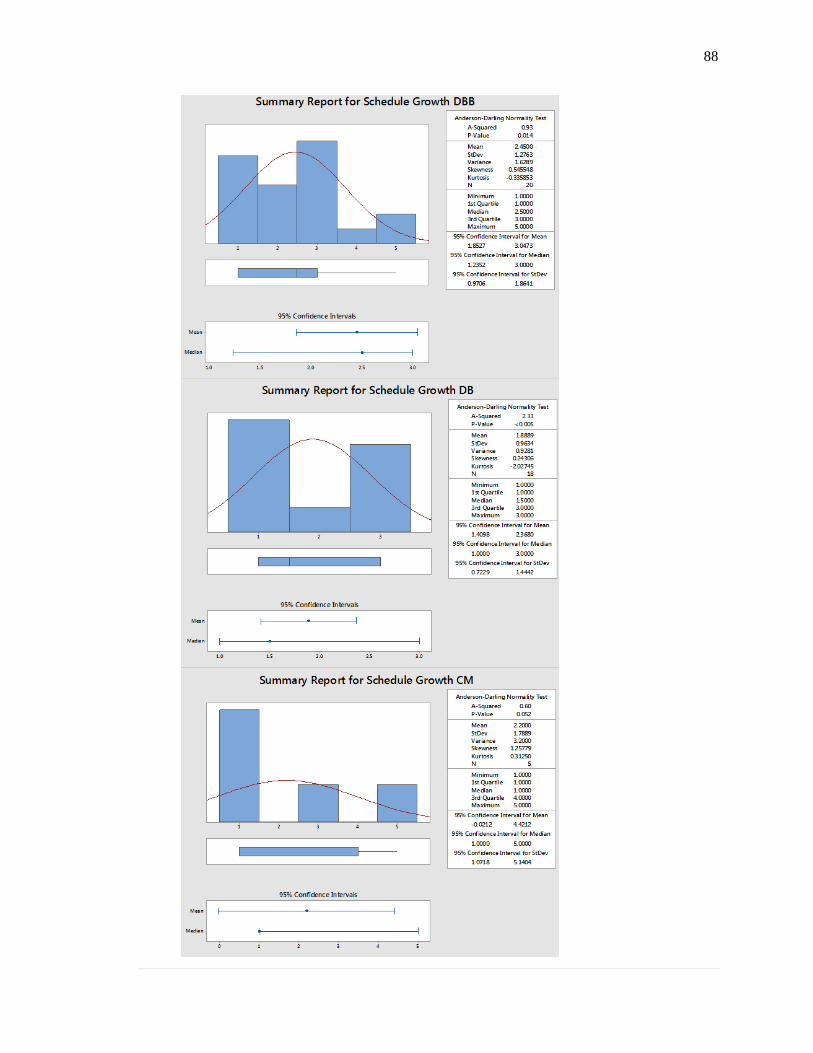
88
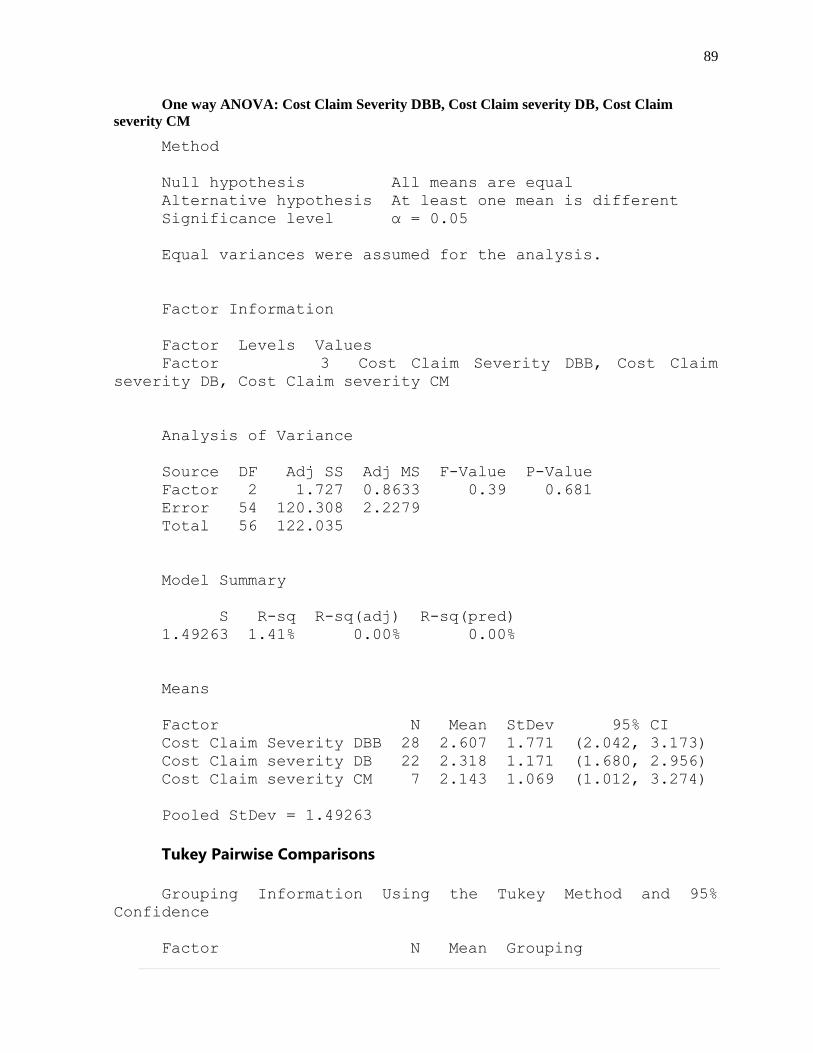
89
One way ANOVA: Cost Claim Severity DBB, Cost Claim severity DB, Cost Claim
severity CM
Method
Null hypothesis All means are equal
Alternative hypothesis At least one mean is different
Significance level α = 0.05
Equal variances were assumed for the analysis.
Factor Information
Factor Levels Values
Factor 3 Cost Claim Severity DBB, Cost Claim
severity DB, Cost Claim severity CM
Analysis of Variance
Source DF Adj SS Adj MS F-Value P-Value
Factor 2 1.727 0.8633 0.39 0.681
Error 54 120.308 2.2279
Total 56 122.035
Model Summary
S R-sq R-sq(adj) R-sq(pred)
1.49263 1.41% 0.00% 0.00%
Means
Factor N Mean StDev 95% CI
Cost Claim Severity DBB 28 2.607 1.771 (2.042, 3.173)
Cost Claim severity DB 22 2.318 1.171 (1.680, 2.956)
Cost Claim severity CM 7 2.143 1.069 (1.012, 3.274)
Pooled StDev = 1.49263
Tukey Pairwise Comparisons
Grouping Information Using the Tukey Method and 95%
Confidence
Factor N Mean Grouping

90
Cost Claim Severity DBB 28 2.607 A
Cost Claim severity DB 22 2.318 A
Cost Claim severity CM 7 2.143 A
Means that do not share a letter are significantly
different.
One-way ANOVA: Time Claim Severity DBB, Time Claim Severity DB, Time
Claim Severity CM
Method
Null hypothesis All means are equal
Alternative hypothesis At least one mean is different
Significance level α = 0.05
Equal variances were assumed for the analysis.
Factor Information
Factor Levels Values
Factor 3 Time Claim Severity DBB, Time Claim
Severity DB, Time Claim Severity CM
Analysis of Variance
Source DF Adj SS Adj MS F-Value P-Value
Factor 2 0.180 0.08983 0.05 0.955
Error 53 104.035 1.96292
Total 55 104.214
Model Summary
S R-sq R-sq(adj) R-sq(pred)
1.40104 0.17% 0.00% 0.00%
Means
Factor N Mean StDev 95% CI
Time Claim Severity DBB 28 2.357 1.660 (1.826, 2.888)
Time Claim Severity DB 22 2.318 1.041 (1.719, 2.917)
Time Claim Severity CM 6 2.167 1.169 (1.019, 3.314)
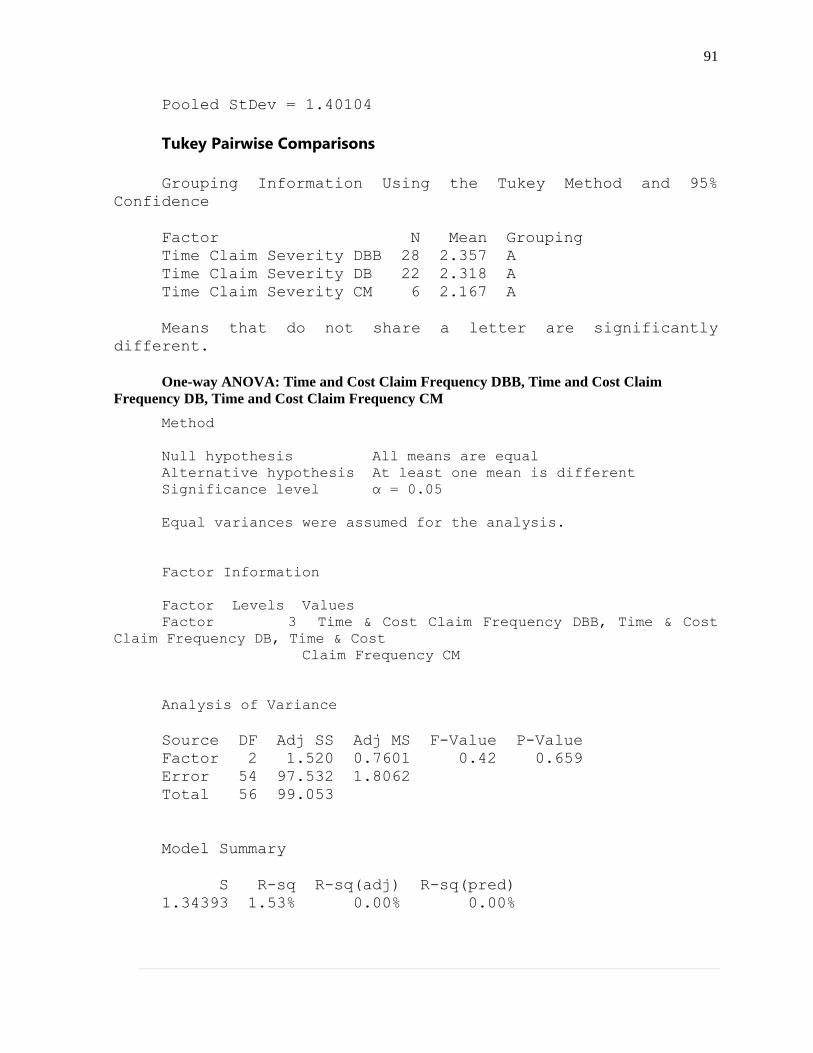
91
Pooled StDev = 1.40104
Tukey Pairwise Comparisons
Grouping Information Using the Tukey Method and 95%
Confidence
Factor N Mean Grouping
Time Claim Severity DBB 28 2.357 A
Time Claim Severity DB 22 2.318 A
Time Claim Severity CM 6 2.167 A
Means that do not share a letter are significantly
different.
One-way ANOVA: Time and Cost Claim Frequency DBB, Time and Cost Claim
Frequency DB, Time and Cost Claim Frequency CM
Method
Null hypothesis All means are equal
Alternative hypothesis At least one mean is different
Significance level α = 0.05
Equal variances were assumed for the analysis.
Factor Information
Factor Levels Values
Factor 3 Time & Cost Claim Frequency DBB, Time & Cost
Claim Frequency DB, Time & Cost
Claim Frequency CM
Analysis of Variance
Source DF Adj SS Adj MS F-Value P-Value
Factor 2 1.520 0.7601 0.42 0.659
Error 54 97.532 1.8062
Total 56 99.053
Model Summary
S R-sq R-sq(adj) R-sq(pred)
1.34393 1.53% 0.00% 0.00%

92
Means
Factor N Mean StDev 95%
CI
Time & Cost Claim Frequency DBB 28 2.429 1.620 (1.919,
2.938)
Time & Cost Claim Frequency DB 22 2.091 0.971 (1.516,
2.665)
Time & Cost Claim Frequency CM 7 2.143 1.069 (1.124,
3.161)
Pooled StDev = 1.34393
Tukey Pairwise Comparisons
Grouping Information Using the Tukey Method and 95%
Confidence
Factor N Mean Grouping
Time & Cost Claim Frequency DBB 28 2.429 A
Time & Cost Claim Frequency CM 7 2.143 A
Time & Cost Claim Frequency DB 22 2.091 A
Means that do not share a letter are significantly
different.
One-way ANOVA: Overall Successful of DBB, Overall Successful of DB, Overall
Successful of CM
Method
Null hypothesis All means are equal
Alternative hypothesis At least one mean is different
Significance level α = 0.05
Equal variances were assumed for the analysis.
Factor Information
Factor Levels Values
Factor 3 Overall Success of the DBB, Overall
Success of the DB, Overall Success of the
CM
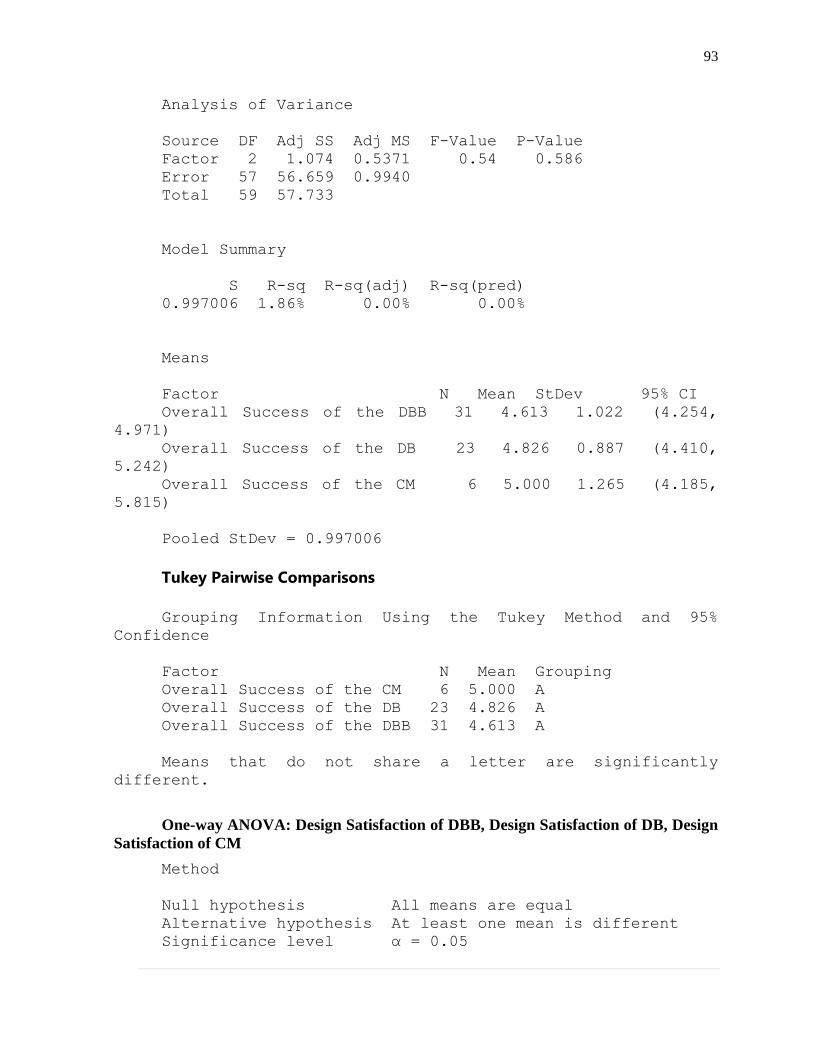
93
Analysis of Variance
Source DF Adj SS Adj MS F-Value P-Value
Factor 2 1.074 0.5371 0.54 0.586
Error 57 56.659 0.9940
Total 59 57.733
Model Summary
S R-sq R-sq(adj) R-sq(pred)
0.997006 1.86% 0.00% 0.00%
Means
Factor N Mean StDev 95% CI
Overall Success of the DBB 31 4.613 1.022 (4.254,
4.971)
Overall Success of the DB 23 4.826 0.887 (4.410,
5.242)
Overall Success of the CM 6 5.000 1.265 (4.185,
5.815)
Pooled StDev = 0.997006
Tukey Pairwise Comparisons
Grouping Information Using the Tukey Method and 95%
Confidence
Factor N Mean Grouping
Overall Success of the CM 6 5.000 A
Overall Success of the DB 23 4.826 A
Overall Success of the DBB 31 4.613 A
Means that do not share a letter are significantly
different.
One-way ANOVA: Design Satisfaction of DBB, Design Satisfaction of DB, Design
Satisfaction of CM
Method
Null hypothesis All means are equal
Alternative hypothesis At least one mean is different
Significance level α = 0.05

94
Equal variances were assumed for the analysis.
Factor Information
Factor Levels Values
Factor 3 Design satisfaction DBB, Design
satisfaction DB, Design satisfaction CM
Analysis of Variance
Source DF Adj SS Adj MS F-Value P-Value
Factor 2 0.7577 0.3789 0.32 0.727
Error 52 61.4241 1.1812
Total 54 62.1818
Model Summary
S R-sq R-sq(adj) R-sq(pred)
1.08685 1.22% 0.00% 0.00%
Means
Factor N Mean StDev 95% CI
Design satisfaction DBB 26 4.077 1.017 (3.649, 4.505)
Design satisfaction DB 22 4.227 0.973 (3.762, 4.692)
Design satisfaction CM 7 4.429 1.618 (3.604, 5.253)
Pooled StDev = 1.08685
Tukey Pairwise Comparisons
Grouping Information Using the Tukey Method and 95%
Confidence
Factor N Mean Grouping
Design satisfaction CM 7 4.429 A
Design satisfaction DB 22 4.227 A
Design satisfaction DBB 26 4.077 A
Means that do not share a letter are significantly
different.
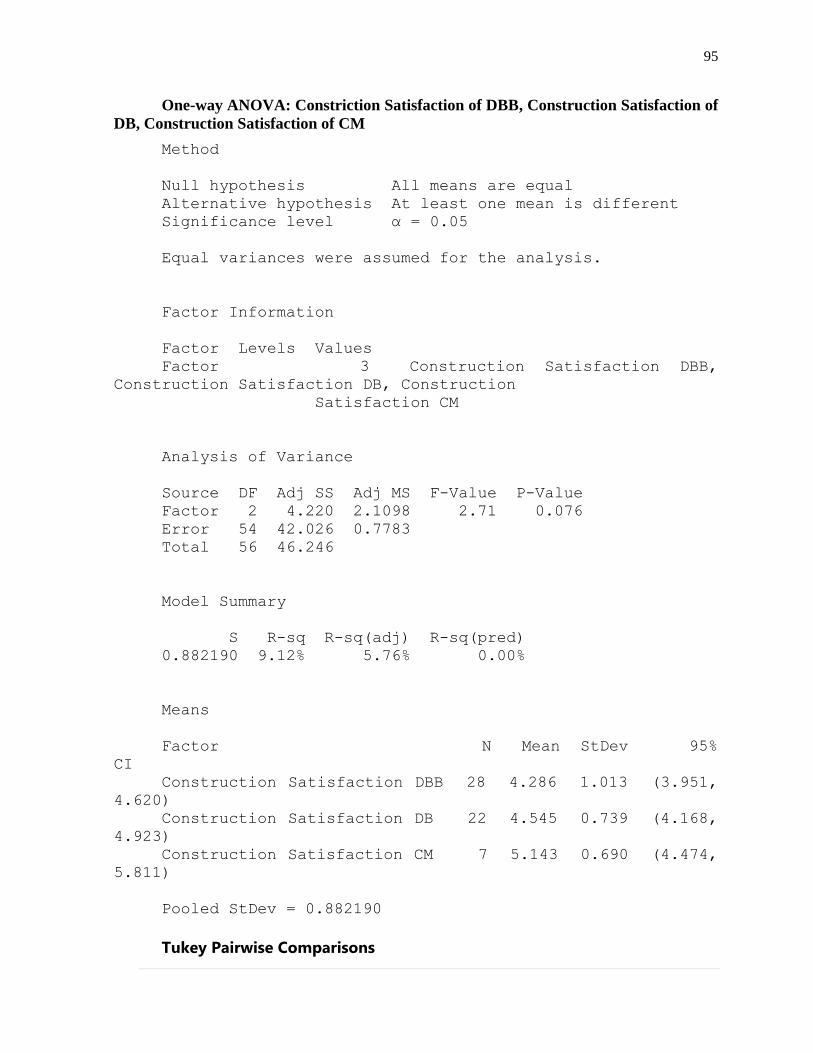
95
One-way ANOVA: Constriction Satisfaction of DBB, Construction Satisfaction of
DB, Construction Satisfaction of CM
Method
Null hypothesis All means are equal
Alternative hypothesis At least one mean is different
Significance level α = 0.05
Equal variances were assumed for the analysis.
Factor Information
Factor Levels Values
Factor 3 Construction Satisfaction DBB,
Construction Satisfaction DB, Construction
Satisfaction CM
Analysis of Variance
Source DF Adj SS Adj MS F-Value P-Value
Factor 2 4.220 2.1098 2.71 0.076
Error 54 42.026 0.7783
Total 56 46.246
Model Summary
S R-sq R-sq(adj) R-sq(pred)
0.882190 9.12% 5.76% 0.00%
Means
Factor N Mean StDev 95%
CI
Construction Satisfaction DBB 28 4.286 1.013 (3.951,
4.620)
Construction Satisfaction DB 22 4.545 0.739 (4.168,
4.923)
Construction Satisfaction CM 7 5.143 0.690 (4.474,
5.811)
Pooled StDev = 0.882190
Tukey Pairwise Comparisons

96
Grouping Information Using the Tukey Method and 95%
Confidence
Factor N Mean Grouping
Construction Satisfaction CM 7 5.143 A
Construction Satisfaction DB 22 4.545 A
Construction Satisfaction DBB 28 4.286 A
Means that do not share a letter are significantly
different.
One-way ANOVA: Cost Growth of DBB, Cost Growth of DB and Cost Growth of
CM
Method
Null hypothesis All means are equal
Alternative hypothesis At least one mean is different
Significance level α = 0.05
Equal variances were assumed for the analysis.
Factor Information
Factor Levels Values
Factor 3 Cost Growth DBB, Cost Growth DB, Cost
Growth CM
Analysis of Variance
Source DF Adj SS Adj MS F-Value P-Value
Factor 2 7.420 3.710 3.18 0.051
Error 45 52.497 1.167
Total 47 59.917
Model Summary
S R-sq R-sq(adj) R-sq(pred)
1.08009 12.38% 8.49% 0.00%
Means
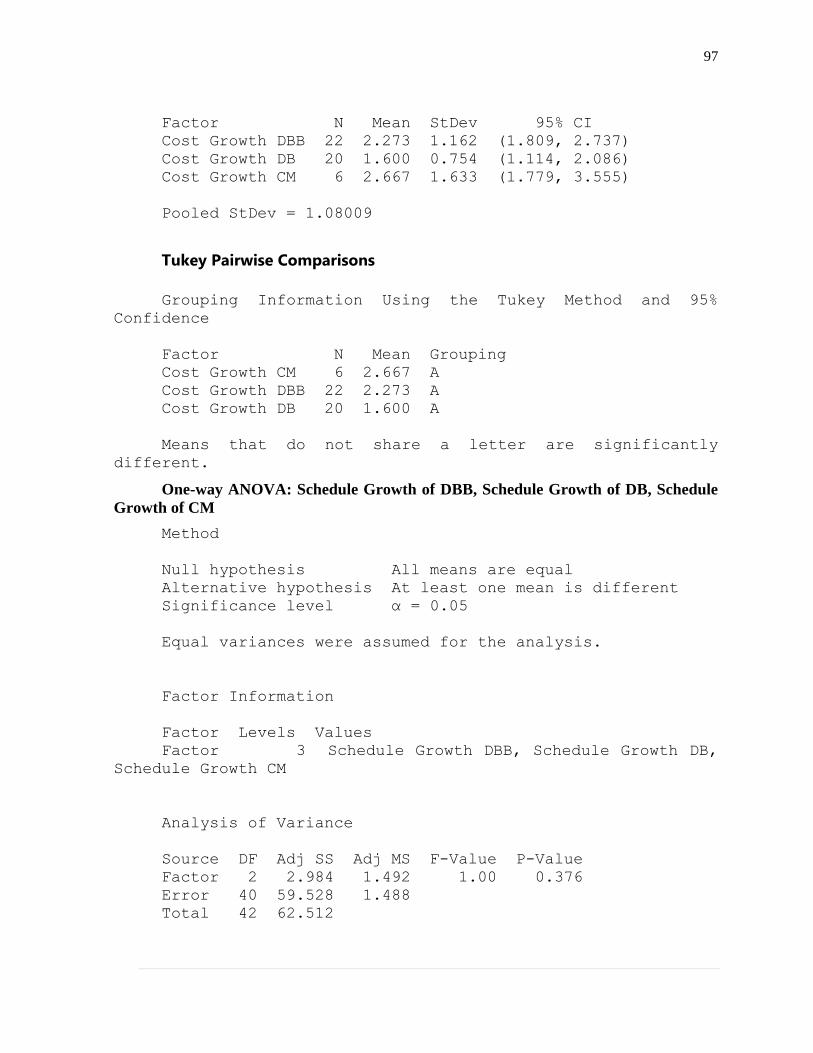
97
Factor N Mean StDev 95% CI
Cost Growth DBB 22 2.273 1.162 (1.809, 2.737)
Cost Growth DB 20 1.600 0.754 (1.114, 2.086)
Cost Growth CM 6 2.667 1.633 (1.779, 3.555)
Pooled StDev = 1.08009
Tukey Pairwise Comparisons
Grouping Information Using the Tukey Method and 95%
Confidence
Factor N Mean Grouping
Cost Growth CM 6 2.667 A
Cost Growth DBB 22 2.273 A
Cost Growth DB 20 1.600 A
Means that do not share a letter are significantly
different.
One-way ANOVA: Schedule Growth of DBB, Schedule Growth of DB, Schedule
Growth of CM
Method
Null hypothesis All means are equal
Alternative hypothesis At least one mean is different
Significance level α = 0.05
Equal variances were assumed for the analysis.
Factor Information
Factor Levels Values
Factor 3 Schedule Growth DBB, Schedule Growth DB,
Schedule Growth CM
Analysis of Variance
Source DF Adj SS Adj MS F-Value P-Value
Factor 2 2.984 1.492 1.00 0.376
Error 40 59.528 1.488
Total 42 62.512

98
Model Summary
S R-sq R-sq(adj) R-sq(pred)
1.21992 4.77% 0.01% 0.00%
Means
Factor N Mean StDev 95% CI
Schedule Growth DBB 20 2.450 1.276 (1.899, 3.001)
Schedule Growth DB 18 1.889 0.963 (1.308, 2.470)
Schedule Growth CM 5 2.200 1.789 (1.097, 3.303)
Pooled StDev = 1.21992
Tukey Pairwise Comparisons
Grouping Information Using the Tukey Method and 95%
Confidence
Factor N Mean Grouping
Schedule Growth DBB 20 2.450 A
Schedule Growth CM 5 2.200 A
Schedule Growth DB 18 1.889 A
Means that do not share a letter are significantly
different.
Two-sample T for Cost Claim Severity DBB vs Cost Claim severity DB
N Mean StDev SE Mean
Cost Claim Severity DBB 28 2.61 1.77 0.33
Cost Claim severity DB 22 2.32 1.17 0.25
Difference = μ (Cost Claim Severity DBB) - μ (Cost Claim
severity DB)
Estimate for difference: 0.289
95% CI for difference: (-0.551, 1.129)
T-Test of difference = 0 (vs ≠): T-Value = 0.69 P-Value =
0.492 DF = 46
Two-sample T for Time Claim Severity DBB vs Time Claim Severity DB
N Mean StDev SE Mean
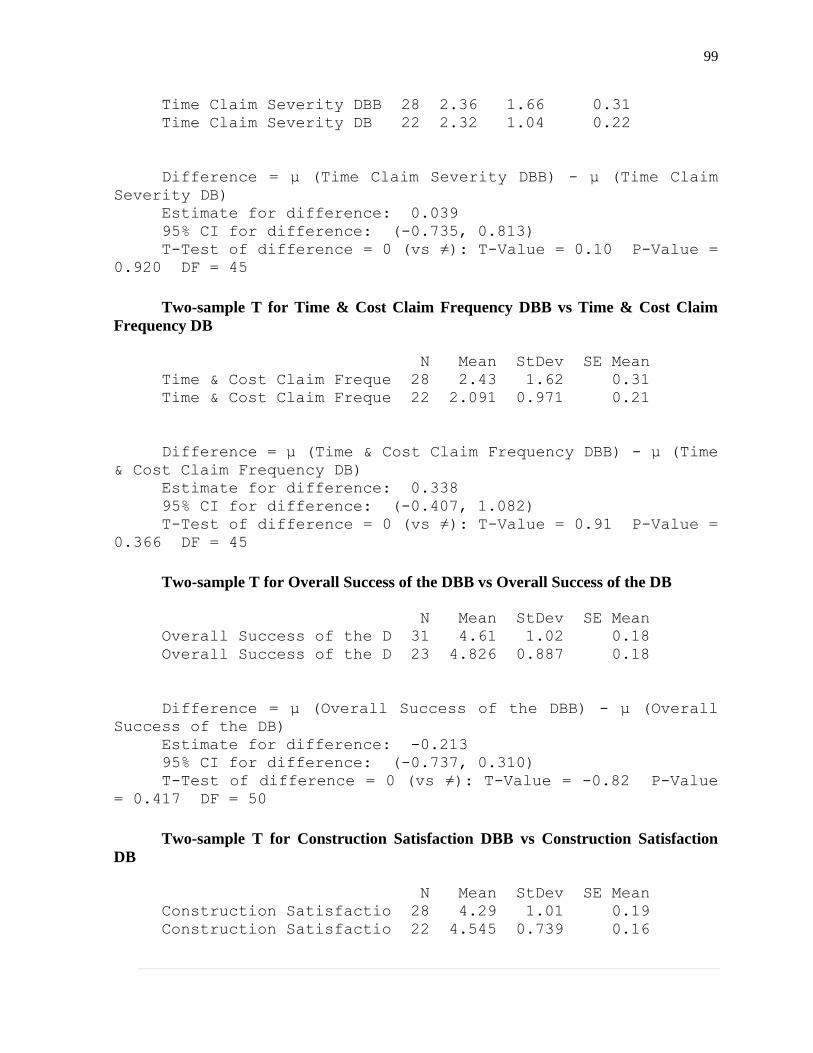
99
Time Claim Severity DBB 28 2.36 1.66 0.31
Time Claim Severity DB 22 2.32 1.04 0.22
Difference = μ (Time Claim Severity DBB) - μ (Time Claim
Severity DB)
Estimate for difference: 0.039
95% CI for difference: (-0.735, 0.813)
T-Test of difference = 0 (vs ≠): T-Value = 0.10 P-Value =
0.920 DF = 45
Two-sample T for Time & Cost Claim Frequency DBB vs Time & Cost Claim
Frequency DB
N Mean StDev SE Mean
Time & Cost Claim Freque 28 2.43 1.62 0.31
Time & Cost Claim Freque 22 2.091 0.971 0.21
Difference = μ (Time & Cost Claim Frequency DBB) - μ (Time
& Cost Claim Frequency DB)
Estimate for difference: 0.338
95% CI for difference: (-0.407, 1.082)
T-Test of difference = 0 (vs ≠): T-Value = 0.91 P-Value =
0.366 DF = 45
Two-sample T for Overall Success of the DBB vs Overall Success of the DB
N Mean StDev SE Mean
Overall Success of the D 31 4.61 1.02 0.18
Overall Success of the D 23 4.826 0.887 0.18
Difference = μ (Overall Success of the DBB) - μ (Overall
Success of the DB)
Estimate for difference: -0.213
95% CI for difference: (-0.737, 0.310)
T-Test of difference = 0 (vs ≠): T-Value = -0.82 P-Value
= 0.417 DF = 50
Two-sample T for Construction Satisfaction DBB vs Construction Satisfaction
DB
N Mean StDev SE Mean
Construction Satisfactio 28 4.29 1.01 0.19
Construction Satisfactio 22 4.545 0.739 0.16
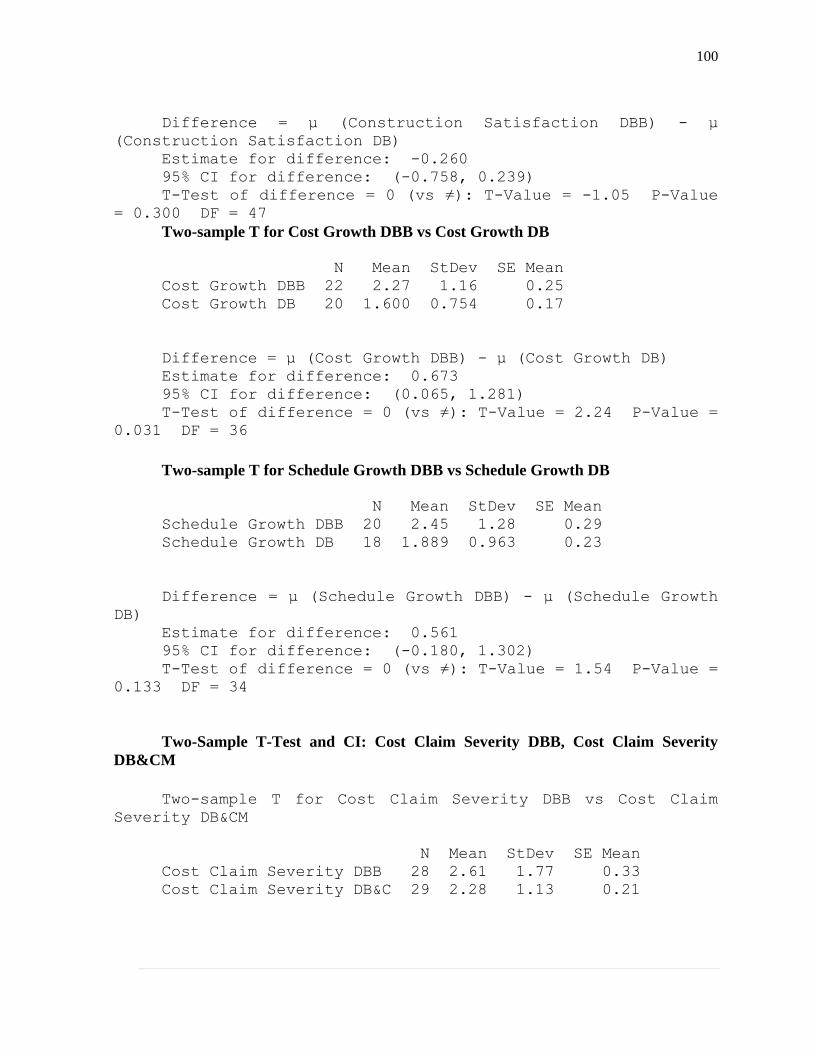
100
Difference = μ (Construction Satisfaction DBB) - μ
(Construction Satisfaction DB)
Estimate for difference: -0.260
95% CI for difference: (-0.758, 0.239)
T-Test of difference = 0 (vs ≠): T-Value = -1.05 P-Value
= 0.300 DF = 47
Two-sample T for Cost Growth DBB vs Cost Growth DB
N Mean StDev SE Mean
Cost Growth DBB 22 2.27 1.16 0.25
Cost Growth DB 20 1.600 0.754 0.17
Difference = μ (Cost Growth DBB) - μ (Cost Growth DB)
Estimate for difference: 0.673
95% CI for difference: (0.065, 1.281)
T-Test of difference = 0 (vs ≠): T-Value = 2.24 P-Value =
0.031 DF = 36
Two-sample T for Schedule Growth DBB vs Schedule Growth DB
N Mean StDev SE Mean
Schedule Growth DBB 20 2.45 1.28 0.29
Schedule Growth DB 18 1.889 0.963 0.23
Difference = μ (Schedule Growth DBB) - μ (Schedule Growth
DB)
Estimate for difference: 0.561
95% CI for difference: (-0.180, 1.302)
T-Test of difference = 0 (vs ≠): T-Value = 1.54 P-Value =
0.133 DF = 34
Two-Sample T-Test and CI: Cost Claim Severity DBB, Cost Claim Severity
DB&CM
Two-sample T for Cost Claim Severity DBB vs Cost Claim
Severity DB&CM
N Mean StDev SE Mean
Cost Claim Severity DBB 28 2.61 1.77 0.33
Cost Claim Severity DB&C 29 2.28 1.13 0.21
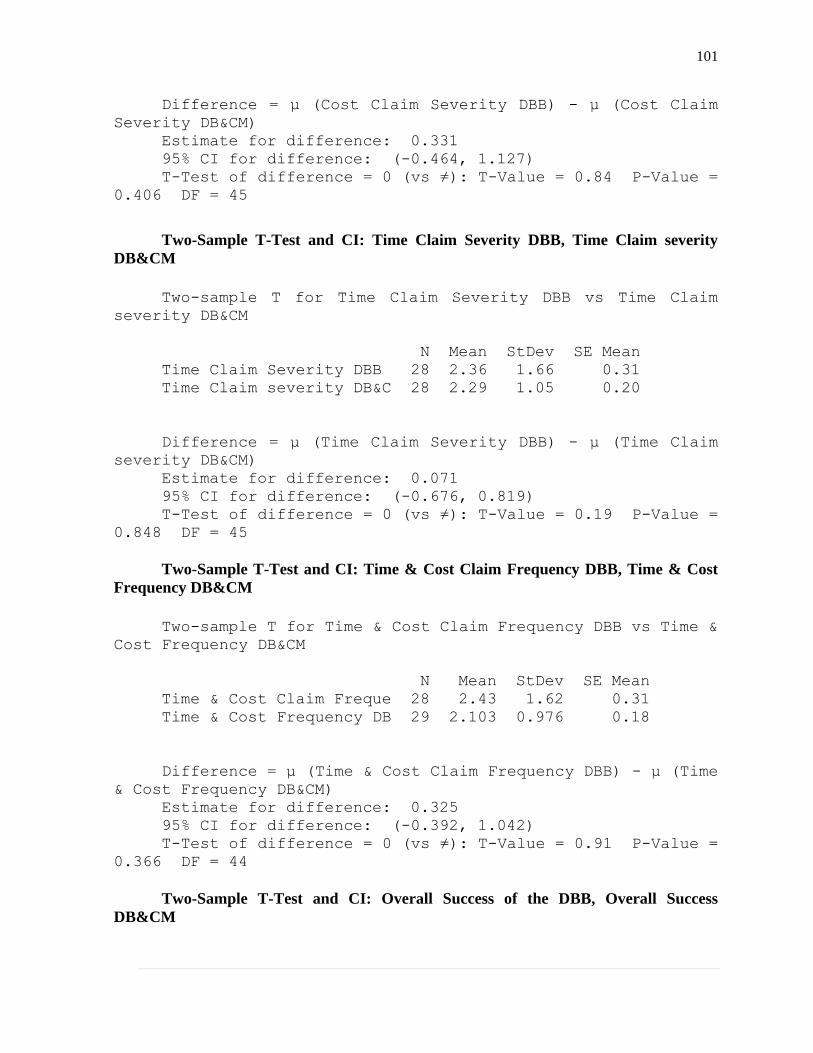
101
Difference = μ (Cost Claim Severity DBB) - μ (Cost Claim
Severity DB&CM)
Estimate for difference: 0.331
95% CI for difference: (-0.464, 1.127)
T-Test of difference = 0 (vs ≠): T-Value = 0.84 P-Value =
0.406 DF = 45
Two-Sample T-Test and CI: Time Claim Severity DBB, Time Claim severity
DB&CM
Two-sample T for Time Claim Severity DBB vs Time Claim
severity DB&CM
N Mean StDev SE Mean
Time Claim Severity DBB 28 2.36 1.66 0.31
Time Claim severity DB&C 28 2.29 1.05 0.20
Difference = μ (Time Claim Severity DBB) - μ (Time Claim
severity DB&CM)
Estimate for difference: 0.071
95% CI for difference: (-0.676, 0.819)
T-Test of difference = 0 (vs ≠): T-Value = 0.19 P-Value =
0.848 DF = 45
Two-Sample T-Test and CI: Time & Cost Claim Frequency DBB, Time & Cost
Frequency DB&CM
Two-sample T for Time & Cost Claim Frequency DBB vs Time &
Cost Frequency DB&CM
N Mean StDev SE Mean
Time & Cost Claim Freque 28 2.43 1.62 0.31
Time & Cost Frequency DB 29 2.103 0.976 0.18
Difference = μ (Time & Cost Claim Frequency DBB) - μ (Time
& Cost Frequency DB&CM)
Estimate for difference: 0.325
95% CI for difference: (-0.392, 1.042)
T-Test of difference = 0 (vs ≠): T-Value = 0.91 P-Value =
0.366 DF = 44
Two-Sample T-Test and CI: Overall Success of the DBB, Overall Success
DB&CM
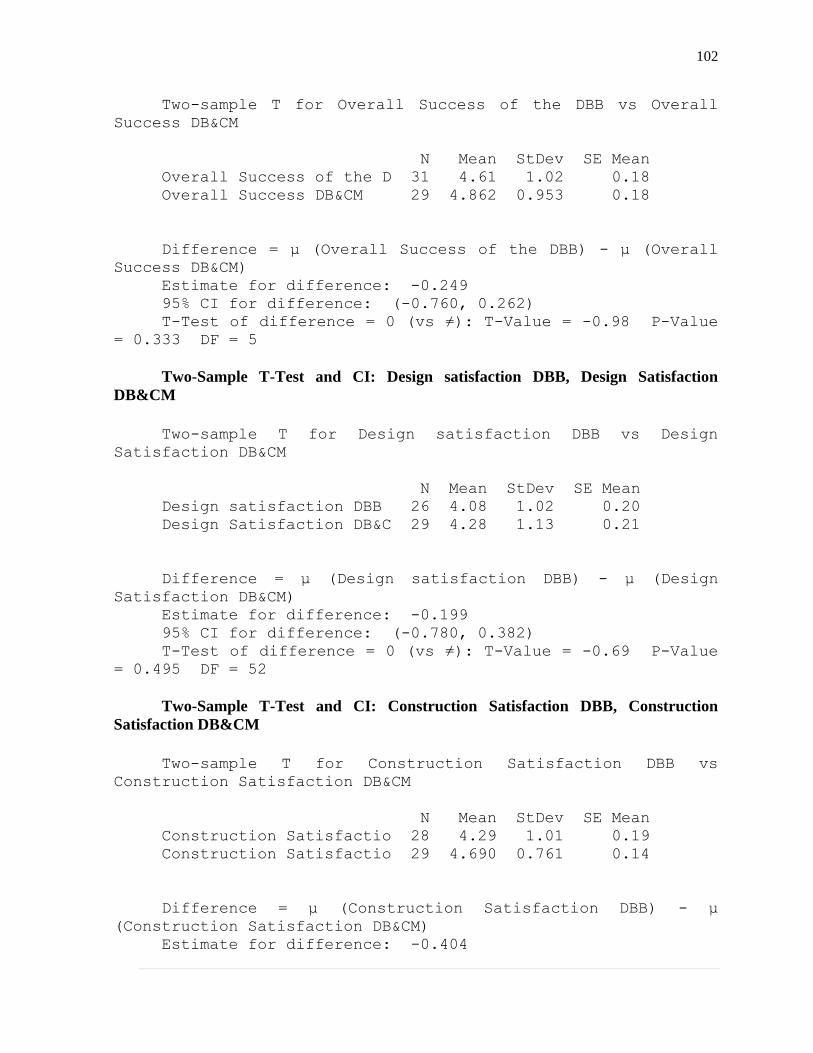
102
Two-sample T for Overall Success of the DBB vs Overall
Success DB&CM
N Mean StDev SE Mean
Overall Success of the D 31 4.61 1.02 0.18
Overall Success DB&CM 29 4.862 0.953 0.18
Difference = μ (Overall Success of the DBB) - μ (Overall
Success DB&CM)
Estimate for difference: -0.249
95% CI for difference: (-0.760, 0.262)
T-Test of difference = 0 (vs ≠): T-Value = -0.98 P-Value
= 0.333 DF = 5
Two-Sample T-Test and CI: Design satisfaction DBB, Design Satisfaction
DB&CM
Two-sample T for Design satisfaction DBB vs Design
Satisfaction DB&CM
N Mean StDev SE Mean
Design satisfaction DBB 26 4.08 1.02 0.20
Design Satisfaction DB&C 29 4.28 1.13 0.21
Difference = μ (Design satisfaction DBB) - μ (Design
Satisfaction DB&CM)
Estimate for difference: -0.199
95% CI for difference: (-0.780, 0.382)
T-Test of difference = 0 (vs ≠): T-Value = -0.69 P-Value
= 0.495 DF = 52
Two-Sample T-Test and CI: Construction Satisfaction DBB, Construction
Satisfaction DB&CM
Two-sample T for Construction Satisfaction DBB vs
Construction Satisfaction DB&CM
N Mean StDev SE Mean
Construction Satisfactio 28 4.29 1.01 0.19
Construction Satisfactio 29 4.690 0.761 0.14
Difference = μ (Construction Satisfaction DBB) - μ
(Construction Satisfaction DB&CM)
Estimate for difference: -0.404

103
95% CI for difference: (-0.882, 0.074)
T-Test of difference = 0 (vs ≠): T-Value = -1.70 P-Value
= 0.096 DF = 50
Two-Sample T-Test and CI: Cost Growth DBB, Cost Growth DB&CM
Two-sample T for Cost Growth DBB vs Cost Growth DB&CM
N Mean StDev SE Mean
Cost Growth DBB 22 2.27 1.16 0.25
Cost Growth DB&CM 26 1.85 1.08 0.21
Difference = μ (Cost Growth DBB) - μ (Cost Growth DB&CM)
Estimate for difference: 0.427
95% CI for difference: (-0.232, 1.085)
T-Test of difference = 0 (vs ≠): T-Value = 1.31 P-Value =
0.198 DF = 43
Two-Sample T-Test and CI: Schedule Growth DBB, Schedule Growth DB&CM
Two-sample T for Schedule Growth DBB vs Schedule Growth
DB&CM
N Mean StDev SE Mean
Schedule Growth DBB 20 2.45 1.28 0.29
Schedule Growth DB&CM 23 1.96 1.15 0.24
Difference = μ (Schedule Growth DBB) - μ (Schedule Growth
DB&CM)
Estimate for difference: 0.493
95% CI for difference: (-0.260, 1.247)
T-Test of difference = 0 (vs ≠): T-Value = 1.33 P-Value =
0.193 DF = 38